subsurface geometry and evolution of the seattle fault ... of high-resolution magnetic data (blakely...
TRANSCRIPT
1737
Bulletin of the Seismological Society of America, Vol. 92, No. 5, pp. 1737–1753, June 2002
Subsurface Geometry and Evolution of the Seattle Fault Zone
and the Seattle Basin, Washington
by U. S. ten Brink, P. C. Molzer, M. A. Fisher, R. J. Blakely, R. C. Bucknam, T. Parsons,R. S. Crosson, and K. C. Creager
Abstract The Seattle fault, a large, seismically active, east–west-striking faultzone under Seattle, is the best-studied fault within the tectonically active Puget Low-land in western Washington, yet its subsurface geometry and evolution are not wellconstrained. We combine several analysis and modeling approaches to study the faultgeometry and evolution, including depth-converted, deep-seismic-reflection images,P-wave-velocity field, gravity data, elastic modeling of shoreline uplift from a lateHolocene earthquake, and kinematic fault restoration. We propose that the Seattlethrust or reverse fault is accompanied by a shallow, antithetic reverse fault thatemerges south of the main fault. The wedge enclosed by the two faults is subject toan enhanced uplift, as indicated by the boxcar shape of the shoreline uplift from thelast major earthquake on the fault zone. The Seattle Basin is interpreted as a flexuralbasin at the footwall of the Seattle fault zone. Basin stratigraphy and the regionaltectonic history lead us to suggest that the Seattle fault zone initiated as a reversefault during the middle Miocene, concurrently with changes in the regional stressfield, to absorb some of the north–south shortening of the Cascadia forearc. KingstonArch, 30 km north of the Seattle fault zone, is interpreted as a more recent disruptionarising within the basin, probably due to the development of a blind reverse fault.
Introduction
The Mw 6.9 1995 Kobe, Japan, earthquake and the re-sulting devastation have focused attention on the seismichazard from crustal faults in forearc regions of subductionzones. In the United States, there has been a growing reali-zation of seismic hazard from crustal faults in the PugetLowland, a densely populated, forearc region of the Casca-dia subduction zone in western Washington State. However,the extent of crustal deformation and seismic hazard in thePuget Lowland are not well understood, partly because theunderlying tectonic forces are not fully understood andpartly because of the extensive cover of glacial deposits andforests.
Many workers believe that the Seattle fault zone, aneast–west-oriented reverse fault passing under Seattle (Fig.1b), is one of the faults accommodating the north–southshortening of the Cascadia forearc. Geologic and paleomag-netic data indicate clockwise rotation of the Cascadia forearcsince the middle Miocene (Wells et al., 1998), and geodeticdata indicate a northward migration of the forearc at a rateof several millimeters per year, relative to stable NorthAmerica (Khazaradze et al., 1999). The forearc motion hasbeen linked to the northward translation of the Sierra Nevadablock in California as a result of Basin-and-Range extensionand Pacific–North America dextral shear (Pezzopane and
Weldon, 1993; Walcott, 1993; Fig. 1a). The northward mi-gration of the Cascadia forearc is probably accommodatedby crustal shortening against the backstop of the CanadianCoast Ranges and, according to some, by the uplift of theOlympic Mountains (Walcott, 1993; Wells et al., 1998).
The shortening in the Puget Lowland is expressed asupper crustal deformation into a series of 30–50-km-widestructural highs and basins, of which the Seattle Basin is thedeepest (Johnson et al., 1996; Pratt et al., 1997; Brocher etal., 2001). Pratt et al. (1997) proposed the existence of adetachment surface at 14–20-km depth under the PugetLowland along which the shortening is accommodated. TheSeattle Basin and Kingston Arch were interpreted to be theshallow manifestations of a ramp in this detachment, andthe Seattle fault zone was interpreted as a fault branchingfrom the detachment (Pratt et al., 1997). Brocher et al.(2001) suggested that shortening takes place along steeplydipping reverse faults with opposing dips that bound thesehighs and lows. The faults penetrate to depths of 25–30 km,are not interconnected, and are perhaps reactivated normalfaults (Brocher et al., 2001).
Seismic activity under the Puget Lowland can also beattributed to the north–south shortening of the forearc. It isperhaps concentrated within the Puget Lowland because

1738 U. S. ten Brink, P. C. Molzer, M. A. Fisher, R. J. Blakely, R. C. Bucknam, T. Parsons, R. S. Crosson, and K. C. Creager
...........
. . . . . . . . . . . . . . . . . . ...................................................
50 km
Cas
cade
R
ange
126° 124° 122°
48°
46°
Cascadia Subduction Z
one
OlympicMnts
VancouverIsland
Seattle
Seismicprofile
(a)
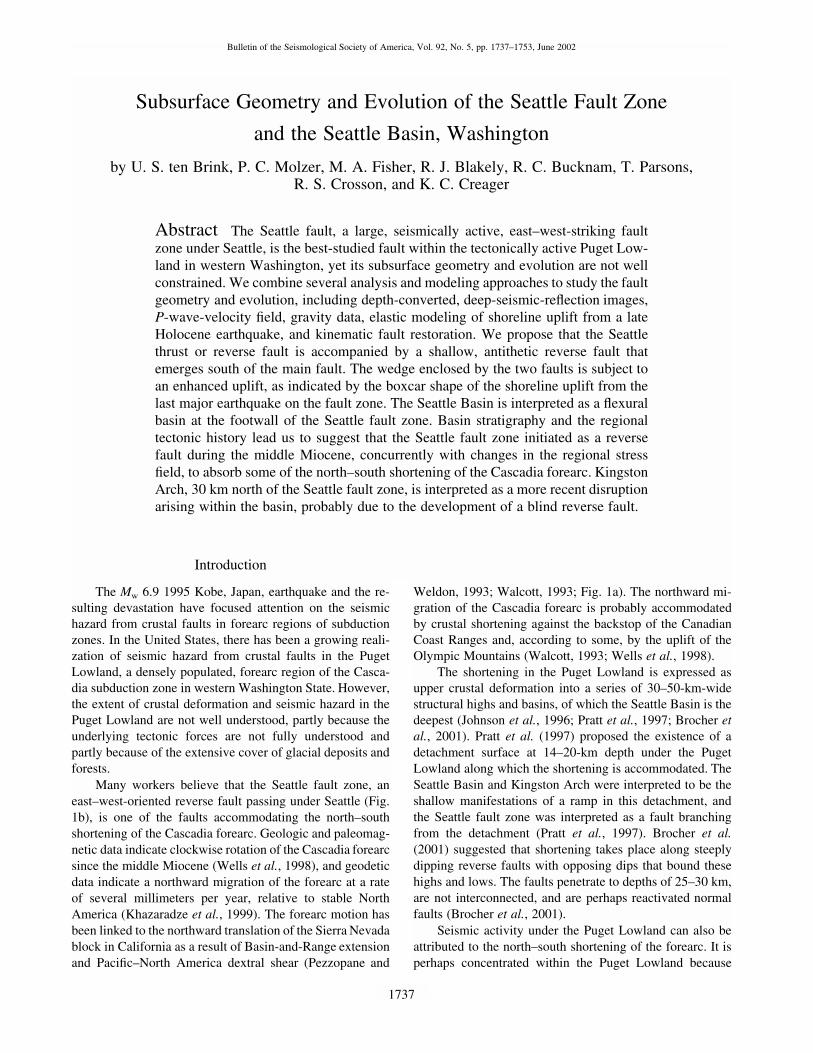
Figure 1. (a) Location map of the Seattle fault zone in the fore-arc of the Cascadia subduction zone. (rectangle) Location of de-tailed map. Dotted and dashed lines, limits of Crescent Formationrocks near the surface and at depth, respectively (after Parsons etal., 1999). Shading denotes various rock outcrops: gray, CrescentFormation and related basalts; dotted, Cascade volcanic-arc rocks;left diagonal, pre-Tertiary rocks; right diagonal, melange and otheraccretionary complex rocks. Arrow, Juan de Fuca Plate motionrelative to stable North America. Half arrows, rotation direction ofthe forearc (after Wells et al., 1998). (b) Detailed location map ofthe seismic-reflection profile (dashed line), the OBSs, and land seis-mometers and their projected location on the 2-D velocity model(thin, straight line). Only the segment marked by a heavy greenline is shown in Figure 2. Shots used in the wide-angle seismicdata were located at 50-m intervals along the dashed line betweenpoints S and S�. Location of Seattle fault zone is based on inter-pretation of high-resolution magnetic data (Blakely et al., 2001).A, Socal Alderwood well; MK, Mobil Kingston well; SS, SocalSchroeder well; SW, Socal Whidbey well; Ind., Indianola; W.B.,Winslow Bay; B.I., Blake Island; D.P., Dolphin Point.
A1011
A1012
A1013
A1014
A1015
A1016
A1017
A4
UW46
UW50UW51
UW56UW58
UW59
SSMKA
SW
Seattle
Restoration Pt.
SEATTLEFAULTZONE
WhidbeyIsland48 00'
47 30'
47 00'
122 30'o
o
o
o
Alki Pt.
X
Y
Borehole
Seismometer location
Seismometer location projected onto line
C9
A1
D1
A8
C1
{
10 km
West Pt.
W.B.
Ind.
Location of shoreline uplift
(b)
B.WD.P.
S
S'
basement there is made of the rigid, mafic Siletz terrane,which undergoes brittle deformation, whereas the forearc tothe west (the Olympic Peninsula) is made of the more duc-tile, accretionary complex, which deforms aseismically(Crosson et al., 1999). An alternative seismotectonic frame-
work for the forearc in western Washington suggests, how-ever, that the uplift of the Olympic Mountains is due to theunderlying upwarp in the subducted Juan de Fuca Plate, cou-pled with an unusually high flux of accreted sediments intothe trench at this location (Brandon et al., 1998). The semi-
Subsurface Geometry and Evolution of the Seattle Fault Zone and the Seattle Basin, Washington 1739
circular arrangement of basins in the Puget Lowland aroundthe eastern Olympic Mountains and their tilt away from themountains may point to a genetic relationship between thebasins and mountain uplift (Crosson and Symons, 2001).
A wealth of new information about the subsurface ge-ology of the Puget Lowland helps define the deformationand seismic hazard of this region. The information includesreleased proprietary data (Johnson et al., 1994; Pratt et al.,1997; Brocher and Reubel, 1998; Johnson et al., 1999; Rauand Johnson, 1999) and new data, much of it collected dur-ing the various phases of the Seismic Hazards Investigationof Puget Sound (SHIPS) experiment (Brocher et al., 2001,and references therein). Despite these efforts, considerableuncertainty remains about the geometry and evolution of thefaults cutting the Puget Lowland. Microseismicity is sparseand, to date, does not reveal planar faults [Brocher et al.,2001; van Wagoner et al., 2002]. The spatial resolution of3D seismic tomographic studies (Brocher et al., 2001; vanWagoner et al., submitted) is insufficient to define the sub-surface geometry of faults. Existing seismic-reflection datatypically penetrate only to shallow depths (Johnson et al.,1999), and deeper reflection lines lack velocity control(Johnson et al., 1994; Pratt et al., 1997). For these reasons,even the subsurface geometry of the Seattle fault zone, thebest-studied crustal fault in the Puget Lowland, is still de-bated.
The 4–7-km-wide and 60–65-km-long Seattle fault zoneis outlined across the Puget Lowland by a set of magneticanomalies over the hanging wall of the fault (Blakely et al.,2001), by a steep gravity slope (Finn, 1990; Pratt et al.,1997), and by lateral velocity contrast (Brocher et al., 2001;van Wagoner et al., submitted). The fault zone separates thethick, sedimentary sequence of the Seattle Basin to the northfrom the thin, sedimentary cover and shallow basementrocks south of the fault, indicating a long history of faultactivity. Paleoseismic evidence indicates Holocene displace-ment on the fault, including an estimated magnitude 7 earth-quake at 900–930 A.D. (Yount and Gower, 1991; Atwaterand Moore, 1992; Bucknam et al., 1992).
Various dips were proposed for the Seattle fault zone.Johnson et al. (1994, 1999) proposed a mean dip of 45�–60�for the top 6 km of the fault and 45�–65� for the top 1 kmbased on industry and high-resolution seismic-reflectiondata, respectively. Calvert and Fisher (2001) proposed a dipof 60� for the top 1 km of the fault based on P-wave veloc-ities from seismic-reflection data. Using different industrydata, Pratt et al. (1997) proposed a dip of 45� for the top 6km, shallowing to 20�–25� at depths of 6–16 km. Both John-son et al. (1994, 1999) and Calvert and Fisher identified foursubparallel, south-dipping fault strands in the Seattle faultzone. Although the northernmost strand is presumed themost active since the Quaternary, other strands are still ac-tive, with either reverse or normal slip (Johnson et al., 1994).Brocher et al. (2001) favored an unspecified steep dip (�65�in their figures) extending to a depth of 28 km. Projectedepicenters from the earthquake catalog delineate a diffuse
zone of seismicity with an even higher dip, 70�–80�, extend-ing from the surface location of the Seattle fault zone to adepth of 25 km (Fig 2b; van Wagoner et al., submitted).Based on focal mechanisms of small earthquakes along theSeattle fault zone, van Wagoner et al. (submitted) proposedthat the Seattle fault zone is south-dipping with a subverticaldip and that the fault has recently been reactivated as a nor-mal fault (i.e., north side up).
It is apparent from the preceding discussion that opin-ions diverge regarding the Seattle fault geometry, the styleof upper crustal deformation, and the driving force for mo-tion on the fault, and these impact the ability to assess theseismic hazard of the Seattle fault. Here we present resultsfrom a combination of independent observations and mod-eling methods, some of which have not been previously ap-plied to the study of the Seattle fault. We model seismic-refraction data collected during the 1998 offshore–onshoreSHIPS experiment for a detailed P-wave-velocity structure.We interpret the velocity contours to delineate the fault zoneand the depth of the Seattle Basin and the velocity field toconvert coincident deep-penetrating reflection data to depthand to model a coincident gravity profile. Using an elasticdislocation model, we explore the permissible range of faultgeometries that could generate the observed shoreline upliftfrom a large earthquake �1,100 years ago. Kinematic faultmodels that produce the observed structure and honor thesurface geology are then used to explain the fault-zone evo-lution in relation to the north–south shortening of the PugetLowland. The stratal geometry of the basin is used to arguefor a younger age for fault initiation than previously sug-gested. It is important to note that we are presenting a 2Dcross section along the Puget Sound for structures that varyin their relief along strike (e.g., Blakely et al., 2001; Brocheret al., 2001).
Tectonic Framework and Geologic Background
The Puget Lowland is located in the interior part of theforearc region of the Cascadia subduction zone (Fig. 1a)between the Cascade volcanic arc and older Mesozoic ter-ranes to the east and the north and the uplifted and exhumedaccretionary complex of the Olympic Mountains to the west.The Puget Lowland is underlain to a depth of 25–30 km bythe Siletz terrane (Symons and Crosson, 1997), basalts andintrusive rocks with island-arc composition that were ac-creted to North America 50–62 m.y. ago (Duncan, 1982).The Siletz terrane increases in width and thickness in south-ern Washington and in Oregon (Trehu et al., 1994; Parsonset al., 1999). Tilted exposures of the Siletz terrane wraparound the Olympic accretionary complex (Brandon et al.,1998) and appear to be underthrust by the accretionary com-plex (Symons and Crosson, 1997).
Basement rocks under the Seattle Basin were drilled atMobil Kingston well (see Fig. 1b for location) at a depthinterval of 2,195–2,637 m (Fig. 2b; Rau and Johnson, 1999)and consist of basalt interbedded with siltstone, tuff, and
1740
Figu
re2.
(Cap
tion
onfa
cing
page
.)
Subsurface Geometry and Evolution of the Seattle Fault Zone and the Seattle Basin, Washington 1741
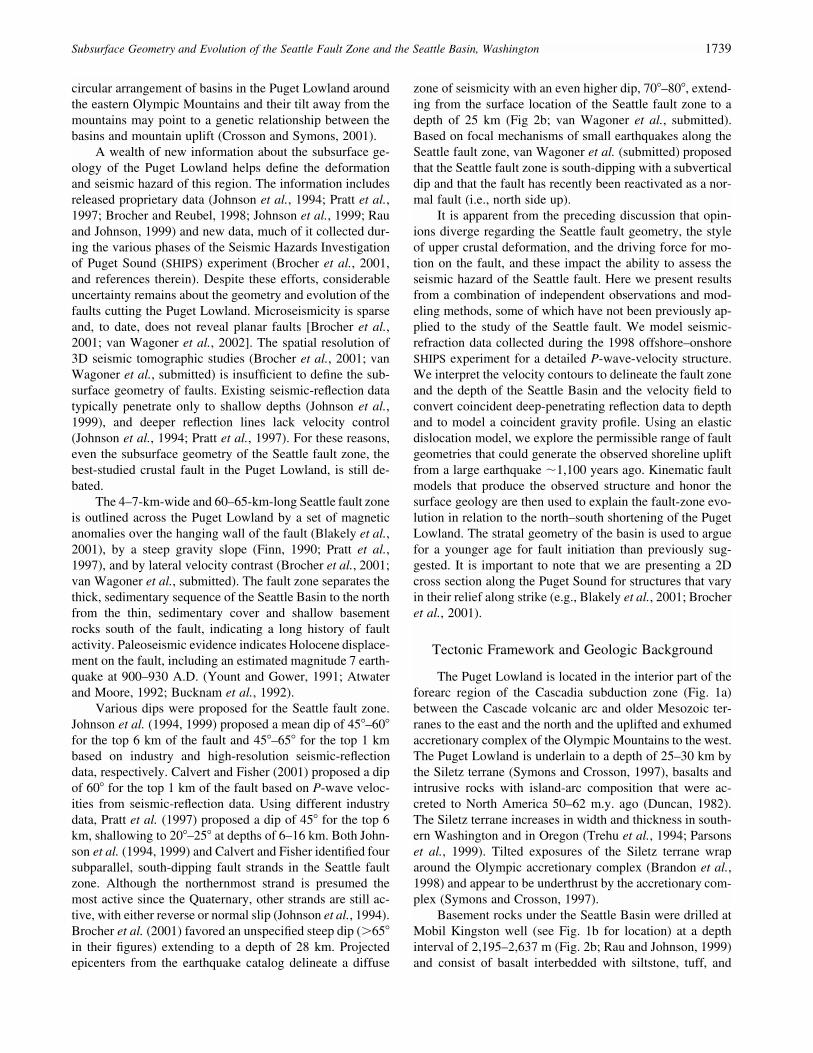
Figure 2. (a) A section of seismic-reflection line(black and white) and coincident P-wave-velocitymodel (color) along Puget Sound. See Figure 1b forlocation. (b) Line-drawing interpretation of the seis-mic reflections (thin, red lines) and isovelocity con-tours at 0.5-km/sec intervals (thin, black lines) of thesection shown in (a). Also shown are projected loca-tions of earthquakes within 0.1� of the velocity model(red circles), chronostratigraphic boundaries (heavy,green lines), and interpreted faults (dashed red lines)from seismic-reflection (marked rfl) and from seismicrefraction (marked rfr) data. Simplified stratigraphyof Mobil Kingston well (Rau and Johnson, 1999) isprojected onto the seismic reflection profile to aidwith stratigraphic interpretation. Formation abbrevi-ations are Cr, Crescent; Eo, Eocene undifferentiatedsediments; Tb, Blakeley; and Tbh, Blakely Harbor.Movement along fault strands marked A and B is dis-cussed in Figure 6. Location of points x and y ismarked in Figure 1b. (c) Enlargement of the seismic-reflection profile with interpretation. Location of en-largement marked by a frame in (a).
conglomerate. In a second drill hole (Socal–Whidbey), maficrocks were found to interfinger with sandstone (Rau andJohnson, 1999). The mafic rocks form part of the Siletz ter-rane, known locally as the Crescent Formation.
Based on ties to the Mobil Kingston well, the lowermost1–1.5 km of sediments in the Seattle Basin are probablyEocene marine strata deposited in upper to middle bathyaldepths (Johnson et al., 1994). However, adjacent wells showlarge variations in depositional environment and thickness(Rau and Johnson, 1999), owing either to the location of theregion close to a narrow continental shelf in the forearc orto tectonic movements. The Eocene interval is overlain byturbidites of the Upper Eocene–Oligocene Blakeley For-mation, which were deposited at bathyal depths (Johnson etal., 1999). The Blakeley Formation is exposed and tilted atnear-vertical dips along the Seattle fault, where it attains athickness of 2,130 m (Fulmer, 1975). Only a 500-m-thicksection belonging to the lower member of the Blakeley For-mation is encountered at the Mobil Kingston well on theKingston Arch, and stratal geometry indicates that the upperpart of the formation was eroded prior to Quaternary depo-sition (Johnson et al., 1994). The nonmarine Miocene Blake-ley Harbor Formation, perhaps 1,040 m thick in total, over-lies the Blakeley Formation rocks in southeastern BainbridgeIsland (Fulmer, 1975). It is missing from nearby deep wells(Rau & Johnson, 1999). Quaternary sediments, mostly gla-cial, cover most of the lowland.
Seismic Data
We analyze a subset of the data from the 1998 SHIPSexperiment collected along the Puget Sound (Fig. 1). Thesedata include a 90-km-long seismic-reflection profile shot at50-m intervals by the R/V Thompson using a 79.3-liter
(4838 cu. in.) air-gun array and recorded by a 2.4-km-long,96-channel digital seismic streamer. The reflection profilewas processed routinely and migrated after stack using Kirch-hof migration. The same shots were also recorded by sixU.S. Geological Survey ocean-bottom seismometers (OBSs)and 13 land seismometers (Fig. 3), producing a coincident145-km-long, wide-angle seismic-reflection–refraction pro-file (Fig. 1b). We selected those shots located between pointsS and S� in Figure 1b and projected them onto the central70-km-long segment of the profile. The quality of the re-cords is generally high, as seen in Figure 3. There was asignificant reduction in the energy transmitted across theSeattle fault zone in some of the stations (UW50, C1, C9,A1017, and A1011), which we attribute to diffractions fromthe fault zone. First arrivals from all shots fired betweenpoints S and S� were identified in all but eight stations (Fig.4). A significant (1.5-sec) offset in the first arrival is ob-served across the Seattle fault zone (Fig. 3) and is attributedto the contrast between sedimentary rocks north of the faultzone and the mafic rocks south of the fault zone.
The velocity model was derived as follows. The startingvelocity model, 90 km long and 25 km thick, was derivedfrom forward raytracing of arrivals for the 6 OBSs usingZelt’s raytracing code (Zelt and Smith, 1992) with theRayGUI interactive interface (Loss et al., 1998). The resul-tant model was gridded at 100 m, smoothed using three it-erations of a 2D median filter with a 20 � 20 cell window,and extrapolated north and south to a new velocity model,145 km long. The new velocity grid consisting of 1,450 �252 grid cells, was used as the input velocity model for afirst-arrival tomographic inversion from all six OBSs and 13land seismographs. The tomography used a graph methodfor forward modeling and a conjugate-gradient approach formodel update (Zhang and Toksoz, 1998). The model rough-ness as part of the objective function was allowed to increaseduring subsequent iterations.
The wide-angle data were modeled to produce a P-wave-velocity structure that fits the travel times of all data,with a root-mean-square misfit of 120 msec (Fig. 4). Themisfit applies to the entire 145-km-long model, half of whichis located onshore, where we have neither ray reciprocitynor constraints from seismic-reflection data. Therefore, wefocus our discussion and presentation (Figs. 2, 5, and 6) onthe coincident seismic-reflection and refraction portion ofthe model, which is well constrained by dense, reciprocatingray coverage and by the reflection image. Though not for-mally calculated, the misfit in this part of the model is lower.The absence of a recording station directly above the faultzone affects only the reciprocity of rays traveling throughthe shallowest 1–2 km of the fault zone, whereas the deeperparts of the fault zone are well covered by stations D1 andA8 and by more distal stations.
The velocity structure was used to convert the reflectionprofile from time to depth. The velocity structure, plotted incolor, was superposed on the depth-converted multichannelseismic reflection (MCS) profile, plotted in black and white

1742 U. S. ten Brink, P. C. Molzer, M. A. Fisher, R. J. Blakely, R. C. Bucknam, T. Parsons, R. S. Crosson, and K. C. Creager
Figure 3. Common-receiver gathers for se-lected OBSs and land seismometers. Seismicsources are airgun shots at 50-m spacing lo-cated along the seismic-reflection profile be-tween points S and S� (see Fig. 1b for location).Data are plotted with a reduced travel time,Tr � T � X/V, where T is the original traveltime, X is shot–receiver offset in km, and, V,the velocity, � 6 km/sec. See Figure 1 for lo-cation of OBSs and of point Y. Time delay inthe first arrival in the vicinity of the Seattlefault zone (S.f.z.) is due to lateral velocity con-trasts between the basin fill in the footwall andCrescent Formation basalt in the hanging wall.Distance scale represents the projection of bothshots and receivers onto a single line, andtherefore, the seismic records cannot bealigned perfectly.
(Fig. 2). This procedure facilitates the interpretation of bothreflection geometry and velocity anomalies at their truedepth. Care was exercised to properly project the velocitymodel onto the MCS profile where they diverge in space (Fig.1b). The traces of the velocity model and the MCS profileacross the Seattle fault are identical. The velocity grid wasalso converted to a density grid, and a gravity profile wascalculated and compared with the observed data (Fig. 5).
The Seattle Basin
Simulations of ground motion for hypothetical earth-quakes along the Seattle fault highlight the importance ofthe basin’s geometry in modulating long-period ground mo-tion (Frankel and Stephenson, 2000). The combined seismic-reflection, seismic-refraction, and gravity methods provide
an accurate estimate of the geometry of the Seattle Basinalong Puget Sound. Previous determinations relied either onseismic-reflection data with a single, assumed velocity pro-file (Johnson et al., 1994; Pratt et al., 1997) or on lower-resolution, 3D seismic tomography (Brocher et al., 2001).On our seismic-reflection profile, basement can be clearlyidentified only in some parts (e.g., around km 50, Fig. 2a).This is because the top of the Crescent Formation consistsof interbedded volcanic and sedimentary rocks, which tendto generate horizontally continuous reflections. The P-wave-velocity field superposed on the seismic-reflection data pro-vides a better guide to basement identification.
Basement is defined within the velocity range of 4.0–4.5 km/sec, and basin depth increases from the KingstonArch, where it is �2.5 km thick, to �7 km under the frontof the Seattle fault zone (Figs. 2 and 5). The low end of the

Subsurface Geometry and Evolution of the Seattle Fault Zone and the Seattle Basin, Washington 1743
Figure 4. Observed travel times (dots) and calculated travel time (lines) from thefirst-arrival tomographic inversion model for every receiver plotted. Secondary arrivalswere not modeled. Reduced travel time is similar to Figure 3, but time axis increasesupward. See Figure 1 for location of OBSs, land stations, and point Y. S.f.z., Seattlefault zone. Distance scale represents the projection of both shots and receivers onto asingle line (thin, straight line in Fig. 1b), and therefore, the seismic records cannot bealigned perfectly.
1744 U. S. ten Brink, P. C. Molzer, M. A. Fisher, R. J. Blakely, R. C. Bucknam, T. Parsons, R. S. Crosson, and K. C. Creager
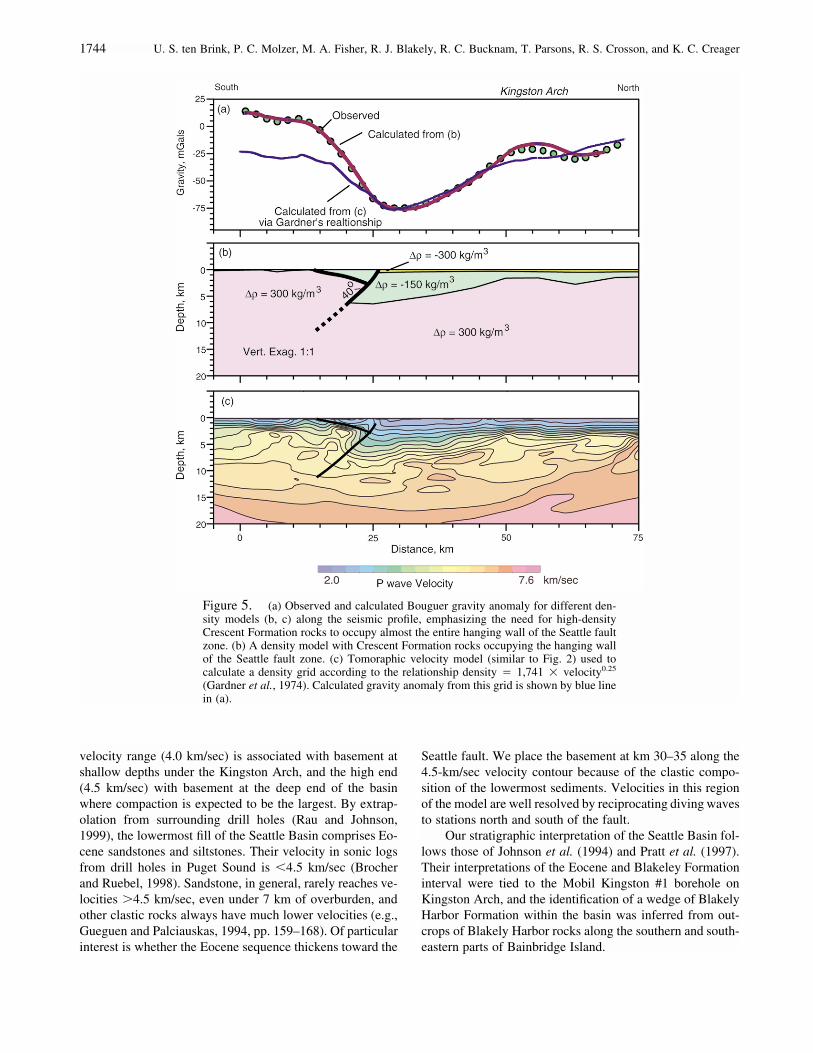
Figure 5. (a) Observed and calculated Bouguer gravity anomaly for different den-sity models (b, c) along the seismic profile, emphasizing the need for high-densityCrescent Formation rocks to occupy almost the entire hanging wall of the Seattle faultzone. (b) A density model with Crescent Formation rocks occupying the hanging wallof the Seattle fault zone. (c) Tomoraphic velocity model (similar to Fig. 2) used tocalculate a density grid according to the relationship density � 1,741 � velocity0.25
(Gardner et al., 1974). Calculated gravity anomaly from this grid is shown by blue linein (a).
velocity range (4.0 km/sec) is associated with basement atshallow depths under the Kingston Arch, and the high end(4.5 km/sec) with basement at the deep end of the basinwhere compaction is expected to be the largest. By extrap-olation from surrounding drill holes (Rau and Johnson,1999), the lowermost fill of the Seattle Basin comprises Eo-cene sandstones and siltstones. Their velocity in sonic logsfrom drill holes in Puget Sound is �4.5 km/sec (Brocherand Ruebel, 1998). Sandstone, in general, rarely reaches ve-locities �4.5 km/sec, even under 7 km of overburden, andother clastic rocks always have much lower velocities (e.g.,Gueguen and Palciauskas, 1994, pp. 159–168). Of particularinterest is whether the Eocene sequence thickens toward the
Seattle fault. We place the basement at km 30–35 along the4.5-km/sec velocity contour because of the clastic compo-sition of the lowermost sediments. Velocities in this regionof the model are well resolved by reciprocating diving wavesto stations north and south of the fault.
Our stratigraphic interpretation of the Seattle Basin fol-lows those of Johnson et al. (1994) and Pratt et al. (1997).Their interpretations of the Eocene and Blakeley Formationinterval were tied to the Mobil Kingston #1 borehole onKingston Arch, and the identification of a wedge of BlakelyHarbor Formation within the basin was inferred from out-crops of Blakely Harbor rocks along the southern and south-eastern parts of Bainbridge Island.
Subsurface Geometry and Evolution of the Seattle Fault Zone and the Seattle Basin, Washington 1745
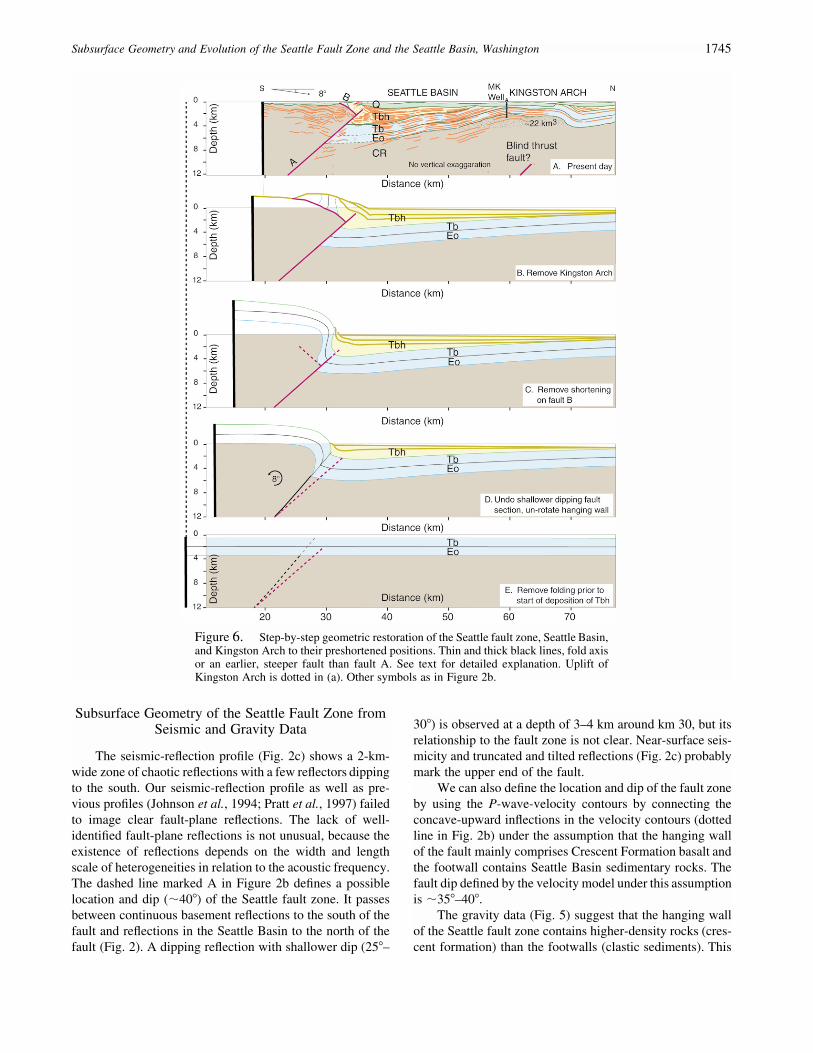
Figure 6. Step-by-step geometric restoration of the Seattle fault zone, Seattle Basin,and Kingston Arch to their preshortened positions. Thin and thick black lines, fold axisor an earlier, steeper fault than fault A. See text for detailed explanation. Uplift ofKingston Arch is dotted in (a). Other symbols as in Figure 2b.
Subsurface Geometry of the Seattle Fault Zone fromSeismic and Gravity Data
The seismic-reflection profile (Fig. 2c) shows a 2-km-wide zone of chaotic reflections with a few reflectors dippingto the south. Our seismic-reflection profile as well as pre-vious profiles (Johnson et al., 1994; Pratt et al., 1997) failedto image clear fault-plane reflections. The lack of well-identified fault-plane reflections is not unusual, because theexistence of reflections depends on the width and lengthscale of heterogeneities in relation to the acoustic frequency.The dashed line marked A in Figure 2b defines a possiblelocation and dip (�40�) of the Seattle fault zone. It passesbetween continuous basement reflections to the south of thefault and reflections in the Seattle Basin to the north of thefault (Fig. 2). A dipping reflection with shallower dip (25�–
30�) is observed at a depth of 3–4 km around km 30, but itsrelationship to the fault zone is not clear. Near-surface seis-micity and truncated and tilted reflections (Fig. 2c) probablymark the upper end of the fault.
We can also define the location and dip of the fault zoneby using the P-wave-velocity contours by connecting theconcave-upward inflections in the velocity contours (dottedline in Fig. 2b) under the assumption that the hanging wallof the fault mainly comprises Crescent Formation basalt andthe footwall contains Seattle Basin sedimentary rocks. Thefault dip defined by the velocity model under this assumptionis �35�–40�.
The gravity data (Fig. 5) suggest that the hanging wallof the Seattle fault zone contains higher-density rocks (cres-cent formation) than the footwalls (clastic sediments). This
1746 U. S. ten Brink, P. C. Molzer, M. A. Fisher, R. J. Blakely, R. C. Bucknam, T. Parsons, R. S. Crosson, and K. C. Creager
higher density is only because of higher velocities in thehanging wall than in the footwall, as indicated by the re-fraction data (Fig. 5c). It also reflects different rock com-position across the fault. The calculated anomaly (thin linein Fig. 5a) underestimates the observed anomaly in the hang-ing wall by as much as 40 mGal; we simply convert velocityto density, using a velocity–density ratio for sediments (den-sity � 1,741 � velocity0.25) (Gardner et al., 1974). Labo-ratory measurements of Crescent Formation basalt (Brocherand Reubel, 1998) confirm that the proportionality factorbetween density and velocity in these rocks is higher thanfor sediments; density � �1,840 � velocity0.25. We there-fore use basement density south of the Seattle Fault (Fig.5b). According to the gravity model, the fault dip betweendepths of 2.5 and 7 km is �40�.
Antithetic Fault and the Dislocation Model
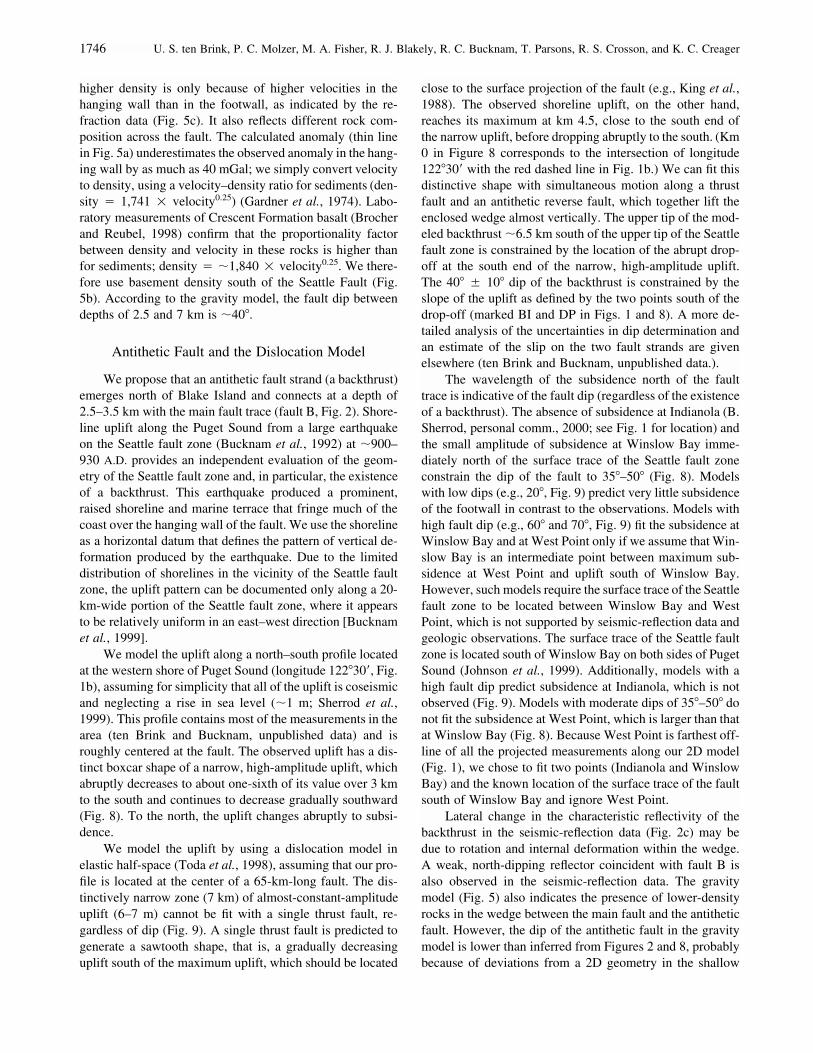
We propose that an antithetic fault strand (a backthrust)emerges north of Blake Island and connects at a depth of2.5–3.5 km with the main fault trace (fault B, Fig. 2). Shore-line uplift along the Puget Sound from a large earthquakeon the Seattle fault zone (Bucknam et al., 1992) at �900–930 A.D. provides an independent evaluation of the geom-etry of the Seattle fault zone and, in particular, the existenceof a backthrust. This earthquake produced a prominent,raised shoreline and marine terrace that fringe much of thecoast over the hanging wall of the fault. We use the shorelineas a horizontal datum that defines the pattern of vertical de-formation produced by the earthquake. Due to the limiteddistribution of shorelines in the vicinity of the Seattle faultzone, the uplift pattern can be documented only along a 20-km-wide portion of the Seattle fault zone, where it appearsto be relatively uniform in an east–west direction [Bucknamet al., 1999].
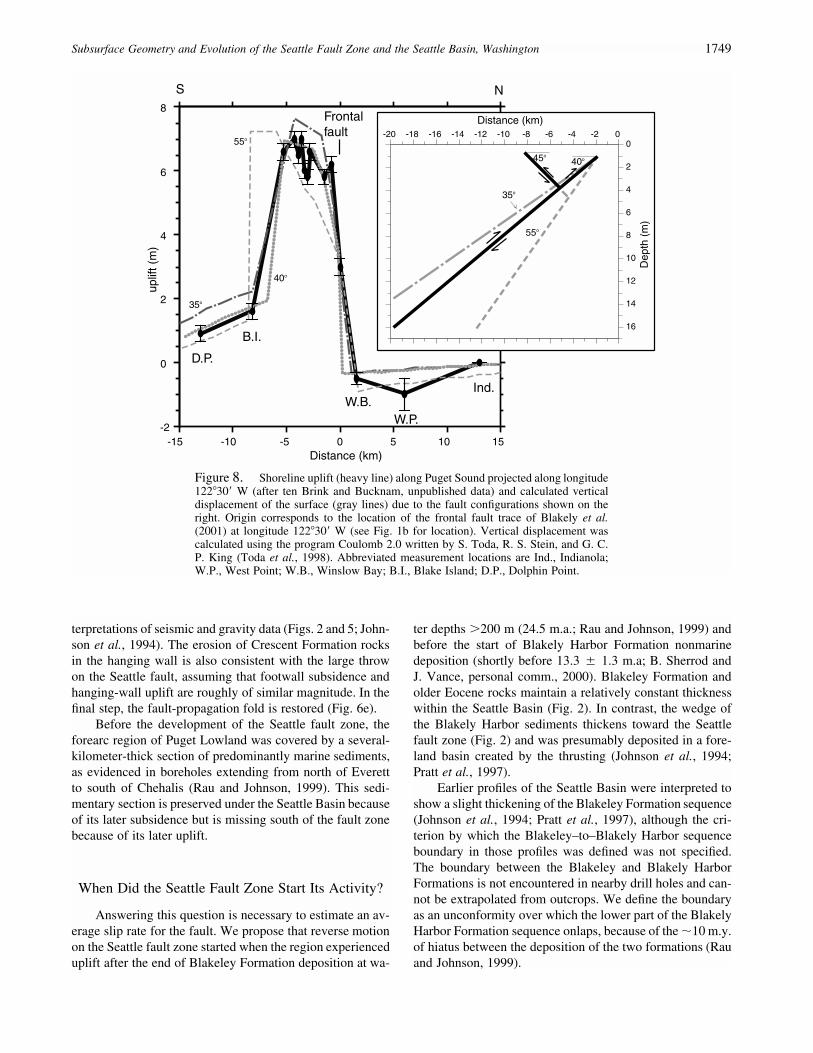
We model the uplift along a north–south profile locatedat the western shore of Puget Sound (longitude 122�30�, Fig.1b), assuming for simplicity that all of the uplift is coseismicand neglecting a rise in sea level (�1 m; Sherrod et al.,1999). This profile contains most of the measurements in thearea (ten Brink and Bucknam, unpublished data) and isroughly centered at the fault. The observed uplift has a dis-tinct boxcar shape of a narrow, high-amplitude uplift, whichabruptly decreases to about one-sixth of its value over 3 kmto the south and continues to decrease gradually southward(Fig. 8). To the north, the uplift changes abruptly to subsi-dence.
We model the uplift by using a dislocation model inelastic half-space (Toda et al., 1998), assuming that our pro-file is located at the center of a 65-km-long fault. The dis-tinctively narrow zone (7 km) of almost-constant-amplitudeuplift (6–7 m) cannot be fit with a single thrust fault, re-gardless of dip (Fig. 9). A single thrust fault is predicted togenerate a sawtooth shape, that is, a gradually decreasinguplift south of the maximum uplift, which should be located
close to the surface projection of the fault (e.g., King et al.,1988). The observed shoreline uplift, on the other hand,reaches its maximum at km 4.5, close to the south end ofthe narrow uplift, before dropping abruptly to the south. (Km0 in Figure 8 corresponds to the intersection of longitude122�30� with the red dashed line in Fig. 1b.) We can fit thisdistinctive shape with simultaneous motion along a thrustfault and an antithetic reverse fault, which together lift theenclosed wedge almost vertically. The upper tip of the mod-eled backthrust �6.5 km south of the upper tip of the Seattlefault zone is constrained by the location of the abrupt drop-off at the south end of the narrow, high-amplitude uplift.The 40� � 10� dip of the backthrust is constrained by theslope of the uplift as defined by the two points south of thedrop-off (marked BI and DP in Figs. 1 and 8). A more de-tailed analysis of the uncertainties in dip determination andan estimate of the slip on the two fault strands are givenelsewhere (ten Brink and Bucknam, unpublished data.).
The wavelength of the subsidence north of the faulttrace is indicative of the fault dip (regardless of the existenceof a backthrust). The absence of subsidence at Indianola (B.Sherrod, personal comm., 2000; see Fig. 1 for location) andthe small amplitude of subsidence at Winslow Bay imme-diately north of the surface trace of the Seattle fault zoneconstrain the dip of the fault to 35�–50� (Fig. 8). Modelswith low dips (e.g., 20�, Fig. 9) predict very little subsidenceof the footwall in contrast to the observations. Models withhigh fault dip (e.g., 60� and 70�, Fig. 9) fit the subsidence atWinslow Bay and at West Point only if we assume that Win-slow Bay is an intermediate point between maximum sub-sidence at West Point and uplift south of Winslow Bay.However, such models require the surface trace of the Seattlefault zone to be located between Winslow Bay and WestPoint, which is not supported by seismic-reflection data andgeologic observations. The surface trace of the Seattle faultzone is located south of Winslow Bay on both sides of PugetSound (Johnson et al., 1999). Additionally, models with ahigh fault dip predict subsidence at Indianola, which is notobserved (Fig. 9). Models with moderate dips of 35�–50� donot fit the subsidence at West Point, which is larger than thatat Winslow Bay (Fig. 8). Because West Point is farthest off-line of all the projected measurements along our 2D model(Fig. 1), we chose to fit two points (Indianola and WinslowBay) and the known location of the surface trace of the faultsouth of Winslow Bay and ignore West Point.
Lateral change in the characteristic reflectivity of thebackthrust in the seismic-reflection data (Fig. 2c) may bedue to rotation and internal deformation within the wedge.A weak, north-dipping reflector coincident with fault B isalso observed in the seismic-reflection data. The gravitymodel (Fig. 5) also indicates the presence of lower-densityrocks in the wedge between the main fault and the antitheticfault. However, the dip of the antithetic fault in the gravitymodel is lower than inferred from Figures 2 and 8, probablybecause of deviations from a 2D geometry in the shallow
Subsurface Geometry and Evolution of the Seattle Fault Zone and the Seattle Basin, Washington 1747
distribution of water, glacial sediments, and preglacial sed-iments around the fault zone (Blakely et al., 2001). Slightvariations in the geometry of the antithetic fault betweenFigures 2 and 8 are probably due to the fact that Figure 2 isa profile within Puget Sound, whereas Figure 8 is projectedalong the western shore of the Sound.
Evaluation of Previous Interpretations
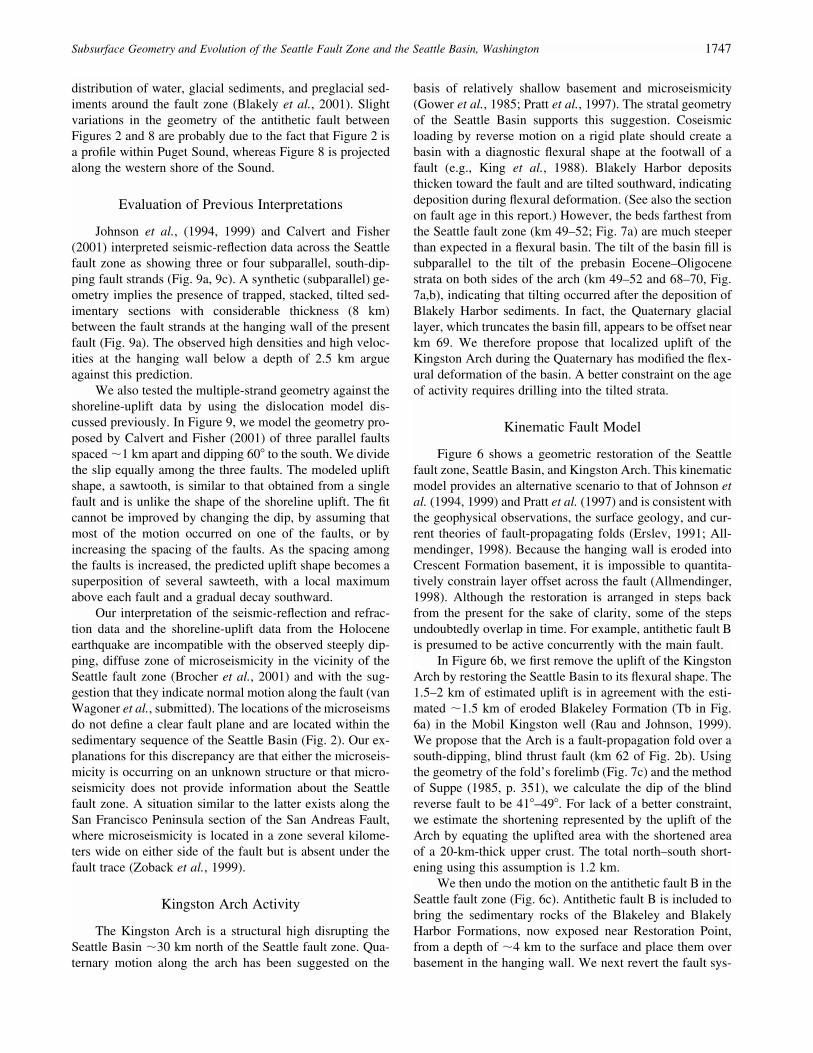
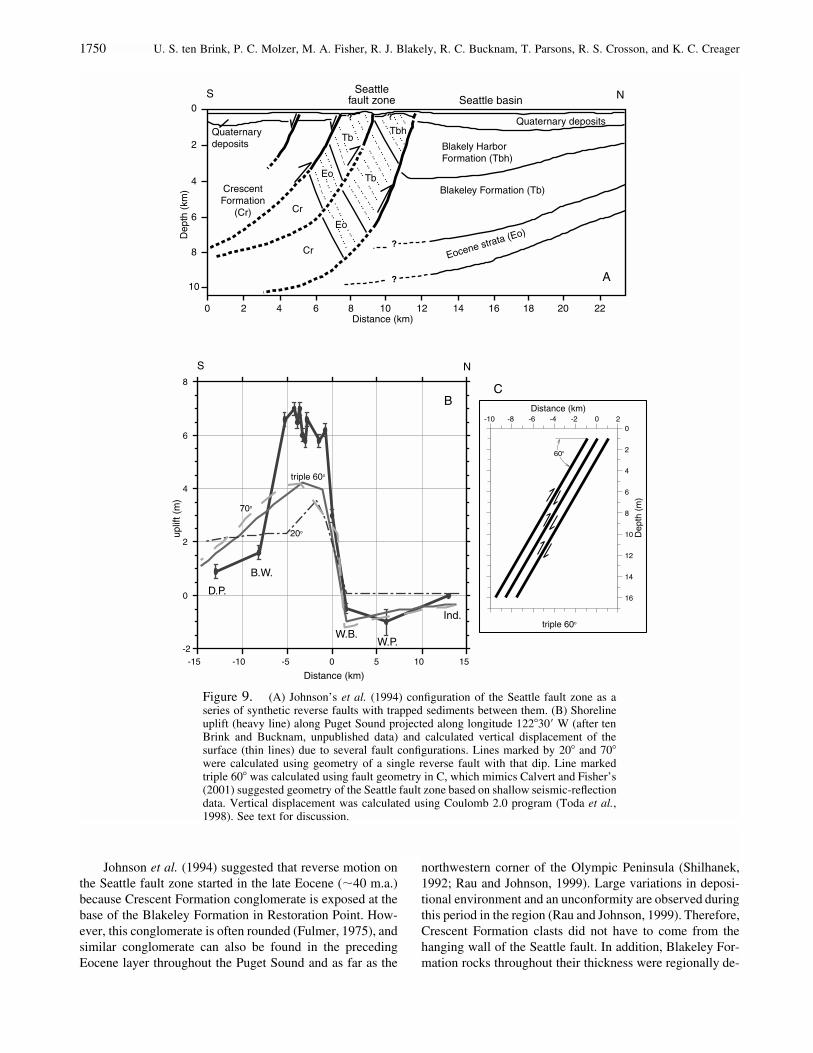
Johnson et al., (1994, 1999) and Calvert and Fisher(2001) interpreted seismic-reflection data across the Seattlefault zone as showing three or four subparallel, south-dip-ping fault strands (Fig. 9a, 9c). A synthetic (subparallel) ge-ometry implies the presence of trapped, stacked, tilted sed-imentary sections with considerable thickness (8 km)between the fault strands at the hanging wall of the presentfault (Fig. 9a). The observed high densities and high veloc-ities at the hanging wall below a depth of 2.5 km argueagainst this prediction.
We also tested the multiple-strand geometry against theshoreline-uplift data by using the dislocation model dis-cussed previously. In Figure 9, we model the geometry pro-posed by Calvert and Fisher (2001) of three parallel faultsspaced �1 km apart and dipping 60� to the south. We dividethe slip equally among the three faults. The modeled upliftshape, a sawtooth, is similar to that obtained from a singlefault and is unlike the shape of the shoreline uplift. The fitcannot be improved by changing the dip, by assuming thatmost of the motion occurred on one of the faults, or byincreasing the spacing of the faults. As the spacing amongthe faults is increased, the predicted uplift shape becomes asuperposition of several sawteeth, with a local maximumabove each fault and a gradual decay southward.
Our interpretation of the seismic-reflection and refrac-tion data and the shoreline-uplift data from the Holoceneearthquake are incompatible with the observed steeply dip-ping, diffuse zone of microseismicity in the vicinity of theSeattle fault zone (Brocher et al., 2001) and with the sug-gestion that they indicate normal motion along the fault (vanWagoner et al., submitted). The locations of the microseismsdo not define a clear fault plane and are located within thesedimentary sequence of the Seattle Basin (Fig. 2). Our ex-planations for this discrepancy are that either the microseis-micity is occurring on an unknown structure or that micro-seismicity does not provide information about the Seattlefault zone. A situation similar to the latter exists along theSan Francisco Peninsula section of the San Andreas Fault,where microseismicity is located in a zone several kilome-ters wide on either side of the fault but is absent under thefault trace (Zoback et al., 1999).
Kingston Arch Activity
The Kingston Arch is a structural high disrupting theSeattle Basin �30 km north of the Seattle fault zone. Qua-ternary motion along the arch has been suggested on the
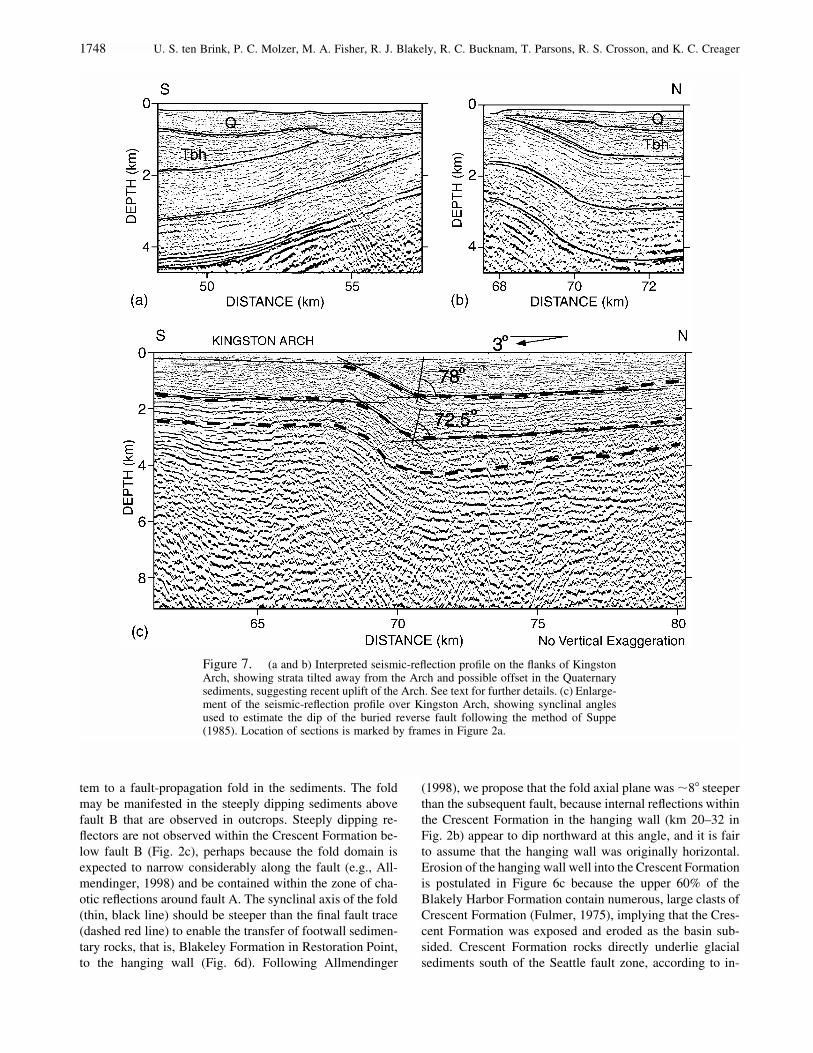
basis of relatively shallow basement and microseismicity(Gower et al., 1985; Pratt et al., 1997). The stratal geometryof the Seattle Basin supports this suggestion. Coseismicloading by reverse motion on a rigid plate should create abasin with a diagnostic flexural shape at the footwall of afault (e.g., King et al., 1988). Blakely Harbor depositsthicken toward the fault and are tilted southward, indicatingdeposition during flexural deformation. (See also the sectionon fault age in this report.) However, the beds farthest fromthe Seattle fault zone (km 49–52; Fig. 7a) are much steeperthan expected in a flexural basin. The tilt of the basin fill issubparallel to the tilt of the prebasin Eocene–Oligocenestrata on both sides of the arch (km 49–52 and 68–70, Fig.7a,b), indicating that tilting occurred after the deposition ofBlakely Harbor sediments. In fact, the Quaternary glaciallayer, which truncates the basin fill, appears to be offset nearkm 69. We therefore propose that localized uplift of theKingston Arch during the Quaternary has modified the flex-ural deformation of the basin. A better constraint on the ageof activity requires drilling into the tilted strata.
Kinematic Fault Model
Figure 6 shows a geometric restoration of the Seattlefault zone, Seattle Basin, and Kingston Arch. This kinematicmodel provides an alternative scenario to that of Johnson etal. (1994, 1999) and Pratt et al. (1997) and is consistent withthe geophysical observations, the surface geology, and cur-rent theories of fault-propagating folds (Erslev, 1991; All-mendinger, 1998). Because the hanging wall is eroded intoCrescent Formation basement, it is impossible to quantita-tively constrain layer offset across the fault (Allmendinger,1998). Although the restoration is arranged in steps backfrom the present for the sake of clarity, some of the stepsundoubtedly overlap in time. For example, antithetic fault Bis presumed to be active concurrently with the main fault.
In Figure 6b, we first remove the uplift of the KingstonArch by restoring the Seattle Basin to its flexural shape. The1.5–2 km of estimated uplift is in agreement with the esti-mated �1.5 km of eroded Blakeley Formation (Tb in Fig.6a) in the Mobil Kingston well (Rau and Johnson, 1999).We propose that the Arch is a fault-propagation fold over asouth-dipping, blind thrust fault (km 62 of Fig. 2b). Usingthe geometry of the fold’s forelimb (Fig. 7c) and the methodof Suppe (1985, p. 351), we calculate the dip of the blindreverse fault to be 41�–49�. For lack of a better constraint,we estimate the shortening represented by the uplift of theArch by equating the uplifted area with the shortened areaof a 20-km-thick upper crust. The total north–south short-ening using this assumption is 1.2 km.
We then undo the motion on the antithetic fault B in theSeattle fault zone (Fig. 6c). Antithetic fault B is included tobring the sedimentary rocks of the Blakeley and BlakelyHarbor Formations, now exposed near Restoration Point,from a depth of �4 km to the surface and place them overbasement in the hanging wall. We next revert the fault sys-
1748 U. S. ten Brink, P. C. Molzer, M. A. Fisher, R. J. Blakely, R. C. Bucknam, T. Parsons, R. S. Crosson, and K. C. Creager
Figure 7. (a and b) Interpreted seismic-reflection profile on the flanks of KingstonArch, showing strata tilted away from the Arch and possible offset in the Quaternarysediments, suggesting recent uplift of the Arch. See text for further details. (c) Enlarge-ment of the seismic-reflection profile over Kingston Arch, showing synclinal anglesused to estimate the dip of the buried reverse fault following the method of Suppe(1985). Location of sections is marked by frames in Figure 2a.
tem to a fault-propagation fold in the sediments. The foldmay be manifested in the steeply dipping sediments abovefault B that are observed in outcrops. Steeply dipping re-flectors are not observed within the Crescent Formation be-low fault B (Fig. 2c), perhaps because the fold domain isexpected to narrow considerably along the fault (e.g., All-mendinger, 1998) and be contained within the zone of cha-otic reflections around fault A. The synclinal axis of the fold(thin, black line) should be steeper than the final fault trace(dashed red line) to enable the transfer of footwall sedimen-tary rocks, that is, Blakeley Formation in Restoration Point,to the hanging wall (Fig. 6d). Following Allmendinger
(1998), we propose that the fold axial plane was �8� steeperthan the subsequent fault, because internal reflections withinthe Crescent Formation in the hanging wall (km 20–32 inFig. 2b) appear to dip northward at this angle, and it is fairto assume that the hanging wall was originally horizontal.Erosion of the hanging wall well into the Crescent Formationis postulated in Figure 6c because the upper 60% of theBlakely Harbor Formation contain numerous, large clasts ofCrescent Formation (Fulmer, 1975), implying that the Cres-cent Formation was exposed and eroded as the basin sub-sided. Crescent Formation rocks directly underlie glacialsediments south of the Seattle fault zone, according to in-
Subsurface Geometry and Evolution of the Seattle Fault Zone and the Seattle Basin, Washington 1749
-2
0
2
4
6
8
-15 -10 -5 0 5 10 15
uplif
t (m
)
Distance (km)
55o
S N
Ind.
W.P.W.B.
B.I.
D.P.
Frontalfault
35o
0
2
4
6
8
10
12
14
16
-20 -18 -16 -14 -12 -10 -8 -6 -4 -2 0
40o
Distance (km)
Dep
th (
m)
45o
35o
55o
40o
Figure 8. Shoreline uplift (heavy line) along Puget Sound projected along longitude122�30� W (after ten Brink and Bucknam, unpublished data) and calculated verticaldisplacement of the surface (gray lines) due to the fault configurations shown on theright. Origin corresponds to the location of the frontal fault trace of Blakely et al.(2001) at longitude 122�30� W (see Fig. 1b for location). Vertical displacement wascalculated using the program Coulomb 2.0 written by S. Toda, R. S. Stein, and G. C.P. King (Toda et al., 1998). Abbreviated measurement locations are Ind., Indianola;W.P., West Point; W.B., Winslow Bay; B.I., Blake Island; D.P., Dolphin Point.
terpretations of seismic and gravity data (Figs. 2 and 5; John-son et al., 1994). The erosion of Crescent Formation rocksin the hanging wall is also consistent with the large throwon the Seattle fault, assuming that footwall subsidence andhanging-wall uplift are roughly of similar magnitude. In thefinal step, the fault-propagation fold is restored (Fig. 6e).
Before the development of the Seattle fault zone, theforearc region of Puget Lowland was covered by a several-kilometer-thick section of predominantly marine sediments,as evidenced in boreholes extending from north of Everettto south of Chehalis (Rau and Johnson, 1999). This sedi-mentary section is preserved under the Seattle Basin becauseof its later subsidence but is missing south of the fault zonebecause of its later uplift.
When Did the Seattle Fault Zone Start Its Activity?
Answering this question is necessary to estimate an av-erage slip rate for the fault. We propose that reverse motionon the Seattle fault zone started when the region experienceduplift after the end of Blakeley Formation deposition at wa-
ter depths �200 m (24.5 m.a.; Rau and Johnson, 1999) andbefore the start of Blakely Harbor Formation nonmarinedeposition (shortly before 13.3 � 1.3 m.a; B. Sherrod andJ. Vance, personal comm., 2000). Blakeley Formation andolder Eocene rocks maintain a relatively constant thicknesswithin the Seattle Basin (Fig. 2). In contrast, the wedge ofthe Blakely Harbor sediments thickens toward the Seattlefault zone (Fig. 2) and was presumably deposited in a fore-land basin created by the thrusting (Johnson et al., 1994;Pratt et al., 1997).
Earlier profiles of the Seattle Basin were interpreted toshow a slight thickening of the Blakeley Formation sequence(Johnson et al., 1994; Pratt et al., 1997), although the cri-terion by which the Blakeley–to–Blakely Harbor sequenceboundary in those profiles was defined was not specified.The boundary between the Blakeley and Blakely HarborFormations is not encountered in nearby drill holes and can-not be extrapolated from outcrops. We define the boundaryas an unconformity over which the lower part of the BlakelyHarbor Formation sequence onlaps, because of the �10 m.y.of hiatus between the deposition of the two formations (Rauand Johnson, 1999).
1750 U. S. ten Brink, P. C. Molzer, M. A. Fisher, R. J. Blakely, R. C. Bucknam, T. Parsons, R. S. Crosson, and K. C. Creager
-2
0
2
4
6
8
-15 -10 -5 0 5 10 15
uplif
t (m
)
Distance (km)
0
2
4
6
8
10
12
14
16
-10 -8 -6 -4 -2 0
60o
Distance (km)
Dep
th (
m)
triple 60o
triple 60o
2
20o
70o
S N
Ind.
W.P.W.B.
B.W.
D.P.
A
BC
S Seattlefault zone Seattle basin
? ?
Quaternarydeposits
CrescentFormation
(Cr) Cr
Cr
Eo
Eo
Tb
Tb
Tbh
Blakely HarborFormation (Tbh)
Blakeley Formation (Tb)
?
?
Quaternary deposits
N
Eocene strata (Eo)
0
2
4
6
8
10
0 2 4 6 8 10 12 14 16 18 20 22Distance (km)
Dep
th (
km)
Figure 9. (A) Johnson’s et al. (1994) configuration of the Seattle fault zone as aseries of synthetic reverse faults with trapped sediments between them. (B) Shorelineuplift (heavy line) along Puget Sound projected along longitude 122�30� W (after tenBrink and Bucknam, unpublished data) and calculated vertical displacement of thesurface (thin lines) due to several fault configurations. Lines marked by 20� and 70�were calculated using geometry of a single reverse fault with that dip. Line markedtriple 60� was calculated using fault geometry in C, which mimics Calvert and Fisher’s(2001) suggested geometry of the Seattle fault zone based on shallow seismic-reflectiondata. Vertical displacement was calculated using Coulomb 2.0 program (Toda et al.,1998). See text for discussion.
Johnson et al. (1994) suggested that reverse motion onthe Seattle fault zone started in the late Eocene (�40 m.a.)because Crescent Formation conglomerate is exposed at thebase of the Blakeley Formation in Restoration Point. How-ever, this conglomerate is often rounded (Fulmer, 1975), andsimilar conglomerate can also be found in the precedingEocene layer throughout the Puget Sound and as far as the
northwestern corner of the Olympic Peninsula (Shilhanek,1992; Rau and Johnson, 1999). Large variations in deposi-tional environment and an unconformity are observed duringthis period in the region (Rau and Johnson, 1999). Therefore,Crescent Formation clasts did not have to come from thehanging wall of the Seattle fault. In addition, Blakeley For-mation rocks throughout their thickness were regionally de-
Subsurface Geometry and Evolution of the Seattle Fault Zone and the Seattle Basin, Washington 1751
posited at bathyal depths, which suggests regional subsi-dence, not uplift.
A middle Miocene age for the initiation of the Seattlefault zone matches the dates of a change in plate motion andthe beginning of regional uplift and compressional defor-mation. Exhumation of the Olympic Peninsula started �18m.a., and stratigraphic and faunal indicators in the surround-ing area indicate that uplift started in the middle Miocene(Brandon et al., 1998). Major uplift of the forearc region inOregon and Washington during the late middle Miocene(�15 m.a.) is indicated by a regional unconformity on thecontinental shelf and by folded rocks of the Miocene AstoriaFormation and the Columbia River Basalts (Snavely et al.,1996). On a larger scale, the Juan de Fuca Plate started ro-tating clockwise at 18 m.a. and seafloor spreading slowed.The clockwise rotation and the reduction in spreading ratealigned the Juan de Fuca Plate motion with respect to thePacific Plate closer to that of the North American Plate, in-dicating that the Juan de Fuca Plate no longer moved inde-pendently.
A total slip of 10 km is estimated from the offset ofCrescent Formation between the footwall of the Seattle faultzone and the surface, if we ignore the complications pre-sented by antithetic fault B (Fig. 2b). This is a minimumestimate, because an unknown amount of Crescent Forma-tion rocks were eroded from the hanging wall. If reversemotion on the Seattle fault zone started 15 m.y. ago, theaverage Neogene slip rate is 0.66 mm/yr. If �2 km of Cres-cent Formation rocks were eroded from the hanging wall(Fig. 6c), the average Neogene slip rate is 0.87 mm/yr. Aslip rate of 0.72–1.28 mm/yr for the Holocene can be de-duced from the 8–14 m of uplift of glacial sediments (datedas post-17 k.y.) (Thorson, 1996), assuming that the uplifttook place on a 40� fault. However, it is difficult to relatethe long-term average slip to the Holocene slip rate becauseno other event similar in magnitude to the earthquake�1,100 years ago has taken place in the past 7,500 years onthe Seattle fault zone (Sherrod et al., 1999).
Implications to Deformation Modelsof Puget Sound
Two models for the deformation of Puget Sound into aseries of highs and basins have been proposed: a thin-skinned deformation along a detachment surface (Pratt et al.,1997) and a thick-skinned deformation along steeply dippingreverse faults with opposing dips (Brocher et al., 2001). Ifour interpretation of Seattle Basin stratigraphy as the resultof both Seattle fault-zone loading and of a fault-propagatingfold under the Kingston Arch is correct, then a deep detach-ment with a ramp (Pratt et al., 1997) is not required. Asexplained in the Introduction, the ramp model was partlyinvoked to explain the shape of the Seattle Basin and Kings-ton Arch. We propose instead that the Seattle fault zone andthe Kingston Arch are two south-dipping reverse faults andthat the Seattle Basin is a disrupted flexural basin.
Brocher et al. (2001) proposed that the Seattle Basin isa sunken block between two high-angle reverse faults withopposing dips and that the Seattle Uplift and Kingston Archare uplifted wedges between two high-angle reverse faultswith opposing dips. The stratigraphy of the Seattle Basinalong Puget Sound is inconsistent with sunken-block ge-ometry, because the sediments do not dip both to the southand to the north. Instead, the sequences rise continuouslyfrom the Seattle Basin and onto the Kingston Arch (Fig. 2),and the arch itself is asymmetric with its steep flank facingnorth (Fig. 7).
Considering that the thickness of the Siletz terrane is25–30 km, that is, deeper than the proposed detachment ofPratt et al. (1997), it is plausible that north–south shorteningof the lowland is accomplished by thick-skinned reverse orthrust faults (Wells and Weaver, 1993; Brocher et al., 2001)instead of thin-skinned ramps and faults. Brocher et al.(2001) proposed the existence of a north-dipping reversefault south of the Seattle fault, the Tacoma fault. If the Ta-coma fault exists, it should intersect the Seattle fault at depth,unless both faults are steeply dipping (�63� or �55� toavoid intersection at depths of 28 km and 20 km, respec-tively). Provided that the two faults are not steeply dippingand the Tacoma fault exists, either the Tacoma or the Seattlefault must act as a backthrust to the other fault.
Conclusions
The combination of independent data sets and differenttechniques for analysis and modeling provides additional in-formation on the subsurface geometry of the Seattle faultzone and the Seattle Basin than was previously available.The Seattle Basin along Puget Sound reaches a maximumdepth of 7 km; thins northward to the Kingston Arch, whereit is �2.5 km thick; and thickens again north of the KingstonArch. Dislocation models of Holocene shoreline uplift andsubsidence along the western shore of Puget Sound under-score the need for an antithetic reverse fault at shallowdepths to have ruptured together with the main trace of theSeattle fault to match the uplift and subsidence, which werepresumably caused by an earthquake in the Seattle fault zoneabout �900–930 A.D. The dislocation model, the P-wave-velocity field, and the modeled rock densities are inconsis-tent with the previously suggested geometry of the Seattlefault zone as a set of three or four parallel reverse faults(Johnson et al., 1994, 1999; Calvert and Fisher, 2001). Thedip of the Seattle fault remains elusive. Using the seismic-reflection and refraction data, we suggest that the fault hasa dip range of 35�–45� down to a depth of 7 km, but wecannot put error bounds on this range. Using the dislocationmodel, the dip that fits the observed shoreline uplift is35�–50�.
The Neogene sedimentary rocks in the Seattle Basin inthe footwall of the Seattle fault zone are interpreted to havebeen deposited in a flexural basin formed by the load of thehanging wall. We interpret lithostratigraphic data from bore-
1752 U. S. ten Brink, P. C. Molzer, M. A. Fisher, R. J. Blakely, R. C. Bucknam, T. Parsons, R. S. Crosson, and K. C. Creager
holes and the observed stratal geometry in the reflection datato indicate that reverse motion of the Seattle fault zonestarted some time between 24 and 14 m.a., and suggest thatit was probably coincident with the initiation of regionaluplift and compression in the forearc in the middle Miocene.According to our interpretation, this fault was initiated muchlater than the previously suggested late Eocene (�40 m.a.)date. Basin subsidence during the Neogene helped preservethe pre-Neogene sedimentary cover.
Disruption in the stratal geometry of the basin indicatesQuaternary uplift of the Kingston Arch, located 30 km northof the Seattle fault zone. Microseismic activity there sug-gests ongoing uplift of the Arch. We interpret this uplift tobe a fault-propagation fold over a reverse fault, with an es-timated dip of 41�–49�. This interpretation contrasts with aprevious interpretation of the Seattle Basin and KingstonArch as shallow manifestations of a ramp in a midcrustaldetachment (Pratt et al., 1997). It is more likely that north–south shortening is accommodated by a series of thick-skinned reverse faults cutting perhaps the entire 25–30-km-thick Siletz terrane (Wells and Weaver, 1993; Brocher et al.,2001). However, the observed basin stratigraphy is also in-consistent with the interpretation of the Seattle Basin as asunken wedge between two high-angle reverse faults withopposing dips (Brocher et al., 2001).
Acknowledgments
We thank Neal Driscoll, Sam Johnson, Ray Wells, Brian Atwater,Brian Sherrod, and Ross Stein for helpful discussions and T. Brocher, N.Driscoll, S. Johnson, R. Thorson, M. Brandon, T. Pratt, and C. Potter fortheir reviews. Support by the USGS coastal and marine geology and earth-quake hazards programs is gratefully acknowledged.
References
Allmendinger, R. W. (1998). Inverse and forward numerical modeling oftrishear fault-propagation folds, Tectonics, 17, 640–656.
Atwater, B. F., and A. L. Moore (1992). A tsunami about 1000 years agoin Puget Sound, Washington, Science 258, 1614–1617.
Blakely, R. J., R. E. Wells, C. S. Weaver, and S. Y. Johnson (2002). Lo-cation, structure, and seismicity of the Seattle Fault, Washington: evi-dence from aeromagnetic anomalies, geological maps, and seismicreflection data, Geol. Soc. Am. Bull. 114, 169–177.
Brandon, M. T., M. K. Roden-Tice, and J. I. Garver, 1998, Late Cenozoicexhumation of the Cascadia accretionary wedge in the OlympicMountains, northwest Washington State, Geol. Soc. Am. Bull. 10,985–11,009.
Brocher, T. M., and A. L. Reubel (1998). Compilation of 29 sonic anddensity logs from 23 oil test wells in western Washington State, U.S.Geol. Surv. Open-File Rept. 98–249, 63 pp.
Brocher, T. M., T. Parsons, R. J. Blakely, N. I. Christensen, M. A. Fisher,R. E. Wells, and S. W. Group (2001). Upper crustal structure in PugetLowland, Washington: results from the 1998 Seismic Hazards Inves-tigation in Puget Sound, J. Geophys. Res. 106, 13,541–13,564.
Bucknam, R. C., E. Hemphill-Haley, and E. B. Leopold (1992). Abruptuplift within the past 1700 years at southern Puget Sound, Washing-ton, Science 258, 1611–1614.
Bucknam, R. C., B. L. Sherrod, G. Elfendahl, and S. D. Malone (1999). Afault scarp of probable Holocene age in the Seattle fault zone, Bain-bridge Island, Washington Seism. Res. Lett. 70, 233.
Calvert, A. J., M. A. Fisher, and the SHIPS working group (2001). Imagingthe Seattle Fault zone with high-resolution seismic tomography, Geo-phys. Res. Lett. 28, 2337–2340.
Crosson, R. S., N. P. Symons, and S. D. Malone (1999). A model forlocalization of seismicity in the central Puget Lowland, Washington,Seism. Res. Lett. 70, 255.
Crosson, R. S., and N. P. Symons (2001). What goes down, comes up:flexural origin of the Puget basins and tectonic implications; Seism.Res. Lett. 72, 237.
Duncan, R. A. (1982). A captured island chain in the coast range of Oregonand Washington, J. Geophys. Res. 87, 10,827–10,837.
Erslev, E. A. (1991). Trishear fault-propagation folding, Geology 19, 617–620.
Finn, C. A. (1990). Geophysical constraints on Washington convergentmargin structure, J. Geophys. Res. 95, 19,533–19,546.
Frankel, A. D., and W. Stephenson (2000). Three-dimensional simulationsof ground motion in the Seattle region for earthquakes in the Seattlefault zone, Bull. Seism. Soc. Am. 90, 1251–1267.
Fulmer, C. V. (1975). Stratigraphy and paleontology of the type Blakeleyand Blakely Harbor formations, in Conference on Future Energy Ho-rizons of the Pacific Coast, Paleogene Symposium and Selected Tech-nical Papers: 50th Annual Meeting of the Pacific Sections of AAPG,SEPM, and SEG, D. W. Weaver, G. R. Hornaday, and A. Tipton(Editors), Long Beach, CA, pp. 210–271.
Gardner, G. H. F., L. W. Gardner, and A. R. Gregory (1974). Formationvelocity and density; the diagnostic basics for stratigraphic traps, Geo-physics 39, 770–780.
Gower, H. D., J. C. Yount, and R. S. Crosson (1985). Seismotectonic mapof the Puget Sound region, Washington, pp. 15 (1 sheet), U.S. Geo-logical Survey Miscellaneous Investigations Series I-1613, scale1:250,000.
Gueguen, Y., and V. Palciauskas (1994). Introduction to the Physics ofRocks, Priceton Univ Press, Princeton, NJ, 294 pp.
Johnson, S. Y., S. V. Dadisman, J. R. Childs, and W. D. Stanley (1999).Active tectonics of the Seattle Fault and central Puget Sound, Wash-ington: implications for earthquake hazards, Geol. Soc. Am. Bull. 111,1042–1053.
Johnson, S. Y., C. J. Potter, and J. M. Armentrout (1994). Origin and evo-lution of the Seattle fault and Seattle Basin, Washington, Geology 22,71–74.
Johnson, S. Y., C. J. Potter, J. M. Armentrout, J. J. Miller, C. A. Finn, andC. S. Weaver (1996). The southern Whidbey Island fault: an activestructure in the Puget Lowland, Washington, Geol. Soc. Am. Bull.108, 334–354.
Khazaradze, G., A. Qamar, and H. Dragert (1999). Tectonic deformationin western Washington from continuous GPS measurements, Geo-phys. Res. Lett. 26, 3153–3156.
King, G. C., R. S. Stein, and J. B. Rundle (1988). The growth of geologicalstructures by repeated earthquakes, 1; conceptual framework, J. Geo-phys. Res. 93, 13,307–13,318.
Loss, J., I. A. Pecher, and U. S. ten Brink (1998). RayGUI: a graphical userinterface for interactive ray-tracing (rayinvr), U.S. Geol. Surv. Open-File Rept. 98–203.
Parsons, T., R. E. Wells, M. A. Fisher, E. Flueh, and U. S. ten Brink (1999).Three-dimensional velocity structure of Siletzia and other accretedterranes in the Cascadia forearc of Washington, J Geophys. Res., 104,18,015–18,039.
Pezzopane, S. K., and R. J. Weldon II (1993). Tectonic role of active fault-ing in central Oregon, Tectonics 12, 1140–1169.
Pratt, T. L., S. Y. Johnson, C. J. Potter, W. J. Stephenson, and C. A. Finn(1997). Seismic reflection images beneath Puget Sound, westernWashington State: the Puget Lowland thrust sheet hypothesis, J. Geo-phys. Res., 102, 27,469–27,489.
Rau, W. W., and S. Y. Johnson (1999). Well stratigraphy and correlations,western Washington and northwest Oregon, U.S. Geol Surv Map In-vest. I-2621, (3 sheets).
Sherrod, B. L., Bucknam, R. C., and Leopold, E. B. (1999). Holocene

Subsurface Geometry and Evolution of the Seattle Fault Zone and the Seattle Basin, Washington 1753
relative sea level changes along the Seattle Fault at Restoration Point.Q. Res. 54, 384–393.
Shilhanek, A. B. (1992). The sedimentology, petrology and tectonic sig-nificance of the middle Eocene Flattery Breccia, Lyre Formation,northwestern Olympic Peninsula, Washington, M.A. Thesis, WesternWashington University, 150 pp.
Snavely, P. D. Jr., and R. E. Wells (1996). Cenozoic evolution of the con-tinental margin of Oregon and Washington, in Assessing EarthquakeHazards and Reducing Risk in the Pacific Northwest, Vol. 1, in U.S.Geol. Surv. Profes. Pap., pp. 161–182.
Suppe, J. (1985) Principles of Structural Geology, Prentice-Hall, Engle-woods Cliffs, NJ, 537 pp.
Symons, N. P., and R. S. Crosson (1997). Seismic velocity structure of thePuget Sound region from three-dimensional nonlinear tomography,Geophys. Res. Lett. 24, 2593–2596.
Thorson, R. M. (1996). Earthquake recurrence and glacial loading in west-ern Washington, Geol. Soc. Am. Bull. 108, 1182–1191.
Toda, S., R. S. Stein, P. A. Reasenberg, J. H. Dieterich, and A. Yoshida(1998). Stress transferred by the 1995 Mw � 6.9 Kobe, Japan, shock:effect on aftershocks and future earthquake probabilities, J. Geophys.Res. 103, 24,543–24,565.
Trehu, A. M., I. Asudeh, T. M. Brocher, J. H. Luetgert, W. D. Mooney,J. L. Nabelek, and Y. Nakamura (1994). Crustal architecture of theCascadia Forearc, Science 266, 237–243.
van Wagoner, T. M., R. S. Crosson, K. C. Creager, G. Medema, L. Preston,N. P. Symons, and T. M. Brocher (2002). Crustal structure and re-located earthquakes in the Puget Lowland, Washington from high-resolution seismic tomography, J. Geophys. Res. (in press).
Walcott, R. I. (1993). Neogene tectonics and kinematics of western NorthAmerica, Tectonics 12, 326–333.
Wells, R. E., and C. S. Weaver (1993). Block deformation in Puget Low-land, in Proceedings of the National Earthquake Prediction Evalua-tion Council, V. E. Frizzel (Editor), U.S. Geol. Surv. Open-File Rep.93–333, 14–16.
Wells, R. E., C. S. Weaver, and R. J. Blakely (1998). Fore-arc migrationin Cascadia and its neotectonic significance, Geology 26, 759–762.
Yount, J. C., and H. D. Gower (1991). Bedrock geologic map of the Seattle30� by 60� Quadrangle, Washington, U.S. Geol. Surv. Open-File Rept.91–147, 37 pp. (4 sheets)
Zelt, C. A., and R. B. Smith (1992). Seismic traveltime inversion for 2Dcrustal velocity structure, Geophys. J. Interiors 108, 16–34.
Zhang, J., and M. N. Toksoz (1998). Nonlinear refraction traveltime to-mography, Geophysics 63, 1726–1737.
Zoback, M. L., R. C. Jachens, and J. A. Olson (1999). Abrupt along-strikechange in tectonic style: San Andreas fault zone, San Francisco Pen-insula, J. Geophys. Res. 104, 10,719–10,742.
U.S. Geological Survey384 Woods Hole Rd.Woods Hole, Massachusetts 02543
(U.S.t.B., P.C.M.)
U.S. Geological Survey345 Middlefield Rd., MS 977Menlo Park, California 94025
(M.A.F., R.J.B., T.P.)
U.S. Geological SurveyP.O. Box 25046Lakewood, Colorado 80225
(R.C.B.)
GeophysicsBox 351650University of WashingtonSeattle, Washington 98195
(R.S.C., K.C.C.)
Manuscript received 23 August 2001.