suburban pressure on farmland in the dairy state
DESCRIPTION
A Two County Comparison of Farmland Change and Preservation Andrew Broderick October 21, 2010 UP 502: Environmental Planning Professor Larissa LarsenTRANSCRIPT
Suburban Pressure on Farmland in The Dairy State: A Two County Comparison of Farmland Change and Preservation
Andrew BroderickOctober 21, 2010UP 502: Environmental PlanningProfessor Larissa Larsen
Suburban Pressure on Farmland in The Dairy State
2
Known around the world as ‘The Dairy State,’ Wisconsin is a major agricultural production center in the United States, and
is well known for its dairy production. Blessed with fertile soils and gentle, rolling hills, Wisconsin has a 200 year history
of agricultural production. In 2002, Wisconsin’s agricultural production totaled $5.6 billion, which is the tenth highest in
the nation (State Agricultural Profile, 2010). However, because of rapidly expanding suburban development, the decrease
in family farms due to competition and lifestyle choices, the historical lack of agricultural preservation vision, and the
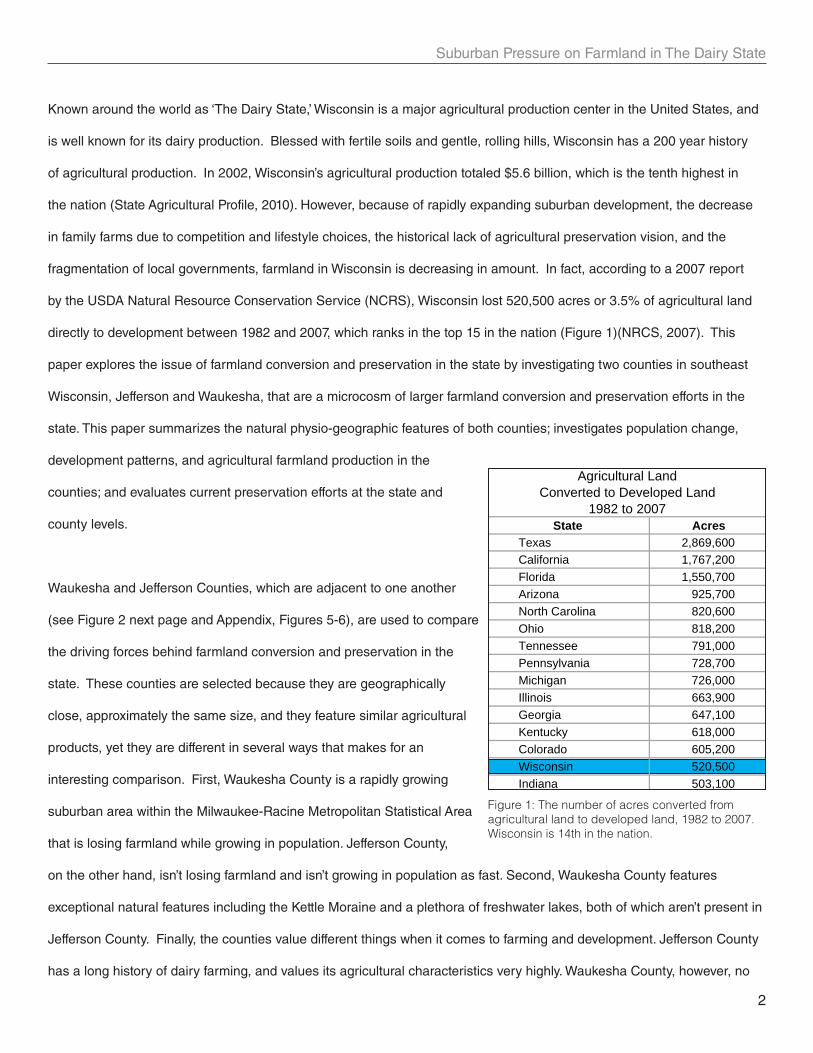
fragmentation of local governments, farmland in Wisconsin is decreasing in amount. In fact, according to a 2007 report
by the USDA Natural Resource Conservation Service (NCRS), Wisconsin lost 520,500 acres or 3.5% of agricultural land
directly to development between 1982 and 2007, which ranks in the top 15 in the nation (Figure 1)(NRCS, 2007). This
paper explores the issue of farmland conversion and preservation in the state by investigating two counties in southeast
Wisconsin, Jefferson and Waukesha, that are a microcosm of larger farmland conversion and preservation efforts in the
state. This paper summarizes the natural physio-geographic features of both counties; investigates population change,
development patterns, and agricultural farmland production in the
counties; and evaluates current preservation efforts at the state and
county levels.
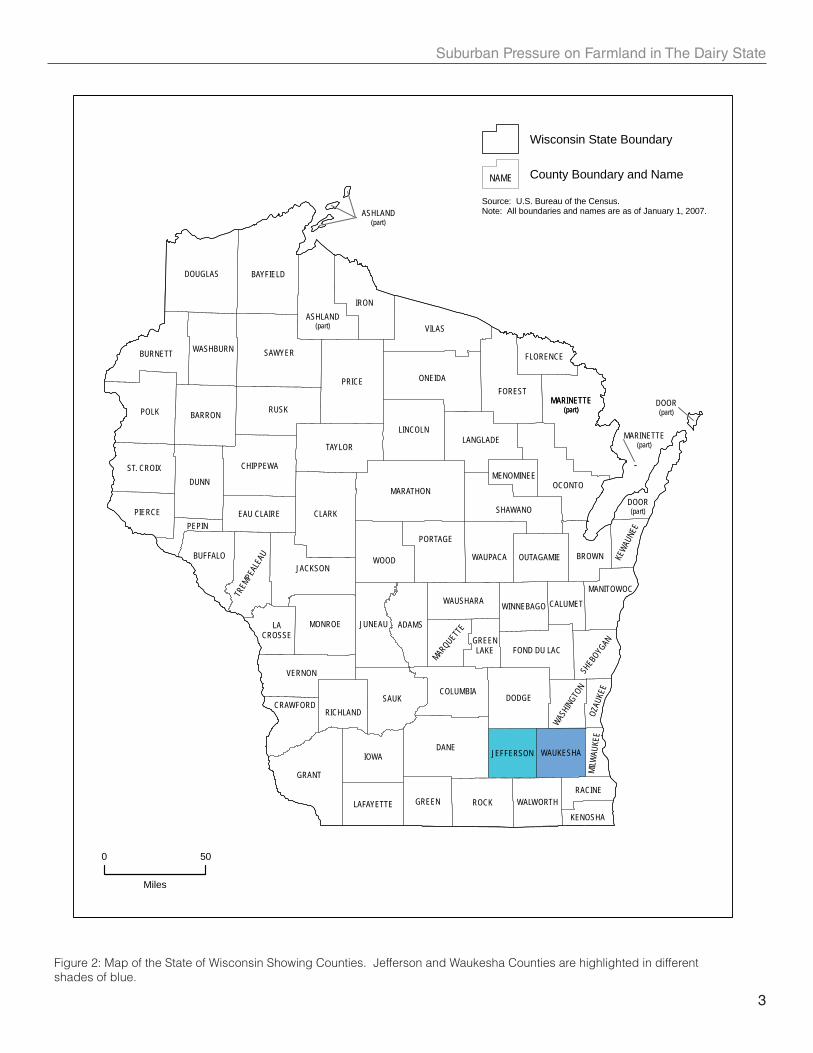
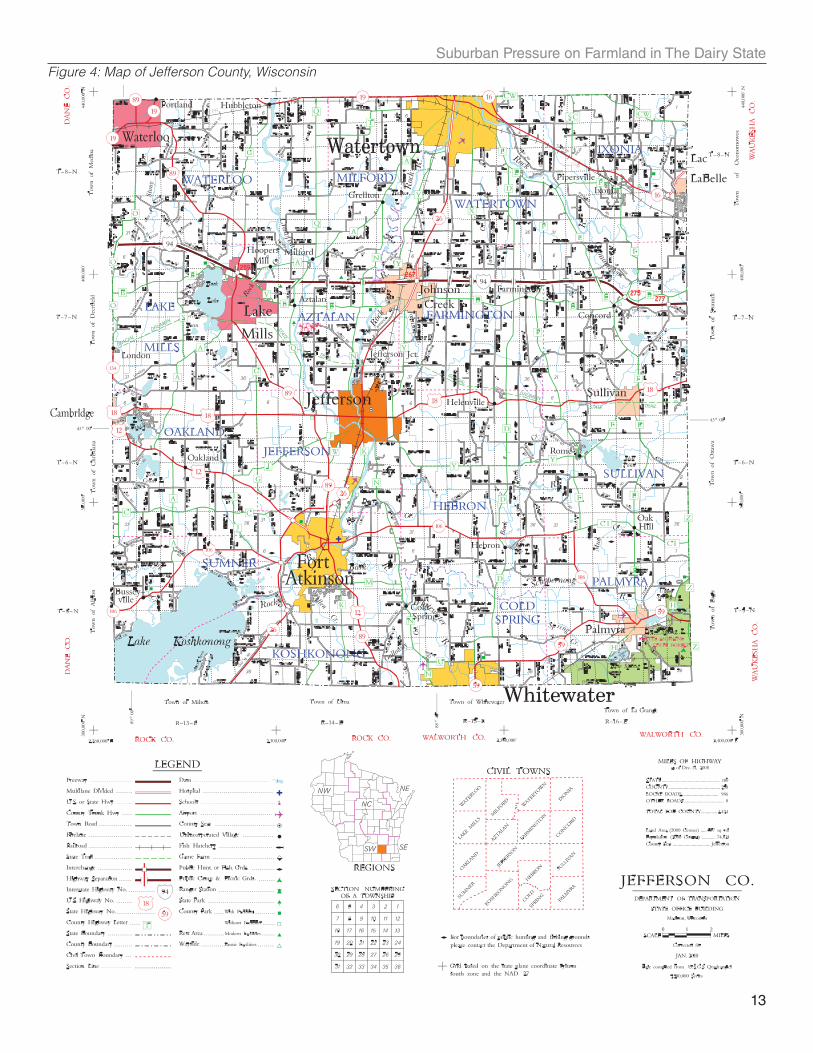
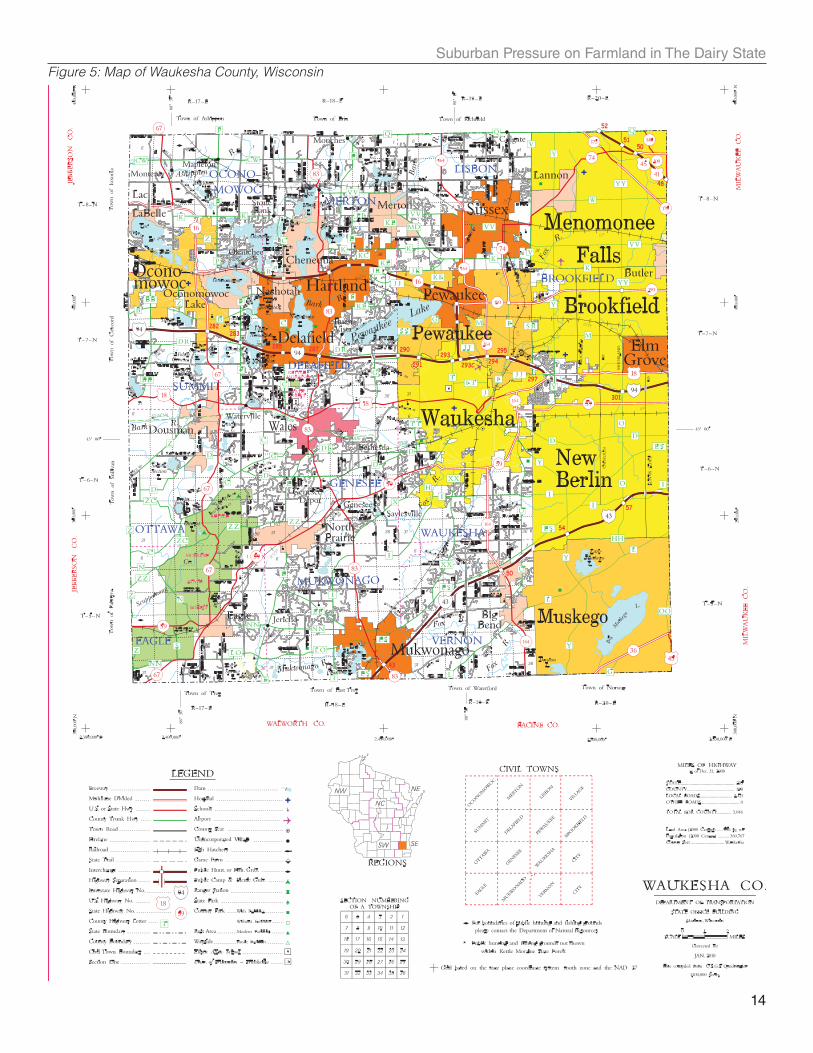
Waukesha and Jefferson Counties, which are adjacent to one another
(see Figure 2 next page and Appendix, Figures 5-6), are used to compare
the driving forces behind farmland conversion and preservation in the
state. These counties are selected because they are geographically
close, approximately the same size, and they feature similar agricultural
products, yet they are different in several ways that makes for an
interesting comparison. First, Waukesha County is a rapidly growing
suburban area within the Milwaukee-Racine Metropolitan Statistical Area
that is losing farmland while growing in population. Jefferson County,
on the other hand, isn’t losing farmland and isn’t growing in population as fast. Second, Waukesha County features
exceptional natural features including the Kettle Moraine and a plethora of freshwater lakes, both of which aren’t present in
Jefferson County. Finally, the counties value different things when it comes to farming and development. Jefferson County
has a long history of dairy farming, and values its agricultural characteristics very highly. Waukesha County, however, no
Figure 1: The number of acres converted from
agricultural land to developed land, 1982 to 2007.
Wisconsin is 14th in the nation.
State AcresTexas 2,869,600California 1,767,200Florida 1,550,700Arizona 925,700North Carolina 820,600Ohio 818,200Tennessee 791,000Pennsylvania 728,700Michigan 726,000Illinois 663,900Georgia 647,100Kentucky 618,000Colorado 605,200Wisconsin 520,500Indiana 503,100
Agricultural Land Converted to Developed Land
1982 to 2007
Suburban Pressure on Farmland in The Dairy State
3
Figure 2: Map of the State of Wisconsin Showing Counties. Jefferson and Waukesha Counties are highlighted in different
shades of blue.
DANE
GRANT
BAYFIELD
IOWA
ROCK
WOODJACKSON
PORTAGE
GREEN
BUFFALO WAUPACA BROWN
LAFAYETTE
OUTAGAMIE
WAUKESHA
WALWORTH
JEFFERSON
RACINE
KENOSHA
PRICE
CLARK
VILAS
POLK RUSK
ONEIDA
IRON
SAWYER
SAUK
DUNNMARATHON
DOUGLAS
FOREST
TAYLOR
MARINETTE(part)
DODGE
OCONTO
LINCOLNBARRON
ASHLAND(part)
MONROE JUNEAU
CHIPPEWA
ADAMS
VERNON
BURNETT
SHAWANO
LANGLADE
PIERCEDOOR(part)
COLUMBIA
ST. CROIX
WASHBURN
RICHLAND
FOND DU LAC
WAUSHARA
EAU CLAIRE
CRAWFORD
TREM
PEAL
EAU
MANITOWOC
WINNEBAGO
FLORENCE
LACROSSE
CALUMET
PEPIN
SHEB
OYGAN
MARQUETTE
WASHIN
GTON
KEWAU
NEE
GREENLAKE
MENOMINEE
OZAU
KEE
MILW
AUKE
E
DOOR(part)
ASHLAND(part)
MARINETTE(part)
MARINETTE(part)
0 50
Miles
Source: U.S. Bureau of the Census.Note: All boundaries and names are as of January 1, 2007.
Wisconsin State Boundary
County Boundary and NameNAME
Suburban Pressure on Farmland in The Dairy State
4
longer values its farming tradition as much as it once did and is now primarily interested in economic development in other
industries including light industry and healthcare.
Natural Features Overview
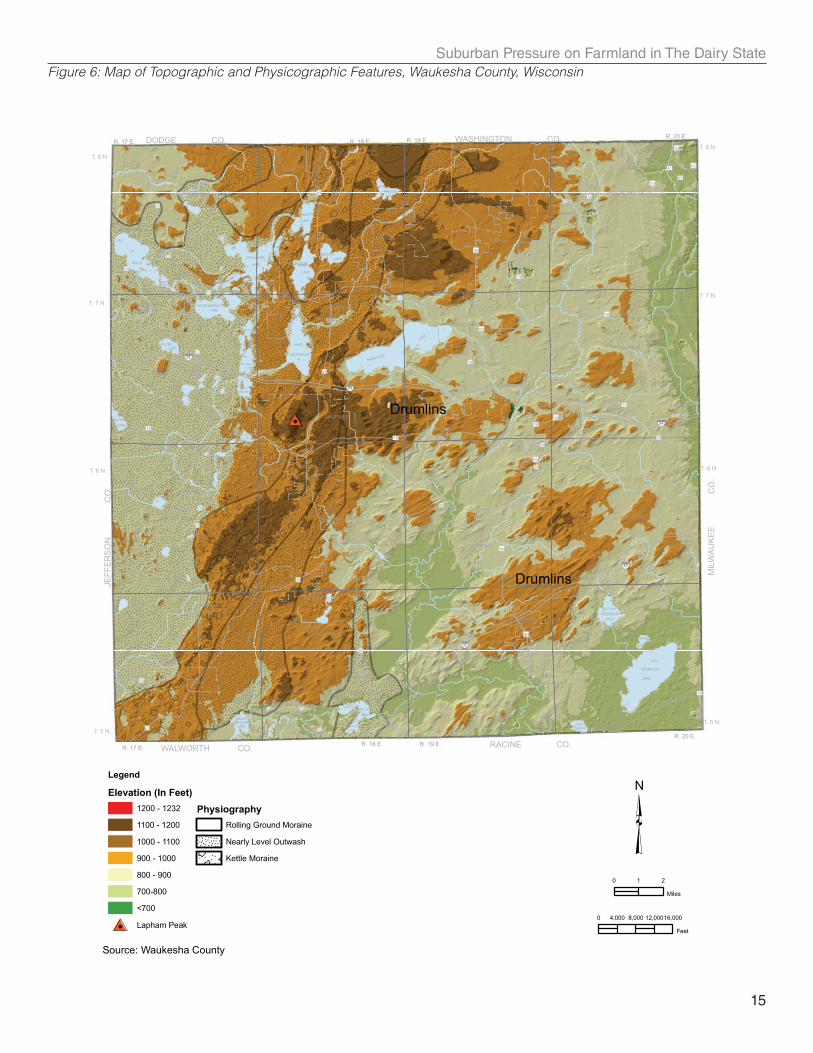
Southeast Wisconsin’s physiographic characteristics make it one of the richest agricultural centers in the world. Situated
in the interior plains physiographic region and the central lowlands physiographic province, Wisconsin features broad,
rolling hills composed of sedimentary rocks such as limestone, sandstone, and shale (Marsh, 2005). Four glacial periods,
the last of which occurred 10 thousand years ago, carved the landscape in southeast Wisconsin, and they left behind
freshwater lakes, moraines, drumlins, and deposits of high quality soil (see Appendix, Figure 7). Small freshwater lakes
dot the landscape of both Waukesha and Jefferson Counties, but Waukesha County has more. In fact, Waukesha County
has 33 lakes between 50 and 3,000 acres in size while Jefferson County has only seven lakes of similar size (Waukesha
County, 2005; Wisconsin DOT, 2010). In addition to the difference in number and size of freshwater lakes, Waukesha
County is home to the Kettle Moraine State Forest, which is a prominent geographic feature of wooded ridges and valleys
that flow from northeast to southwest through the western portion of the county.
The soils in both Waukesha and Jefferson are highly fertile, loess-based soils that are highly suitable for agricultural
production. In fact, 77 % of farmland in Waukesha County alone sits on soils designated as “national prime farmland” by
the Natural Resource Conservation Service (Waukesha County, 2005).
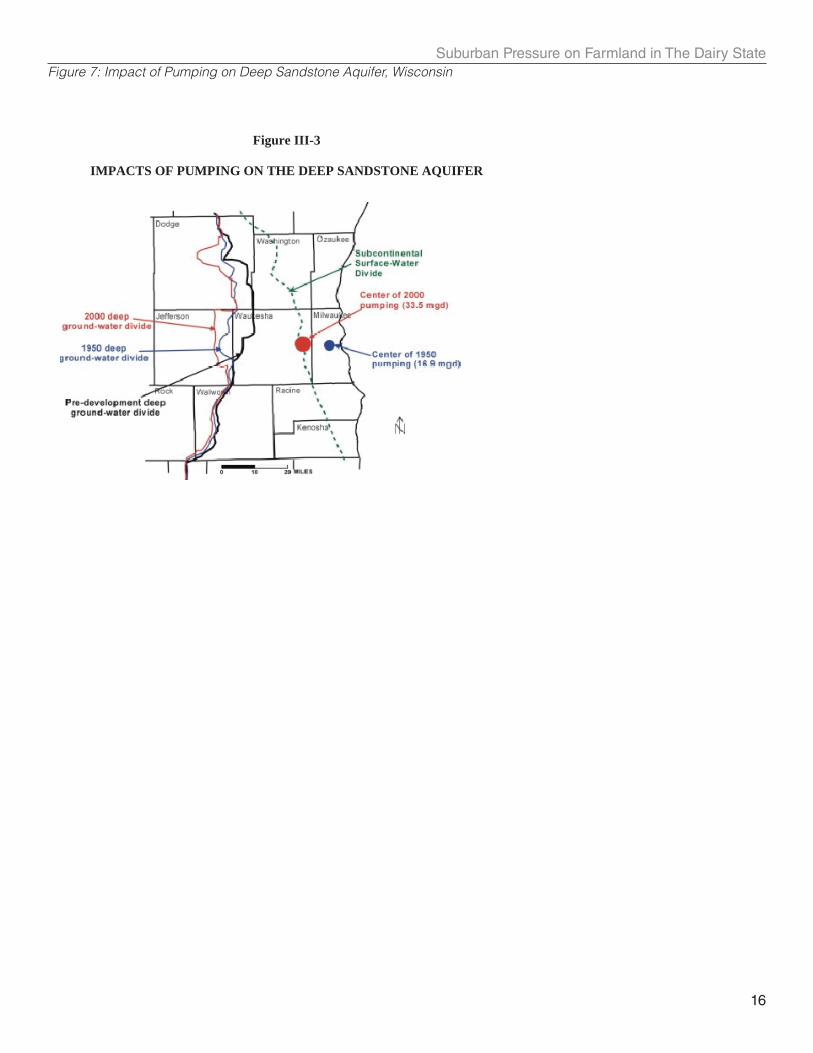
Despite both counties close relation to Lake Michigan, they sit within the Fox-Rock Rivers Watershed, so all surface water
flows west to the Mississippi River (the sub-continental surface water divide falls almost exactly on the border between
Waukesha and Milwaukee Counties) (Waukesha County, 2005). However, the counties do not share groundwater from the
same aquifer, and this may present a development challenge as the Great Sandstone Aquifer divide is shifting west into
Jefferson County as development intensity and water use increases in Waukesha County (see Appendix, Figure 8).
Agricultural Overview
Currently, 28% of land in Waukesha County is used for agricultural purposes while 69% of land in Jefferson County
is used for agricultural purposes (Waukesha County, 2005; Bollman, 2009). The entire state is 44% farmland (Stage
Suburban Pressure on Farmland in The Dairy State
5
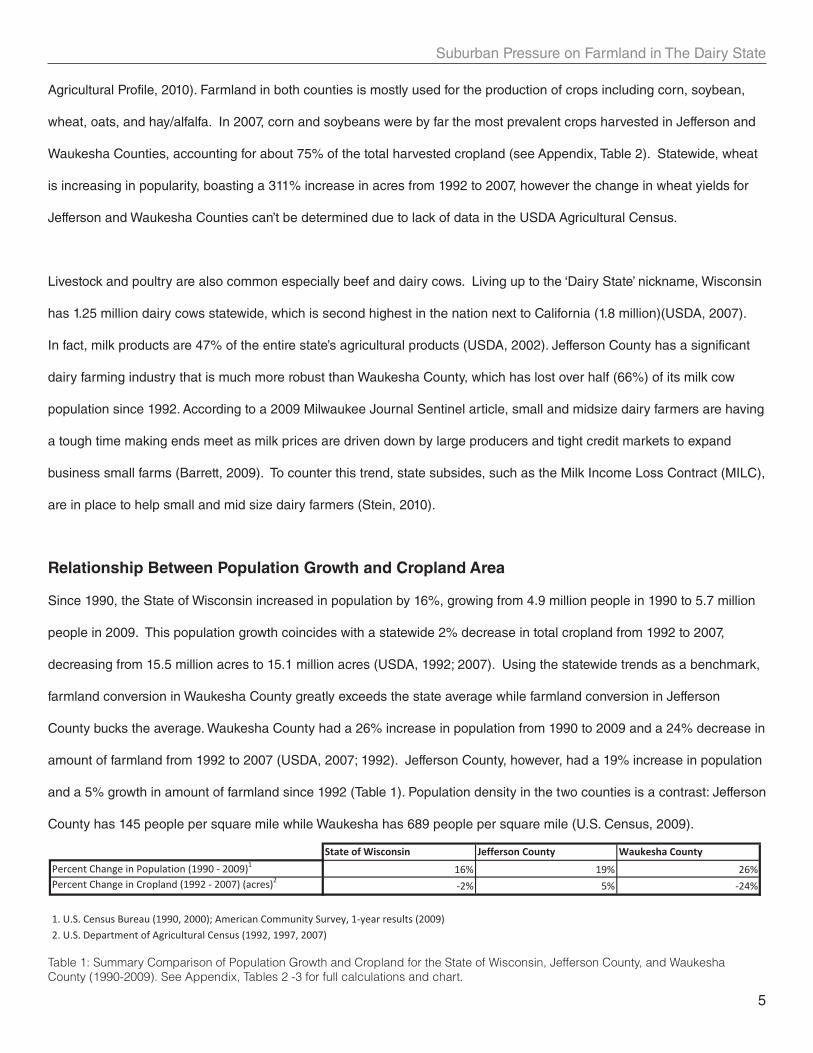
Agricultural Profile, 2010). Farmland in both counties is mostly used for the production of crops including corn, soybean,
wheat, oats, and hay/alfalfa. In 2007, corn and soybeans were by far the most prevalent crops harvested in Jefferson and
Waukesha Counties, accounting for about 75% of the total harvested cropland (see Appendix, Table 2). Statewide, wheat
is increasing in popularity, boasting a 311% increase in acres from 1992 to 2007, however the change in wheat yields for
Jefferson and Waukesha Counties can’t be determined due to lack of data in the USDA Agricultural Census.
Livestock and poultry are also common especially beef and dairy cows. Living up to the ‘Dairy State’ nickname, Wisconsin
has 1.25 million dairy cows statewide, which is second highest in the nation next to California (1.8 million)(USDA, 2007).
In fact, milk products are 47% of the entire state’s agricultural products (USDA, 2002). Jefferson County has a significant
dairy farming industry that is much more robust than Waukesha County, which has lost over half (66%) of its milk cow
population since 1992. According to a 2009 Milwaukee Journal Sentinel article, small and midsize dairy farmers are having
a tough time making ends meet as milk prices are driven down by large producers and tight credit markets to expand
business small farms (Barrett, 2009). To counter this trend, state subsides, such as the Milk Income Loss Contract (MILC),
are in place to help small and mid size dairy farmers (Stein, 2010).
Relationship Between Population Growth and Cropland Area
Since 1990, the State of Wisconsin increased in population by 16%, growing from 4.9 million people in 1990 to 5.7 million
people in 2009. This population growth coincides with a statewide 2% decrease in total cropland from 1992 to 2007,
decreasing from 15.5 million acres to 15.1 million acres (USDA, 1992; 2007). Using the statewide trends as a benchmark,
farmland conversion in Waukesha County greatly exceeds the state average while farmland conversion in Jefferson
County bucks the average. Waukesha County had a 26% increase in population from 1990 to 2009 and a 24% decrease in
amount of farmland from 1992 to 2007 (USDA, 2007; 1992). Jefferson County, however, had a 19% increase in population
and a 5% growth in amount of farmland since 1992 (Table 1). Population density in the two counties is a contrast: Jefferson
County has 145 people per square mile while Waukesha has 689 people per square mile (U.S. Census, 2009).
Table 1: Summary Comparison of Population Growth and Cropland for the State of Wisconsin, Jefferson County, and Waukesha
County (1990-2009). See Appendix, Tables 2 -3 for full calculations and chart.
State of Wisconsin Jefferson County Waukesha CountyPercent Change in Population (1990 2009)1 16% 19% 26%Percent Change in Cropland (1992 2007) (acres)2 2% 5% 24%
1. U.S. Census Bureau (1990, 2000); American Community Survey, 1 year results (2009)2. U.S. Department of Agricultural Census (1992, 1997, 2007)
Suburban Pressure on Farmland in The Dairy State
6
Drivers of Conversion
Waukesha County’s farmland is being disproportionately converted into new developments because of three primary
reasons: local planning regulations that encourage wasteful land use, inter-jurisdictional competition for property tax
revenue, and a private-market based demand of higher-income earners wishing to live in Wisconsin’s Lake Country. As is
true with many counties on the fringe of large metropolitan regions, suburban fringe expansion is enabled and regulated
by local planning practices including transportation planning and zoning ordinances that don’t include or prioritize the
protection of agricultural land. In many instances, the 37 local jurisdictions (towns, villages, cities) within Waukesha
County have one half or one acre minimum lot requirements (SEWRPC, 2005). As noted by American Farmland Trust,
“wasteful land use is the problem [with losing farmland], not growth itself” (Farming on the Fringe, 2010). Also, many local
jurisdictions are competing against one another for property tax revenue from new development. Both of these elements
– zoning regulations and tax revenue – are motives behind the controversial and gigantic Pabst Farms development in the
City of Oconomowoc, a city of 13,000 people in western Waukesha County.
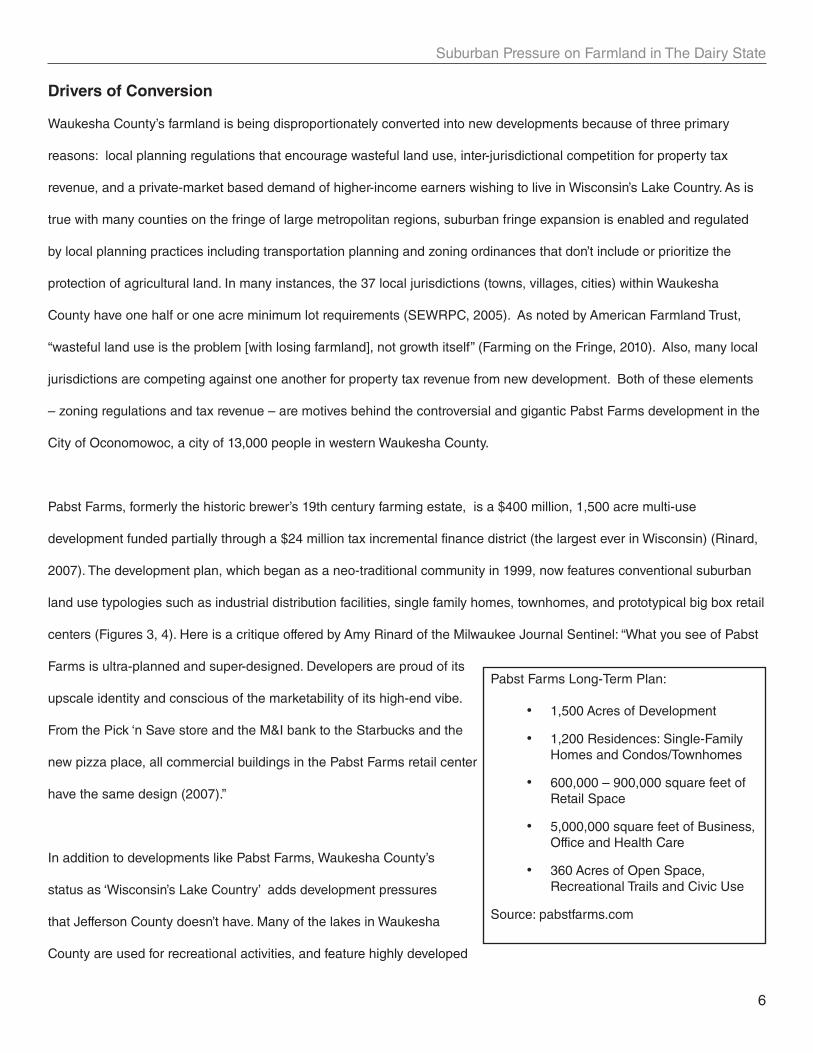
Pabst Farms, formerly the historic brewer’s 19th century farming estate, is a $400 million, 1,500 acre multi-use
development funded partially through a $24 million tax incremental finance district (the largest ever in Wisconsin) (Rinard,
2007). The development plan, which began as a neo-traditional community in 1999, now features conventional suburban
land use typologies such as industrial distribution facilities, single family homes, townhomes, and prototypical big box retail
centers (Figures 3, 4). Here is a critique offered by Amy Rinard of the Milwaukee Journal Sentinel: “What you see of Pabst
Farms is ultra-planned and super-designed. Developers are proud of its
upscale identity and conscious of the marketability of its high-end vibe.
From the Pick ‘n Save store and the M&I bank to the Starbucks and the
new pizza place, all commercial buildings in the Pabst Farms retail center
have the same design (2007).”
In addition to developments like Pabst Farms, Waukesha County’s
status as ‘Wisconsin’s Lake Country’ adds development pressures
that Jefferson County doesn’t have. Many of the lakes in Waukesha
County are used for recreational activities, and feature highly developed
Pabst Farms Long-Term Plan:
• 1,500 Acres of Development
• 1,200 Residences: Single-Family Homes and Condos/Townhomes
• 600,000 – 900,000 square feet of Retail Space
• 5,000,000 square feet of Business, Office and Health Care
• 360 Acres of Open Space, Recreational Trails and Civic Use
Source: pabstfarms.com

Suburban Pressure on Farmland in The Dairy State
7
shorelines including single family residences and some farmland perimeters. This desirable land amenity comes at a
cost however. Since lakeside development began in the 1950s (and drastically increased in the 1980s), the use value
of agricultural land in the county became far less than its market value, and, due to a lack of preservation controls at the
local level, development patterns in the county rapidly consumed farmland for developing year-round lake homes and
complimentary commercial services.
Drivers of Preservation
In an effort to combat farmland conversion, legislative action and incentive programs are now in place at both the state
and county level to preserve agricultural land especially prime land. The following is a summary of two main preservation
programs, one at the state and level and one at the county level.
Wisconsin Working Lands Initiative
The goal of the Working Lands Initiative is to preserve agriculturally significant areas of land through the implementation
of three components: expand and modernize the State’s Farmland Preservation Program, establish Agricultural Enterprise
Areas (AEAs), and develop the Purchase of Agricultural Conservation Easement Grant Program (PACE) (Wisconsin
DATCP, 2009). The initiative was renewed for the 2009-2011 biennial state budget. The Farmland Preservation Program
offers state income tax credits to farmers for preserving farmland that is within a special zoning district, which is
determined through a county-wide farmland preservation plan, and collects a flat fee per acre conversion when land within
the special zoning district is re-zoned to another use. In 2009, new minimum zoning standards were created to increase
Figure 3, 4: The Commerce Centre (left) and Health and Wellness Center (right) of the new Pabst Farms development in
Waukesha is evidence of the priority local government place on suburban style growth over farmland preservation.
Suburban Pressure on Farmland in The Dairy State
8
local flexibility and reduce land use conflicts, and the state drafted a model farmland preservation zoning text ordinance
for local jurisdictions to adopt. Also, the program, which is growing in popularity around the state, was simplified by
streamlining state oversight (DATCP, 2009).
The second component, establishing AEAs, seeks to maintain large areas of contiguous land primarily in agricultural use
and reduce land use conflicts by designating areas that are eligible to receive special tax credits. This program, which
is property owner volunteer-based, is currently in the pilot phase, and 12 AEAs that cover 200,000 acres are currently
designated by the Wisconsin Department of Agriculture, Trade, and Consumer Production (DATCP, 2009). All 12 pilot AEAs
will go into effect in January 2011.
The third component of the Working Lands Initiative is the PACE Program. This program provides state funding to
purchase conservation easements through a direct grant to local entities such as local governments and non-profit
organizations. This program is very similar to the purchase of development rights (PDR) programs, but it operates at the
state level and is used in conjunction with the Farmland Preservation Program and must be applied to farmland highlighted
in county farmland preservation plans (DATCP, 2009). The PACE program has preserved 5,000 acres of farmland in its first
round of funding in 2009.
Waukesha County Transfer of Development Rights (TDR) Program
In a response to Waukesha County’s 24% decrease in cropland in 15 years and a growing concern over groundwater
resource levels, the county instituted a transfer of development rights (TDR) program in 2005. A TDR program is a
volunteer, incentive-based program that allows landowners to sell development rights from their land to a developer
or other party who can use the rights to increase the density of development in another location (Center for Land Use
Education, 2005). This mechanism is a way to permanently protect farmland in targeted areas such as areas of prime
agriculture (‘sender zones’). In Waukesha County, increased density is permitted in designated areas that have municipal
services. These targeted areas (‘receiver zones’) are regulated based on use and bulk of the development and proposed
developments must be approved by the Town Planning Commission and the County Zoning Agency before it is approved
(2005). The prime agricultural areas must be at least 20 acres of contiguous area and must be zoned as Agricultural
Density – 10 (AD-10), which sets a maximum density of one unit per 10 acres (Zoning Ordinance, 2010).
Suburban Pressure on Farmland in The Dairy State
9
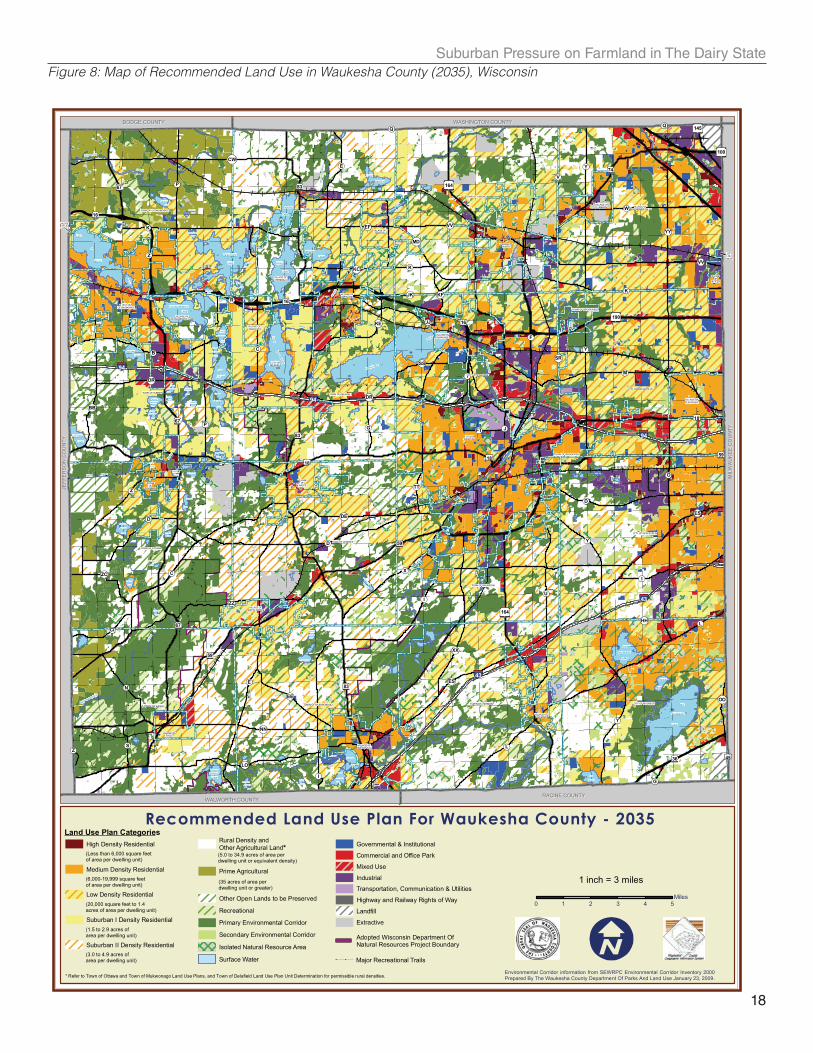
The Waukesha TDR ordinance has been in place for over three years and information about the program is readily
available, but evidence of quantifiable progress isn’t easy to find, which may be due to the lack of progress with this
program. The Waukesha County Comprehensive Development Plan, created in 2009, barely mentions the TDR program
(Chapter 7, page 44), and the plan’s land use in 2035 map (see Appendix, Figure 6) features very little prime agricultural
land (2.8% of total land area) and some “rural density and other agricultural land” (11.9% of total land area) (Waukesha
County, 2005). All together that is 14.5% of the total land (556 square miles) in the county. In 2005, that number was
28%. Given the difficulty in finding results of the TDR program and the dearth of information about TDR in the county’s
comprehensive plan, it seems that the TDR program isn’t a significant program in the county.
Conclusion
Today, the challenges to preserve farmland are fleeting at best in Waukesha County due to its focus on economic
development and population growth structured by suburban regulatory models. The pressures of developments like Pabst
Farms and the high demand of lakefront living are at the forefront of suburban pressures to convert farmland. While the
TDR program is in place, it doesn’t seem to be working very effectively, and the comprehensive plan doesn’t emphasize
farmland preservation over competing interests such as job growth, housing expansion, and transportation infrastructure
improvements. Jefferson County seems to be much better off in terms of preserving its agricultural land as it has far less
suburban development pressure, and a certain amount of pride in its agricultural character (Bollman, 2009). However,
it too, has a lack of regulatory controls and preservation efforts to prohibit farmland conversion when new developments
do occur. The state programs are promising and have potential to guide change. However, the programs are in the early
stages of implementation and they cost money at a time when the state is facing a biennial budget deficit of $3.1 billion for
the 2011-2013 budget years (Stein, 2010). Future leadership at the state and local level will need to value farmland in order
to save it in both counties.
Suburban Pressure on Farmland in The Dairy State
10
Works Cited
Bollman, J. (2009). Jefferson County – Overview of Agriculture. UW-Extension Jefferson County. Retrieved online October
19, 2010 from www.jeffersoncountywi.com
Barrett, R. (2009, Jan 21). Falling Milk Prices Hurt Dairy Farms. Milwaukee Journal Sentinel. Retrieved October 20,2010
from www.jsonline.com
Center for Land Use Education. (2005). Planning Implementation Tools Transfer of Development Rights (TDR). University
of Wisconsin Stevens Point Land Center. Retrieved online October 19, 2010 from www.uwsp.edu/cnr/landcenter/
Farming on the Fringe. (2010). American Farmland Trust. Retrieved October 14, 2010 from www.farmland.org
Marsh, W. (2005). Landscape Planning: Environmental Applications (4th ed.). New York: Wiley and Sons.
National Resource Conservation Services (NRCS). (2007). 2007 NRI: Changes in Land Cover/Use – Agricultural Land.
Retrieved online October 14, 2010, from www.farmlandinfo.org
Rinard, A. (2007, Oct 6). Is Pabst Farms a City Unto Itself? Milwaukee Journal Sentinel. Retrieved October 20, 2010 from
www.jsonline.com
Southeast Wisconsin Regional Planning Commission (SEWRPC). (2005). A Regional Land Use Plan for Southeastern
Wisconsin: 2035. Retrieved online October 14, 2010, from www.sewrpc.org/SEWRPC/LandUse.htm
State Agricultural Profile – Wisconsin. (2010). American Farmland Trust. Retrieved online October 21, 2010, from www.
farmland.org/resources/profiles/state
Stein, J. (2010, Oct 1). Johnson Speaks in Favor of Farm Subsidies. Milwaukee Journal Sentinel. Retrieved October 20,
2010 from www.jsonline.com
Stein, J. (2010, Sept 22). Projections of State Budget Deficit Grow. Milwaukee Journal Sentinel. Retrieved online October
21, 2010 from www.jsonline.com
U.S. Department of Agriculture (USDA). (2007). Census of Agriculture. Vol. 1, Chap. 2. Retrieved online October 8, 2010,
from www.agcensus.usda.gov
U.S. Department of Agriculture (USDA). (2002). U.S Summary and State and County Reports. Retrieved online October
8, 2010, from www.agcensus.usda.gov
U.S. Department of Agriculture (USDA). (1992). Census of Agriculture: State and County Highlights. Retrieved online
October 18, 2010, from www.agcensus.usda.gov

Suburban Pressure on Farmland in The Dairy State
11
U.S. Bureau of the Census (2000). Census 2000 Summary File 1 (SF 1) 100-Percent Data. Detailed tables. Retrieved
online October 14, 2010, from www.factfinder.census.gov
U.S. Bureau of the Census (1990). Census 1990 Summary Tape File 1 (STF 1) 100-Percent Data. Detailed tables.
Retreived online October 14, 2010, from www.factfinder.census.gov
U.S. Bureau of the Census (2009). American Community Survey, 1-year Estimates. Detailed tables. Retrieved online
October 14, 2010, from www.factfinder.census.gov
Waukesha County. (2005). A Comprehensive Development Plan for Waukesha County. Chapters 2, 3, 7. Retrieved online
October 14, 2010, from www.waukeshacounty.gov.
Wisconsin Department of Agrictulture, Trade, and Consumer Protection (DATCP). (2010). Working Lands Program
Information. Retrieved online October 19, 2010 from http://datcp.state.wi.us/workinglands
Image Credits:
Figure 1: NCRS
Figure 2: State of Wisconsin with Counties, U.S. Department of Agriculture
Figure 3: Commerce Center at Pabst Farms, www.pabstfarms.com
Figure 4: Health and Wellness Campus at Pabst Farms, www.pabstfarms.com
Figure 5: Jefferson County, Wisconsin Department of Transportation
Figure 6: Waukesha County, Wisconsin Department of Transportation
Figure 7: Phsiographic Map of Waukesha County, Waukesha County
Figure 8: Groundwater Divide Location Map, Waukesha County
Figure 9: Recommended Land Use in Waukesha County in 2035, Waukesha County
Cover image: Woelfel Family Farm, Town of New Berlin, Waukesha County, Wisconsin
source: bing.com/maps
Appendix
Figures 4 - 8
Suburban Pressure on Farmland in The Dairy State
13
Figure 4: Map of Jefferson County, Wisconsin
Suburban Pressure on Farmland in The Dairy State
14
Figure 5: Map of Waukesha County, Wisconsin
Suburban Pressure on Farmland in The Dairy State
15
FLORENCELAKE
LITTLE
PINE
SILVER
SAYLESVILLE
MILL POND
MILL POND
UTICA
LARKIN
SPRING LAKE
LA
RIVER
RIVER
RIVER
RIVER
RIVER
RIVERRI
VER
RIVER
RIVER
MONTEREY
RIVER
RIVER
EAGLESPRING
BELLE
WATERVILLE
MIDDLE
SECTION
GARVIN
LAKE
LAKE
LAKE
LAKE
LAKE
LAKE
LAKE
LAKE
LAKE
LAKE
LAKE
LAKE
LAKE
LAKE
LAKE
LAKE
LAKE
LAKELAKE
LAKE
LAKE
LAKE
LAKE
LAKE
LAKE
LAKE
LAKE
LAKE
LAKE
LAKE
LAKE
LAKE
LAKE
FOWLERLAKE
MUKWONAGO
LAKE
LAKE
LAKE
LAKE
LAKE
LAKE
LAKE
LAKE
LAKE
LAKELAKE
LAKE
SPRING
ASHIPPUN
BAY
SPRINGS
SPRINGS
LAC
PRETTY
NEMAHBIN
UPPER
NEMAHBIN
BASS
BEAVER
CORNELL
FOREST
WILLOW
KEESUS
NAGAWICKA
BARKBARK
BARK
RAINBOW
FOX
FOX
FOX
TAMARACK
NASHOTAH
NASHOTAH
UPPER
UPPER
UPPER
HUNTERS
GENESEE
GENESEE
GENESEE
OTTAWA
OKAUCHEE
GOLDEN
SCHOOL
PEW
AU
KEEPEWAUKEE
NORTH
DUCK
DUTCHMANS
PHANTOM
PHANTOM
SCUPPERNONG
REAGONS
MERTON
LAKE
CROOKED
MUSKEGO
MUSKEGO
DENOON
LOWER
LOWER
LOWER
LOWER
MENOM
ONEE
MOOSE
GRASS
BOWRON
OCONOMOWOC
WOOD
ASHIPPUN
BARK
BIG
RIVER
OC
ON
OM
OW
OC
RIVER
ROSENOW CREEK
MAS
ON
CREEK
OC
ON
OM
OW
OC
RIV
ER
OCO
NOM
OW
OC RIVER
OCONOMOWOC RIVER
BATTLE
CREEK
CREEK
SCUPPERNONG
WALESCREEK
CREEKSPRINGS
SPRINGS
MCKEWEAN
PARADISE
CREEK
CR
EE
KJE
RIC
HO
SPRIN
G
CREEK
CREEK
SPR
ING
GENESEE CREEK
CREEK
CR
EEK
WH
ITE
BRAN
DY
BRO
OK
PEBB
LE
AUDLEY
CREEK CREEKZION
MEADOWBROOK CREEK
E BR COCO CREEK
W BR COCO CREEKLI
TTLE
LANNON
CREEK
CREE
K
WILLOW
SUSSEX
CREEK
SARA
TOG
A
MILL
PEBBLE
BROO
K
REDWING
CREEK
CREEK
Mill
Brook
HO
RSESH
OE
BRO
OK
KRUEGER
BROO
K
ARTESIAN BROOK
MU
SKEGO
CREEK
CORNERS CREEK
TESS
HALESCORNERSCREEK
POPLAR CREEK
DEER CREEK
UN
DER
WO
OD
CR
EEK
UNDERWOOD CREEK
S BR
DO
USM
AN
DIT
CH
DIT
CH
BUTLER
LILL
Y C
REE
K
NOR-X-WAYCHANNEL
SCHOOL SECTION
DITCH
BEAVERDAMLAKE
MILL PONDMENOMONEE
PARKPOND
BEULAH
LAKE
OUTLET
RIPPLE
CREEK
OC
ONOMOWOC RIVER
CRYSTAL
LAKE
FRAMEPARK
CREEK
TIERNEYLAKELAKE
OCONOMOWOCUPPER
MONCHES
MILLPOND
HENRIETTALAKE
LAKEBROWN
ROXYPOND
POND
PARK
MUKWONAGO
ETTER
LAKE
BIG BENDPOND
POND
FOUNDATIONNORRIS
LOWER
KELLYLAKE
UPPER
LAKEKELLY
SPAHNLAKELAKE
BUTH
APPLEBECKER
MILLPOND
LAKE
FIVE
LAURALAKE
LAKE
SYBIL
EGGLAKE
SCUPPERNONG
CREEKPOND
HOGANLAKE
LINIE LAC
VERNON
MUKWONAGO
BIG BEND
OTTAWA
OCONOMOWOC
GENESEE
OCONOMOWOC
SUMMIT
LISBONMERTON
EAGLE
MILWAUKEE
BUTLER
ELM GROVE
NEW BERLIN
LANNON
BROOKFIELD
MENOMONEE FALLS
BROOKFIELD
MUSKEGO
SUSSEX
WAUKESHA
WAUKESHA
PEWAUKEE
MUKWONAGO
DELAFIELD
HARTLAND
WALES
CHENEQUA
DELAFIELD
NORTH PRAIRIE
EAGLE
LAC LA BELLE
PEWAUKEE
Nashotah
Dousman
MERTON
Æ%59
£¤18
Æ%145
Æ%164
Æ%164
Æ%164
Æ%190
Æ%190
Æ%100
Æ%164
Æ%164
Æ%175
£¤45
§̈¦43
Æ%36
£¤41
Æ%67
£¤45
Æ%74
§̈¦94
Æ%16
Æ%16
Æ%67
Æ%67
Æ%67
Æ%59
Æ%59
Æ%59
Æ%59
Æ%83
Æ%83
Æ%16
Æ%16
§̈¦94
§̈¦43
§̈¦94
£¤18
£¤18
£¤18
Æ%83
Æ%59
Æ%74
#0
Drumlins
Drumlins
RACINE CO.WALWORTH CO.R. 17 E.
R. 18 E. R. 19 E.
R. 20 E.
JE
FF
ER
SO
N
C
O.
T. 5 N.
T. 6 N.
T. 7 N.
T. 8 N.
DODGE CO. WASHINGTON CO.
MIL
WA
UK
EE
C
O.
R. 17 E. R. 18 E. R. 19 E.R. 20 E.
T. 8 N.
T. 7 N.
T. 6 N.
T. 5 N.
³0 1 2
Miles
0 4,000 8,000 12,00016,000
Feet
Source: Waukesha County
Legend
Elevation (In Feet)
1200 - 1232
1100 - 1200
1000 - 1100
900 - 1000
800 - 900
700-800
<700
#0 Lapham Peak
Physiography
Rolling Ground Moraine
Nearly Level Outwash
Kettle Moraine
Figure 6: Map of Topographic and Physicographic Features, Waukesha County, Wisconsin
Suburban Pressure on Farmland in The Dairy State
16
Figure III-3
IMPACTS OF PUMPING ON THE DEEP SANDSTONE AQUIFER
Figure 7: Impact of Pumping on Deep Sandstone Aquifer, Wisconsin

Suburban Pressure on Farmland in The Dairy State
17
Table2:Ag
riculturalCen
susC
ompa
rison
Betw
eenStateof
Wisconsin,and
Jeffe
rson
andWau
keshaCo
untie
s,Wisconsin(199
2,19
97,200
7)
1992
1997
2007
PercentC
hang
e19
9219
9720
07PercentC
hang
e19
9219
9720
07PercentC
hang
e
Num
bero
fFarms
67,959
65,602
78,463
15%
1,28
01,24
01,43
412
%69
163
067
52%
Land
inFarm
s(acres)
15,463
,551
14,900
,205
15,190
,804
2%23
2,59
124
2,30
124
4,23
85%
1141
8410
5,60
886
,606
24%
TotalCropland
10,948
,614
10,353
,300
10,116
,279
8%18
9,25
119
9,63
519
0,18
90%
9644
188
,063
69,445
28%
Harvested
8,84
3,64
98,62
5,01
18,88
4,62
80%
158,61
817
6,70
017
2,00
08%
8259
377
,514
62,435
24%
Totalvalue
offarm
sales(dollars)
$5,259
,670
,000
$5,579
,861
,000
$8,967
,358
,000
70%
$106
,270
$131
,266
,000
$209
,294
.00
97%
$44,00
5,00
0$4
2,09
9,00
0$4
5,24
3,00
03%
Valueof
farm
salesp
eracre
$77,39
5$8
5,05
6.00
$114
,288
.00
48%
$83,02
3$1
05,860
.00
$145
,951
.00
76%
$63,68
4.00
$66,82
3.00
$67,02
7.00
5%
Selected
Crop
sHarvested
(acres)
Corn
forg
rain
2,83
0,49
62,87
7,97
13,25
0,84
715
%70
,107
71,015
84,650
21%
3832
231
,508
28,520
26%
Corn
forsilage
937,34
671
7,54
973
2,63
622
%10
,134
9,54
98,37
817
%42
733,06
21,37
068
%Whe
at68
,241
150,46
928
0,46
431
1%NA
NA
5,18
5NA
NA
2,46
3Oats
488,33
231
4,72
216
6,79
466
%5,42
43,04
91,27
277
%26
201,64
843
084
%Soybeans
575,08
799
0,53
11,36
3,12
413
7%22
,999
43,038
40,458
76%
11,464
21,699
16,688
46%
Potatoes
78,231
85,304
NA
1,03
31,75
0NA
with
held
10NA
Hay
3,91
1,25
83,55
4,93
2NA
61,174
39,379
NA
2048
815
,146
NA
Vegetables
347,58
127
0,13
0NA
5,35
54,30
2NA
3850
2,72
6NA
LivestockandPo
ultry(num
ber)
Beef
Cows
195,81
022
2,52
226
9820
38%
1,95
52,20
82,63
435
%1,05
094
01,01
14%
Milk
Cows
1,52
1,96
91,33
6,62
612
4930
918
%19
,801
16,087
14,669
26%
7,29
04,57
32,45
666
%Ho
gsandPigs
1,17
3,78
373
8,33
943
6814
63%
21,635
13,199
7,43
566
%4,66
41,46
687
381
%SheepandLambs
84,956
76,113
8957
55%
1,36
299
91,30
44%
1,00
595
958
742
%
Stateof
Wisconsin
Jeffe
rson
Coun
tyWau
keshaCo
unty
1990
2000
2009
Percent
Chan
ge(199
020
09)
1990
2000
2009
Percent
Chan
ge(199
020
09)
1990
2000
2009
Percent
Chan
ge(199
020
09)
TotalPop
ulation
4891
769
5,36
3,67
55,65
4,77
416
%67
,783
74,021
80,833
19%
304,71
536
0,76
738
3,15
426
%
TotalH
ouseho
lds
1822
118
2084
544
2272
274
25%
24,019
28,205
30,603
27%
105,99
013
5,22
915
1,20
343
%
Density
(peo
ple/sq.mi.)
7582
8616
%12
213
314
519
%54
864
968
926
%
Source:U
.S.Cen
susB
ureau,(199
0,20
00De
cinn
ialCen
sus)
Source:U
.S.Cen
susB
ureau,20
09Am
erican
Commun
itySurvey
Wisconsin
Jeffe
rson
Wau
kesha
Table3:Po
pulatio
nan
dHo
useh
oldCh
ange
forS
tate
ofWisconsin,Jefferson
andWau
keshaCo
untie
s,Wisconsin(199
7,20
07)
Tables 2 and 3
Suburban Pressure on Farmland in The Dairy State
18
Surface Water
1 inch = 3 miles
4 2 153
4
3
5
1
2
2
514
2
3 1
45
1
6
3
5
5
2
45
5
1
1
2
3
4
4
3
9
3
6
2
8
9
4
1
6
6
1
5
8
2 1
34
5
1
6
1
6
2
2
3
6
3
3
2
7
6
4
6
4
7
5
9
8
9
2
9
9
8
8
9
6
7
8
8
6
8
9
1
4
8
4
9
9
9
4
8 9
25
3
6
9
9
5
7
4
3
6
8
8 9
5
6
6
8
7
8
1
9
8
3
8
2
7
7
4
7
3
7
53
12
7
5
7
7
7
7
6
2 1
77
21
15
25
20
31
13
24
22
30
21
32
20
29
15
29
33
28
10
21
17
12
34
17
19
20
11
27
23
29
29
32
31
17
20
22
34
18
16
24
14
28
12
28
10
14
16
14
17
25
22
11
33
17
25
2321
33
11
24
36
13
21
13
28
12
35
11
28
32
22
21
36
16
10
20
32
28
24
36
12
12
26
27
16
24
23
13
15
25
30
12
17
36
18
25
26
31 33
22
34
10
21
34
15
14
35
28
13
28
13
14
11
25
26
17
23
11
15
21
35
22
22
15
26
21
35
22
10
15
25
19
13
24
36
17
22
15
23
29
25
23
22
34
10
27
12
35
36
12
12
33
25
35
28
23
32
33
13
10
15
32
24
27
35
33
34
24
35
12
29
32
28
27
33
11
36
24
12
28
20
32
13
33
10
29
35
24
27
29
33
23
32
33
23
14
25
32
16
29
17
20
26
29
12
34
13
33
24
32
21
14
16
24
26
20
26
33
36
16
27
35
28
33
23
13
36
16
26
10
15
26
14
17
32
15
36
20
13
34
34
29
21
34
10
27
25
14
27
35
15
22
26
36
19
36
34
11
27
35
12
14
27
11
22
10
34
20
11
16
36
27
23
36
21
34
14
10
32
29
33
16
25
32
34
13
26
18
18
20
22
26
32
11
3532
15
17
15
21
30
24
16
18
36
27
2725
20
19
11
29
23
34
35
24
22
16
28
17
13
17
10
30
23
29
22
19
26
12
22
29
21
10
36
28
10
31
20
11
18
23
27
26
16
19
25
20
23
30
12
10
17
13
30
25
24
31
14
26
16
18
25
17
14
20
13
18
14
21
26
15
14
15
16
29
24
28
11
19
35
21
17
11
27
30
31
34
19
14
16
23
35
18
31
20
31
31
33
31
30
11
28
30
31
31
19
30
12
31
19
18
30
31
18
19
31
30
31
30
1919
30
18
30
18
19
18
30
19
18
19
18
CAN
AL
FLORENCELAKE
LITTLE
SILVER
SAYLESVIL L E
M IL L PO N D
MIL L PO
ND
LARKIN
SPRING LAKE
LA
RIVER
RIVER
RIV
ER
RIVER
RIVER
RIVE
R
RIVER
RIVER
EAGLESPRING
BELLE
WATERVILLE
MIDDLE
SECTION
LAKE
LAKE
LAKE
LAKE
LAKE
LAKE
LAKE
LAKE
LAKE
LAKE
LAKE
LAKE
LAKELAKE
LAKE
LAKE
LAKE
LAKE
LAKE
LAKE
LAKE
LAKE
LAKE
LAKE
LAKE
LAKE
LAKE
LAKE
LAKE
LAKE
LAKE
LAKE
LAKE
LAKE
LAKE
SPRING
BAY
SPRINGS
SPRINGS
LAC
PRETTY
NEM AHBIN
NEM AHBIN
BASS
BEAVER
WILLOW
KEESUS
BARK
BARK
BARK
RAINBOW
FOX
FOX
FOX
TAM ARACK
NASHOTAH
NASHOTAH
UPPER
UPPER
UPPER
UPPER
HUNTERS
GENESEE
GENESEE
GENESEE
OTTAWA
OKAUCHEE
GOLDEN
SCHOOL
PEW
AUKE
E
NORTH
DUCK
PHANTOM
PHANTOM
SCUPPERNONG
FO
WL
ER
M ERTO N
POND
CROOKED
MUSKEGO
MUSKEGO
DENOON
LOWER
LOWER
LOWER
LOWER
MOOSE
BOWRON
WOOD
ASHIPPUN
BARK
BIG
RIVER
OC
ON
OM
OW
OC
RIVER
GRASS
LAKELAKE
FOREST
LA KE
LAKE
LAK
ENAG
AWICK
A
LAKE
OCONOMOWOC
RIVE
R
UTICA
LAKE
LAKE
ASHIPPUN
LAKE
MAPLETON
LAKE
CORNELL
PINEGARVIN
LAKE
REAGONS
RIV ER
M UK WO N AG O
PEWAU KEE
LAKE
MEN
OMON
EE
RIV ER
DUTCHMAN
New Berlin Recreat ion Trail
18
1818
4536
67
16
83
83
164
145
59
59
59
83
164
74
67
16
100
190
67
16
E
FT
Q
SS
L
G
EF
SR
ES
O
Y
C
P
Z
Z
K
Y
R
KE
D
F
XX
N
ZZ
C
M
L
BB
G
KC
U
KF
W
JK
D
ES
Y
P
X
EEOO
TT
Y
V
DR
Q
NN
DE
YY
VV
I
CW
B
I
JJ
K
MD
K
HH
VV
CI
D
S
LO
T
E
J
I
DR
Z
ZC
43
94
94
94
43
Recommended Land Use Plan For Waukesha County - 2035Recommended Land Use Plan For Waukesha County - 2035
0 1 2 3 4 5Miles
Environmental Corridor information from SEWRPC Environmental Corridor Inventory 2000Prepared By The Waukesha County Department Of Parks And Land Use January 23, 2009.
Land Use Plan Categories
Medium Density Residential
Low Density Residential
Suburban I Density Residential
Suburban II Density Residential
Other Open Lands to be Preserved
Prime Agricultural
Primary Environmental Corridor
Secondary Environmental Corridor
Isolated Natural Resource Area
Transportation, Communication & Utilities
Extractive
Industrial
(Less than 6,000 square feetof area per dwelling unit)
High Density Residential
(6,000-19,999 square feetof area per dwelling unit)
(20,000 square feet to 1.4acres of area per dwelling unit)
(1.5 to 2.9 acres ofarea per dwelling unit)
(3.0 to 4.9 acres ofarea per dwelling unit)
(5.0 to 34.9 acres of area perdwelling unit or equivalent density)
(35 acres of area perdwelling unit or greater)
Commercial and Office Park
Governmental & Institutional
Landfill
Mixed Use
Recreational
Adopted Wisconsin Department OfNatural Resources Project Boundary
DODGE COUNTYDODGE COUNTY WASHINGTON COUNTYWASHINGTON COUNTY
WALWORTH COUNTYWALWORTH COUNTYRACINE COUNTYRACINE COUNTY
MIL
WA
UK
EE
CO
UN
TY
MIL
WA
UK
EE
CO
UN
TY
JE
FF
ER
SO
N C
OU
NT
YJE
FF
ER
SO
N C
OU
NT
Y
CITY OF MUSKEGO
CITY OF NEW BERLIN
CITY OF BROOKFIELD
VILLAGE OF MENOMONEE FALLS
VILLAGE OF LANNON
VILLAGEOF
BUTLER
CITYOF
MILW.
VILLAGE OF SUSSEX
VILLAGE OF MERTON
VILLAGE OFCHENEQUA
VILLAGE OF NASHOTAH
VILLAGE OFHARTLAND
CITY OFDELAFIELD
VILLAGE OFOCONOMOWOC LAKE
CITY OFOCONOMOWOC
VILLAGEOF LAC
LA BELLE
VILLAGE OF
DOUSMAN
VILLAGE OF
WALES
VILLAGE OF NORTH PRAIRIE
CITY OFWAUKESHA
VILLAGE OFPEWAUKEE
VILLAGE OF BIG BEND
VILLAGE OFMUKWONAGO
VILLAGE OF EAGLE
TOWN OF EAGLETOWN OF MUKWONAGO TOWN OF VERNON
TOWN OF WAUKESHA
TOWN OF GENESEE
TOWN OF OTTAWA
TOWN OF SUMMITTOWN OF DELAFIELD
CITY OF PEWAUKEE
TOWN OF LISBON
TOWN OF MERTONTOWN OF OCONOMOWOC
VILLAGE OF ELM GROVE
TOWN OF BROOKFIELD
TOWN OF BROOKFIELD
WIS
CO
NS
IN A
ND
SO
UTH
ER
N R
AIL
RO
AD
WIS
CO
N
SIN
AN
D S
OU TH ER N R AIL ROA D
WIS
CO
NS
IN C
EN
TR
AL
LIM
ITE
D R
AIL
RO
AD
CA
NA
DIA
N N
AT
ION
AL R
AI L
RO
A
D
UNION P A CIFIC RA ILROA D
CHICAGO A
ND
NO
RT
HW
ES
TE
RN RA IL RO
AD
CA
NA
DIA
N N
ATIO
NA
L R
AIL
RO
AD
CP RAIL S YS TE M
C P RAIL SY
STEM
CP
R
AI L
SY
ST E
M
UNION P A CIFIC RA ILR OA D
WIS CON SIN A ND S OUTHE RN RA ILROA D
UP R
.R.
CA
NA
DIA
N N
AT
ION
AL R
AIL
RO
AD
U NION P A CIFIC RA ILROA D
C P RA IL SYS TEM
CAN
AD
IAN
NAT
ION
AL R
AI L
RO
AD
B ugl ine Rec rea tion Tra il
G la cial D rum lin Sta te Tra il
L ake Cou ntry R ecrea tion Trail
* Refer to Town of Ottawa and Town of Mukwonago Land Use Plans, and Town of Delafield Land Use Plan Unit Determination for permissible rural densities.
Rural Density and
Other Agricultural Land*
Highway and Railway Rights of Way
Major Recreational Trails
Ice
Ag
e T
rai l
I ce A
g e T
rai l
Figure 8: Map of Recommended Land Use in Waukesha County (2035), Wisconsin