success in automation: decoding the winning formula · success in automation: decoding the winning...
TRANSCRIPT

Success in Automation: Decoding the Winning Formula
While automation and its drivers are among the most discussed topics in the business world, few organisations are focused on where to begin, how to make the best use of machine intelli-gence and where to apply it in their business. A first step is to understand which processes are, and aren’t, ripe for automation.
December 2017
DIGITAL OPERATIONS

22
Digital Operations
| Success in Automation: Decoding the Winning Formula
EXECUTIVE SUMMARY
As per the new book from Cognizant, What to Do When Machines Do Everything,1 smart
machines are slowly permeating every aspect of our professional and personal lives. From
smart phones to cars to the kind of music we play, the “new machine” is omnipresent. And
the rising influence of smart machines is expected to grow exponentially, in unpredictable
ways. The magnitude of change will dramatically influence how organisations and individ-
uals perform their day-to-day work. And while nearly every organisation is taking note of
the potential impact of smart automation (i.e., systems that think and learn), many appear
baffled about how and where to start deploying this technology.
Many organisations, including some large insurance and brokerage firms, have taken the
initial plunge by dabbling with robotics process automation (RPA). They see RPA as a way
to reduce costs by automating outsourced or low-risk (i.e., routine) processes.
Yet while the intentions behind them are sound, many RPA initiatives have not met lofty
cost-containment objectives. One reason: Off-the-shelf RPA products for automating busi-
ness processes have failed to meet vendor promises. Another shortcoming: Decision-mak-
ers have lacked the necessary data points to establish a business process case to justify
automation.

33Success in Automation: Decoding the Winning Formula |
Digital Operations
While organisations see automation as synonymous with optimization and efficiency, some
fence-sitters are waiting for others to make the first big move. For organisations that have
not yet started or are planning to start soon, the main questions include:
• Where do we start on the automation journey?
• How do we know which business process is right for which level of automation?
• What extent of control should machines be given?
This white paper helps to answer these questions by providing a comprehensive and quan-
titative scientific technique to analyse the current suite of business processes and generate
a set of recommendations. Our flexible and empirical approach allows decision-makers to
leverage this framework to make decisions at an organisational or functional level. Organi-
sations can use this tool to move forward strategically, to ensure they realise the potential
of automation to deliver significant and sustainable market advantage. Moreover, the white
paper showcases several insurance industry examples to derive an automation scorecard
that can be applied to any organisation’s automation journey.

4
Digital Operations
| Success in Automation: Decoding the Winning Formula
DEFINING AN APPROACH FOR OPERATIONALIZING AUTOMATION
Smart machines, also known as systems of intelligence, have been described by the World Economic
Forum2 as the fourth wave of the industrial revolution — after steam power in 1784, mass production
in 1870, and electronics and IT in 1969. The fourth industrial revolution is closely coupled with the third
revolution’s digital wave, which has been building since the advent of Y2K and is characterized by a
blend of technologies that bring together the physical and digital.
What distinguishes the fourth wave compared with the preceding three are several factors:
• Its adoption curve is extremely steep, comparatively speaking.
• Not one industry is untouched.
• It promises to replace much of what has fundamentally been done manually in business.
Automation can be broadly categorised into three different types — systems that do, think and learn
(see Figure 1).3
Automation’s Triumvirate
Systems that DO Systems that LEARN
Speechto Text
RoboticsProcess
Automation
DataCollection &Preparation
NaturalLanguageProcessing
AutomaticAutomation Smart APIs Artificial
IntelligenceSentimentAnalysis
MachineLearning
Systems that THINK
Figure 1

5Success in Automation: Decoding the Winning Formula |
Digital Operations
While systems that do have been around us since the mid-20th century, systems that think and learn
are slowly becoming a part of how organisations operate. Their core focus is on automating manual,
repetitive work. Making intelligent machines do the same work more efficiently and accurately frees
up human labour to tackle more challenging tasks (see Figure 2).
The Anatomy of an Automation Effort
Multiple Business Process Within a Function
Current State of Play Smart Enterprise of the Future
ManualWork
SmartMachine
System1
System1System
2 System2
System3
System4
ManualWork Manual
Work
ManualWork
SmartMachine
ManualWork
ReimaginedUsing AI and
Machine Learning
Different business processes comprising multiple systems and types of manual effort work together to complete a business function.
The focus here is on automating manual effort and on completely reimagining some of the business processes within the function.
Figure 2

6
Digital Operations
| Success in Automation: Decoding the Winning Formula
While RPA is most commonly associated with the current state of automation, it is important to under-
stand that RPA is merely the most basic type of such technology. It addresses rote, routine work
programmed to handle repetitive tasks that can be easily mapped to computer instructions. How-
ever, technology is rapidly evolving, and organisations are under increasing pressure to innovate and
deliver value to their end customers while keeping costs in check. To achieve these end goals, it is
imperative to identify business processes where systems that think and systems that learn can be
applied to tap automation’s vast potential and realise its benefits.
AUTOMATING RIGHT: SELECTING THE RIGHT PROCESS
Organisations often are unable to map the right automation strategy to the right business process.
So they end up choosing a business process that is focused on high-volume transaction rates (when
that’s not what they need) or is overly expensive to deploy (and can’t deliver sufficient ROI to warrant
the investment). Instead, what organisations need is a scientific approach towards business process
selection for the right level of automation. For organisations that are at a nascent stage of their auto-
mation journey, the rule of thumb should be to start with simpler processes with low risk and quick
gains and use the experience to eventually move towards complex processes.
A well-defined process can be easily broken down so that only a part of it is automated completely
while the overall process continues to function as before. This, in turn, poses a lower risk for the func-
tion or the organisation. On the other hand, automating high-risk and complex processes may have a
higher impact in achieving the organisation’s goals, but may require a greater investment of time and
money, thereby increasing the risk of failures.
Key Factors For Selecting the Right Process
Manual-Error-ProneProcesses
StructuredDigital Data
Rule-BasedStandardised
Processes
Numericor Textual
Data
High VolumeData or
Processes
Figure 3

Success in Automation: Decoding the Winning Formula | 7
Digital Operations
While RPA is most commonly associated with the current state of automation, it is important to understand that RPA is merely the most basic type of such technology. It addresses rote, routine work programmed to handle repetitive tasks that can be easily mapped to computer instructions.

8
Digital Operations
| Success in Automation: Decoding the Winning Formula
A good example would be a simple nonmedical underwriting process in an insurance company. Here,
the organisation will normally have a well-defined business process and rules running in tandem with
simple system processing requirements. Such processes can be broken down into independent sub-
processes such as data entry, document verification and rating. Each subprocess can be automated
autonomously while the other subprocesses continue, uninterrupted.
Every organisation has its own conception of why they need to automate and what level of automa-
tion they seek. A company’s goal can be related to cost reduction, cutting decision time and improving
customer service, or the ultimate aim may be to redeploy human resources to more constructive
work. The processes that are automated should be aligned with the overall strategic goal of the organ-
isation. A pertinent example is a Japanese life insurance firm that has recently automated its systems
to calculate payouts to customers, thereby saving millions of yen and improving productivity by as
much as 30%.4
A FRAMEWORK FOR AUTOMATION PROCESS SELECTION
Before we lay out a detailed methodology for applying the right level of automation to the right set
of business processes, we will first define the different levels of automation based on the degree of
control that machines will eventually have5 (see Figure 4).
Ranking Automation Capabilities
Level 2
Level 3
Level 4
The state where there is no element of automation involved. All work is done manually.
Systems that LEARNSystems that THINKSystems that DO
This is the stage where automation is applied but there is periodic human intervention; machines cannot take and execute decisions unless humans approve them. This involves machine thinking.
This is the stage with the simplest form of automa-tion, where machines do as they are told. There is no element of machine learning or thinking involved.
Level 1
Level 0
This is the stage where machines and humans work in tandem; machines can either take a decision with a limited time for human veto or take a decision and then inform humans. This involves machine learning.
Machines can work independently, and work will be fully automated. This involves machine learning.
Figure 4

9Success in Automation: Decoding the Winning Formula |
Digital Operations
Every organisation has its own conception of why they need to automate and what level of automation they seek. A company’s goal can be related to cost reduction, cutting decision time and improving customer service, or the ultimate aim may be to redeploy human resources to more constructive work.

10
Digital Operations
| Success in Automation: Decoding the Winning Formula
ASSESS THE OPERATIONAL LANDSCAPE
Before an organisation initiates its assessment phase, a prerequisite is that it conducts a cost-benefit
analysis to screen and focus on which processes make business sense to automate. All business pro-
cesses should not be considered for automation. For example, it may be fruitless for an organisation
to incur the costs of automating an activity that is performed once a year or has an insignificant effect
on overall volume or resource allocation.
In the first phase of assessment, the organisation’s business functions are broken down into pro-
cesses. All processes (and subprocesses) must be mutually exclusive and collectively exhaustive.
Obsolete processes or those that are earmarked for retirement should be removed from the process
inventory list. At the end of this step, an enterprise-wide functional inventory is generated.
The next steps are to identify a focus group of business process owners within each team, and then
develop stakeholder survey questionnaires (process- and user-specific) to gather inputs. The question-
naire can be customized to ensure the most accurate and useful information is captured for analysis.
The business process landscape is also analysed through process diagrams to determine cross-depen-
dencies, if any, and categorise and understand business processes by line of business, process area
and department. This exercise should help identify automation use cases, pain points, aspirations and
complexities in the current list of business processes.
A Framework Snapshot
Assess Identify Evaluate Recommend
Assess the operationallandscape.
Define functional inventory.
Break down processes into subprocesses.
Prepare future blueprint with strategic objectives in mind.
Interviews/focus group discussions.
Determine the parameters to evaluate processes.
Prioritize businessprocesses based on functional areas.
Create a hierarchy of dimensions and associated sub-dimensions to be evaluated.
Evaluate the business processes on a predefined hierarchy of dimensions using AHP.
Map process scores into one of the four quadrants and develop recommendations.
Based on the cumulative score, map the process into the four quadrants.
Develop a recommendation based on each quadrant.
Perform priority-based rationalization.
Calculate a score for each of the two dimensions.
Score processes.
Determine weights at dimensional and sub-dimensional levels.
Figure 5

11Success in Automation: Decoding the Winning Formula |
Digital Operations
IDENTIFY THE PARAMETERS FOR PROCESS EVALUATION
The next step of the assessment is to identify the two elements that will be the cornerstone of the
entire rationalization exercise and will serve as the fundamental principle for guiding your analysis.
Every business process comprises the individual(s) who perform(s) that business process as well as
the business process itself. For example, underwriting as a function is composed of the individual
underwriter and the actual business process of underwriting.
Hence, we initiate the identification phase by choosing two key parameters that affect both the indi-
vidual and the business process: the degree of work variation and the degree of business process
complexity.
• Degree of variation of work: This parameter allows us to understand the extent of repetitiveness
in the individual’s work for the business process being evaluated. In other words, it helps determine
whether the job in question is routine or nonroutine. ”Routine” would mean a job with minimal
deviation, which produces simple rule-based output, and which can be performed in relative iso-
lation with little social interaction. ”Nonroutine,” on the other hand, means the task involves
significant people management and problem-solving ability. Work variation can be divided into
these two dimensions:
» Stakeholder management: This measures the social component or nature of work. It involves
tasks that have an emotional quotient, such as negotiation and team-building.
» Analytical skills: This measures the logical or problem-solving components of work. It involves
tasks that require critical reasoning, such as decision-making and information processing.
We initiate the identification phase by choosing two key parameters that affect both the individual and the business process: the degree of work variation and the degree of business process complexity.

12 | Success in Automation: Decoding the Winning Formula
• Degree of complexity of business process: This parameter allows us to understand the extent
of complexity of the business process being evaluated. In other words, it helps determine whether
the business process in question is complex or non-complex. A “complex” business process refers
to one where the output is not a simple rule-based result and/or one involving many exceptions or
overlaps during execution. The nature of the business impact also helps determine if a business
process is complex or not. A “non-complex” business process, on the other hand, is one that is
simple and straightforward, with no deviations and exceptions, and/or one that can be carried out
with minimal business impact. Complexity can be divided into these two dimensions:
» Process traits: These are the actual traits that make a business process complex and poten-
tially difficult to execute. For example, many overlaps or exceptions in the process.
» Business impact: This is the impact that a business process can cause based on its disrup-
tive damage potential if it fails. This could mean financial impact, legal impact, reputational
impact, etc.
The two dimensions can then be further decomposed into sub-dimensions as the organisation deems fit.
Note that these dimensions and sub-dimensions are not exhaustive or set in stone. The flexible nature
of the framework allows for the addition, deletion or modification of these dimensions and sub-di-
mensions as stakeholders see fit. Also, the dimensions/sub-dimensions are not to be confused with
“type.” For example, stakeholder management and analytical skills together compose the degree of
variation, and any evaluated process must be quantified for both these parameters.
EVALUATE THE BUSINESS PROCESS
The parameters of routine vs. non-routine for an individual’s work or complex vs. non-complex for a
business process are often perceived in a subjective light, which can cause bias to creep into deci-
sion-making.
To reduce such subjectivity, we apply a fundamental rating technique to the dimensions and sub-di-
mensions. The framework uses a combination of decision weights and scores to derive the strength
and weakness for each of the assessment dimensions. This should be based on the relative importance
(criticality) and priority of a process, as estimated from the engagement. We apply the analytical hier-
archical process, a mathematical tool, to help convert qualitative arguments into quantitative ones. A
pairwise comparison is made for every dimension and sub-dimension for both the factors. This exer-
cise can be performed at a business function level or at an organisation level.
To reduce subjectivity, we apply a fundamental rating technique to the dimensions and sub-dimensions. The framework uses a combination of decision weights and scores to derive the strength and weakness for each of the assessment dimensions.

13Success in Automation: Decoding the Winning Formula |
Digital Operations
After this exercise is completed at a sub-dimension level, it is then repeated for every dimension within
a degree of variation and a degree of complexity until a relative weight is obtained at each level.
Once a relative weight is obtained at each level, the last step of the evaluation is to score the business
process. The business process owner needs to assess the available data points and then assign a score,
while recording the rationale. For example, if the intention is to score a business process on “team
management” (a potential sub-dimension under stakeholder management), then it is possible to ask
multiple questions and use the responses to arrive at a score. Figure 6 illustrates the scoring concept
where, based on the responses, a score of 2 is allocated to the sub-dimension “team management.”
The process is then scored for every sub-dimension for both factors. The scoring conducted at this
level is then used to derive the scoring at a dimension level. Thus, at the end of this step, every busi-
ness process that has been the subject of the evaluation step has been assigned a score for both
parameters chosen in the identification phase.
RECOMMEND LEVEL OF AUTOMATION
After the individual processes are rated and scored to arrive at a cumulative score for both the dimen-
sions, the processes are then plotted on a graph where one axis represents the degree of variation of
work and the other axis represents the degree of complexity of the business process.
Scoring Team Management: An Illustrative View
Team Management
Process ID
Process Function
Business Process
Review and Moniter
other’s work
Setting goals for the team
Special Authority
Advising Team Members
Manage Team expectations
Executing Team Tasks
Inspecting &
Reporting
Score? (1–5, can be in decimals, eg:
2.5)
1
Policy servicing
Policy foreclosure
Updating pay-out by cheque and
NEFT
Yes. Second pair of
eyes check between team
members
Does not involve
setting goals between team
members
None
The new team members are
trained by experienced
team members
None Seldom None 2
Figure 6

14
Digital Operations
| Success in Automation: Decoding the Winning Formula
Depending on the score of the process, it can be plotted on one of four quadrants:
• Quadrant 1: Low degree of complexity and low degree of variation: Any process that falls within
quadrant 1 is considered routine work. The recommendation here is that the process should be
completely automated using level 1 automation, where machines will do as they are told, without
any element of machine learning. There is no form of supervision needed for this work. RPA is a
good example of the kind of automation that can be applied to processes in this quadrant.
• Quadrant 2: Low degree of complexity and high degree of variation: The recommendation for
such business processes is to apply level 2 automation, where systems think and make decisions,
but they cannot be executed unless approved by human supervisors. This is because even though
the non-complex work can be broken down into data points, the nonroutine nature of this work
means that machines will frequently encounter exceptions that require human supervision.
• Quadrant 3: High degree of complexity and high degree of variation: Any process that falls under
quadrant 3 is considered nonroutine work. Such business processes are either very hard to auto-
mate or cannot be automated. The objective should be to try and break down the parts of work
where rules can be fragmented (and made simpler) so it can eventually be moved to quadrant 2.
• Quadrant 4: High degree of complexity and low degree of variation: Any business process that
falls under quadrant 4 is considered routine work. The recommendation for such processes is to
implement cognitive automation and apply level 3 automation, where systems can understand and
learn complex data structures through advanced artificial intelligence, such as machine learning.
This is because even though the work is complex in nature, it is routine and has minimal variation;
this means that complex business rules encounter minimal or no deviation and, if fragmented into
simpler rules, can be performed by machines. Such processes will be challenging and time-con-
suming to automate but once automated can be performed unaided by machines.
Breaking Down Tasks Ripe for Automation
Implement cognitive automation
Discharge but not completely
• Business users relieved of their day-to-day job & redeployed to more challenging work. • Monitor the work done by machines. Self learning will ensure that machines reduce E&O on their own work eventually.
Completely automate
Fragment complex business rules
• Process can be made less complicated. • Eventually the business process is moved to quadrant 2. Such processes may not always be up for automation.
NonroutineHigh
Complexity
NonroutineLow
Complexity
RoutineLow
Complexity
RoutineHigh
Complexity
1
2 3
4
• Machines can understand & learn complex data structures.• Suggest solutions and be a part of the decision-making process.
• Implement RPA to fully automate the business process. • This method of automation does not need any supervision.
Deg
ree
of V
ari
ati
on
Degree of Complexity
Level1
Level2
Level3
Level-
Figure 7
15Success in Automation: Decoding the Winning Formula |
Digital Operations
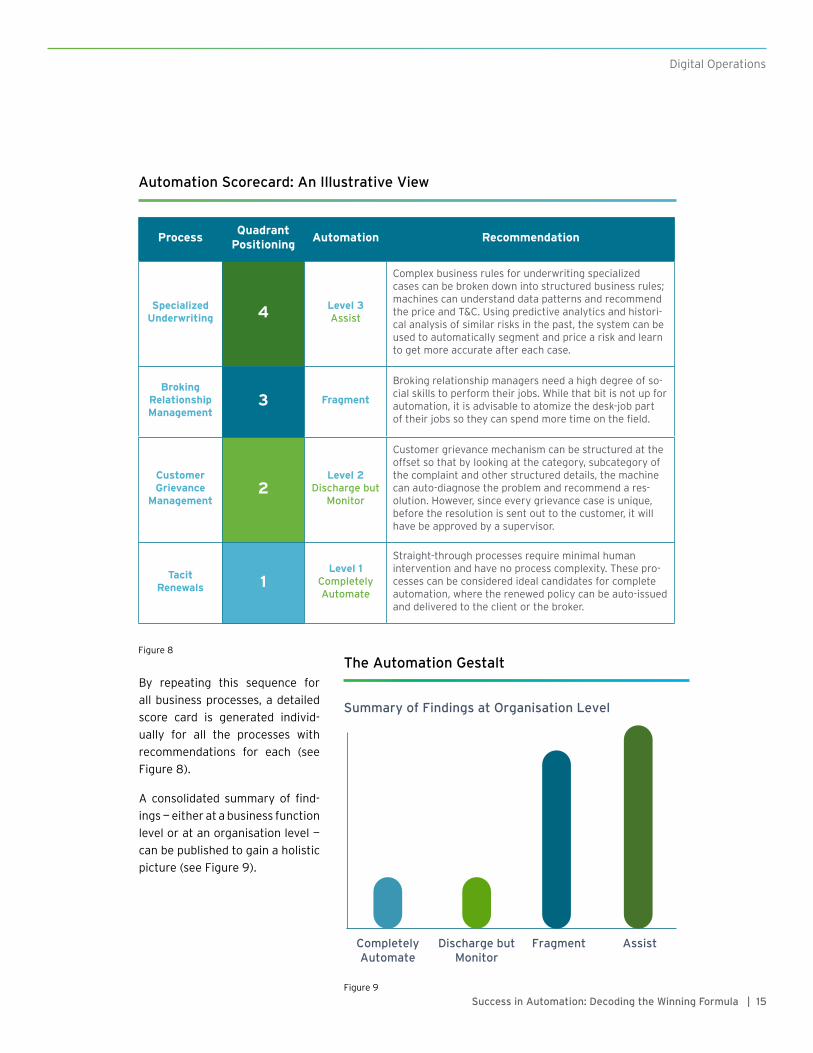
By repeating this sequence for
all business processes, a detailed
score card is generated individ-
ually for all the processes with
recommendations for each (see
Figure 8).
A consolidated summary of find-
ings — either at a business function
level or at an organisation level —
can be published to gain a holistic
picture (see Figure 9).
Automation Scorecard: An Illustrative View
ProcessQuadrant
PositioningAutomation Recommendation
Specialized Underwriting 4 Level 3
Assist
Complex business rules for underwriting specialized cases can be broken down into structured business rules; machines can understand data patterns and recommend the price and T&C. Using predictive analytics and histori-cal analysis of similar risks in the past, the system can be used to automatically segment and price a risk and learn to get more accurate after each case.
Broking Relationship Management
3 Fragment
Broking relationship managers need a high degree of so-cial skills to perform their jobs. While that bit is not up for automation, it is advisable to atomize the desk-job part of their jobs so they can spend more time on the field.
Customer Grievance
Management 2
Level 2Discharge but
Monitor
Customer grievance mechanism can be structured at the offset so that by looking at the category, subcategory of the complaint and other structured details, the machine can auto-diagnose the problem and recommend a res-olution. However, since every grievance case is unique, before the resolution is sent out to the customer, it will have be approved by a supervisor.
Tacit Renewals 1
Level 1Completely Automate
Straight-through processes require minimal human intervention and have no process complexity. These pro-cesses can be considered ideal candidates for complete automation, where the renewed policy can be auto-issued and delivered to the client or the broker.
Figure 8
The Automation Gestalt
CompletelyAutomate
Discharge butMonitor
Fragment Assist
Summary of Findings at Organisation Level
Figure 9

16
Digital Operations
| Success in Automation: Decoding the Winning Formula
Based on the findings, an implementation roadmap can be produced, which can be divided into dif-
ferent waves. Such a roadmap should be sequenced based on business priorities in line with the
organisation’s strategic automation objective (see Figure 10).
If the work estimate is too exhaustive, then we recommend you select a single business function to
pilot. The entire exercise should then be conducted starting with that business function.
An Automation Roadmap
Wave 1 (Quick Wins)
• Identify quick wins in process rationalization opportunities.
• The area of quick wins would be processes where RPA or level 1 automation can be applied.
Wave 2 (Near Term)
• Identify process rationalization opportunities which can be achieved in near term.
• The candidates for near-term opportunities would be where level 2 automation can be applied.
Wave 3 (Long Term)
• Identify process rationalization opportunities which can be achieved in long term.
• The candidates for long-term opportunities would be where level 3 automation can be applied.
Rollout Plan
Wave 3
Project _________
Status
Tasks _________
Resources ________
Wave 2
Project _________
Status
Tasks _________
Resources ________
Wave 1
Project _________
Status
Tasks _________
Resources ________
Figure 10

17Success in Automation: Decoding the Winning Formula |
Digital Operations
A Winning Automation Formula
Identify Any Resistance to Change• New relationships and processes must be established to facilitate a smooth transition and support new initiatives.
• Assess an organisation’s readiness to change.
• Continuously reinforce importance of automation for the organisation through all channels of communication.
Alignment with Strategic Objectives & Management Support• Important to have support from the senior management and its alignment with the organisation’s overall strategic goals.
• Identify clear automation target areas and review progress periodically to realign the objectives of the organisation.
Clear Communication of Plans• Clearly and regularly convey top-priority objectives to all relevant stakeholders.
• Objectives must be SMART: specific, measurable, achievable, realistic and time-framed.
• Agree on the scope, size , nature of work, timelines and key success parameters before engagement starts.
Right Team• Cross-functional team of experienced business consultants, domain experts, process consultants and technology architects is required for successful process rationalisation exercise.
• Building expertise in the area of automation and its related tools can also help in driving the team towards a common goal.
Budget & Resource Availability• Organisations must estimate the total cost needed to run the engagement and identify resources that will have to be committed to this initiative proactively.
• Running shorter pilot engagements can help in identifying the key change areas and taking corrective actions early in the game.
Figure 11
KEY DRIVERS OF SUCCESS
Selection of the right processes and the right level of automation can be tricky — if executed improp-
erly, or if unrealistic expectations were set at the outset. It is vital to get the right stakeholders
committed to the program early in the game. Also essential is to define the key drivers of success for
an automation program, as this ensures that team members know the value the initiative will create,
and the potential challenges that can emerge (see Figure 11).
18
Digital Operations
| Success in Automation: Decoding the Winning Formula
A WAY FORWARD
Going forward, organisations need to view things from a dual lens: A microscopic view for achieving
the low-hanging fruits of RPA, and a telescopic view for cognitive or smart automation opportunities
in the not-so-distant future. A detailed plan of action should balance these two goals, because today’s
successful RPA initiatives can provide a foundation for tomorrow’s cognitive automation. It will also
help win the trust of senior management by demonstrating that the organisation is moving in the
right direction.
Bear in mind that smart machines will coexist with humans in the workplace in the near future.
Therefore, organisations should be proactive in smoothing the transition. If you think your business
processes are not ready to be automated, then the first step should be to get them to a stage where
they are. If you think your process landscape is ready to be automated, then the next step should be
to identify and draw a roadmap for automation. Either way, the end goal is to become a smart organ-
isation where business processes work optimally.
FOOTNOTES
1 Malcolm Frank, Paul Roehrig, Ben Pring, What to Do When Machines Do Everything: How to Get Ahead in a World of
AI, Algorithms, Bots, and Big Data, John Wiley & Sons, Inc., February 2017. www.wiley.com/WileyCDA/WileyTitle/pro-
ductCd-111927866X.html
2 www.weforum.org/agenda/2016/01/the-fourth-industrial-revolution-what-it-means-and-how-to-respond/
3 www.cognizant.com/whitepapers/intelligent-automation-exploring-enterprise-opportunities-for-sys-
tems-that-do-think-and-learn-codex2292.pdf
4 www.huffingtonpost.co.uk/entry/japanese-insurance-firm-artificial-intelligence_uk_586e5d39e4b0c1c826fa8cc8
5 www.aerohabitat.eu/uploads/media/Automation_and_Situation_Awareness_-_Endsley.pdf
Going forward, organisations need to view things from a dual lens: A microscopic view for achieving the low-hanging fruits of RPA, and a telescopic view for cognitive or smart automation opportunities in the not-so-distant future.

19Success in Automation: Decoding the Winning Formula |
Digital Operations
Gayatri ChaudharyBusiness Analyst, UK Insurance Practice, Cognizant Business Consulting
Gayatri Chaudhary is a Business Analyst within Cognizant Business
Consulting‘s UK Insurance Practice. She has over six years of expe-
rience in the insurance industry across functions such as insurance
and broking, IT consulting and life insurance operations. Gayatri
has worked with several insurers in the U.S., UK and APAC markets
in multi-vendor and multiple geography engagements. She holds
a PGDM from the National Insurance Academy School of Manage-
ment and is a fellow member of the Insurance Institute of India.
Gayatri can be reached at [email protected] |
https://www.linkedin.com/pub/gayatri-chaudhary-fiii/16/4aa/27b.
Abhishek JhaConsultant, UK Insurance Practice, Cognizant Business Consulting
Abhishek Jha is a Consultant within Cognizant Business Consult-
ing’s UK Insurance Practice. He specializes in the property and
casualty domain with a special focus on commercial insurance.
Abhishek has worked extensively with insurers and brokers across
the U.S., APAC, UK and Latin America sectors. He holds a PGDM
from National Insurance Academy School of Management, Pune.
Abhishek is an associate of The Institutes (formerly the American
Institute for Chartered Property and Casualty Underwriters) and
is a fellow member of the Insurance Institute of India. He can be
reached at [email protected] l https://linkedin.com/
in/abhishek-jha-15535915.
Stuart LeaskDirector, UK Insurance Practice, Cognizant Business Consulting
Stuart Leask is a Director within Cognizant Business Consulting’s
UK Insurance Practice. He has 27 years of experience in the insur-
ance sector and has held senior positions in both the industry and
consulting, within the UK and on the international stage. Stuart
began in reinsurance and has expanded his domain knowledge
across life and pensions, commercial and personal lines, Lloyd’s,
the London Market and the broker market. He leads thought lead-
ership activities for Cognizant’s UK Insurance Practice. Stuart can
be reached at [email protected] | https://www.linkedin.
com/in/stuartleask/.
ABOUT THE AUTHORS

ABOUT COGNIZANT
Cognizant (NASDAQ-100: CTSH) is one of the world’s leading professional services companies, transforming clients’ business, operating and technology models for the digital era. Our unique industry-based, consultative approach helps clients envision, build and run more innova-tive and efficient businesses. Headquartered in the U.S., Cognizant is ranked 205 on the Fortune 500 and is consistently listed among the most admired companies in the world. Learn how Cognizant helps clients lead with digital at www.cognizant.com or follow us @Cognizant.
© Copyright 2017, Cognizant. All rights reserved. No part of this document may be reproduced, stored in a retrieval system, transmitted in any form or by any means,electronic, mechanical, photocopying, recording, or otherwise, without the express written permission from Cognizant. The information contained herein is subject to change without notice. All other trademarks mentioned herein are the property of their respective owners.
TL Codex 3038
World Headquarters
500 Frank W. Burr Blvd.Teaneck, NJ 07666 USAPhone: +1 201 801 0233Fax: +1 201 801 0243Toll Free: +1 888 937 3277
European Headquarters
1 Kingdom Street Paddington Central London W2 6BD EnglandPhone: +44 (0) 20 7297 7600 Fax: +44 (0) 20 7121 0102
India Operations Headquarters
#5/535 Old Mahabalipuram RoadOkkiyam Pettai, ThoraipakkamChennai, 600 096 IndiaPhone: +91 (0) 44 4209 6000Fax: +91 (0) 44 4209 6060