successful ageing influence of socio-economic factors, gender and health service provision shah...
TRANSCRIPT
Successful Ageing Influence of socio-economic factors, gender and health service provision
Shah Ebrahim
London School of Hygiene & Tropical Medicine
CADENZA Symposium 2008

Outline
• Socio-economic development and life expectancy
• Social class, survival and disability
• Gender, survival and disability
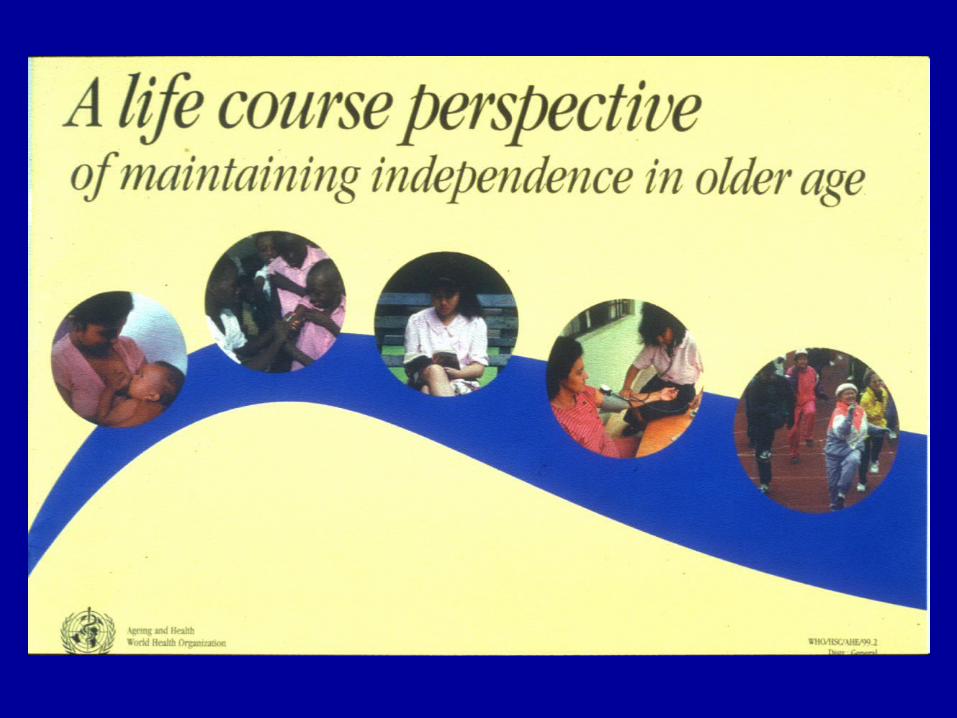
• Life-course influences on disability
• Health services

Successful ageing requires survival
Socio-economic position
Gender
Survival Health services

Socio-economic development and ageing
• Life expectancy: comparisons between countries by income levels

Life expectancy and GDP
Lynch et al. BMJ 2000;320:1200
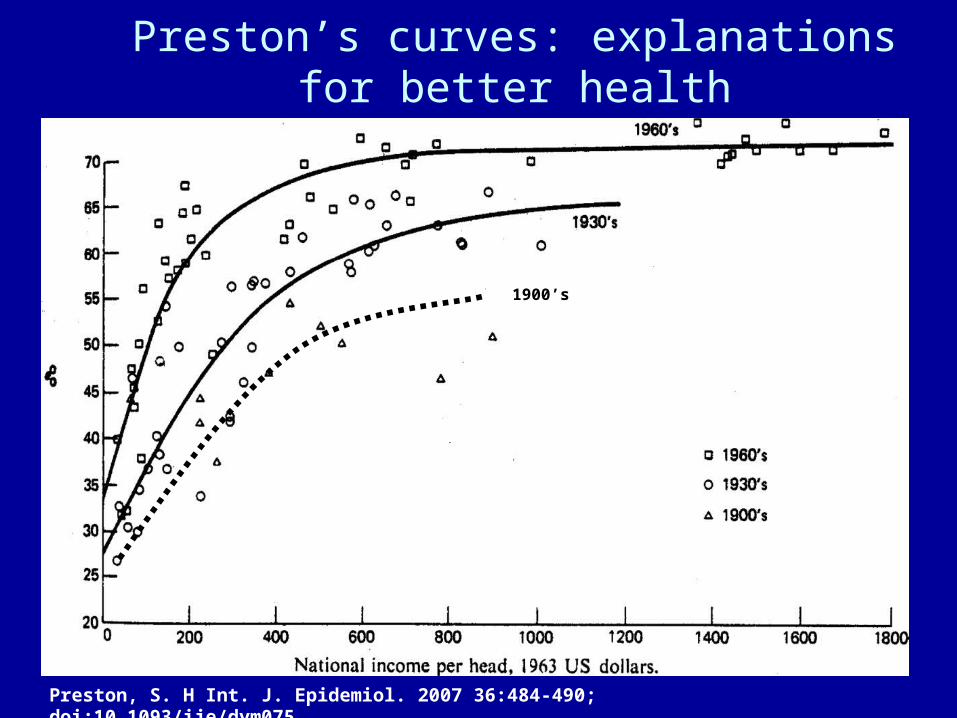
Preston’s curves: explanations for better health
Preston, S. H Int. J. Epidemiol. 2007 36:484-490; doi:10.1093/ije/dym075
1900’s

Preston’s conclusion
• Improvements in survival are not all explained by economic growth
• Nutrition and education have had only a small role.
• Global diffusion of medical and health technologies: – innovations in hygiene and sanitation – maternal and child services – specific vaccines and drugs for treatment
of bacterial infections

Paradoxes of Costa Rica, Cuba, Sri
Lanka: high life
expectancy but low GDP
Marmot M, Clinical Medicine, 2006
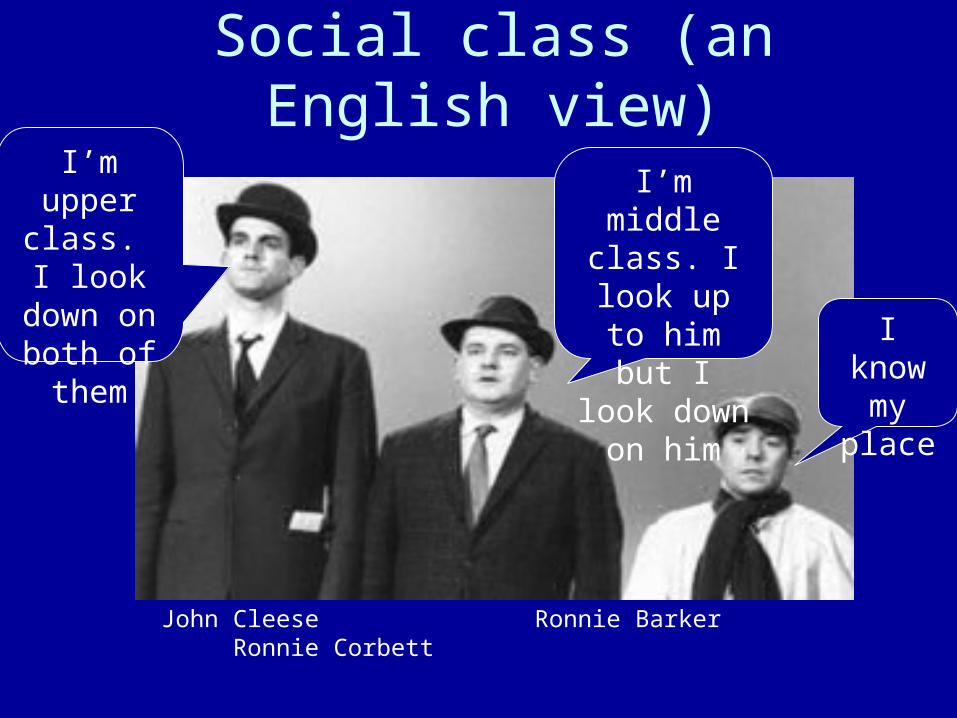
Social class (an English view)
I’m middle class. I look
up to him but I look down
on him
I’m upper class. I
look down on both of
them I know my
place
John Cleese Ronnie Barker Ronnie Corbett

Social class and life expectancy:age 65
63886132 5950
55125037 4891
3000
3500
4000
45005000
5500
6000
6500
7000
I II IIInm IIIm IV V
Social class
Day
s of
life
exp
ecta
ncy
1972-6 1997-9
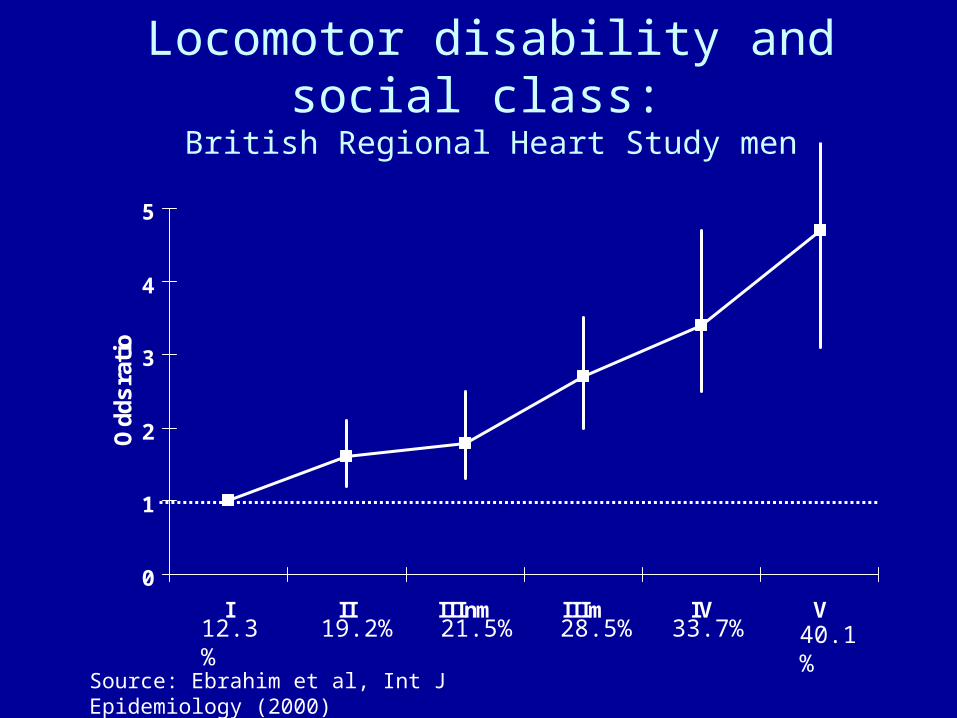
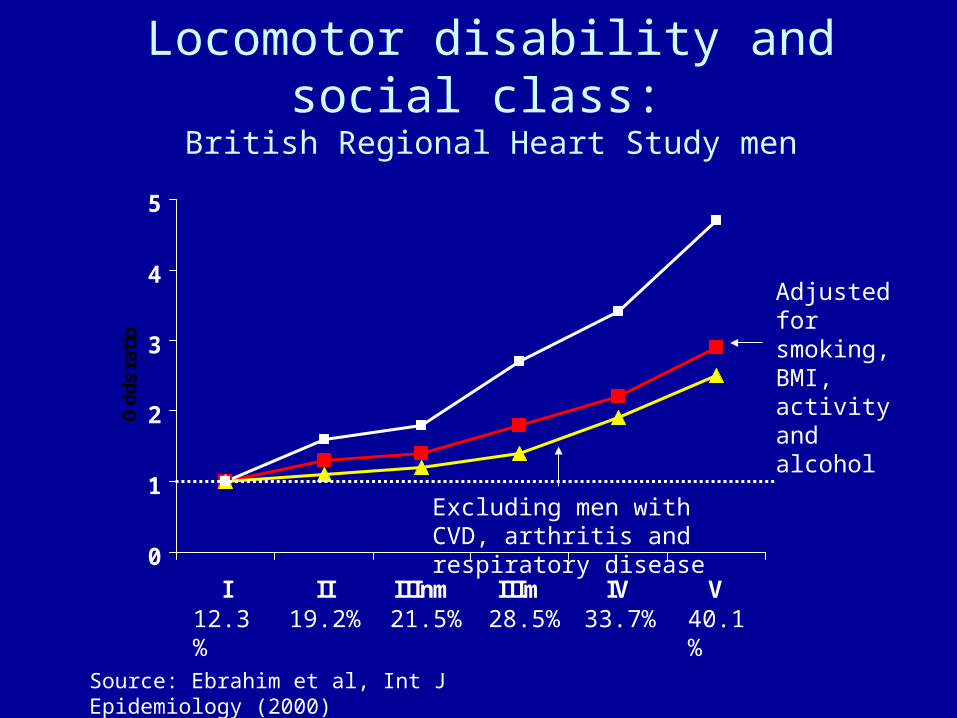
Locomotor disability and social class: British Regional Heart Study men
0
1
2
3
4
5
I II IIInm IIIm IV V
Odd
s ra
tio
12.3% 19.2% 21.5% 28.5% 33.7% 40.1%
Source: Ebrahim et al, Int J Epidemiology (2000)

Social class and disability: possible explanations
Social class Disability
Chronic diseases: Arthritis, CVD
Risk factors: inactivity, smoking, BMI etc
Locomotor disability and social class: British Regional Heart Study men
0
1
2
3
4
5
I II IIInm IIIm IV V
Odd
s ra
tio
Excluding men with CVD, arthritis and respiratory disease
Adjusted for smoking, BMI, activity and alcohol
12.3% 19.2% 21.5% 28.5% 33.7% 40.1%
Source: Ebrahim et al, Int J Epidemiology (2000)

Material and psycho-social models of causation
Poverty
MATERIAL CONDITIONS
Inadequate diet
Smoking
Poor housing
Reduced survival
PSYCHO-SOCIAL CONDITIONS
Lack of control
Increased stress
Low social capital
Lack of health & social services

A metaphor: air travel: differences in a neo-material and psychosocial
theory
First class Cattle class
Lynch & Davey Smith BMJ 2000;320;1200-1204
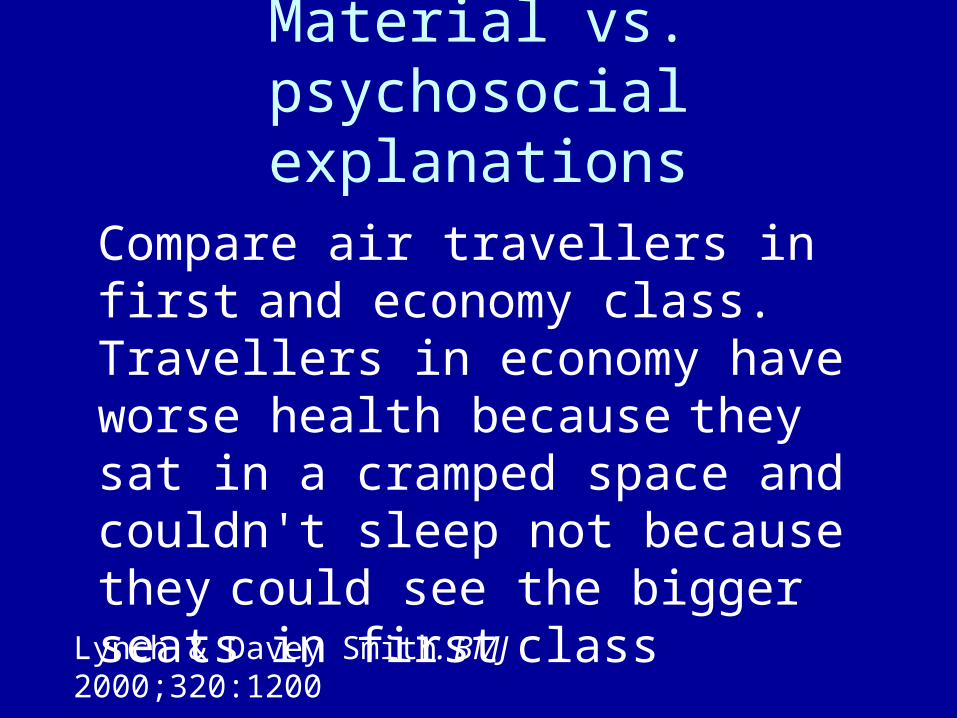
Material vs. psychosocial explanations
Compare air travellers in first and economy class. Travellers in economy have worse health because they sat in a cramped space and couldn't sleep not because they could see the bigger seats in first class
Lynch & Davey Smith. BMJ 2000;320:1200
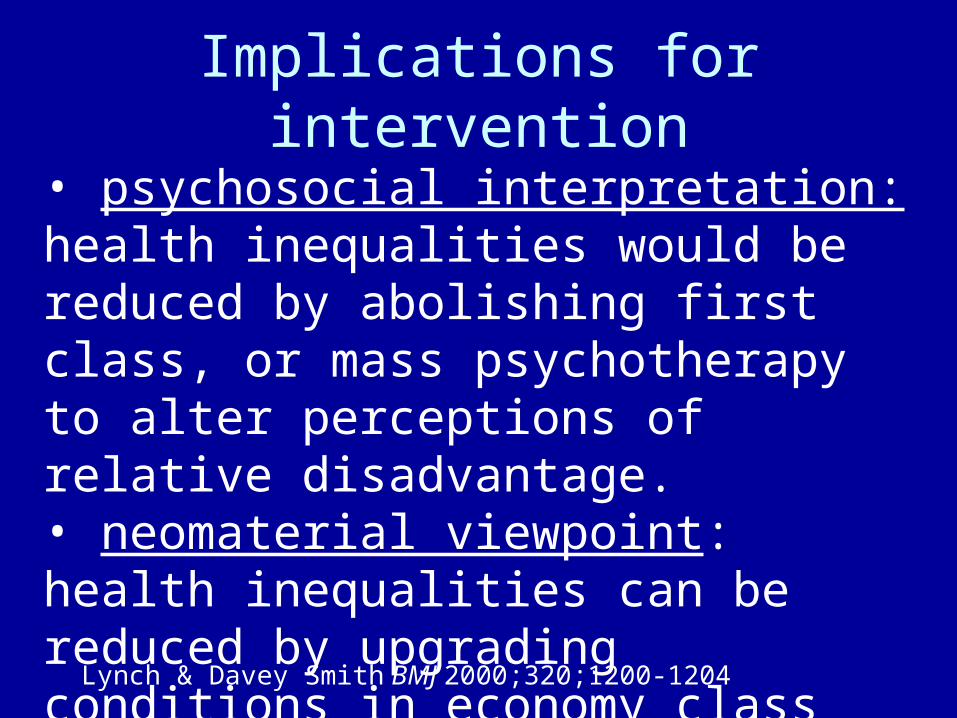
Implications for intervention
• psychosocial interpretation: health inequalities would be reduced by abolishing first class, or mass psychotherapy to alter perceptions of relative disadvantage. • neo material viewpoint: health inequalities can be reduced by upgrading conditions in economy class
Lynch & Davey Smith BMJ 2000;320;1200-1204
Social inequalities and survival
• Growing wider
• Not fully explained by smoking, diet, exercise
• Potentially avoidable
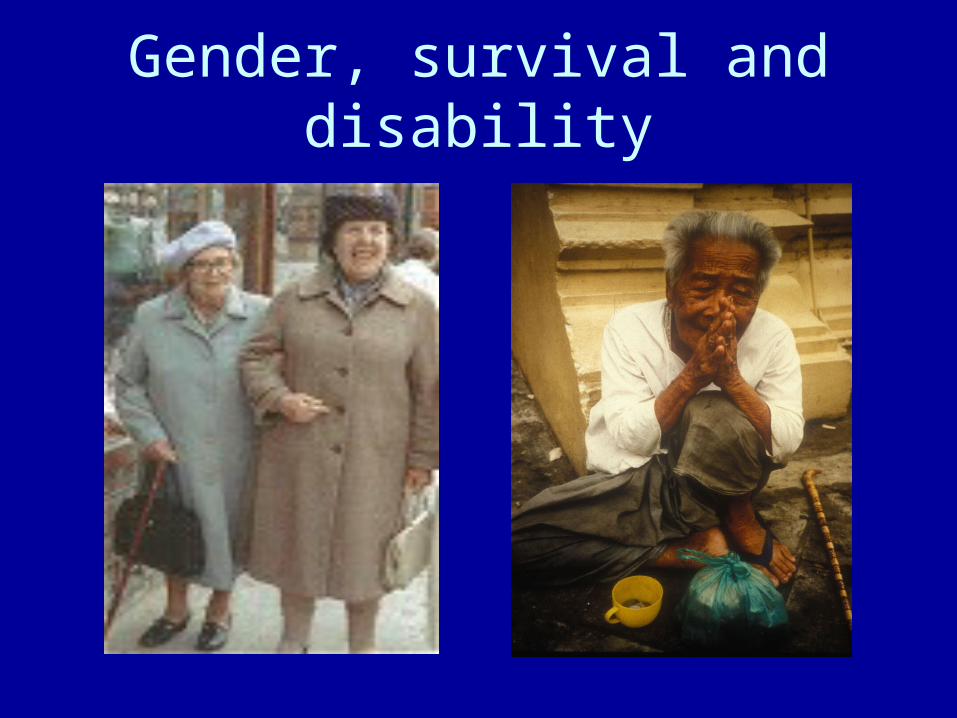
Gender, survival and disability

Life expectancy at age 65
Office of National Statistics, UK
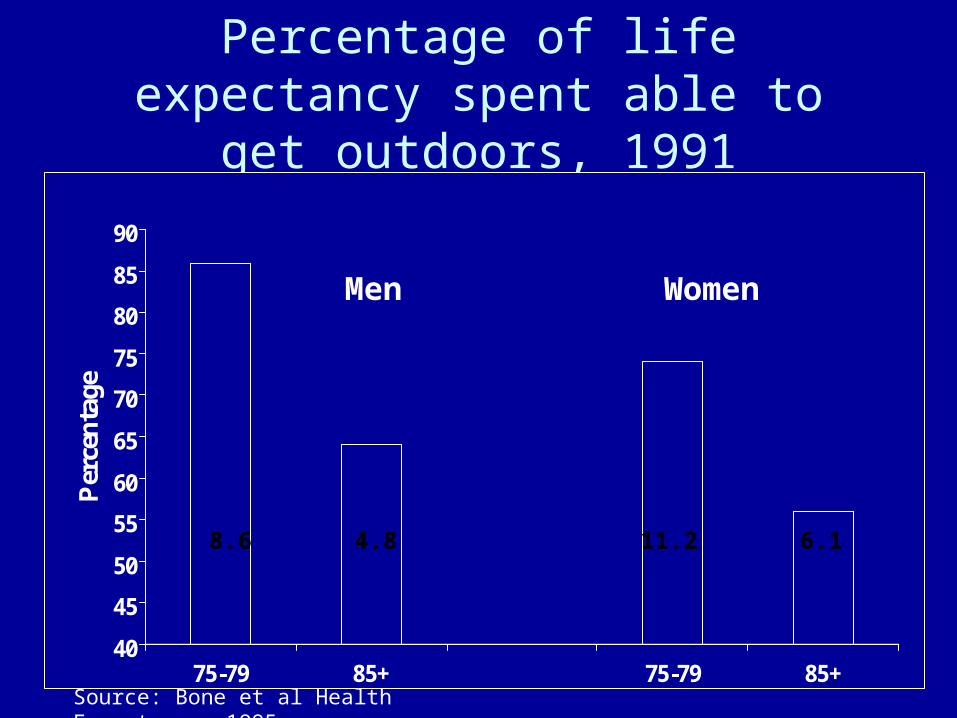
Percentage of life expectancy spent able to get outdoors, 1991
40
45
50
55
60
65
70
75
80
85
90
Per
cent
age
75-79 85+ 75-79 85+
8.6 4.8 11.2 6.1
Source: Bone et al Health Expectancy, 1995
Men Women

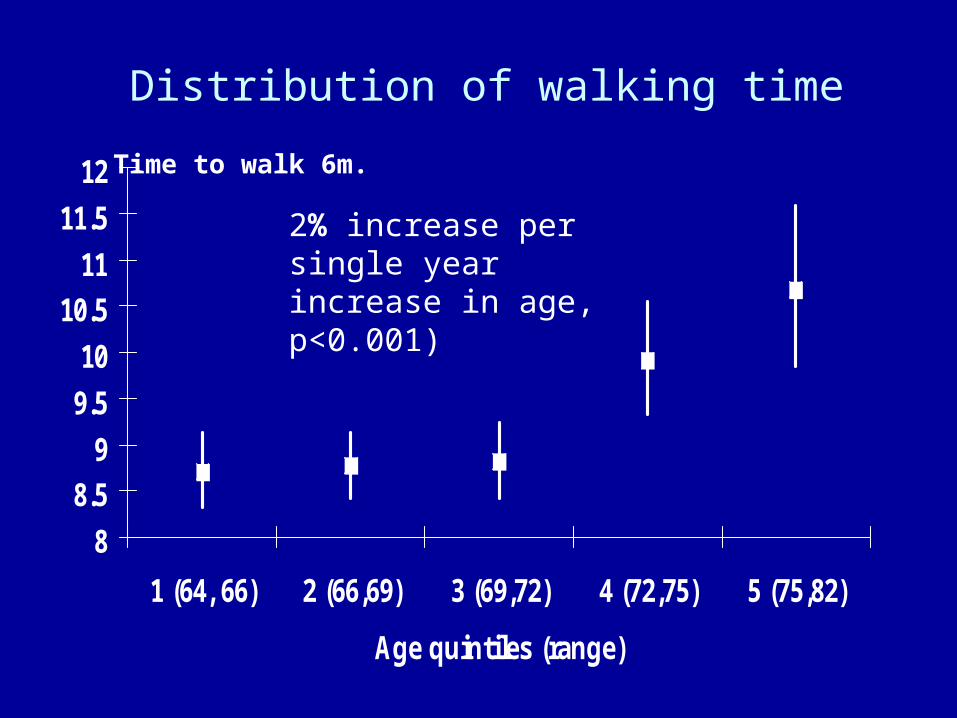
Distribution of walking time
8
8.5
9
9.5
10
10.5
11
11.5
12
1 (64, 66) 2 (66,69) 3 (69,72) 4 (72,75) 5 (75,82)
Age quintiles (range)
2% increase per single year increase in age, p<0.001)
Time to walk 6m.

Adult social class, 2002/3
7
7.5
8
8.5
9
9.5
10
10.5
11
I&II III IV&V
Time to walk 6m.
Adult occupational social class, 2002/3
4.9% increase in walking time per category increase in social class, p=0.02

Household income, 1937/9 and walking speed in 2002/3
7
7.5
8
8.5
9
9.5
10
10.5
>HK$120 HK$90-120 HK$60-89 <HK$60
Time to walk 6m.
Weekly household income, 1937/9
3.2% reduction in walking time per category increase in income, p=0.04
high
low

You need to walk at 0.8 m/s to cross a Hong Kong road
The youngest participants (aged 64-66) only walked at 0.7 m/s!
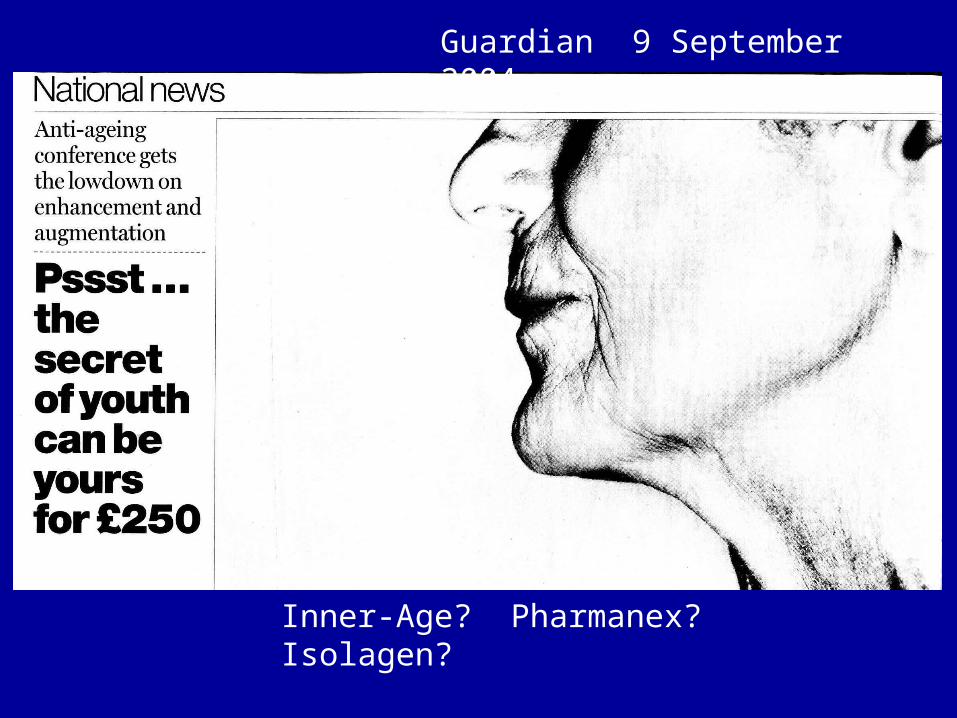
Guardian 9 September 2004
Inner-Age? Pharmanex? Isolagen?

Health services for older people
• Complex interventions - combinations of interdisciplinary teamwork for health and social problems
• Do they work?
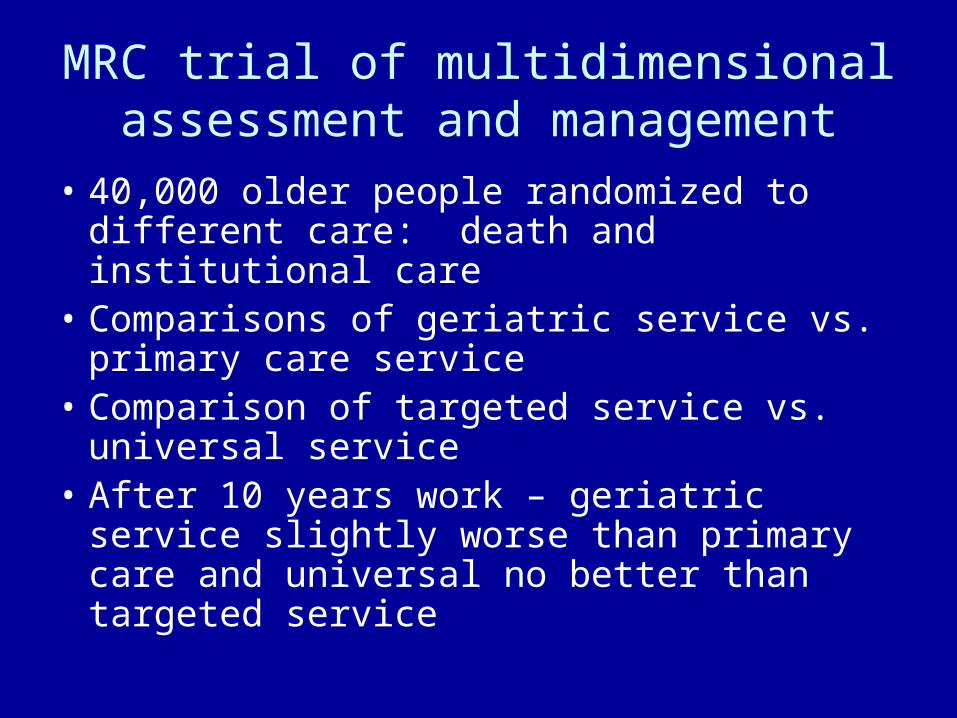
MRC trial of multidimensional assessment and management
• 40,000 older people randomized to different care: death and institutional care
• Comparisons of geriatric service vs. primary care service
• Comparison of targeted service vs. universal service
• After 10 years work – geriatric service slightly worse than primary care and universal no better than targeted service
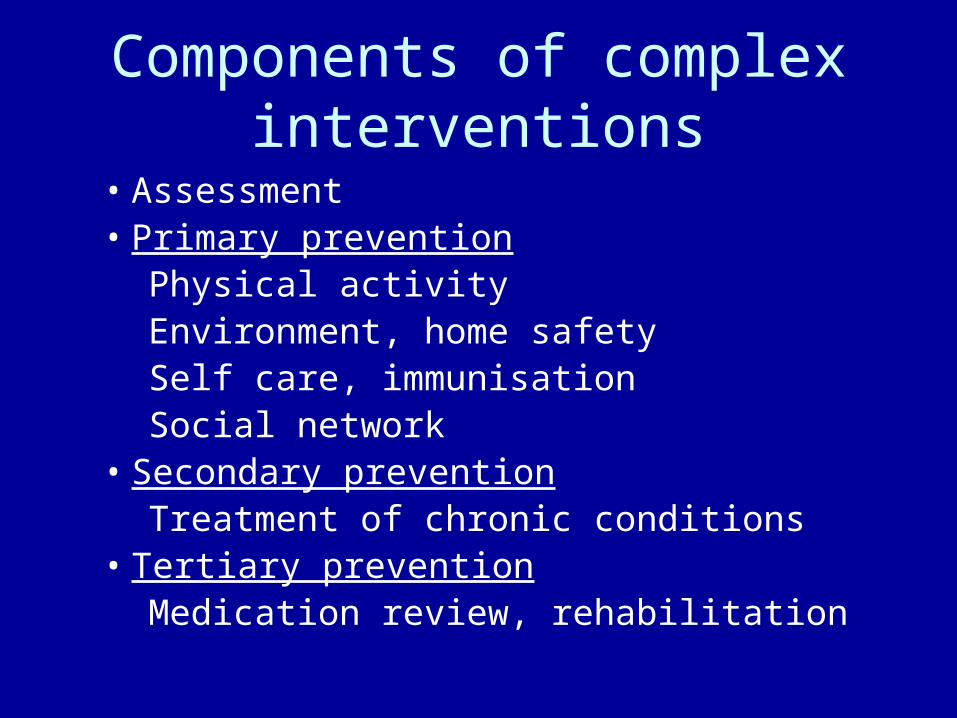
Components of complex interventions
• Assessment• Primary prevention
Physical activity Environment, home safetySelf care, immunisationSocial network
• Secondary preventionTreatment of chronic conditions
• Tertiary preventionMedication review, rehabilitation

Meta-analysis of 45 trials
0.87 (95% CI 0.79, 0.94)
Relative risk of not living in own home
Favours intervention
Favours control
Beswick A et al, Lancet 2007
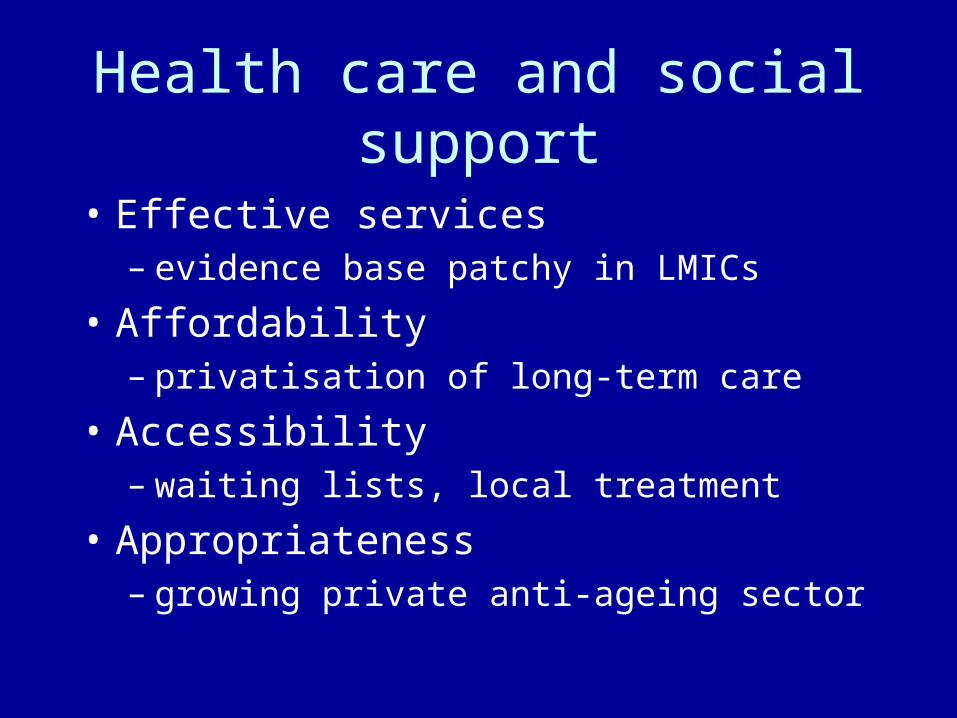
Health care and social support
• Effective services– evidence base patchy in LMICs
• Affordability– privatisation of long-term care
• Accessibility– waiting lists, local treatment
• Appropriateness– growing private anti-ageing sector
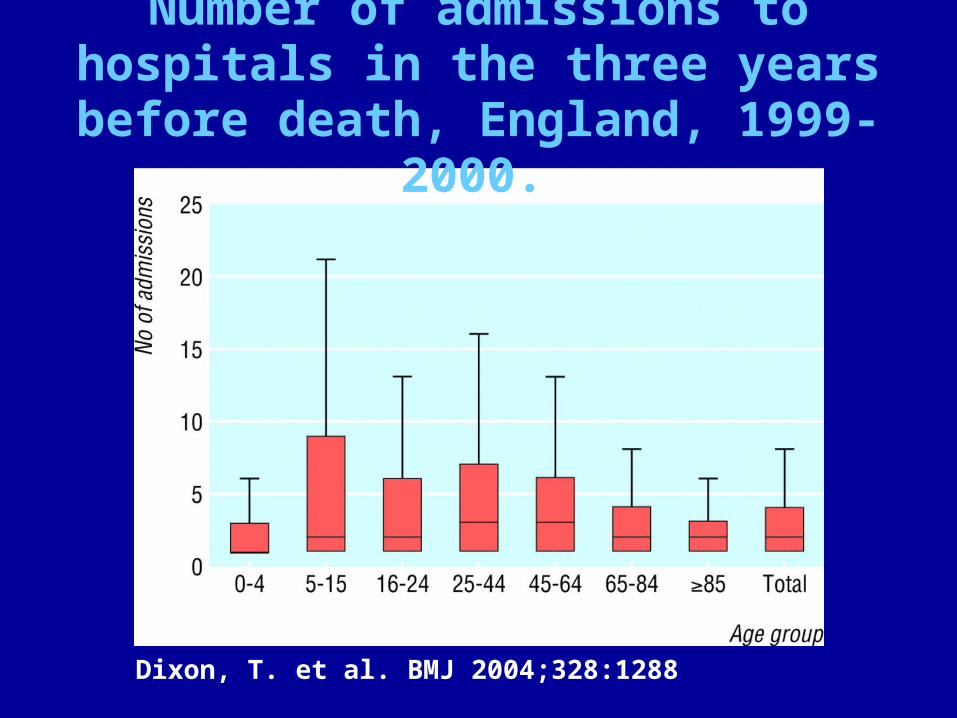
Dixon, T. et al. BMJ 2004;328:1288
Number of admissions to hospitals in the three years before death, England,
1999-2000.
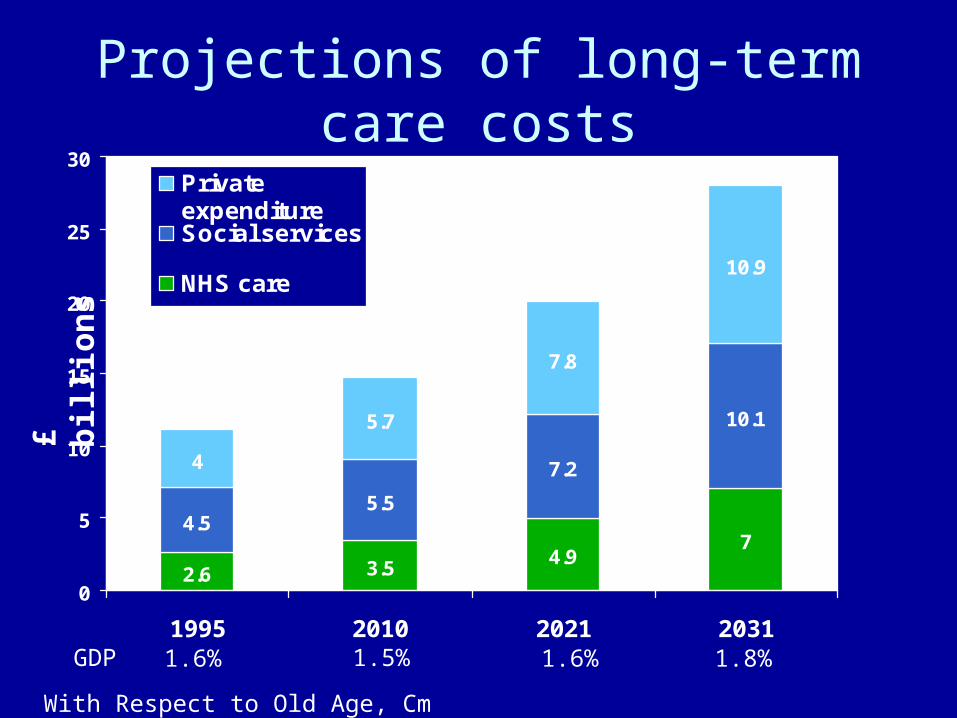
Projections of long-term care costs£
bil
lio
ns
£11.1
£14.7
£19.9
£28.0
2.6 3.54.9
74.5
5.5
7.2
10.1
4
5.7
7.8
10.9
0
5
10
15
20
25
30
1995 2010 2021 2031
PrivateexpenditureSocial services
NHS care
1.6% 1.5% 1.6% 1.8%GDP
With Respect to Old Age, Cm 4129, 1999
Summary
• Socio-economic factors play a major role in determining survival and disability
• Women do better than men in terms of survival but not in terms of disability
• Health services do improve survival and reduce institutionalisation
• But too much health service use is a problem for many