successful it organizations · network internet access, wide area network (wan), local area ......
TRANSCRIPT
Successful IT Organizations
Louis BoyleVice President
Gartner Executive Programs
Agenda
W5 + 1
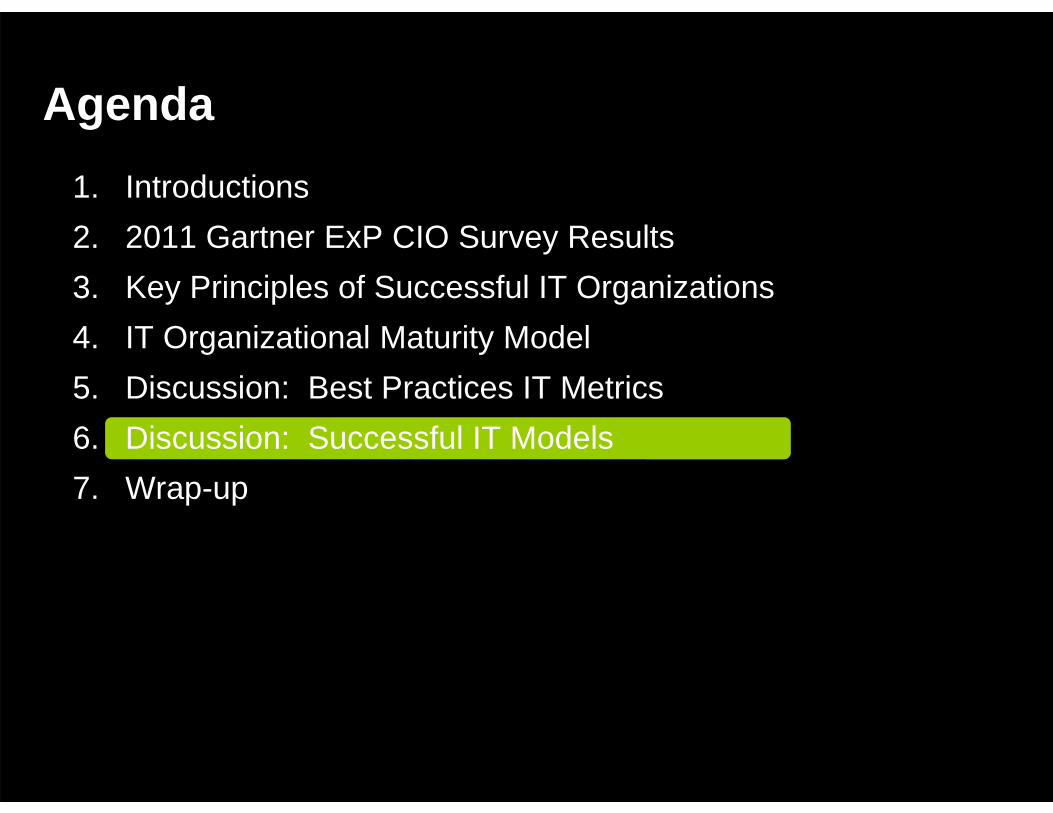
Agenda1. Introductions2. 2011 Gartner ExP CIO Survey Results3. Key Principles of Successful IT Organizations4. IT Organizational Maturity Model5. Discussion: Best Practices IT Metrics6. Discussion: Successful IT Models7. Wrap-up
Agenda
1. Introductions2. 2011 Gartner ExP CIO Survey Results3. Key Principles of Successful IT Organizations4. IT Organizational Maturity Model5. Discussion: Best Practices IT Metrics6. Discussion: Successful IT Models7. Wrap-up
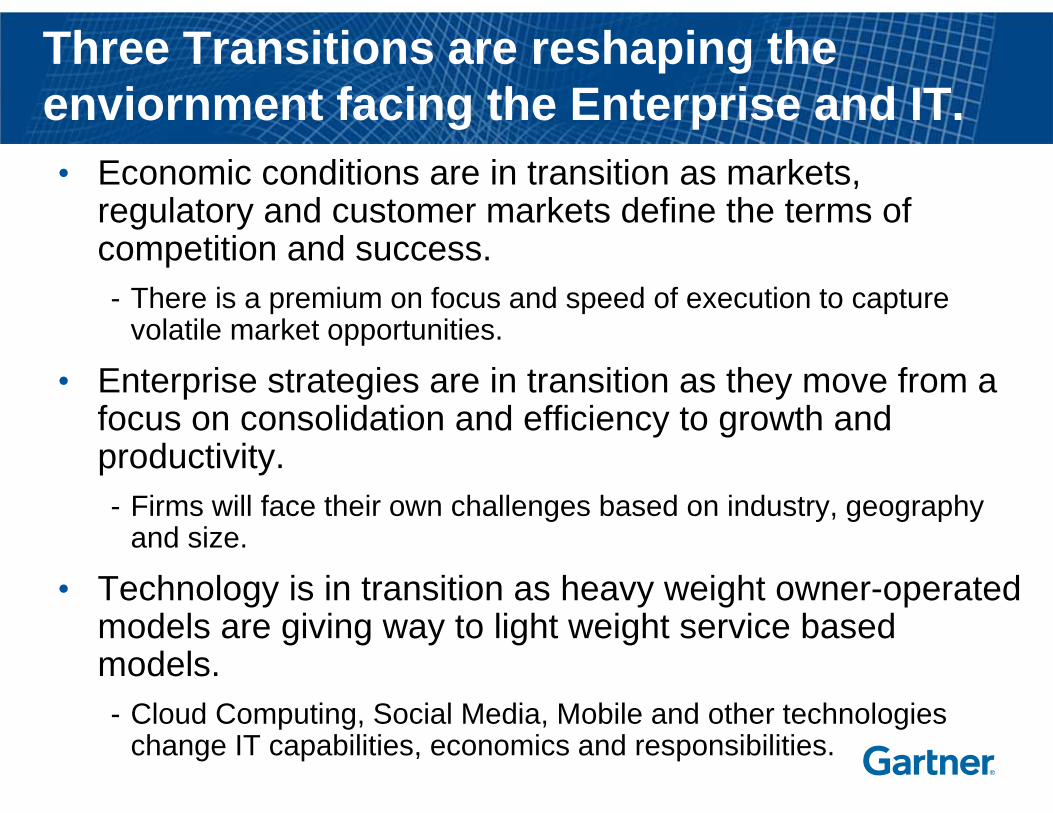
Three Transitions are reshaping the enviornment facing the Enterprise and IT.• Economic conditions are in transition as markets,
regulatory and customer markets define the terms of competition and success.- There is a premium on focus and speed of execution to capture
volatile market opportunities.
• Enterprise strategies are in transition as they move from a focus on consolidation and efficiency to growth and productivity.- Firms will face their own challenges based on industry, geography
and size.
• Technology is in transition as heavy weight owner-operated models are giving way to light weight service based models.- Cloud Computing, Social Media, Mobile and other technologies
change IT capabilities, economics and responsibilities.
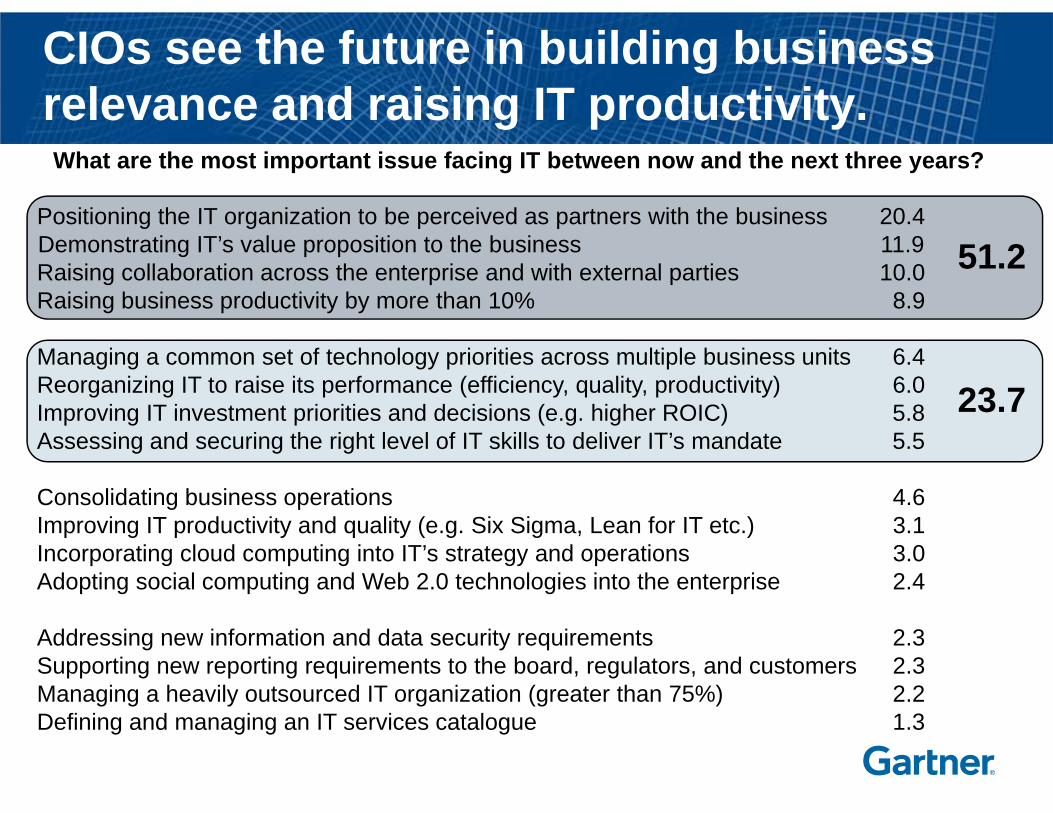
23.7
51.2
CIOs see the future in building business relevance and raising IT productivity.
Positioning the IT organization to be perceived as partners with the business 20.4Demonstrating IT’s value proposition to the business 11.9Raising collaboration across the enterprise and with external parties 10.0Raising business productivity by more than 10% 8.9
Managing a common set of technology priorities across multiple business units 6.4Reorganizing IT to raise its performance (efficiency, quality, productivity) 6.0Improving IT investment priorities and decisions (e.g. higher ROIC) 5.8Assessing and securing the right level of IT skills to deliver IT’s mandate 5.5
Consolidating business operations 4.6Improving IT productivity and quality (e.g. Six Sigma, Lean for IT etc.) 3.1Incorporating cloud computing into IT’s strategy and operations 3.0Adopting social computing and Web 2.0 technologies into the enterprise 2.4
Addressing new information and data security requirements 2.3Supporting new reporting requirements to the board, regulators, and customers 2.3Managing a heavily outsourced IT organization (greater than 75%) 2.2Defining and managing an IT services catalogue 1.3
What are the most important issue facing IT between now and the next three years?
Agenda1. Introductions2. 2011 Gartner ExP CIO Survey Results3. Key Principles of Successful IT Organizations4. IT Organizational Maturity Model5. Discussion: Best Practices IT Metrics6. Discussion: Successful IT Models7. Wrap-up
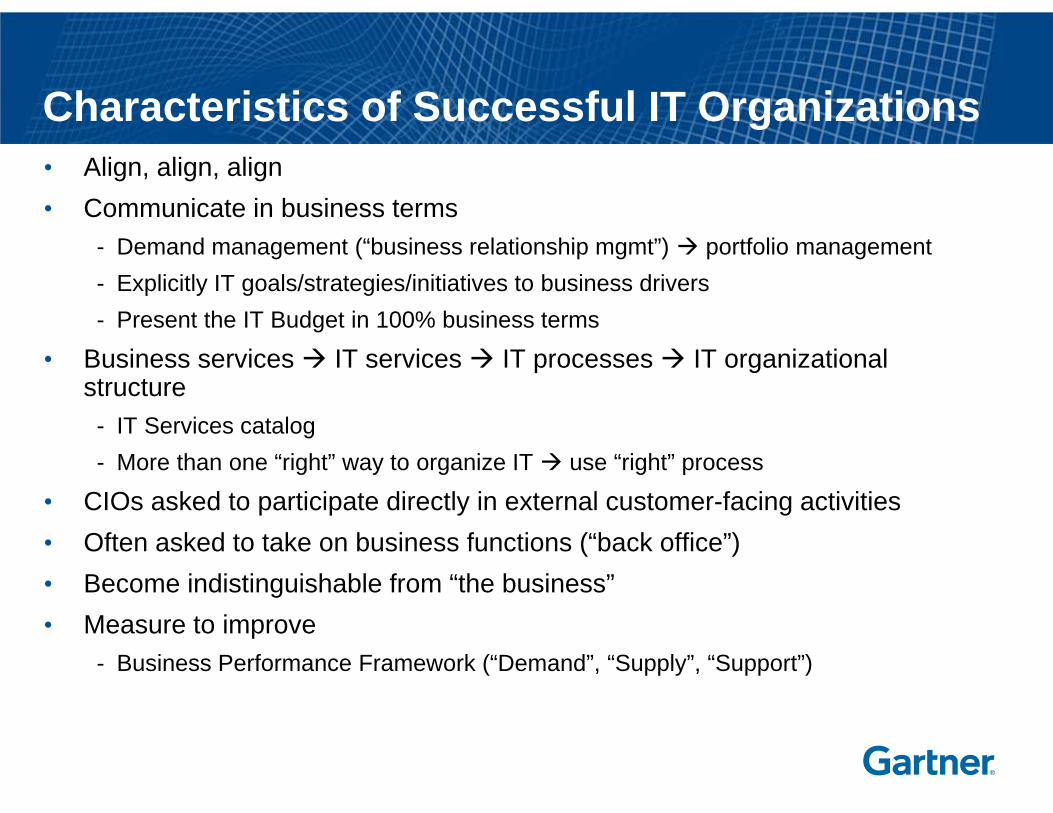
Characteristics of Successful IT Organizations• Align, align, align• Communicate in business terms
- Demand management (“business relationship mgmt”) portfolio management- Explicitly IT goals/strategies/initiatives to business drivers- Present the IT Budget in 100% business terms
• Business services IT services IT processes IT organizational structure
- IT Services catalog- More than one “right” way to organize IT use “right” process
• CIOs asked to participate directly in external customer-facing activities• Often asked to take on business functions (“back office”)• Become indistinguishable from “the business” • Measure to improve
- Business Performance Framework (“Demand”, “Supply”, “Support”)
Agenda1. Introductions2. 2011 Gartner ExP CIO Survey Results3. Key Principles of Successful IT Organizations4. IT Organizational Maturity Model5. Discussion: Best Practices IT Metrics6. Discussion: Successful IT Models7. Wrap-up
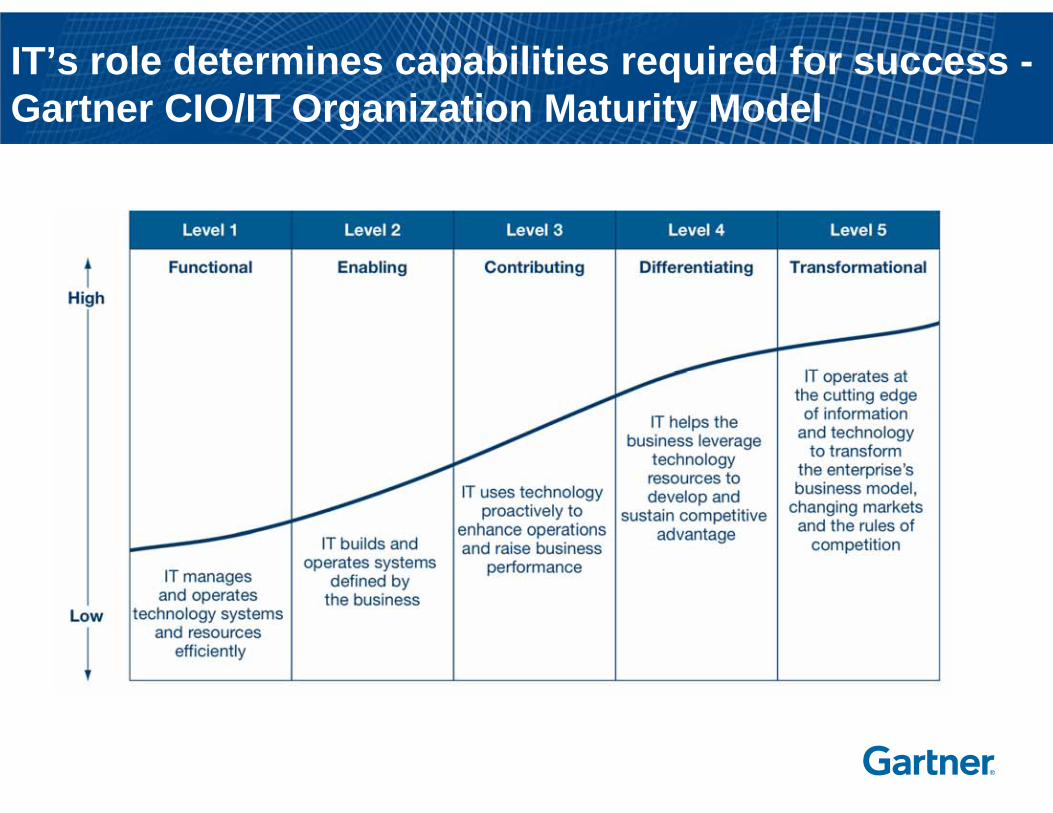
IT’s role determines capabilities required for success -Gartner CIO/IT Organization Maturity Model
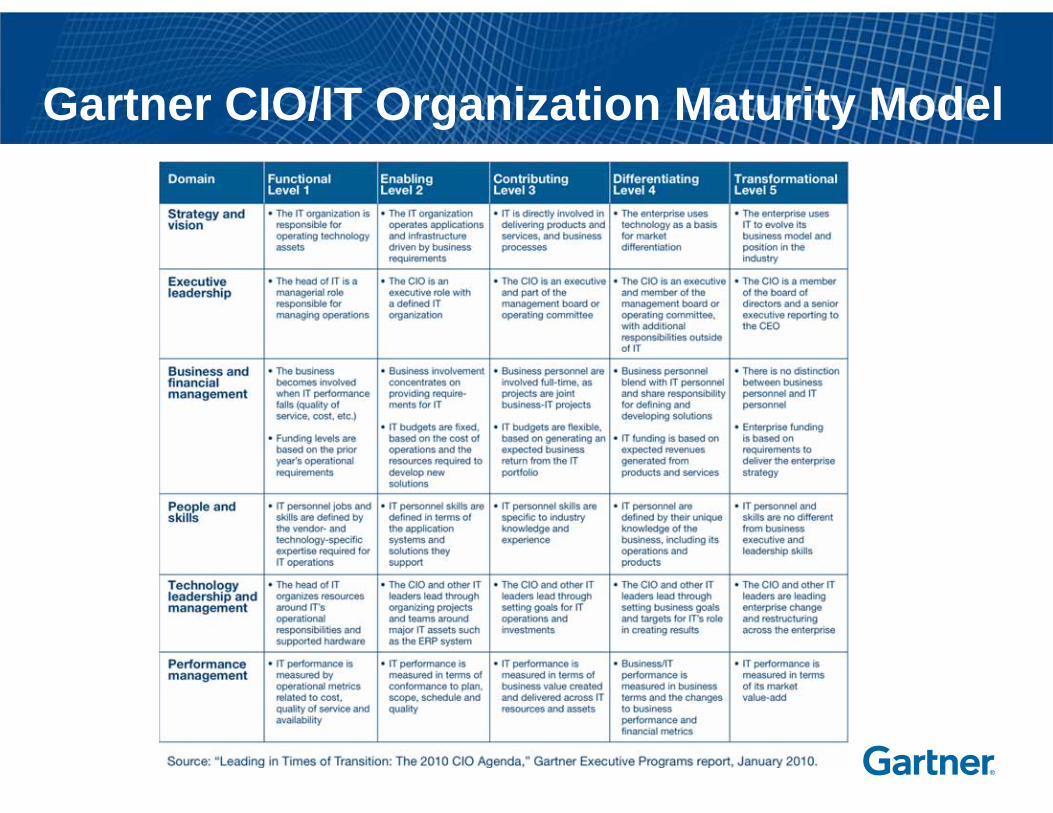
Gartner CIO/IT Organization Maturity Model
Agenda1. Introductions2. 2011 Gartner ExP CIO Survey Results3. Key Principles of Successful IT Organizations4. IT Organizational Maturity Model5. Discussion: Best Practices IT Metrics6. Discussion: Successful IT Models7. Wrap-up
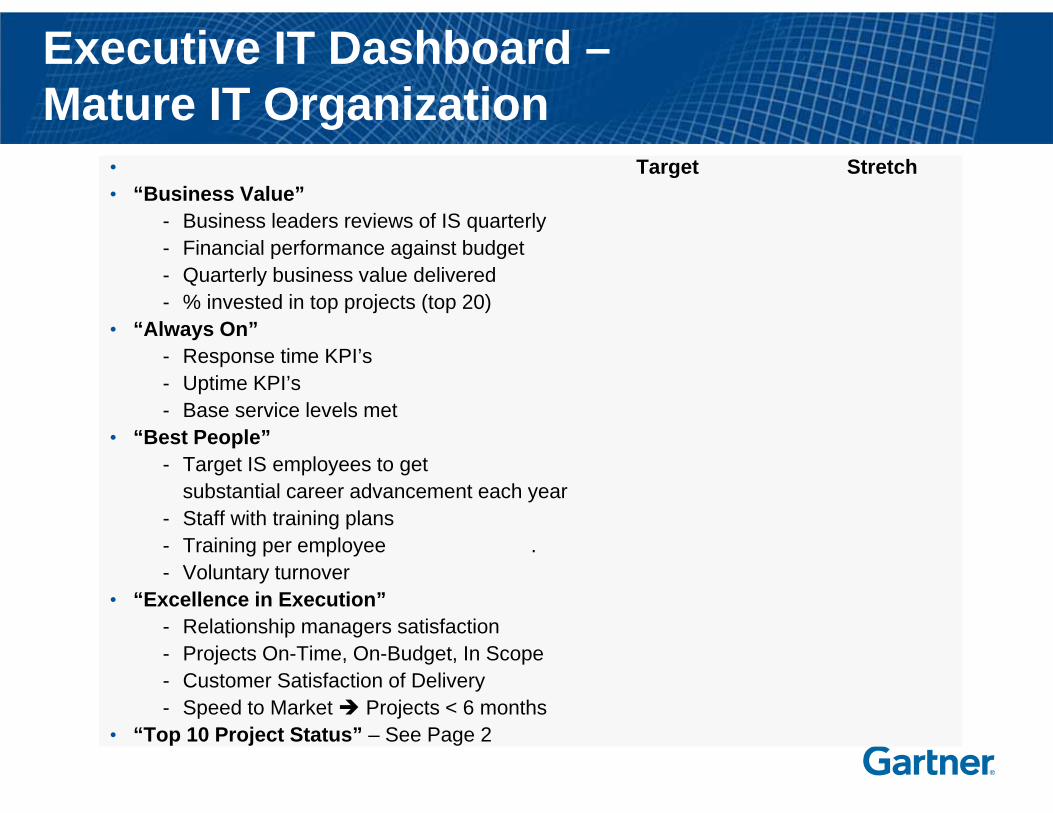
Executive IT Dashboard –Mature IT Organization
• Target Stretch• “Business Value”
- Business leaders reviews of IS quarterly- Financial performance against budget- Quarterly business value delivered- % invested in top projects (top 20)
• “Always On”- Response time KPI’s- Uptime KPI’s- Base service levels met
• “Best People”- Target IS employees to get
substantial career advancement each year- Staff with training plans- Training per employee .- Voluntary turnover
• “Excellence in Execution”- Relationship managers satisfaction- Projects On-Time, On-Budget, In Scope- Customer Satisfaction of Delivery- Speed to Market Projects < 6 months
• “Top 10 Project Status” – See Page 2
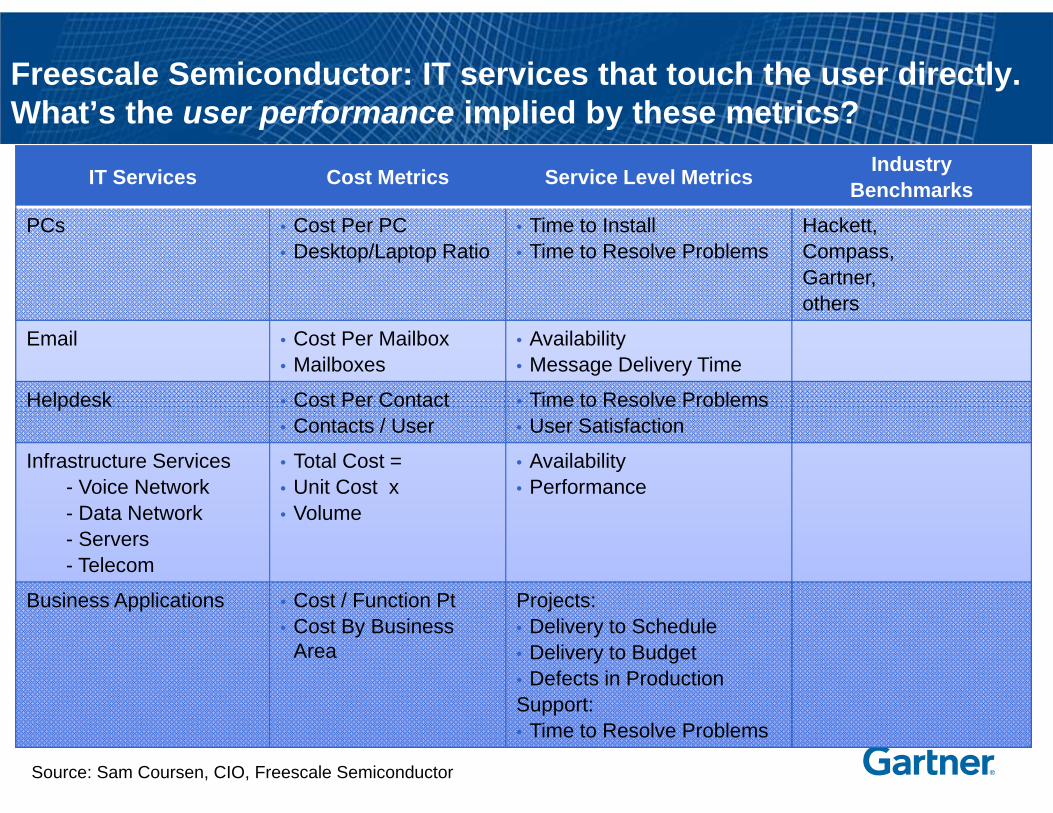
Freescale Semiconductor: IT services that touch the user directly. What’s the user performance implied by these metrics?
IT Services Cost Metrics Service Level Metrics IndustryBenchmarks
PCs • Cost Per PC• Desktop/Laptop Ratio
• Time to Install• Time to Resolve Problems
Hackett,Compass,Gartner, others
Email • Cost Per Mailbox• Mailboxes
• Availability• Message Delivery Time
Helpdesk • Cost Per Contact• Contacts / User
• Time to Resolve Problems• User Satisfaction
Infrastructure Services- Voice Network- Data Network- Servers- Telecom
• Total Cost =• Unit Cost x• Volume
• Availability• Performance
Business Applications • Cost / Function Pt• Cost By Business
Area
Projects:• Delivery to Schedule• Delivery to Budget• Defects in ProductionSupport:• Time to Resolve Problems
Source: Sam Coursen, CIO, Freescale Semiconductor
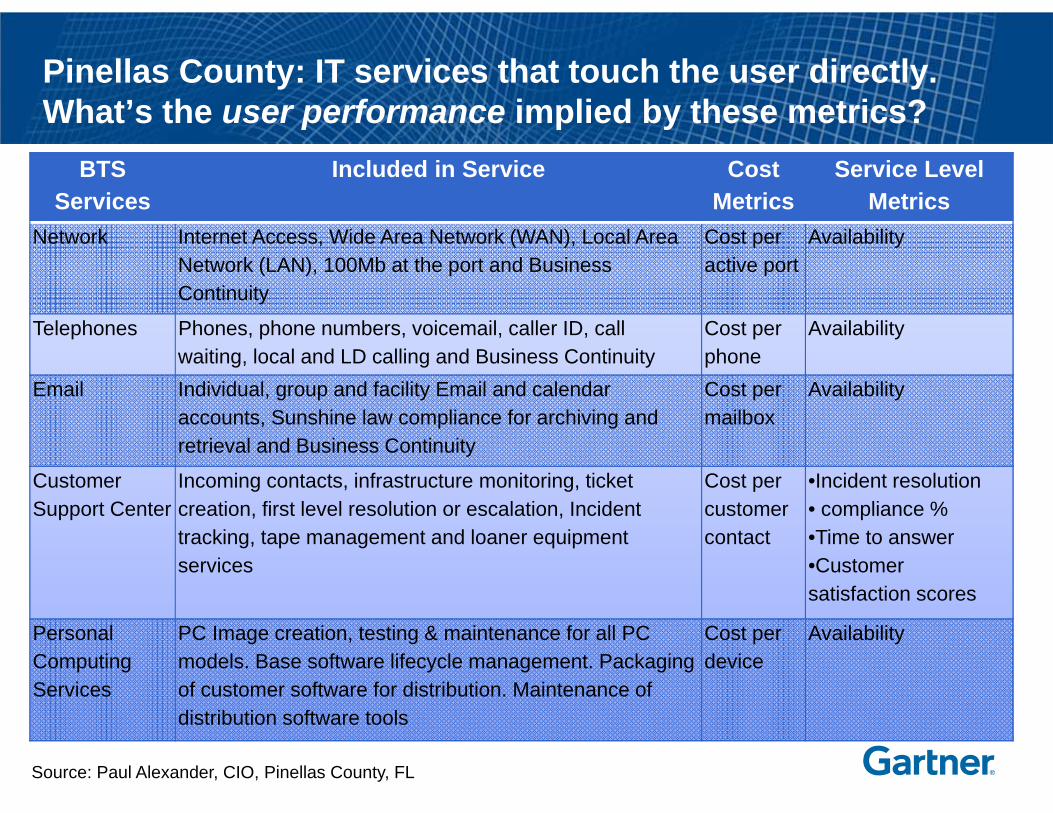
Pinellas County: IT services that touch the user directly. What’s the user performance implied by these metrics?
BTS Services
Included in Service Cost Metrics
Service Level Metrics
Network Internet Access, Wide Area Network (WAN), Local Area Network (LAN), 100Mb at the port and Business Continuity
Cost per active port
Availability
Telephones Phones, phone numbers, voicemail, caller ID, call waiting, local and LD calling and Business Continuity
Cost per phone
Availability
Email Individual, group and facility Email and calendar accounts, Sunshine law compliance for archiving and retrieval and Business Continuity
Cost per mailbox
Availability
Customer Support Center
Incoming contacts, infrastructure monitoring, ticket creation, first level resolution or escalation, Incident tracking, tape management and loaner equipment services
Cost per customer contact
•Incident resolution• compliance % •Time to answer•Customer satisfaction scores
Personal Computing Services
PC Image creation, testing & maintenance for all PC models. Base software lifecycle management. Packaging of customer software for distribution. Maintenance of distribution software tools
Cost per device
Availability
Source: Paul Alexander, CIO, Pinellas County, FL
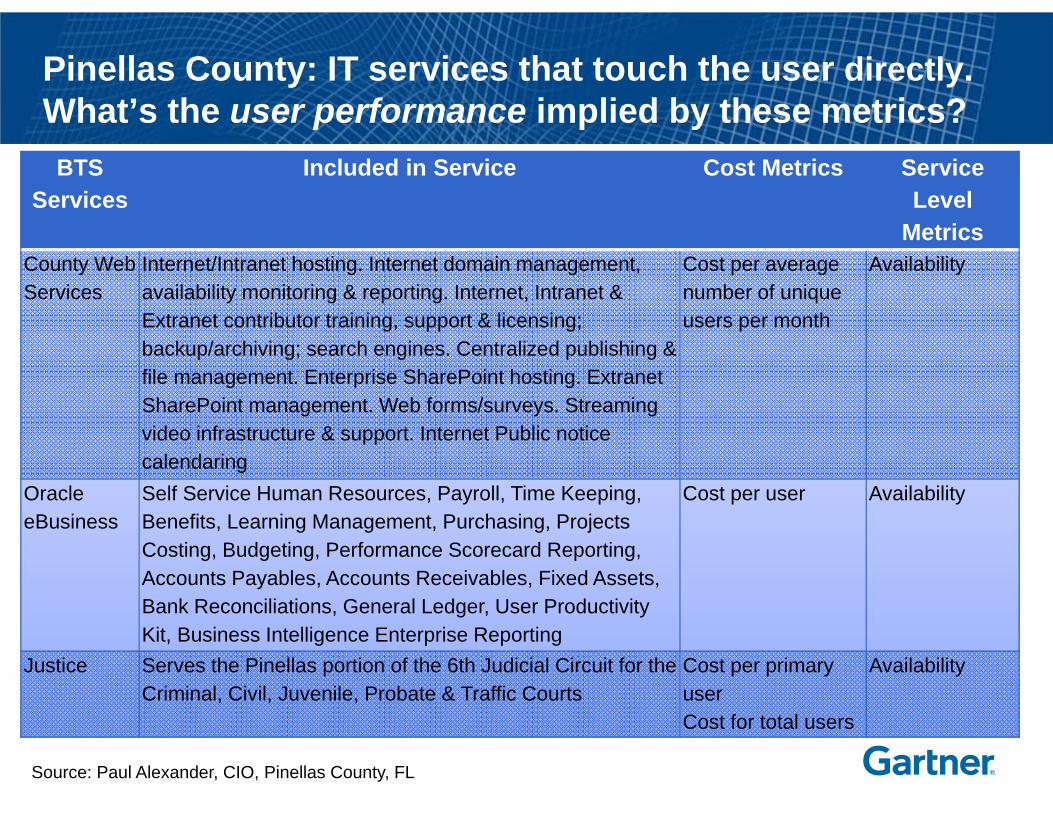
Pinellas County: IT services that touch the user directly. What’s the user performance implied by these metrics?
BTS Services
Included in Service Cost Metrics Service Level
MetricsCounty Web Services
Internet/Intranet hosting. Internet domain management, availability monitoring & reporting. Internet, Intranet & Extranet contributor training, support & licensing; backup/archiving; search engines. Centralized publishing & file management. Enterprise SharePoint hosting. Extranet SharePoint management. Web forms/surveys. Streaming video infrastructure & support. Internet Public notice calendaring
Cost per average number of unique users per month
Availability
Oracle eBusiness
Self Service Human Resources, Payroll, Time Keeping, Benefits, Learning Management, Purchasing, Projects Costing, Budgeting, Performance Scorecard Reporting, Accounts Payables, Accounts Receivables, Fixed Assets, Bank Reconciliations, General Ledger, User Productivity Kit, Business Intelligence Enterprise Reporting
Cost per user Availability
Justice Serves the Pinellas portion of the 6th Judicial Circuit for the Criminal, Civil, Juvenile, Probate & Traffic Courts
Cost per primary userCost for total users
Availability
Source: Paul Alexander, CIO, Pinellas County, FL
16
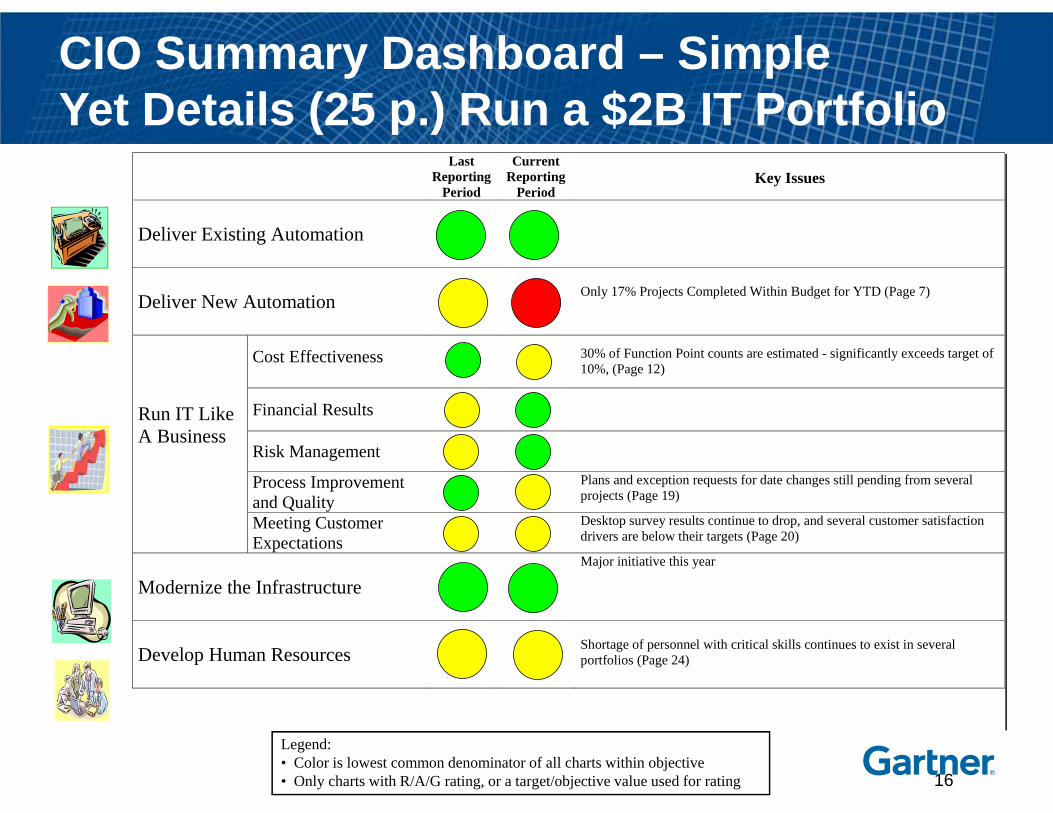
CIO Summary Dashboard – SimpleYet Details (25 p.) Run a $2B IT Portfolio
Legend:• Color is lowest common denominator of all charts within objective• Only charts with R/A/G rating, or a target/objective value used for rating
Last Reporting
Period
Current Reporting
Period
Key Issues
Deliver Existing Automation
Deliver New Automation
Only 17% Projects Completed Within Budget for YTD (Page 7)
Run IT Like A Business
Cost Effectiveness
30% of Function Point counts are estimated - significantly exceeds target of 10%, (Page 12)
Financial Results
Risk Management
Process Improvement and Quality
Plans and exception requests for date changes still pending from several projects (Page 19)
Meeting Customer Expectations
Desktop survey results continue to drop, and several customer satisfaction drivers are below their targets (Page 20)
Modernize the Infrastructure
Major initiative this year
Develop Human Resources
Shortage of personnel with critical skills continues to exist in several portfolios (Page 24)
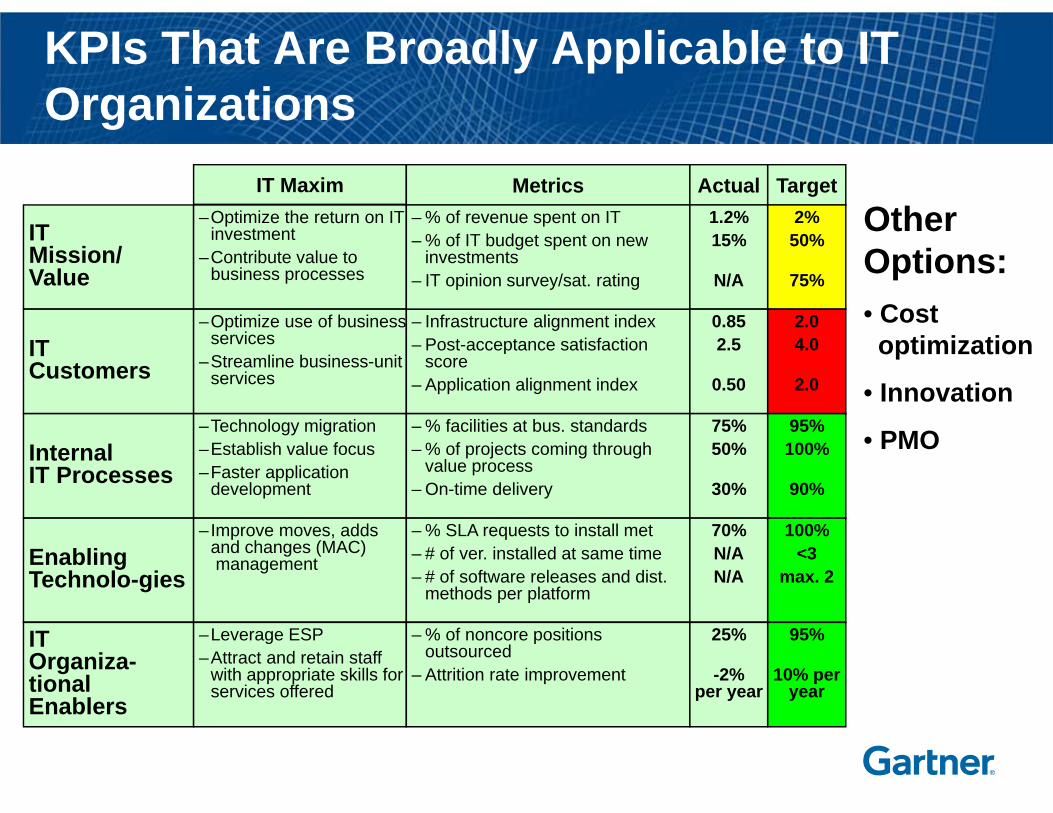
IT Mission/Value
ITCustomers
Internal IT Processes
Enabling Technolo-gies
IT Organiza-tional Enablers
–Optimize the return on IT investment
–Contribute value to business processes
IT Maxim
–Optimize use of business services
–Streamline business-unit services
–Technology migration–Establish value focus–Faster application
development
–Improve moves, adds and changes (MAC)management
–Leverage ESP–Attract and retain staff
with appropriate skills for services offered
– Infrastructure alignment index– Post-acceptance satisfaction
score– Application alignment index
Metrics– % of revenue spent on IT– % of IT budget spent on new
investments– IT opinion survey/sat. rating
– % facilities at bus. standards– % of projects coming through
value process– On-time delivery
– % SLA requests to install met– # of ver. installed at same time– # of software releases and dist.
methods per platform
– % of noncore positions outsourced
– Attrition rate improvement
Actual1.2%15%
N/A
0.852.5
0.50
75%50%
30%
70%N/AN/A
25%
-2% per year
Target2%50%
75%
2.04.0
2.0
95%100%
90%
100%<3
max. 2
95%
10% per year
KPIs That Are Broadly Applicable to IT Organizations
Other Options:• Cost optimization
• Innovation
• PMO
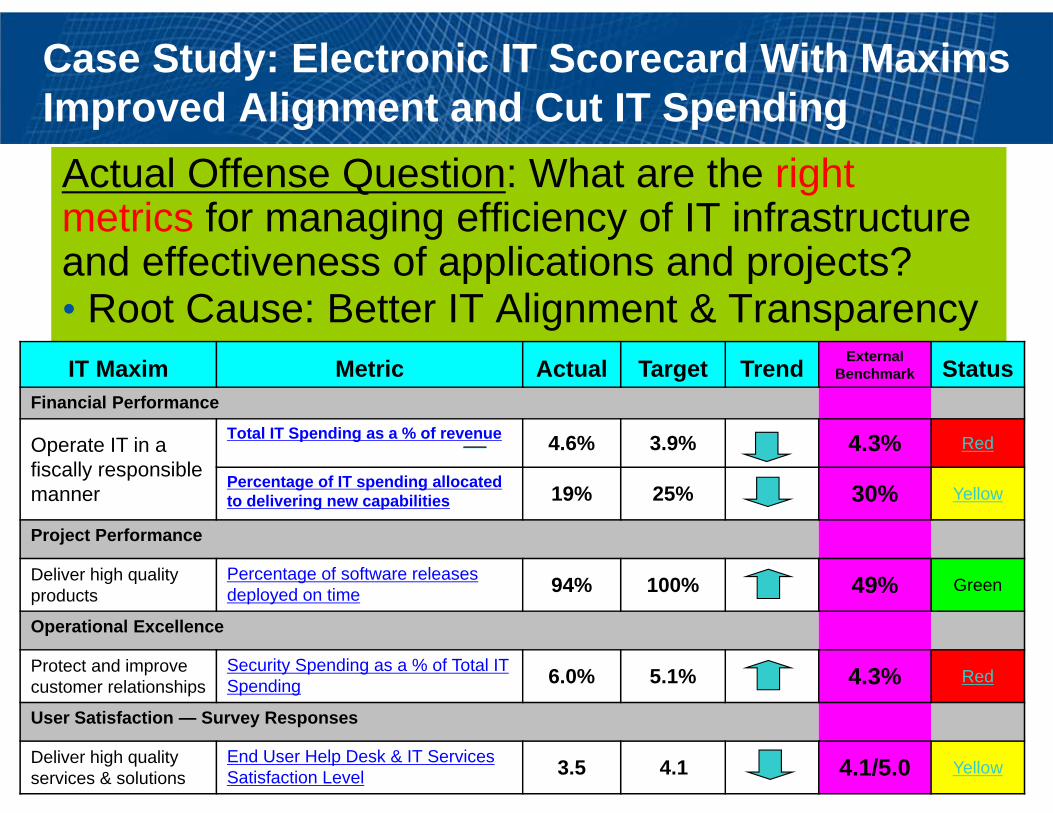
Case Study: Electronic IT Scorecard With Maxims Improved Alignment and Cut IT SpendingActual Offense Question: What are the right metrics for managing efficiency of IT infrastructure and effectiveness of applications and projects? • Root Cause: Better IT Alignment & TransparencyIT Maxim Metric Actual Target Trend External
Benchmark StatusFinancial Performance
Operate IT in a fiscally responsible manner
Total IT Spending as a % of revenue 4.6% 3.9% 4.3% Red
Percentage of IT spending allocated to delivering new capabilities 19% 25% 30% Yellow
Project Performance
Deliver high quality products
Percentage of software releases deployed on time 94% 100% 49% Green
Operational Excellence
Protect and improve customer relationships
Security Spending as a % of Total IT Spending 6.0% 5.1% 4.3% Red
User Satisfaction — Survey Responses
Deliver high quality services & solutions
End User Help Desk & IT Services Satisfaction Level 3.5 4.1 4.1/5.0 Yellow
Agenda1. Introductions2. 2011 Gartner ExP CIO Survey Results3. Key Principles of Successful IT Organizations4. IT Organizational Maturity Model5. Discussion: Best Practices IT Metrics6. Discussion: Successful IT Models7. Wrap-up
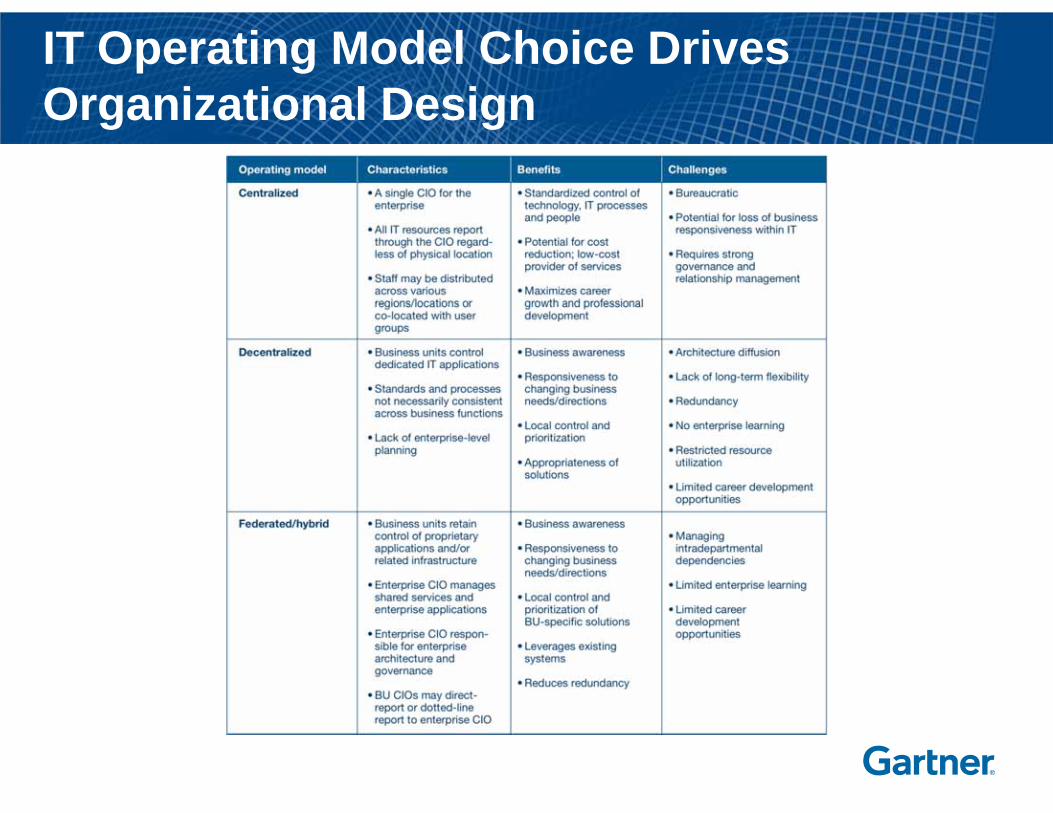
IT Operating Model Choice Drives Organizational Design
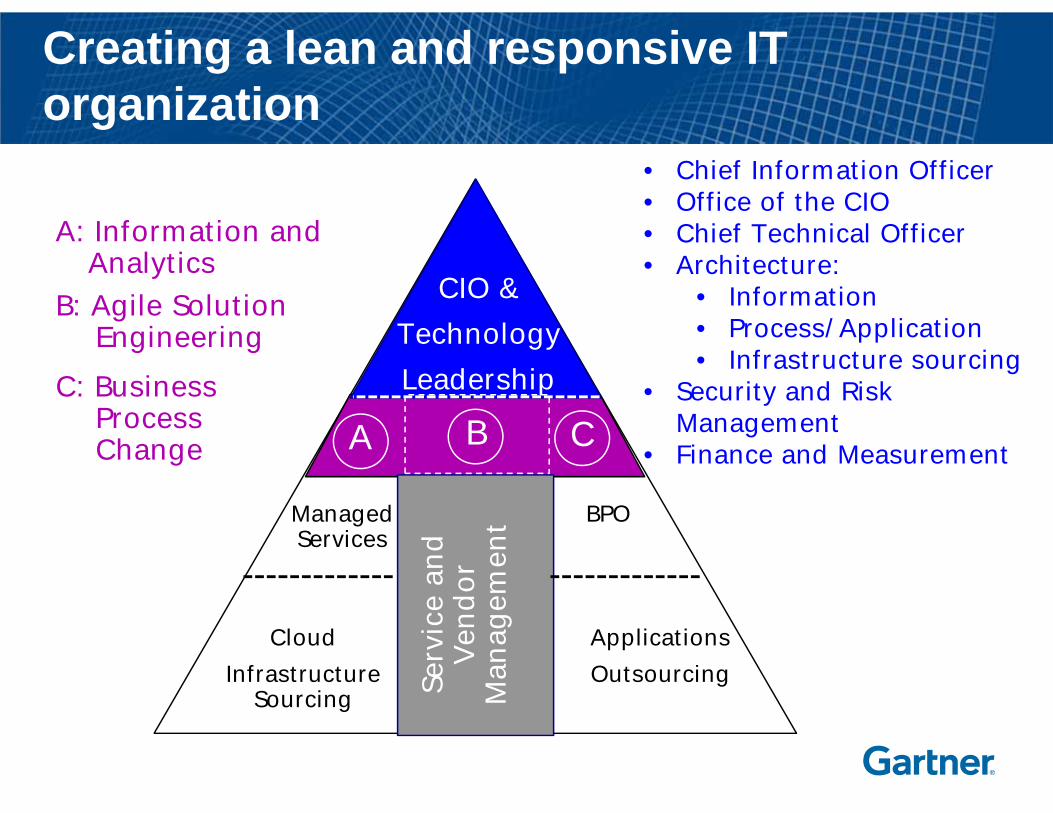
Creating a lean and responsive IT organization
Serv
ice
and
Vend
or
Man
agem
ent
CIO & TechnologyLeadership
A: Information and Analytics
C: Business Process Change
Custom Solutions
EngineeringB: Agile Solution
Engineering
A CB
Managed Services
BPO
CloudInfrastructure
Sourcing
ApplicationsOutsourcing
• Chief Information Officer• Office of the CIO• Chief Technical Officer• Architecture:
• Information• Process/Application• Infrastructure sourcing
• Security and Risk Management
• Finance and Measurement
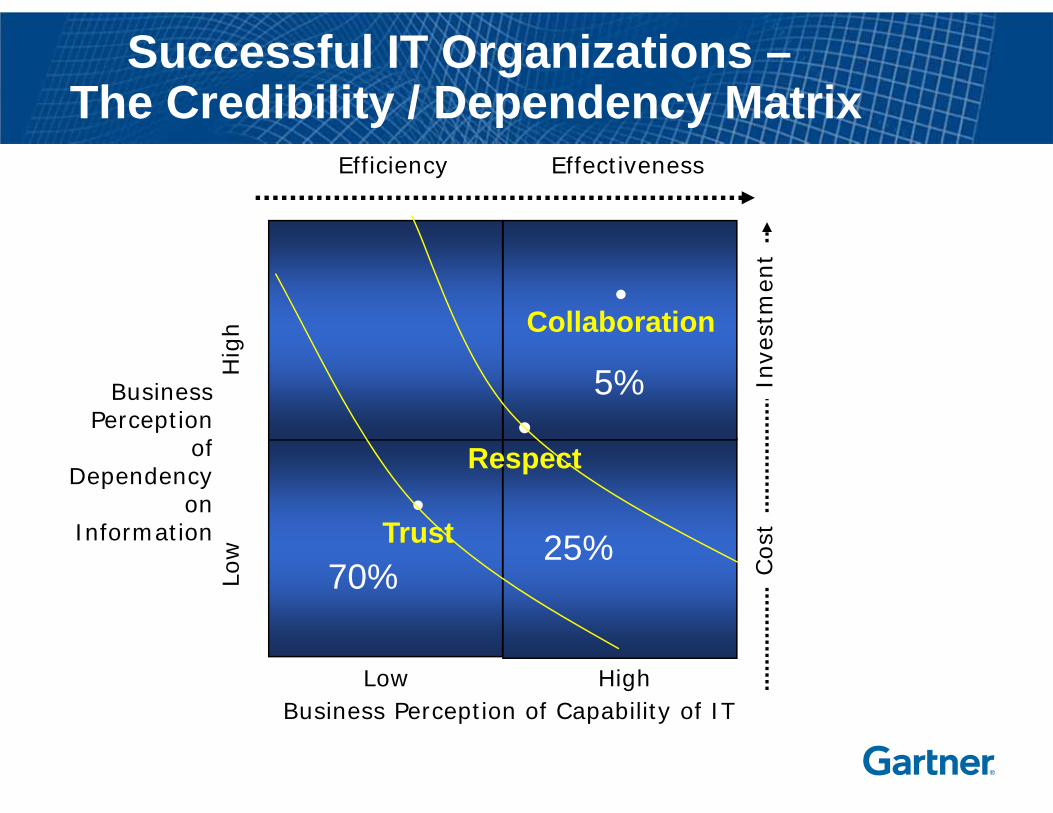
EffectivenessEfficiency
BusinessPerception
ofDependency
onInformation
Business Perception of Capability of ITHighLow
Hig
hLo
w
Inve
stm
ent
Cos
t
•Trust
•Respect
•Collaboration
70%25%
5%
Successful IT Organizations –The Credibility / Dependency Matrix
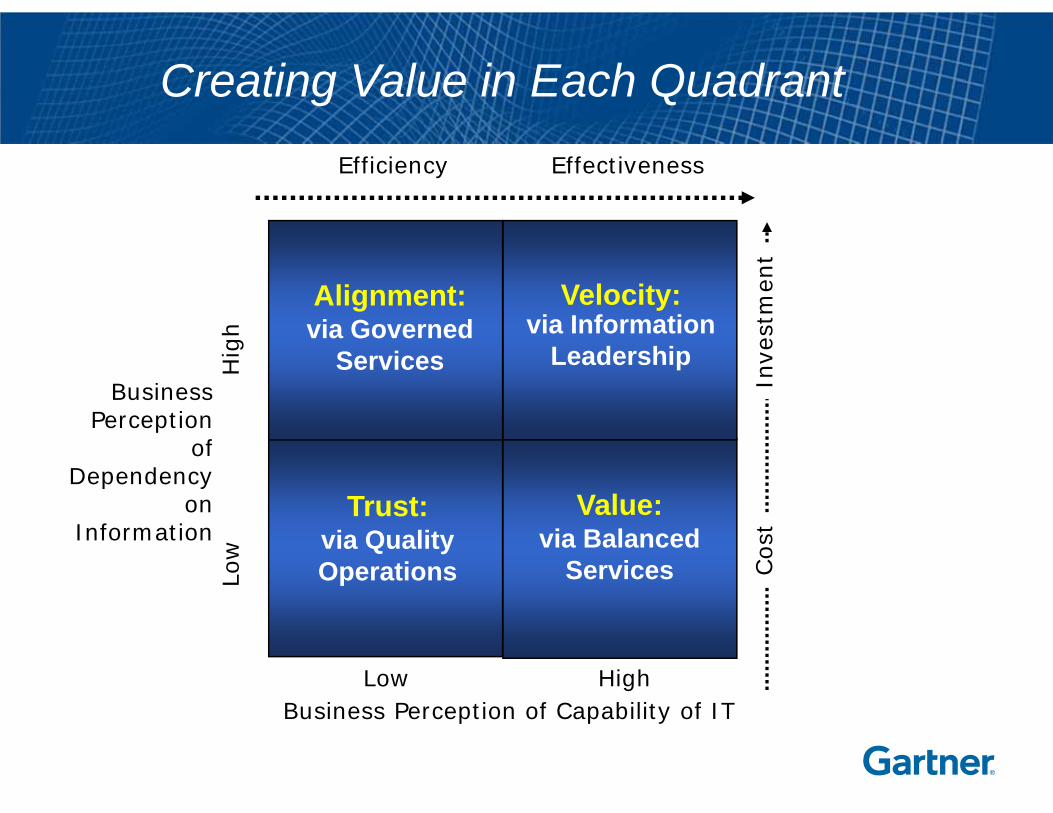
EffectivenessEfficiency
BusinessPerception
ofDependency
onInformation
Business Perception of Capability of ITHighLow
Hig
hLo
w
Inve
stm
ent
Cos
t
Velocity:via Information
Leadership
Creating Value in Each Quadrant
Value:via Balanced
Services
Alignment:via Governed
Services
Trust:via QualityOperations

Characteristics of Successful IT Organizations• Align, align, align• Communicate in business terms
- Demand management (“business relationship mgmt”) portfolio management- Explicitly IT goals/strategies/initiatives to business drivers- Present the IT Budget in 100% business terms
• Business services IT services IT processes IT organizational structure
- IT Services catalog- More than one “right” way to organize IT use “right” process
• CIOs asked to participate directly in external customer-facing activities• Often asked to take on business functions (“back office”)• Become indistinguishable from “the business” • Measure to improve
- Business Performance Framework (“Demand”, “Supply”, “Support”)
Wrap Up
?
!
Thanks
Appendix
• Gartner Business Value Model
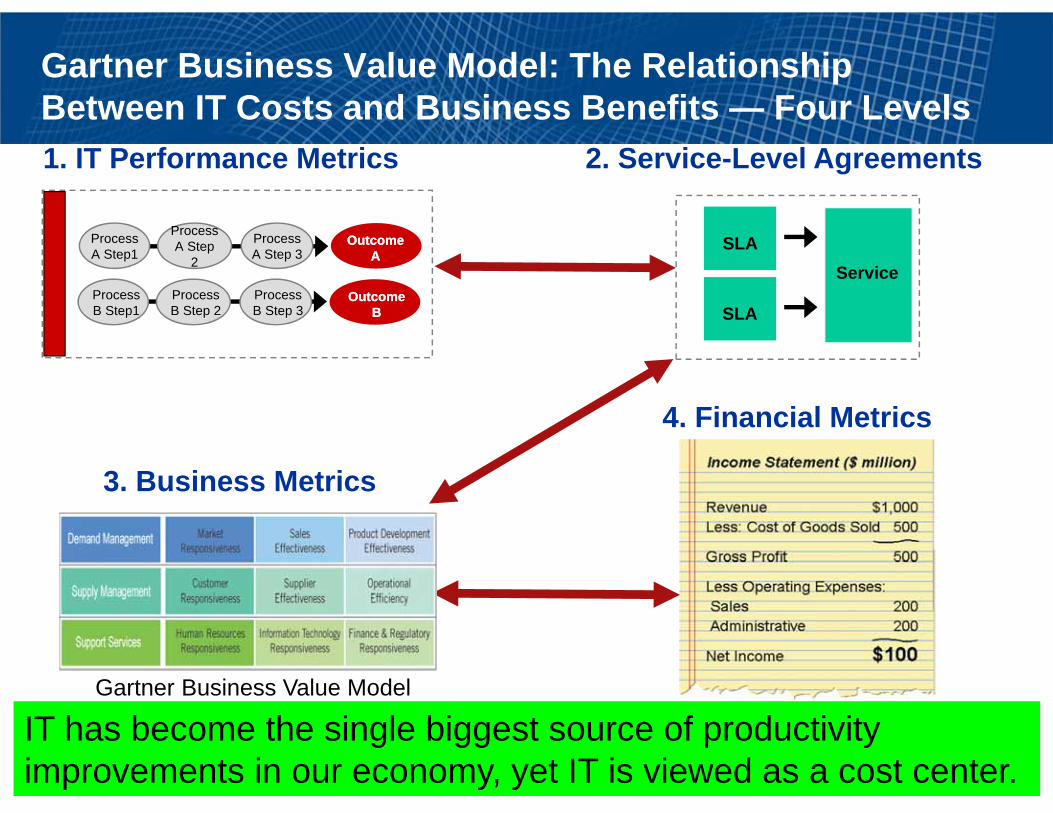
Gartner Business Value Model: The Relationship Between IT Costs and Business Benefits — Four Levels
4. Financial Metrics
1. IT Performance Metrics
Process A Step1
Process A Step
2
Process A Step 3
Outcome A
Outcome A
Process B Step1
Process B Step 2
Process B Step 3
Outcome B
Outcome B
2. Service-Level Agreements
Service SLA
SLA
Gartner Business Value Model
3. Business Metrics
IT has become the single biggest source of productivity improvements in our economy, yet IT is viewed as a cost center.
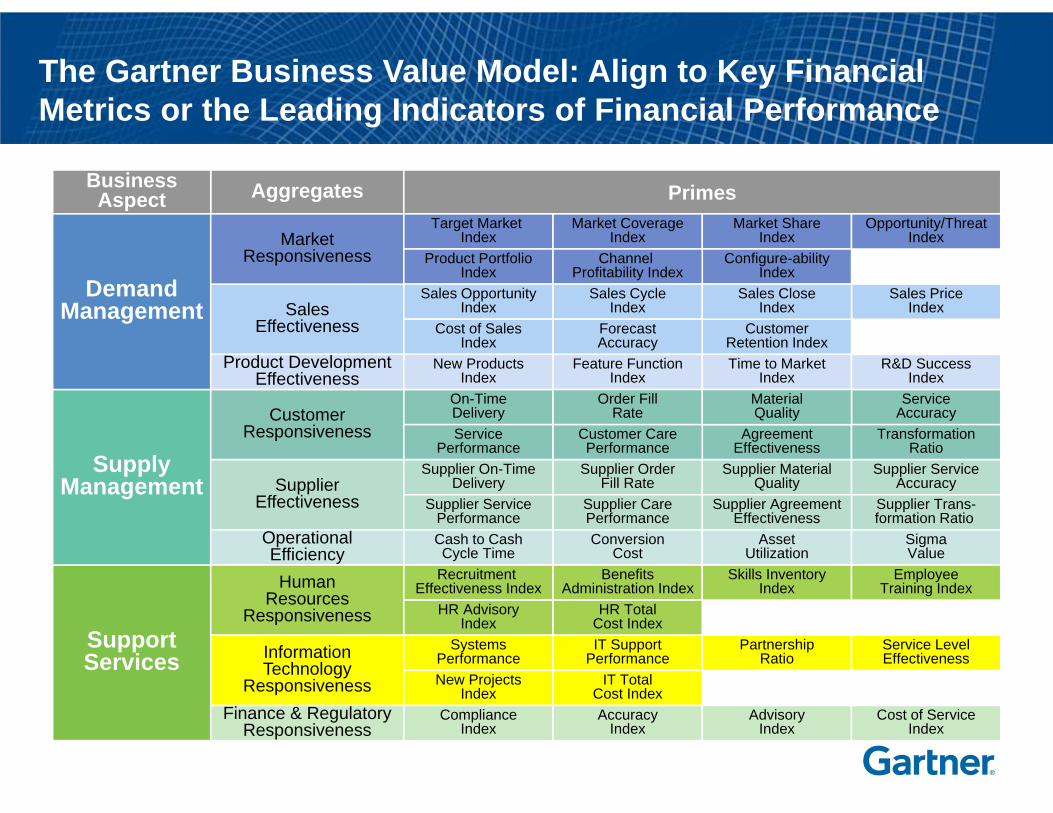
The Gartner Business Value Model: Align to Key Financial Metrics or the Leading Indicators of Financial Performance
SupportServices
SupplyManagement
Aggregates PrimesBusinessAspect
DemandManagement
CustomerResponsiveness
SalesEffectiveness
MarketResponsiveness
Product DevelopmentEffectiveness
SupplierEffectiveness
OperationalEfficiencyHuman
ResourcesResponsiveness
InformationTechnology
ResponsivenessFinance & Regulatory
Responsiveness
On-TimeDelivery
ServiceAccuracy
AgreementEffectiveness
Target Market Index
Product PortfolioIndex
Sales OpportunityIndex
Sales PriceIndex
CustomerRetention Index
Market CoverageIndex
Market ShareIndex
Configure-abilityIndex
Channel Profitability Index
Opportunity/ThreatIndex
Cost of SalesIndex
Sales CycleIndex
ForecastAccuracy
Sales CloseIndex
New ProductsIndex
Feature FunctionIndex
Time to MarketIndex
R&D SuccessIndex
ServicePerformance
Order FillRate
MaterialQuality
Customer CarePerformance
TransformationRatio
Supplier On-TimeDelivery
Supplier ServicePerformance
Supplier OrderFill Rate
Supplier CarePerformance
Supplier MaterialQuality
Supplier ServiceAccuracy
Supplier Trans-formation Ratio
Supplier AgreementEffectiveness
Cash to CashCycle Time
ConversionCost
AssetUtilization
SigmaValue
Recruitment Effectiveness Index
HR AdvisoryIndex
BenefitsAdministration Index
HR TotalCost Index
Skills InventoryIndex
EmployeeTraining Index
SystemsPerformanceNew Projects
Index
IT SupportPerformance
IT TotalCost Index
PartnershipRatio
Service LevelEffectiveness
ComplianceIndex
AccuracyIndex
AdvisoryIndex
Cost of ServiceIndex