sudan - eif-mis.org · vii abbreviations and acronyms afsec african electro-technical...
TRANSCRIPT
i
Sudan Diagnostic Trade Integration Study (DTIS) - Update
Reducing trade costs to increase competitiveness and resilience
Final Report Prepared for the Enhanced Integrated Framework October 31, 2014

Table of Contents Executive Summary .................................................................................................................................... 1
DTIS Update - Proposed Action Matrix ..................................................................................................... 4 Chapter 1: Introduction ....................................................................................................................... 10 Chapter 2: Macroeconomic Overview and Business Enabling Environment ................................ 13
Macroeconomic Overview .............................................................................................................. 13 Business Enabling Environment .................................................................................................... 18 Lessons from the Implementation of the 2008 Action Matrix ......................................................... 24
Chapter 3: Trade Policy and Performance ........................................................................................ 26
Sudan’s trade developments and challenges ................................................................................ 26 Direction of Trade ........................................................................................................................... 29 Characteristics of Exporters in Sudan ............................................................................................ 31 General Duty Schedules and Para Tariffs: High Levels of Protection ........................................... 35 Regional Trade Preferences .......................................................................................................... 39 Export Duty .................................................................................................................................... 40 Import Restrictions, Domestic Manufacturing and Productivity ..................................................... 40 Trade and Poverty .......................................................................................................................... 41 Recommendations ......................................................................................................................... 42
Chapter 4: Customs Administration and Border Management ....................................................... 43
Overview and Key Issues............................................................................................................... 43 The Sudan Customs Authority ....................................................................................................... 45 Customs Systems and Procedures ................................................................................................ 48 Customs Agents and the Licensing of Brokers .............................................................................. 52 Transparency, Information and Communication Mechanisms....................................................... 54 Recommendations ......................................................................................................................... 55
Chapter 5: Transport, Transit and Logistics Services ..................................................................... 56
Overview ........................................................................................................................................ 56 Transport and Logistics Strategy ................................................................................................... 57 Transport Corridors ........................................................................................................................ 58 Logistics Services .......................................................................................................................... 60 Clearing and Forwarding Services ................................................................................................. 62 Trucking services ........................................................................................................................... 63 Inland Container Depots ................................................................................................................ 66 Modes of Transport ........................................................................................................................ 68 Strengthening Regional Connectivity ............................................................................................. 74 Recommendations ......................................................................................................................... 75
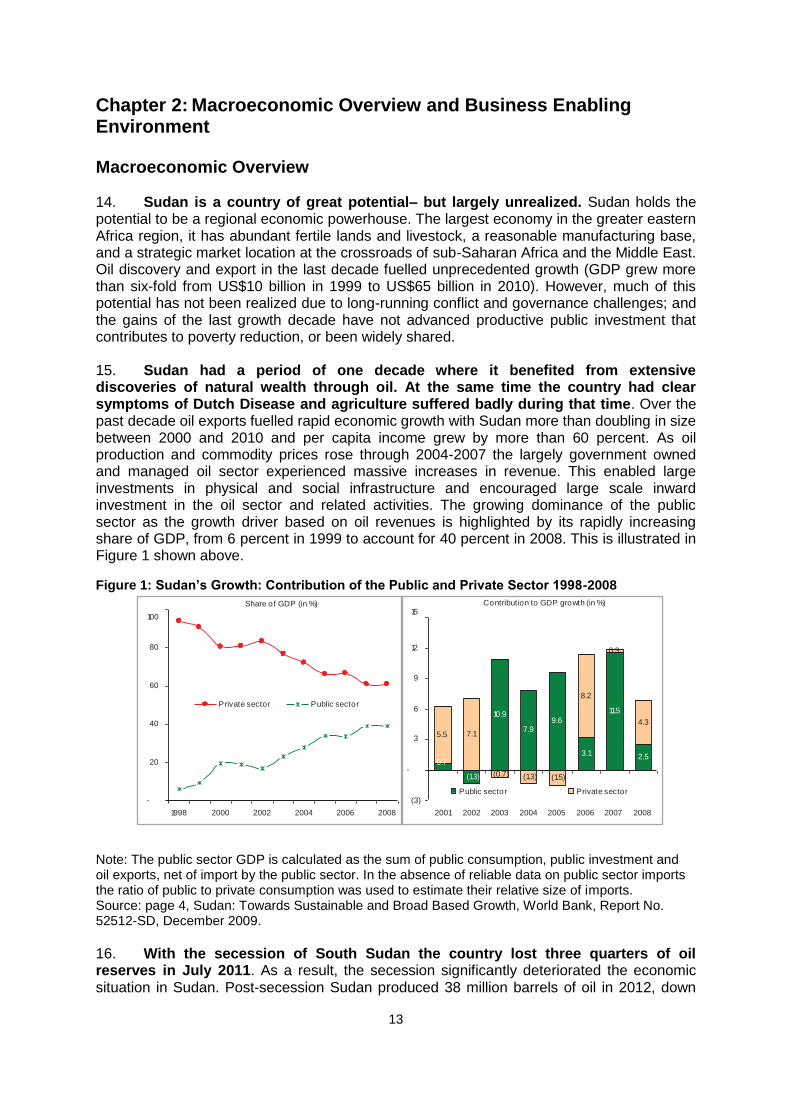
Chapter 6: National Quality Infrastructure and Non-Tariff Measures ............................................. 79
Overview ........................................................................................................................................ 79 Standards Development in Sudan ................................................................................................. 81 Conformity Assessment and Accreditation .................................................................................... 85 Product and System Certification ................................................................................................... 87 Inspection services ......................................................................................................................... 88 Metrology Services ......................................................................................................................... 91 Testing Laboratories ...................................................................................................................... 92 Recommendations ......................................................................................................................... 93

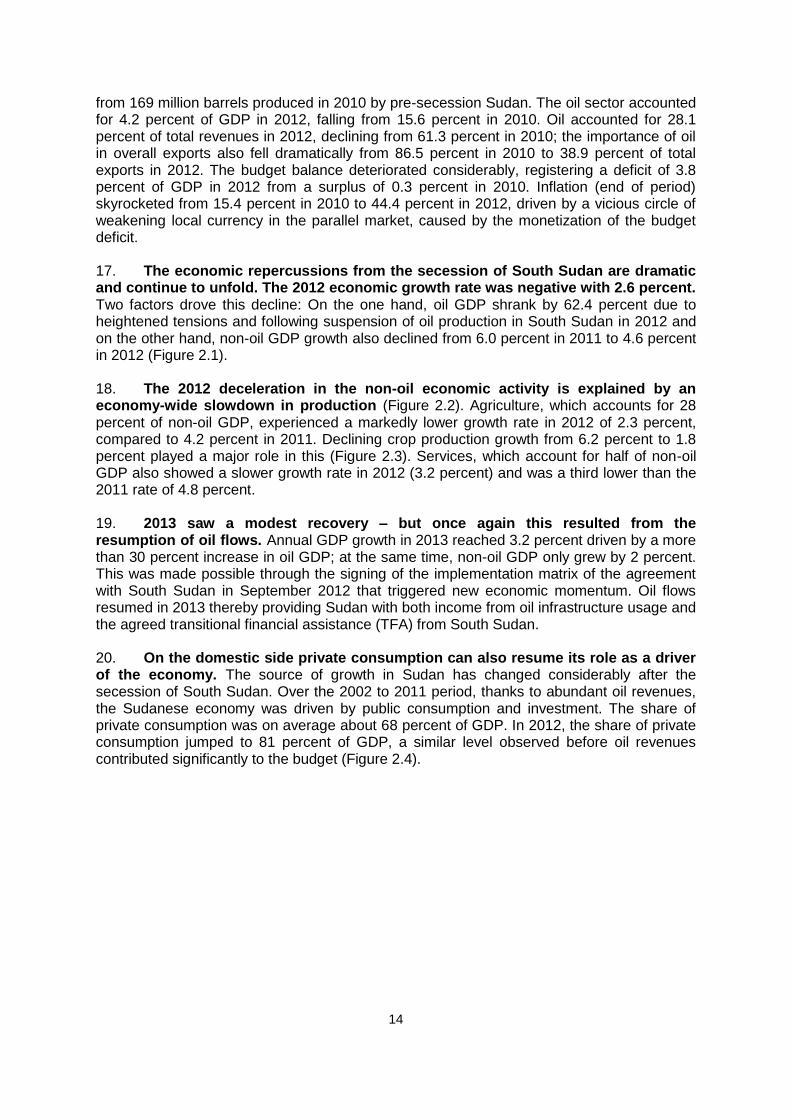
Chapter 7: Opportunities for growth through diversification: Agriculture .................................... 95 Overview of the Agricultural Sector ................................................................................................ 95 Trade Performance of Major Agricultural Exports .......................................................................... 97 Factors Affecting Competitiveness of Agricultural Exports .......................................................... 106 Recommendations ....................................................................................................................... 108
Chapter 8: Trade in Services.................................................................................................................. 109
Overview ...................................................................................................................................... 109 Trade in Services in Sudan .......................................................................................................... 109 Professional services matter for Sudan’s growth ......................................................................... 112 Recommendations ....................................................................................................................... 120
Chapter 9: Opportunities for growth through diversification: Tourism ............................................ 122
Overview and Key Issues............................................................................................................. 122 Size and Structure of the Tourism Sector .................................................................................... 123 Tourism Policy and Institutional Framework ................................................................................ 127 Tourism Development Challenges ............................................................................................... 129 Recommendations ....................................................................................................................... 133
Appendix 1: DTIS 2008 Action Matrix Scorecard ................................................................................. 137 Appendix 2: Firm Level Exporter Dynamics – Product Details .......................................................... 151 Appendix 3 Trade Gateway Performance: Port Sudan ....................................................................... 155 List of References ................................................................................................................................... 159

List of Figures Figure 1: Sudan’s Growth: Contribution of the Public and Private Sector 1998-2008 ................................ 13 Figure 2: Economic Activity ......................................................................................................................... 15 Figure 3: Monetary Sector ........................................................................................................................... 16 Figure 4: External Sector ............................................................................................................................ 18 Figure 5: Doing Business Ranking for Sudan ............................................................................................. 19 Figure 6: Doing Business 2012 and 2014: Ease of Doing Business Ranking ............................................ 20 Figure 7: Starting a business in Sudan and comparators in Doing Business 2014 .................................... 20 Figure 8: Doing Business 2014: Ranking by component ............................................................................ 21 Figure 9: Profit Tax (%) in Doing Business 2014 ........................................................................................ 21 Figure 10: Doing Business Indicators on Trading Across Borders ............................................................. 23 Figure 11: Doing Business 2014: Ranking for Sudan and comparators on Trading Across Borders ........ 23 Figure 12: Cost to Import and Export (US$ per containers) for selected countries 2014 ........................... 24 Figure 13: Total Non-Oil Export Growth (base year 2008) ......................................................................... 27 Figure 14: Merchandise Trade, 1991-2011 (% of GDP) ............................................................................. 28 Figure 15: Merchandise Trade and services Trade, 2005-2011 (% of GDP) ............................................. 29 Figure 16: Current account components, 2005-2013 (US$ million)............................................................ 29 Figure 17: Total Number of Exporters ......................................................................................................... 31 Figure 18: Exporter Concentration: Sudan Share of Top 5% - Change over Time .................................... 32 Figure 19: Distribution of Tariff Rates (2012) and Imports based on Statutory Tariffs ............................... 36 Figure 20: Distribution of Tariff Rates (2013) and Imports (2012) based on Applied Tariffs ...................... 37 Figure 21: Poverty rates per State and by gender of Household Head ..................................................... 42 Figure 22: Components of Regulatory Compliance Framework ................................................................. 47 Figure 23: Risk Management Process Framework ..................................................................................... 50 Figure 24: Sudan Logistics Performance, 2007-2014 ................................................................................ 57 Figure 25 Distribution of Traffic: Port Sudan and Khartoum (2013) ........................................................... 59 Figure 26: Trucking Fleet Capacity Utilization ............................................................................................ 65 Figure 27: Traffic volume carried by rail, 1961 - 2013 ................................................................................ 69 Figure 28: IWT Traffic Volume in Sudan, 2005 - 2012 ............................................................................... 71 Figure 29: Technical Regulations Framework Following Best Practice Guidelines .................................... 81 Figure 30: Evolution of ISO 9001 certificates in Sudan .............................................................................. 88 Figure 31: Services Value Added and Development in 2000-02 versus 2010-12 .................................... 110 Figure 32: Sudan’s Exports of Goods, Exports of Services and GDP Growth, 2005-2012 ...................... 110 Figure 33: Exports of Transport, Travel and Other Commercial Services, Sudan, 2005-2012 ................ 111 Figure 34: Services Imports, Sudan and COMESA .................................................................................. 112 Figure 35: Average Productivity of users vs. Non-Users of Accounting Services, Sudan and COMESA 113 Figure 36: Usage of professional services, Sudan ................................................................................... 114 Figure 37: Demand for Accounting and Engineering Services in Sudan .................................................. 114 Figure 38: Average gross monthly salaries in Sudan ............................................................................... 115 Figure 39: Top regulatory constraints in faced by professional services providers in Sudan ................... 118 Figure 40: Direct Contribution of Tourism to GDP, Selected Countries (2007-2012) ............................... 124 Figure 41: Direct Contribution of Tourism in Sudan to GDP (2007-2012) ................................................ 125 Figure 42: Direct Contribution of Tourism in Sudan to Employment (2007-2012) .................................... 125 Figure 43: International Tourist Arrivals (2007-2012) ............................................................................... 126 Figure 44: Cargo Dwell Time in Port Sudan Compared to other Ports, 2014 ........................................... 156
v
List of Tables Table 1: Summary of Implementation of 2008 Action Matrix ...................................................................... 25 Table 2: Principal Trade Partners of Sudan in 2006 vs. 2012/13 ............................................................... 30 Table 3: Sudan 2014 Tariff Structure .......................................................................................................... 36 Table 4: Sector Groups: Tariff Collection Rates, Imports and Exports for 2012 (Values in US $ million) .. 37 Table 5: Sudan: Rates of Excise Duties on Imported Goods (percent) ...................................................... 39 Table 6: Revenue Collection Performance, Selected Countries 2012 ....................................................... 43 Table 7: Sudan Customs Statistics ............................................................................................................. 45 Table 8: Comparative Costs of Different Modes of Transport .................................................................... 59 Table 9: Annual Absorptive Capacity for members by chamber................................................................. 64 Table 10: Time comparison (40 feet container; Port Sudan – Khartoum ................................................... 70 Table 11: Comparison of Traffic since Privatization in 2008 ....................................................................... 70 Table 12: Time and costs associated with transport within Sudan ............................................................. 72 Table 13: Cargo Volumes, 2007-2012 ........................................................................................................ 73 Table 14: Costs of Using Different Regional Corridors that Compete with Routes through Sudan ........... 74 Table 15: Completed Road Improvements Linking to Neighboring Countries ............................................ 75 Table 16: Sudan Axle Load Limits Compared to EAC Countries ............................................................... 75 Table 17: Sales of Standards by SSMO 2012-2014 ................................................................................... 82 Table 18: Samples of imports during the years 2012-2013 ........................................................................ 89 Table 19: Samples for exports during the years 2012-2014 ....................................................................... 89 Table 20: Sub-sectors share in Agricultural GDP: 2006-2009 .................................................................... 96 Table 21: Livestock Export Value and sub-sector share: 2008-2013 ......................................................... 98 Table 22: Quarantine, Inspection and Vaccination Regime for Sheep Exports.......................................... 98 Table 23: Estimated costs per feddan of sesame production in Gedaref (2013/2014) .............................. 99 Table 24: Value chain analysis for sesame marketing from Gedaref to Port Sudan ( Jan. 2014) ............ 100 Table 25: Sesame export value and quantities: 2008-2013 ..................................................................... 100 Table 26: Direction of sesame trade: 2012-2013 ...................................................................................... 101 Table 27: Value chain for gum Arabic marketing from El Obeid to Port Sudan in 2012 ........................... 102 Table 28: Estimated costs per feddan for cotton (Acala) production – Gedarif (2013/2014) .................. 104 Table 29: Other Tourism Service Providers .............................................................................................. 127 Table 30: Container operations key indicators.......................................................................................... 157
List of Text Boxes Box 1: The Trucking industry ‘bubble’ in Sudan.......................................................................................... 66 Box 2: Technical Committees for Standards ............................................................................................... 84 Box 3: Domestic Regulation in Professional Services in Sudan ............................................................... 117 Box 4: Rwanda Rising – A Nation Rebuilds and Rebrands ...................................................................... 132 Box 5: UK Visa Reform Targets Chinese Tourists .................................................................................... 135
vi
Fiscal Year January 1 – December 31
Weights and Measures
Metric System 1 Feddan = 0.42 Hectares
1 Kantar = 45 kg 22.22 Kantar= 1 Metric ton

vii
Abbreviations and Acronyms
AFSEC African Electro-technical Standardization Commission AIDMO Arab Industrial and Mining Organization ARSO ASYCUDA
African Regional Standards Organization Automated System for Customs Data
BIPM Bureau de International de poit et mesures (international metrology organization)
CASCO Conformity Assessment Policy committee of ISO CEN Council for European Norms CENELEC European Committee for Electro technical Standardization COMESA DB DTI DTIS
Common Market for Eastern and Southern Africa Doing Business Direct Trader Input Diagnostic Trade Integration Study
EGAC ESP EU GAFTA GCA
Egyptian Accreditation Council Economic Salvation Program European Union Greater Arab Free Trade Area General Customs Administration
GMO GOS
Genetically Modified Organism Government of Sudan
GSA Gulf Standards Association IAF IGAD
International Accreditation Forum Intergovernmental Authority on Development
ICC ICD
International Association for Cereal Science and Technology Inland Container Depot
IEC International Electro technical Commission IFOAM International Federation of Organic Agriculture Movements ILAC I-PRSP
International Laboratory Accreditation Interim Poverty Reduction Strategy Program
ISO IWT
International Organization for Standardization International Warehouse Tracking
Lab MCI MDG MLF MOAI MOF MOT MTAW
Laboratory Ministry of Culture and Information Millennium Development Goals Ministry of Livestock and Fisheries Ministry of Agriculture and Irrigation Ministry of Finance and National Economy Ministry of Trade Ministry of Tourism, Antiquities and Wildlife
NHA NQI NRTC NSW
National Highways Authority National Quality Infrastructure Nile River Transport Company National Single Window
OIML International Legal Metrology Organization PVoC Pre-export Verification of Conformity SDS Sudanese National Standards
SGS Societe General de Surveillance (www.sgs.com)
SMIIC SPC
Standards and Metrology Institute for Islamic Countries Sudan Ports Corporation
SPS Sanitary and Phyto-Sanitary measures
SSMO Sudanese Standards and Metrology Organization TBT TFA VFR WCO
Technical Barriers to Trade Agreement of the WTO Transitional Financial Assistance Visiting Friends and Relatives World Customs Organization
WTO
World Trade Organization

ix
Acknowledgements At the request of the Government of Sudan, the World Bank took the leading role in the preparation of this DTIS Update. The core members of the team were: Michael Geiger (Task Team Leader), Robert Kirk (Lead Consultant and Lead Author), Nora Dihel and Arti Grover (Trade in Services), Clay Kerswell (Trade Facilitation), Imad Eldin Alfadil Abdel Karim Yousif (Agriculture), Maika Watanuki (Logistics Services and Doing Business), Geoff Visser (National Quality Infrastructure), Ana Fernandes and Esteban Ferro (Exporter Dynamics), Eneida Fernandes (Tourism), Charles Kunaka (Transport), Reynaldo Bench (Port Specialist), Saef Ibrahim (Survey for Trade in Services), Toru Nishiuchi and Dr. Mohamed Ali Dingle (Review of 2008 Implementation Matrix), Dr. Ibrahim Ahmed Ibrahim Ibnoef (Livestock Exports), Mosllem Alamir (Country Economist) and Jasmine Park (research assistance on the trade data). The analysis in the report benefited greatly from very helpful comments and feedback provided by Paul Brenton, Philip Schuler, Michael Ferrantino, and Paolo Zacchia among others. The DTIS update was elaborated in close cooperation with counterparts in the Sudan government, including the Manal Musaad, EIF Coordinator at the National Secretariat for WTO Affairs (NSWTOA) Ministry of Trade, (MIT) who facilitated the team Missions and the Validation Workshop, Marwan Younis Abdelsalam, Head of Information and Research Administration, Customs Authority, who assisted in obtaining critical customs data, and the Director and staff from the Sudan Standards and Metrology Organization. The team also wishes to thank the EIF Donor Coordinator Ms. Maria-Luisa Troncoso, European Union, for facilitating meetings with the donor community and for providing valuable insights during the two team missions and the Validation Workshop. The report also benefited from the constructive comments provided by the EIF Secretariat in Geneva and the EIF Board on the Concept Note and the draft Final Report. The DTIS update team would also like to thank the numerous stakeholders from the public and private sectors who provided helpful insights during the team missions undertaken in 2013 and January-February 2014. These include the Hon. Minister of Trade, Mr. Osman Omar El-Sharif, Mr. Eltahir Aidam, the former EIF Focal Point Director and Dr. Maryam Elemam, Undersecretary MIT and the current EIF Focal Point Director, Dr. Najm eldeen Daood Mohamed, Undersecretary MIT, Mr. A. Aziz Mabrook, Director of Foreign Trade, MIT, the Secretary General of the Sudanese Businessmen and Employers Federation Mr. Bakri Yusuf Omer Al-Amin and many government officials and private sector representatives for their extensive cooperation and the valuable time spent with the DTIS update team.

1
Executive Summary 1. The Diagnostic Trade Integration Study (DTIS) Update identifies priority Actions in support of the Government of Sudan (GOS) commitment to increase trade and diversify the economy. The current study builds on the earlier 2008 DTIS by identifying the major factors holding back increasing agricultural exports and economic diversification. The report identifies a package of measures that will support Sudan to more effectively realize its economic potential. 2. Reducing the large economic imbalances along with the misalignment of the exchange rate is required for building competitiveness and increasing domestic and foreign investment. Despite implementing a number of significant and difficult reforms Sudan continues to experience a large deficit that is being met by short term borrowing. The resulting pressure to raise government revenue has constrained much needed reforms aimed at reducing tariffs and para tariffs. Given the serious fiscal constraints tariff reform must take into account the revenue implications and aim, in the short term, to be revenue neutral. 3. High tariffs and other trade taxes on imports create incentives to produce for the domestic market and actively discriminate against exporters and potential exporters. Enabling exporters and potential exporters to obtain their inputs at internationally competitive prices will stimulate investment and growth and encourage diversification. Reducing trade costs and increasing trade represent the most powerful policy package available to the GOS for reducing poverty and placing Sudan on the path to meeting the MDG and advancing to middle income status. Outward oriented development is a necessary condition for countries that have achieved middle income status. 4. The imposition of financial and trade sanctions against Sudan has an adverse impact on the economy, but the extent of the full effect needs to be more carefully studied. The sanctions impact particularly on access to finance in foreign currency and the sourcing of inputs and replacement technical parts. For example, the Sudan Railway Corporation has explicit problems in maintaining their locomotive fleet. In customs, there are indications that important technical infrastructure and resources (e.g. scanners) are not being used to their full potential because of on-going support and maintenance issues. In tourism, sanctions block access to tourism technology and the use of international credit cards. But the real impact is not known. For instance, it is not entirely clear whether the fact that Sudan’s non-oil exports are concentrated in only a small number of markets is a consequence of sanctions against the country. In fact, Sudan is even isolated (in terms of trade flows) within Africa, where sanctions do not apply. However, sanctions have exacerbated the isolation through increasing the difficulty to settle cross-border payments, which affects trade with all partners. 5. Successfully encouraging exporters requires the GOS to implement a package of (difficult) reforms that lower the barriers to trade through reducing trade taxation, simplify border and regulatory policies, and improving transport and logistics.
6. Trade policy should be revised to simplify the tariff schedule, reducing the proportion of peak tariffs, and adopting a transparent and well publicized policy on eligibility for duty rebates. The tariff schedule is characterized by a high proportion of peaks (15 percent and above), discriminatory excise duties and a Development Tax of 13 percent which is a para-tariff. A comprehensive tax reform strategy that reduces reliance on trade taxation and promotes growth and investment should be revenue neutral and in many cases will results in increased government revenue.

2
7. There is a need to simplify and streamline border and regulatory policies. Sudan imposes many Non-Tariff Measures (NTMs) which increase the price of imports and the ex-factory price of Sudanese products. Many of these result from the high proportion of products which are required to be tested for mandatory standards. The testing frequently duplicates tests already carried out by qualified laboratories in the country of origin. Reducing the number of mandatory standards and replacing them with voluntary standards should be a priority. 8. Continue to modernize customs clearance procedures. Multiple border agencies undertaking duplicative and redundant checking and repeated requests for the same information all serve to increase costs and reduce competitiveness. Prioritizing the establishment of a National Trade Portal will bring together all the information and forms required for moving goods across borders. It is a proven technique for reducing red tape and increasing transparency. Increased transparency regarding the correct application of trade policies and administrative procedures would increase the predictability of trade costs and transit times, making it easier for companies to integrate into regional and global value chains. 9. Sudan needs to reduce the price of transport and improve the quality of logistics services. In the short term improvements in road transport will bring the highest returns. Priority actions include ensuring 24/7 access to the dry port of Khartoum through either relocation or constructing a by-pass. Further investment in infrastructure along the Port Sudan-Khartoum route would increase safety and reduce delays. Modernizing the regulatory framework for logistics services will facilitate increased reliability and reduce transport prices.
10. Reducing trade costs through tariff reform, increasing border efficiency, eliminating non-tariff barriers and lower transport costs will encourage investment and growth throughout the economy. The DTIS identifies trade related constraints to growth in agriculture and the services sector with specific reference to professional services and tourism. Throughout the DTIS focuses on identifying policy and regulatory measures that will assist with realizing the potential for growth. 11. High input costs, inefficient marketing and transport networks and regulatory restrictions all contribute to the observed low productivity in agriculture and underperformance of a key sector. Sudan has the potential to be a major producer and exporter of agricultural products to their neighbors, traditional trading partners in the Middle East and globally. Despite the potential and recent positive growth the sector continues to underperform. Recent positive reforms in the policy environment, including the removal of the Gum Arabic Commodity Council monopoly, increasing the role of the private sector, privatizing previously state owned companies, and removing duties on agricultural inputs are all delivering results. The DTIS Update highlights three areas where further reforms will reduce trade costs. These include streamlining the procedures for the registration of seeds and other agricultural inputs, removing the uncertainty over export licenses for staple crops (specifically sorghum), and improving productivity in the livestock sector.
12. Ensuring access to a wide range of services from the backbone services of transport, electricity and communications to professional services is a key determinant in international competitiveness and efficiency. The report identifies the constraints to the development of professional services, noting how restrictive regulations in conjunction with a lack of regional cooperation are holding back the development of the national market for professionals with adverse effects for competitiveness. The Action Matrix recommends targeting major regulatory constraints such as easing entry requirements, eliminating dis-proportionate restrictions that limit competition, establishing transparent

3
procurement procedures, and reviewing non-transparent licensing procedures. Undertaking regulatory audits in all examined professional service sectors would be important to identify specific areas where reforms could be fast-tracked in the context of the COMESA, and Tripartite FTA (EAC, COMESA and SADC) services dialogues. Expanding the growth of the professional services sector and enabling access by small and medium size firms will increase their productivity. 13. Sudan has the opportunity to deliver significant growth in the tourist sector however realizing this requires both supply and demand side measures. The GOS recognizes the potential of tourism to contribute to development and specifically requested the DTIS Update to identify what is required to increase demand. In the short run it is recommended that the Government of Sudan sends a positive signal that it is open for tourism by reforming the Visa regime, lifting in-country bureaucratic procedures and updating the National Tourism Plan. A comprehensive development strategy will take several years to evolve and requires improvements in policy and planning, human resource development, transport access, and product development and marketing. The recently updated National Tourism Plan addresses these issues and provides a useful road map for raising the profile of the sector and mobilizing resources for implementation.
14. Learning from the past experience of many similar studies, this DTIS Update presents a focused and prioritized updated Action Matrix that can guide policy making going forward. Lessons from earlier DTIS throughout the world show that developing a long list of constraints and barriers to development detracts from framing priorities and mobilizing the necessary inter-agency and diverse stakeholder commitment to reform required to effect change. Focusing on national level policy issues in need of strong political support and broad stakeholder engagement, the authors hope the prioritized policy matrix with key activities will serve as an effective basis for dialogue among the various government ministries, business and civil society and also in the dialogue with development partners. Addressing the limited and focused priority activities will have a significant impact and should be achievable with strong leadership of the Ministry of Trade, and with high-level support from the Ministry of Finance and the Office of the President, strong linkages with other strategies such as the I-PRSP and the macroeconomic reform strategy, and strong support from development partners.
15. The DTIS Update presents an updated Action Matrix which summarizes the recommended policy reforms. This matrix was validated with a wide variety of stakeholders in Khartoum in September 2014. The action points will all contribute to reducing trade costs which are necessary for enabling Sudanese enterprises and farmers to compete more successfully in regional and global markets and realize the GOS objectives of expanding and diversifying exports for increased economic growth. The recommendations accept that any changes in tariff schedules should ensure they are ‘revenue neutral’ given the existing challenging fiscal situation.

4
DTIS Update - Proposed Action Matrix
Identified Constraint
Action(s) Responsibility Monitoring Indicator Difficulty / Payoff
I Trade Policy Not a member of the World Trade Organization (WTO)
Continue with and expedite the ongoing WTO Accession Process
Ministry of Trade Working Party Meeting Convened during 2015
High/High
International sanctions restricting market access and financial services
Undertake study to assess the economic impact of financial sanctions and restrictions on sourcing and market access
Central Bank, Ministry of Finance
Study Finalized (by July 2015)
Medium/High
Tariff and tax policy on imports discriminates against exporters and potential exporters
Undertake study to evaluate the revenue impact of reducing tariff peaks, removing development tax and eliminating import specific Excise taxes
Ministry of Finance Study on Revenue Impact finalized (by July 2015)
High /High Comment: Necessary given the serious fiscal constraints
Complex and non- transparent trade policies
Adopt and publicize a clearly defined policy on tariff exemptions, duty preferences and restricted products
Abolish export license requirements –except for cultural/archaeological products by end 2015
Ministry of Trade/Ministry of Finance/Customs Authority/
Tariff Policy published (by July 2015)
Regulations removing Export Licenses issued (in 2015)
High/High
Existence of Non-Tariff Barriers (NTB)
Develop and adopt procedures for introducing new regulations –based on OECD Regulatory Best Practice Principles by end of 2015
Audit existing regulations to identify redundant and outdated procedures and requirements by end of 2015
Ministry of Trade, Ministry of Agriculture and Irrigation, Ministry of Livestock and Fisheries, Ministry of Health, SSMO
Government policy statement published listing the processes required for all new regulations
Audit of existing regulations completed and outdated regulations abolished
Medium/High Comment: First step is to prevent new Non-Tariff Measures to be introduced
5
Identified Constraint
Action(s) Responsibility Monitoring Indicator Difficulty / Payoff
Use the Regulatory Audit to reform existing regulations (2016 onwards)
Regulatory Audit Unit established
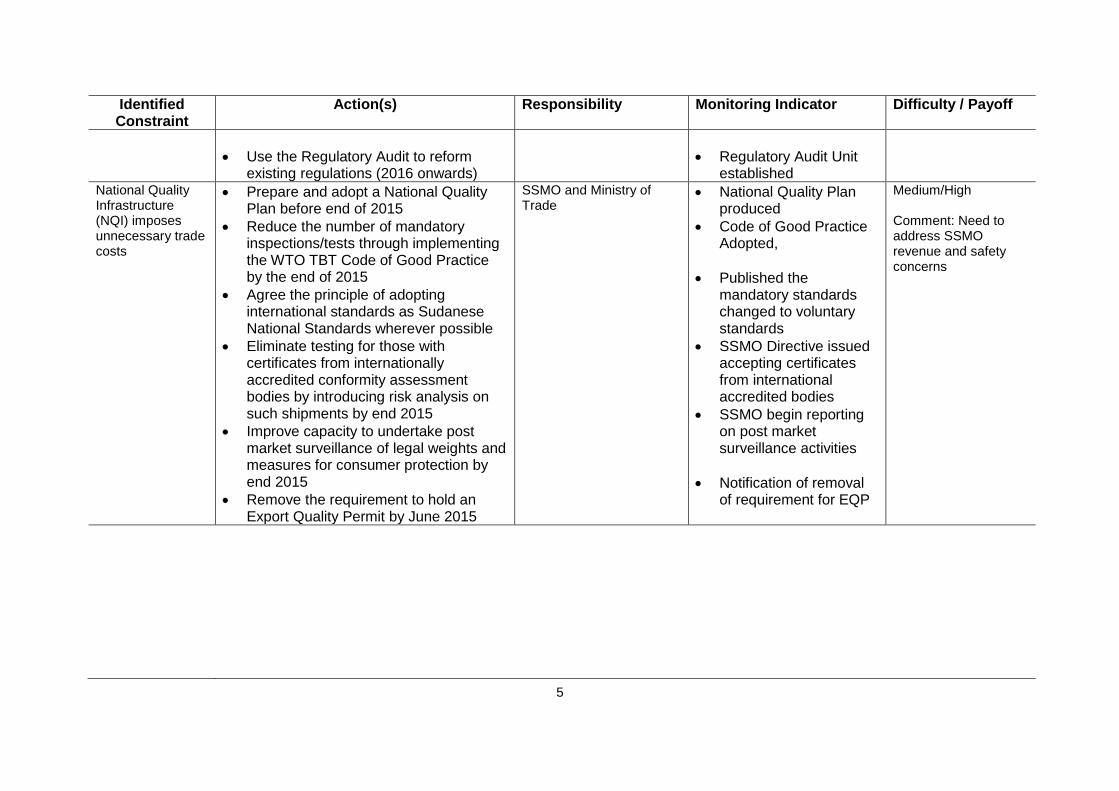
National Quality Infrastructure (NQI) imposes unnecessary trade costs
Prepare and adopt a National Quality Plan before end of 2015
Reduce the number of mandatory inspections/tests through implementing the WTO TBT Code of Good Practice by the end of 2015
Agree the principle of adopting international standards as Sudanese National Standards wherever possible
Eliminate testing for those with certificates from internationally accredited conformity assessment bodies by introducing risk analysis on such shipments by end 2015
Improve capacity to undertake post market surveillance of legal weights and measures for consumer protection by end 2015
Remove the requirement to hold an Export Quality Permit by June 2015
SSMO and Ministry of Trade
National Quality Plan produced
Code of Good Practice Adopted,
Published the mandatory standards changed to voluntary standards
SSMO Directive issued accepting certificates from international accredited bodies
SSMO begin reporting on post market surveillance activities
Notification of removal of requirement for EQP
Medium/High Comment: Need to address SSMO revenue and safety concerns

6
Identified Constraint
Action(s) Responsibility Monitoring Indicator Difficulty / Payoff
II Customs, and Trade Logistics
Multiple Border Agencies result in multiple checks and a high level of physical inspections contributes to delays
Adopt improved coordination / cooperation mechanisms (establish a ‘lead’ agency) to ensure integrated border management, reducing the need for physical inspections.
Improve existing One Stop Service and continue implementing the National Single Window
Customs Authority/All Agencies at the Border
Progress report on One Stop Services and implementation of NSW published
High/Medium Comment: Requires multi agency coordination
Difficulty in obtaining information on trade rules and regulations
Introduce a National Trade Portal that would contain all legally binding information on trade procedures, easily accessible to the public (to be implemented by June 2016)
Customs Authority/Ministry of Finance/Ministry of Trade
Project for NTP finalized and funding secured
Medium/Medium Comment: Maybe an area of increased donor interest to finance
Outdated comprehensive customs modernization strategy
Update and enhance the earlier custom modernization strategy
Customs Authority Updated Modernization Strategy finalized and published
Medium/Medium
Inefficient clearing agents
Revise requirements for obtaining a clearing agent license
Introduce standards to ensure competence and integrity - these should be publicized
Allow self-clearing by importers in conformity with international agreements (introduced by June 2015)
Ministry of Trade/Ministry of Finance/Customs Authority
Licensing of Agents revised
Standards for clearing agents published
Regulation allowing self-clearing published
High/High
Incomplete regulatory framework for logistics service providers
Revise regulations for trucking and forwarding business on licensing, business registration at the Ministry of Transport, scope of activities, and entry of foreign operators
Ministry of Transport (LTU)/Union of Chamber of Transportation/Private Sector
Regulations Revised and Published
Standard Trading
High/High
7
Identified Constraint
Action(s) Responsibility Monitoring Indicator Difficulty / Payoff
Develop standard trading conditions to clarify operational liability
Conditions drafted and published
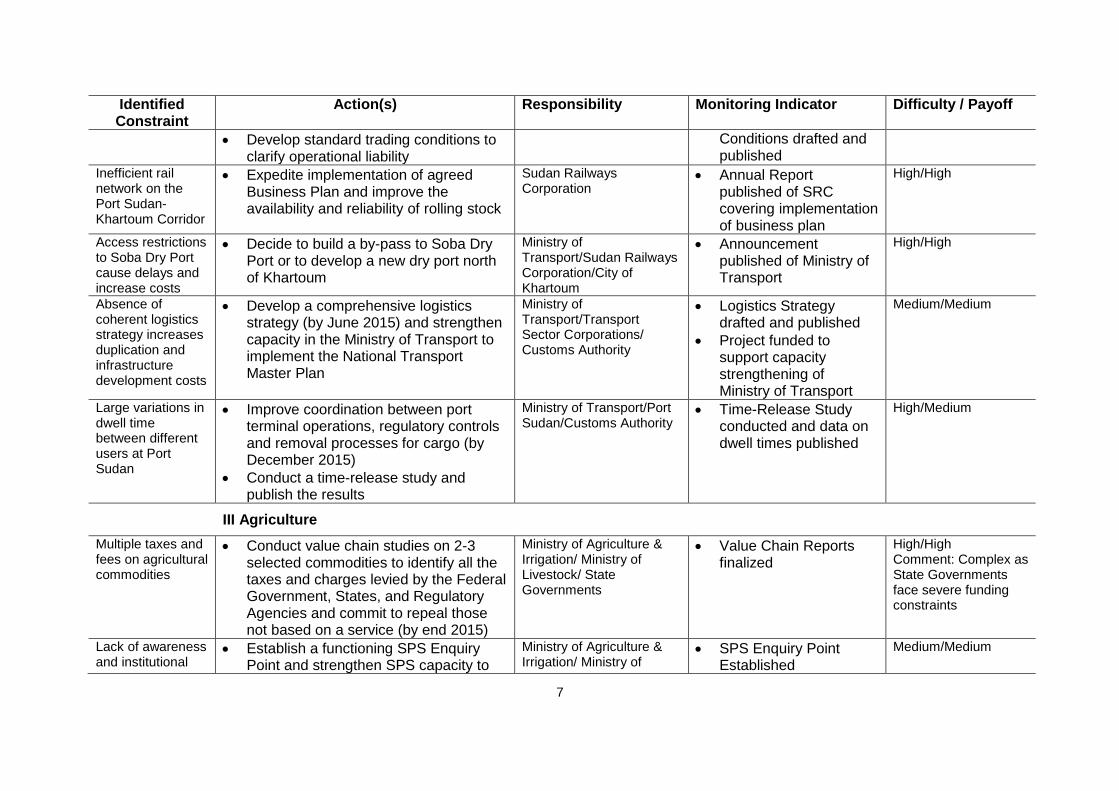
Inefficient rail network on the Port Sudan-Khartoum Corridor
Expedite implementation of agreed Business Plan and improve the availability and reliability of rolling stock
Sudan Railways Corporation
Annual Report published of SRC covering implementation of business plan
High/High
Access restrictions to Soba Dry Port cause delays and increase costs
Decide to build a by-pass to Soba Dry Port or to develop a new dry port north of Khartoum
Ministry of Transport/Sudan Railways Corporation/City of Khartoum
Announcement published of Ministry of Transport
High/High
Absence of coherent logistics strategy increases duplication and infrastructure development costs
Develop a comprehensive logistics strategy (by June 2015) and strengthen capacity in the Ministry of Transport to implement the National Transport Master Plan
Ministry of Transport/Transport Sector Corporations/ Customs Authority
Logistics Strategy drafted and published
Project funded to support capacity strengthening of Ministry of Transport
Medium/Medium
Large variations in dwell time between different users at Port Sudan
Improve coordination between port terminal operations, regulatory controls and removal processes for cargo (by December 2015)
Conduct a time-release study and publish the results
Ministry of Transport/Port Sudan/Customs Authority
Time-Release Study conducted and data on dwell times published
High/Medium
III Agriculture
Multiple taxes and fees on agricultural commodities
Conduct value chain studies on 2-3 selected commodities to identify all the taxes and charges levied by the Federal Government, States, and Regulatory Agencies and commit to repeal those not based on a service (by end 2015)
Ministry of Agriculture & Irrigation/ Ministry of Livestock/ State Governments
Value Chain Reports finalized
High/High Comment: Complex as State Governments face severe funding constraints
Lack of awareness and institutional
Establish a functioning SPS Enquiry Point and strengthen SPS capacity to
Ministry of Agriculture & Irrigation/ Ministry of
SPS Enquiry Point Established
Medium/Medium
8
Identified Constraint
Action(s) Responsibility Monitoring Indicator Difficulty / Payoff
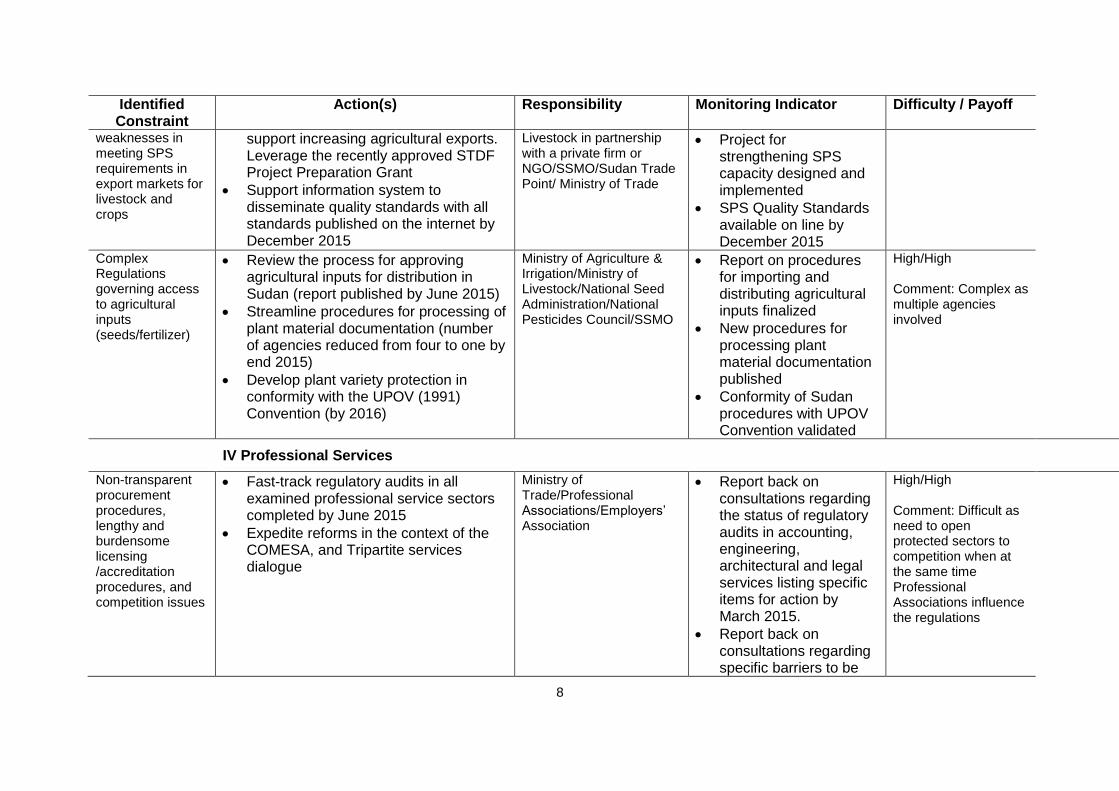
weaknesses in meeting SPS requirements in export markets for livestock and crops
support increasing agricultural exports. Leverage the recently approved STDF Project Preparation Grant
Support information system to disseminate quality standards with all standards published on the internet by December 2015
Livestock in partnership with a private firm or NGO/SSMO/Sudan Trade Point/ Ministry of Trade
Project for strengthening SPS capacity designed and implemented
SPS Quality Standards available on line by December 2015
Complex Regulations governing access to agricultural inputs (seeds/fertilizer)
Review the process for approving agricultural inputs for distribution in Sudan (report published by June 2015)
Streamline procedures for processing of plant material documentation (number of agencies reduced from four to one by end 2015)
Develop plant variety protection in conformity with the UPOV (1991) Convention (by 2016)
Ministry of Agriculture & Irrigation/Ministry of Livestock/National Seed Administration/National Pesticides Council/SSMO
Report on procedures for importing and distributing agricultural inputs finalized
New procedures for processing plant material documentation published
Conformity of Sudan procedures with UPOV Convention validated
High/High Comment: Complex as multiple agencies involved
IV Professional Services
Non-transparent procurement procedures, lengthy and burdensome licensing /accreditation procedures, and competition issues
Fast-track regulatory audits in all examined professional service sectors completed by June 2015
Expedite reforms in the context of the COMESA, and Tripartite services dialogue
Ministry of Trade/Professional Associations/Employers’ Association
Report back on consultations regarding the status of regulatory audits in accounting, engineering, architectural and legal services listing specific items for action by March 2015.
Report back on consultations regarding specific barriers to be
High/High Comment: Difficult as need to open protected sectors to competition when at the same time Professional Associations influence the regulations

9
Identified Constraint
Action(s) Responsibility Monitoring Indicator Difficulty / Payoff
addressed as part of the regional trade negotiations by end of 2014.
V Tourism
Infrastructure and policy environment not conducive to tourism
Streamline in-country registration procedures through one-stop shop by June 2015
Strengthen statistics collection efforts and publish results by December 2015
Allow visas on arrival for select source countries (begin roll out by January 2015)
Reinforce regulations for cultural preservation and environmental protection (by 2017)
Begin implementing the recently approved national tourism plan
Ministry of Tourism, Antiquities and Wildlife
In-country registration procedures eliminated by June 2015
Electronic registration system (ERS) of tourists at airport established by March 2015
First set of data collected through ERS published by June-September 2015
Number of countries whose nationals are eligible for visa on arrival increases by agreed number every 6 months
Progress reports on implementation of the national tourism plan published every 6 months
Medium/Medium
10
Chapter 1: Introduction 1. The Diagnostic Trade Integration Study (DTIS) Update identifies the trade related constraints holding back Sudan from diversifying and augmenting both regional and global trade. The reduction in oil and petroleum exports following the secession of South Sudan has provided additional impetus to expanding agricultural production and diversifying export revenues. The Update takes stock of the progress in implementing the priority recommendations from the earlier 2008 DTIS study (specifically the Action Matrix agreed at the Stakeholder Meeting) and focuses on identifying and quantifying the trade costs constraining Sudan’s competitiveness with regional and international markets as the basis for developing a streamlined and updated Action Matrix. 2. Through the Three Year Emergency Program for 2012-2014 the Government of Sudan (GOS) has prioritized the maintenance of fiscal and external stability with the aim of increasing the growth rate, creating jobs and reducing poverty. The Interim Poverty Reduction Strategy and the recent Five Year Development Plan (2012-2016) commit to private sector development, strengthening Sudan’s trade capacity and mainstreaming trade. The commitment to ensuring macroeconomic stability and improving the business enabling environment are necessary elements for a trade led growth strategy. Increasing investment in internationally competitive value-added activities also requires a reduction in trade costs. The DTIS Update identifies and quantifies specific trade costs that determine the availability and price of inputs and the ability of producers to compete in regional and international markets. The report focuses on tariff policies, regulatory issues impacting on trade, trade facilitation, transport and logistics and policies affecting agricultural trade and trade in services with a focus on tourism and professional services. 3. While infrastructure constraints remain a critical issue for Sudan and need to be supported it is also necessary to focus on the ‘soft infrastructure’. Recognizing that the Enhanced Integrated Framework and the Diagnostic Trade Integration Studies (including the 2008 DTIS for Sudan) have not been effective in addressing many of the broader issues requiring large-scale physical investments, this DTIS update focused on specific trade related policy and regulatory issues within the mandate and policy space of the Ministry of Trade and the National Implementation Unit. 4. This section provides a short introductory overview of the key themes contained in the main report. Chapter 2 outlines the current macroeconomic position and the level of trade openness, and summarizes the status of the business enabling environment. The chapter draws out the linkages between the Emergency Program, the Interim Poverty Reduction Strategy Program (I-PRSP) and the Five Year Development Plan and highlights the importance of using trade as a growth strategy. Finally, the chapter summarizes the progress made in implementing the recommendations from the 2008 Action Matrix. 5. Chapter 3 describes Sudan’s recent trade developments and challenges highlighting the narrow commodity composition and market concentration of the non-oil exports. A detailed review of the existing tariff schedules and other border taxes serves to highlight the high levels of trade protection which results in significant anti-export bias. Increasing export growth and diversifying the production base will require a more neutral trade policy that will enable exporters and potential exporters to be able to source their inputs at internationally competitive prices. A neutral trade policy will consider the interests of Sudanese consumers and not simply prioritize import competing industries or large exporters. Sudan’s existing policy creates incentives to produce (inefficiently) for the domestic market as firms and producers are able to recover the high costs of their intermediate inputs and services through increasing the price of the final product. The
11
number of tariff peaks should be reduced, discriminatory excises abolished and as the fiscal situation permits remove the Development Tax. Finally the report outlines the key characteristics of exporting firms using a detailed database of exporters. This shows that exports are concentrated in a small number of product categories across a relatively small number of firms. 6. Chapters 4-6 focus on the administration of trade and looks at a range of regulatory issues that impact on trade costs and competitiveness. There are separate chapters on the Customs Authority, logistics and transport costs and the National Quality Infrastructure (NQI). In addition to the import tariffs and para-tariffs, firms are faced with an array of non-tariff barriers including the requirement for import permits for many industrial and agricultural products (which was imposed in 2010), strict licensing requirements for seeds, fertilizer and other agricultural inputs, which all contribute to increase costs, reduce choice and delay the adoption of new technology.
7. The high cost of obtaining inputs, transport costs, and the imposition of multiple State taxes on livestock and other commodities all contribute to depressing productivity and hold Sudan back from diversifying its productive base. Manufacturing is dominated by a relatively small number of large established companies serving the domestic market. Small and medium scale enterprises account for the majority of firms, although employing less than one third of total production. All these firms produce for the local market as they are not internationally competitive.
8. Efficient and predictable border clearances are essential. The Sudan General Customs Administration (GCA) has made good progress since the last DTIS in removing many of the multiple fees and charges and in modernizing the Customs legislation. However, many serious challenges remain as 95 percent of shipments are subjected to physical inspection. Introducing a comprehensive customs valuation, risk assessment, advance declaration and the Authorized Economic Operator facility should be priorities. It is also necessary to streamline the roles of the multiple agencies operating at the border to eliminate duplicative checks. The DTIS recommends developing a detailed Customs Modernization Strategy. Establishing a Trade Portal containing all the forms, procedures, and charges required for importing and exporting should be a priority, along with continuing with the existing commitment to Integrate Border Management processes. The trade portal should be designed to serve all traders –large and small. 9. Ensuring efficient and reliable transport routes networks throughout the country is critical for increasing welfare as lower transit costs will widen the market within Sudan while also increasing exports. Sudan is geographically large with travel distances of 1,500km required for livestock produced in the Western States of Kordofan and Darfur. Sudan has a relatively low density of transport infrastructure with one major trade gateway. Chapter 5 outlines the major issues determining the different modes of transport and the quality of logistics services.
10. Chapter 6 assesses the existing National Quality Infrastructure and makes recommendations for ensuring technical regulations are implemented in the least trade restrictive manner. Product safety is important and the Sudan Standards and Metrology Organization (SSMO) has a vital role to play in ensuring non-conforming products and illegal counterfeits which post health risks to consumers are not distributed within Sudan. All too often regulations aimed at ensuring consumer safety function as non-tariff barriers. Currently the SSMO required the retesting of many imported products that have already satisfied equivalent safety requirements. This imposes additional costs, creates uncertainty over delivery and approval times and diverts scarce resources away from
12
targeting high risk products and faulty weigh scales which cheats smallholders. Furthermore the number of mandatory standards (technical regulations) should be reduced and limited to those that have the potential to harm consumers. 11. Chapter 7 looks in more depth at the recent performance of the agricultural sector which contributes about 30 percent of GDP and provides employment to almost 60 percent of the population. Agriculture is characterized by very low productivity in both arable and livestock farming. A commitment to self-sufficiency and the frequent use of temporary export bans on staple (sorghum) exports, onerous procedures regulating agricultural inputs (seeds, pesticides etc.), weak extension services resulting in unmet demand for veterinary services (with consequent increased losses due to disease), and the imposition of multiple taxes and charges at the State level all work to undermine the competitiveness of the agricultural sector. 12. Chapter 8 addresses the important issues of trade in services through focusing on professional services such as engineering, accounting and law. Access to high quality professional services is essential for reducing the costs of doing business and increasing international competitiveness. The survey of users of professional services found those using accounting, architectural and legal services had significantly higher productivity. The report recommends reducing explicit trade barriers that limit the movement of natural person and the commercial presence of professional services. 13. Finally, Chapter 9 looks in depth at the opportunities for growing the tourism sector in Sudan and identifies the constraints to growth. The rich cultural history and scenic attractiveness of Sudan provides ample evidence of the potential for tourism, however, realizing this potential will require a number of serious challenges to be addressed. The report classifies the challenges into five broad categories: planning and policy, human resource development, image and marketing, product development and connectivity. In the short term the DTIS recommends the Government send a clear signal that Sudan is open for tourism through easing the visa and regulatory requirements for tourists, developing a marketing strategy and developing the new national tourism plan into an action plan.
13
Chapter 2: Macroeconomic Overview and Business Enabling Environment Macroeconomic Overview 14. Sudan is a country of great potential– but largely unrealized. Sudan holds the potential to be a regional economic powerhouse. The largest economy in the greater eastern Africa region, it has abundant fertile lands and livestock, a reasonable manufacturing base, and a strategic market location at the crossroads of sub-Saharan Africa and the Middle East. Oil discovery and export in the last decade fuelled unprecedented growth (GDP grew more than six-fold from US$10 billion in 1999 to US$65 billion in 2010). However, much of this potential has not been realized due to long-running conflict and governance challenges; and the gains of the last growth decade have not advanced productive public investment that contributes to poverty reduction, or been widely shared. 15. Sudan had a period of one decade where it benefited from extensive discoveries of natural wealth through oil. At the same time the country had clear symptoms of Dutch Disease and agriculture suffered badly during that time. Over the past decade oil exports fuelled rapid economic growth with Sudan more than doubling in size between 2000 and 2010 and per capita income grew by more than 60 percent. As oil production and commodity prices rose through 2004-2007 the largely government owned and managed oil sector experienced massive increases in revenue. This enabled large investments in physical and social infrastructure and encouraged large scale inward investment in the oil sector and related activities. The growing dominance of the public sector as the growth driver based on oil revenues is highlighted by its rapidly increasing share of GDP, from 6 percent in 1999 to account for 40 percent in 2008. This is illustrated in Figure 1 shown above.
Figure 1: Sudan’s Growth: Contribution of the Public and Private Sector 1998-2008
100
Share o f GDP (in %) Co ntributio n to GDP gro wth (in %) 15
80 12
0.3
60
P rivate secto r P ublic secto r
40
20
9
6
3
5.5 7.1
0.7
10.9
7.9
9.6
8.2
3.1
11.5
4.3
2.5
- (1.3) (0.7) (1.3) (1.5)
-
1998 2000 2002 2004 2006 2008
(3)
P ublic secto r P rivate secto r
2001 2002 2003 2004 2005 2006 2007 2008
Note: The public sector GDP is calculated as the sum of public consumption, public investment and oil exports, net of import by the public sector. In the absence of reliable data on public sector imports the ratio of public to private consumption was used to estimate their relative size of imports. Source: page 4, Sudan: Towards Sustainable and Broad Based Growth, World Bank, Report No. 52512-SD, December 2009.
16. With the secession of South Sudan the country lost three quarters of oil reserves in July 2011. As a result, the secession significantly deteriorated the economic situation in Sudan. Post-secession Sudan produced 38 million barrels of oil in 2012, down
14
from 169 million barrels produced in 2010 by pre-secession Sudan. The oil sector accounted for 4.2 percent of GDP in 2012, falling from 15.6 percent in 2010. Oil accounted for 28.1 percent of total revenues in 2012, declining from 61.3 percent in 2010; the importance of oil in overall exports also fell dramatically from 86.5 percent in 2010 to 38.9 percent of total exports in 2012. The budget balance deteriorated considerably, registering a deficit of 3.8 percent of GDP in 2012 from a surplus of 0.3 percent in 2010. Inflation (end of period) skyrocketed from 15.4 percent in 2010 to 44.4 percent in 2012, driven by a vicious circle of weakening local currency in the parallel market, caused by the monetization of the budget deficit. 17. The economic repercussions from the secession of South Sudan are dramatic and continue to unfold. The 2012 economic growth rate was negative with 2.6 percent. Two factors drove this decline: On the one hand, oil GDP shrank by 62.4 percent due to heightened tensions and following suspension of oil production in South Sudan in 2012 and on the other hand, non-oil GDP growth also declined from 6.0 percent in 2011 to 4.6 percent in 2012 (Figure 2.1). 18. The 2012 deceleration in the non-oil economic activity is explained by an economy-wide slowdown in production (Figure 2.2). Agriculture, which accounts for 28 percent of non-oil GDP, experienced a markedly lower growth rate in 2012 of 2.3 percent, compared to 4.2 percent in 2011. Declining crop production growth from 6.2 percent to 1.8 percent played a major role in this (Figure 2.3). Services, which account for half of non-oil GDP also showed a slower growth rate in 2012 (3.2 percent) and was a third lower than the 2011 rate of 4.8 percent. 19. 2013 saw a modest recovery – but once again this resulted from the resumption of oil flows. Annual GDP growth in 2013 reached 3.2 percent driven by a more than 30 percent increase in oil GDP; at the same time, non-oil GDP only grew by 2 percent. This was made possible through the signing of the implementation matrix of the agreement with South Sudan in September 2012 that triggered new economic momentum. Oil flows resumed in 2013 thereby providing Sudan with both income from oil infrastructure usage and the agreed transitional financial assistance (TFA) from South Sudan. 20. On the domestic side private consumption can also resume its role as a driver of the economy. The source of growth in Sudan has changed considerably after the secession of South Sudan. Over the 2002 to 2011 period, thanks to abundant oil revenues, the Sudanese economy was driven by public consumption and investment. The share of private consumption was on average about 68 percent of GDP. In 2012, the share of private consumption jumped to 81 percent of GDP, a similar level observed before oil revenues contributed significantly to the budget (Figure 2.4).

15
Figure 2: Economic Activity
1. GDP growth 2. Sectoral GDP Growth
3. Crop production 4. Demand Side Growth Decomposition
Source: 1.1, 1.2 and 1.4: IMF, 1.3. CBoS Annual Report.
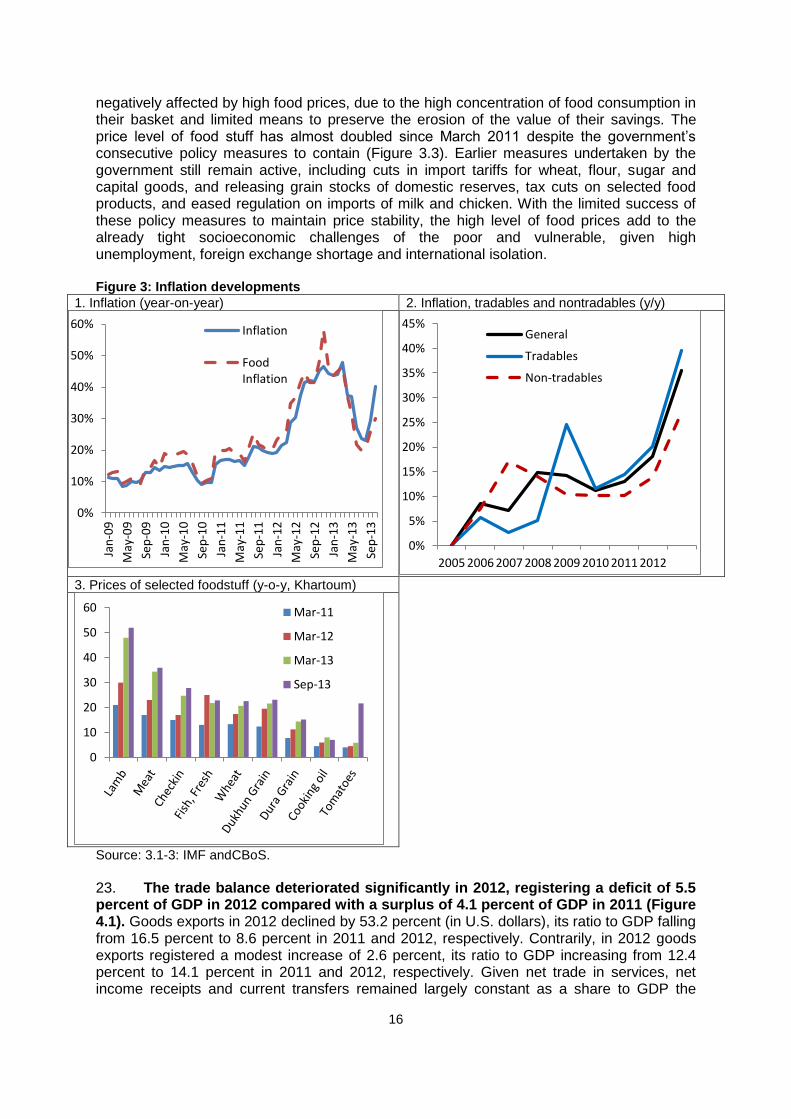
21. Annual inflation soared in 2012 and 2013. Since the peak of 47.9 percent in March 2013, inflation dropped slightly for about 6 months but reached the 40 percent mark again towards the end of the year 2013 (Figure 3.1). The sharp and shortlived decline in 2013 had been attributed to a fast decline in food price inflation and housing. But the package of corrective measures in September 2013 reverted inflation, rising to 40.3 percent in October, mostly attributed to reduced subsidies on petroleum products and food staples. 22. Although the pace of food inflation decelerated somewhat in mid-2013, the level of food prices remained at a historically high level. The poor are those most
-80%
-60%
-40%
-20%
0%
20%
40%
-4%
-2%
0%
2%
4%
6%
8%
10%
2005 2006 2007 2008 2009 2010 2011 2012 2013
GDP
Non-oil GDP
Oil GDP
(right axis)
-5% 0% 5% 10% 15% 20%
Services
Construction
Manufacturing
Agriculture
2011 2012
-100%
-50%
0%
50%
100%
150%
200%
250%
300%
20
07
/08
20
08
/09
20
09
/10
20
10
/11
20
11
/12
Gum Arabic
Sorghum
Groundnuts
Sesame
Net exports Net exports
Net exports
Private consumptio
n
Private consumptio
n
Private consumptio
n
Public consumptio
n
Public consumptio
n Public
consumption
Private investment
Private investment Private
investment
Public investment
Public investment Public
investment
-20%
0%
20%
40%
60%
80%
100%
120%
2012 1996-2001average
2002-11average
16
negatively affected by high food prices, due to the high concentration of food consumption in their basket and limited means to preserve the erosion of the value of their savings. The price level of food stuff has almost doubled since March 2011 despite the government’s consecutive policy measures to contain (Figure 3.3). Earlier measures undertaken by the government still remain active, including cuts in import tariffs for wheat, flour, sugar and capital goods, and releasing grain stocks of domestic reserves, tax cuts on selected food products, and eased regulation on imports of milk and chicken. With the limited success of these policy measures to maintain price stability, the high level of food prices add to the already tight socioeconomic challenges of the poor and vulnerable, given high unemployment, foreign exchange shortage and international isolation. Figure 3: Inflation developments
1. Inflation (year-on-year) 2. Inflation, tradables and nontradables (y/y)
3. Prices of selected foodstuff (y-o-y, Khartoum)
Source: 3.1-3: IMF andCBoS.
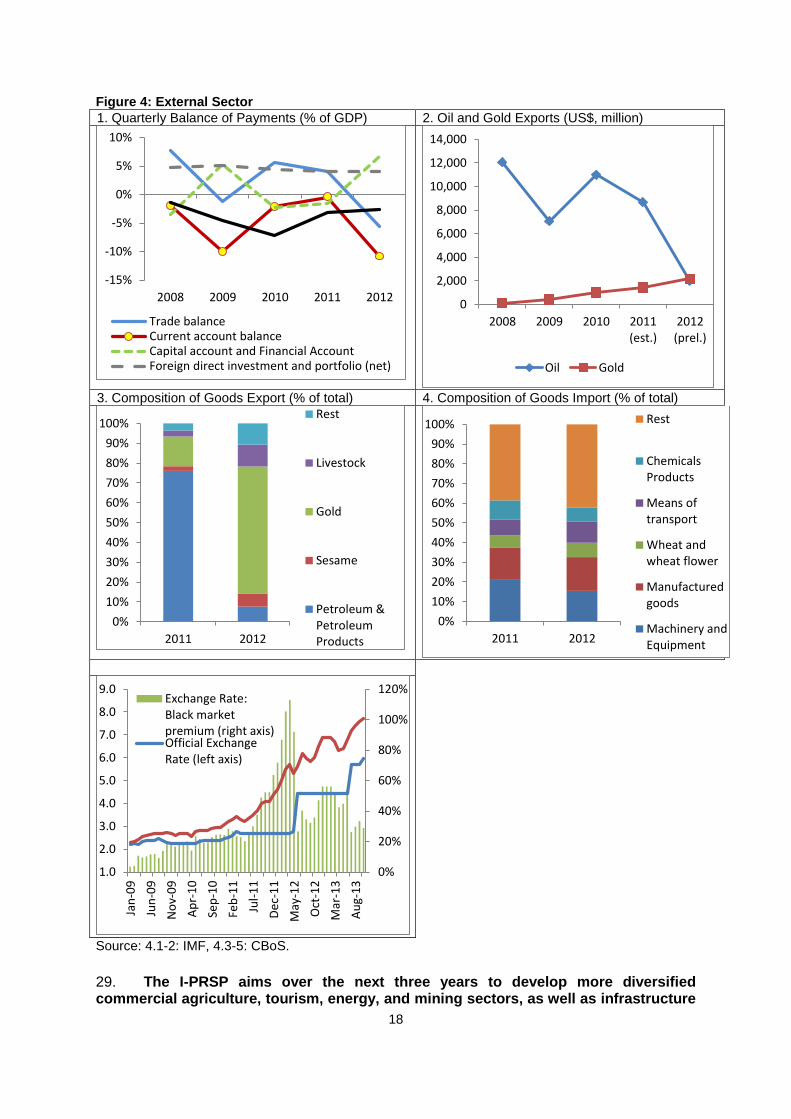
23. The trade balance deteriorated significantly in 2012, registering a deficit of 5.5 percent of GDP in 2012 compared with a surplus of 4.1 percent of GDP in 2011 (Figure 4.1). Goods exports in 2012 declined by 53.2 percent (in U.S. dollars), its ratio to GDP falling from 16.5 percent to 8.6 percent in 2011 and 2012, respectively. Contrarily, in 2012 goods exports registered a modest increase of 2.6 percent, its ratio to GDP increasing from 12.4 percent to 14.1 percent in 2011 and 2012, respectively. Given net trade in services, net income receipts and current transfers remained largely constant as a share to GDP the
0%
10%
20%
30%
40%
50%
60%
Jan
-09
May
-09
Sep
-09
Jan
-10
May
-10
Sep
-10
Jan
-11
May
-11
Sep
-11
Jan
-12
May
-12
Sep
-12
Jan
-13
May
-13
Sep
-13
Inflation
FoodInflation
0%
5%
10%
15%
20%
25%
30%
35%
40%
45%
2005 2006 2007 2008 2009 2010 2011 2012
General
Tradables
Non-tradables
0
10
20
30
40
50
60 Mar-11
Mar-12
Mar-13
Sep-13

17
current account balance was primarily driven by the trade balance and registered a double-digit deficit of 10.4 percent of GDP in 2012. 24. The deteriorating trade balance and the decline in goods exports is again mostly attributed to significant loss from oil exports following the secession. Oil exports significantly declined from the pre-secession level of 16.7 percent and 13.0 percent of GDP in 2010 and 2011, respectively, to 3.3 percent in 2012. Oil exports are projected to increase to 4.9 percent of GDP in 2013 thanks to the signing of the implementation of the agreement with South Sudan in March 2013. 25. Non-oil exports grew by 32.6 percent in 2012, mostly attributed to gold exports. Gold exports grew by 49.7 percent in 2012, exceeding the amount of oil exports for the first time. In October 2012, Sudan began to export refined gold for the first time with the hope that revenues from these exports would compensate for oil revenue losses resulting from the South’s secession. 26. The modest growth in goods imports was driven by imports of petroleum products and, to a lesser extent, of foodstuffs, growing by 43.1 percent and 8.5 percent, respectively. Imports of capital goods, on the contrary, shrunk by 6.4 percent, reflecting a decline in public investment after the secession. 27. Given uncertainties over oil flows there is no alternative to reviving non-oil economic activity in Sudan – trade can be a driver. Looking forward there is much uncertainty over oil flows, which were so important in the 2013 recovery, with the conflict newly erupting in South Sudan in December 2013. The impact of the conflict in the South on economic activity and growth in Sudan is hard to quantify, but likely to be substantial. Against this background, there is no alternative to reviving the non-oil economy. Trade can be a vehicle to diversify. 28. The I-PRSP 2011-16, approved in April 2012 and launched in November along with the ESP seeks to rapidly deliver more inclusive economic growth that will reduce unemployment and poverty and achieve the Millennium Development Goals (MDGs). The ESP focuses on restoring macroeconomic stability, improving the business enabling environment and providing social protection for the most vulnerable as the economy transitions to a higher growth path. The I-PRSP is organized around four pillars: strengthening governance and institutional capacity of the public sector; reintegration of internally displaced persons and other displaced populations; developing human resources; and promoting economic growth and employment creation. Under the fourth pillar the I-PRSP emphasizes the necessity of increasing productivity and diversifying the economy through supporting the private sector with a priority on agriculture, including livestock, forestry and fisheries, manufacturing and services (p.50).
18
Figure 4: External Sector
1. Quarterly Balance of Payments (% of GDP) 2. Oil and Gold Exports (US$, million)
3. Composition of Goods Export (% of total) 4. Composition of Goods Import (% of total)
Source: 4.1-2: IMF, 4.3-5: CBoS.
29. The I-PRSP aims over the next three years to develop more diversified commercial agriculture, tourism, energy, and mining sectors, as well as infrastructure
-15%
-10%
-5%
0%
5%
10%
2008 2009 2010 2011 2012
Trade balanceCurrent account balanceCapital account and Financial AccountForeign direct investment and portfolio (net)
0
2,000
4,000
6,000
8,000
10,000
12,000
14,000
2008 2009 2010 2011(est.)
2012(prel.)
Oil Gold
0%
10%
20%
30%
40%
50%
60%
70%
80%
90%
100%
2011 2012
Rest
Livestock
Gold
Sesame
Petroleum &PetroleumProducts
0%
10%
20%
30%
40%
50%
60%
70%
80%
90%
100%
2011 2012
Rest
ChemicalsProducts
Means oftransport
Wheat andwheat flower
Manufacturedgoods
Machinery andEquipment
0%
20%
40%
60%
80%
100%
120%
1.0
2.0
3.0
4.0
5.0
6.0
7.0
8.0
9.0
Jan
-09
Jun
-09
No
v-0
9
Ap
r-1
0
Sep
-10
Feb
-11
Jul-
11
De
c-1
1
May
-12
Oct
-12
Mar
-13
Au
g-1
3
Exchange Rate:Black marketpremium (right axis)Official ExchangeRate (left axis)
19
development. It prioritizes increasing exports as a key growth driver for creating jobs and reducing poverty through advancing productivity. Reference is made to the challenges of improving the business enabling environment to reduce both regulatory compliance and trade costs. Specific challenges highlighted include high domestic transportation costs, lack of market information and poor linkages along the value chain, low agricultural productivity, weak logistics sector, lack of adherence to international standards and inadequate energy supply.
Business Enabling Environment
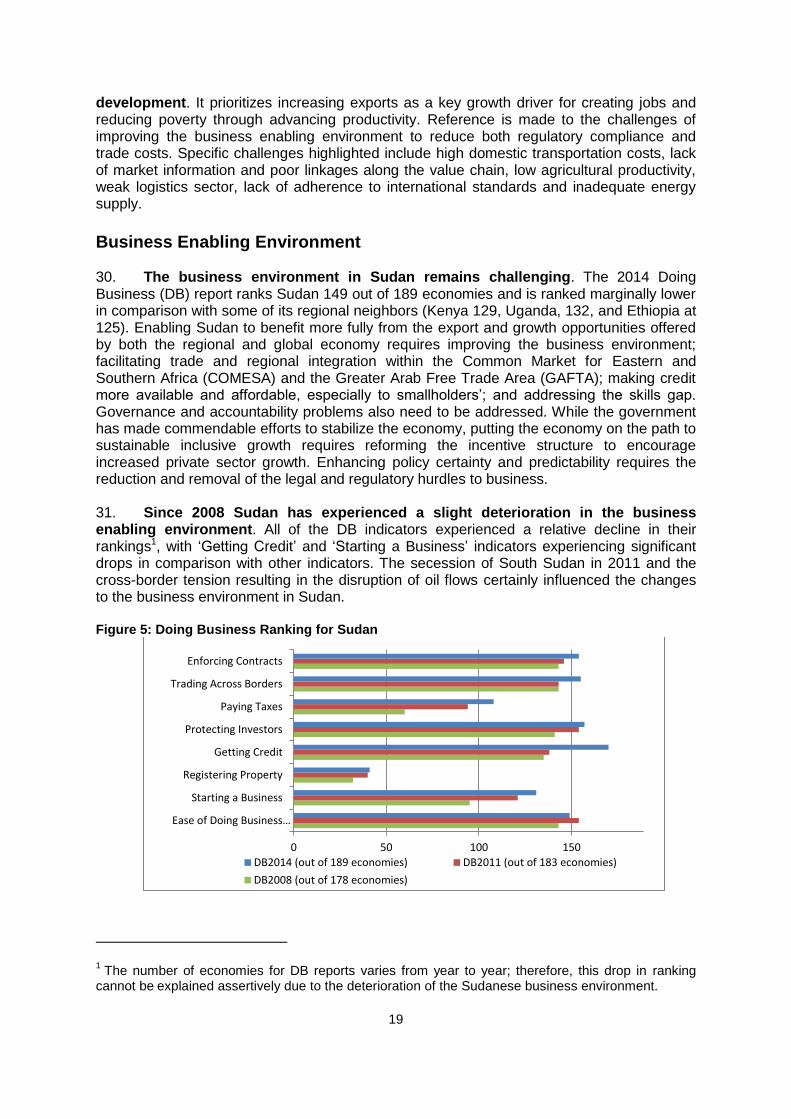
30. The business environment in Sudan remains challenging. The 2014 Doing Business (DB) report ranks Sudan 149 out of 189 economies and is ranked marginally lower in comparison with some of its regional neighbors (Kenya 129, Uganda, 132, and Ethiopia at 125). Enabling Sudan to benefit more fully from the export and growth opportunities offered by both the regional and global economy requires improving the business environment; facilitating trade and regional integration within the Common Market for Eastern and Southern Africa (COMESA) and the Greater Arab Free Trade Area (GAFTA); making credit more available and affordable, especially to smallholders’; and addressing the skills gap. Governance and accountability problems also need to be addressed. While the government has made commendable efforts to stabilize the economy, putting the economy on the path to sustainable inclusive growth requires reforming the incentive structure to encourage increased private sector growth. Enhancing policy certainty and predictability requires the reduction and removal of the legal and regulatory hurdles to business. 31. Since 2008 Sudan has experienced a slight deterioration in the business enabling environment. All of the DB indicators experienced a relative decline in their rankings1, with ‘Getting Credit’ and ‘Starting a Business’ indicators experiencing significant drops in comparison with other indicators. The secession of South Sudan in 2011 and the cross-border tension resulting in the disruption of oil flows certainly influenced the changes to the business environment in Sudan. Figure 5: Doing Business Ranking for Sudan
1 The number of economies for DB reports varies from year to year; therefore, this drop in ranking
cannot be explained assertively due to the deterioration of the Sudanese business environment.
0 50 100 150
Ease of Doing Business…
Starting a Business
Registering Property
Getting Credit
Protecting Investors
Paying Taxes
Trading Across Borders
Enforcing Contracts
DB2014 (out of 189 economies) DB2011 (out of 183 economies)
DB2008 (out of 178 economies)
20
Figure 6: Doing Business 2012 and 2014: Ease of Doing Business Ranking
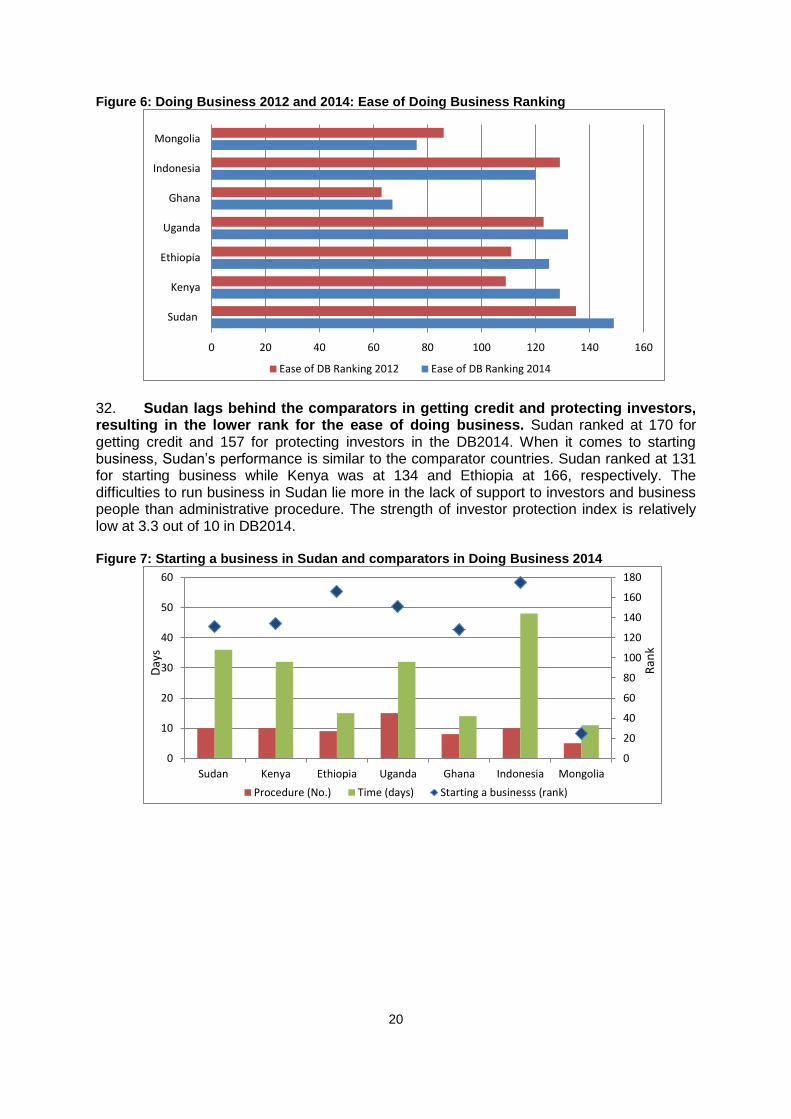
32. Sudan lags behind the comparators in getting credit and protecting investors, resulting in the lower rank for the ease of doing business. Sudan ranked at 170 for getting credit and 157 for protecting investors in the DB2014. When it comes to starting business, Sudan’s performance is similar to the comparator countries. Sudan ranked at 131 for starting business while Kenya was at 134 and Ethiopia at 166, respectively. The difficulties to run business in Sudan lie more in the lack of support to investors and business people than administrative procedure. The strength of investor protection index is relatively low at 3.3 out of 10 in DB2014. Figure 7: Starting a business in Sudan and comparators in Doing Business 2014
0 20 40 60 80 100 120 140 160
Sudan
Kenya
Ethiopia
Uganda
Ghana
Indonesia
Mongolia
Ease of DB Ranking 2012 Ease of DB Ranking 2014
0
20
40
60
80
100
120
140
160
180
0
10
20
30
40
50
60
Sudan Kenya Ethiopia Uganda Ghana Indonesia Mongolia
Ran
k
Day
s
Procedure (No.) Time (days) Starting a businesss (rank)
21
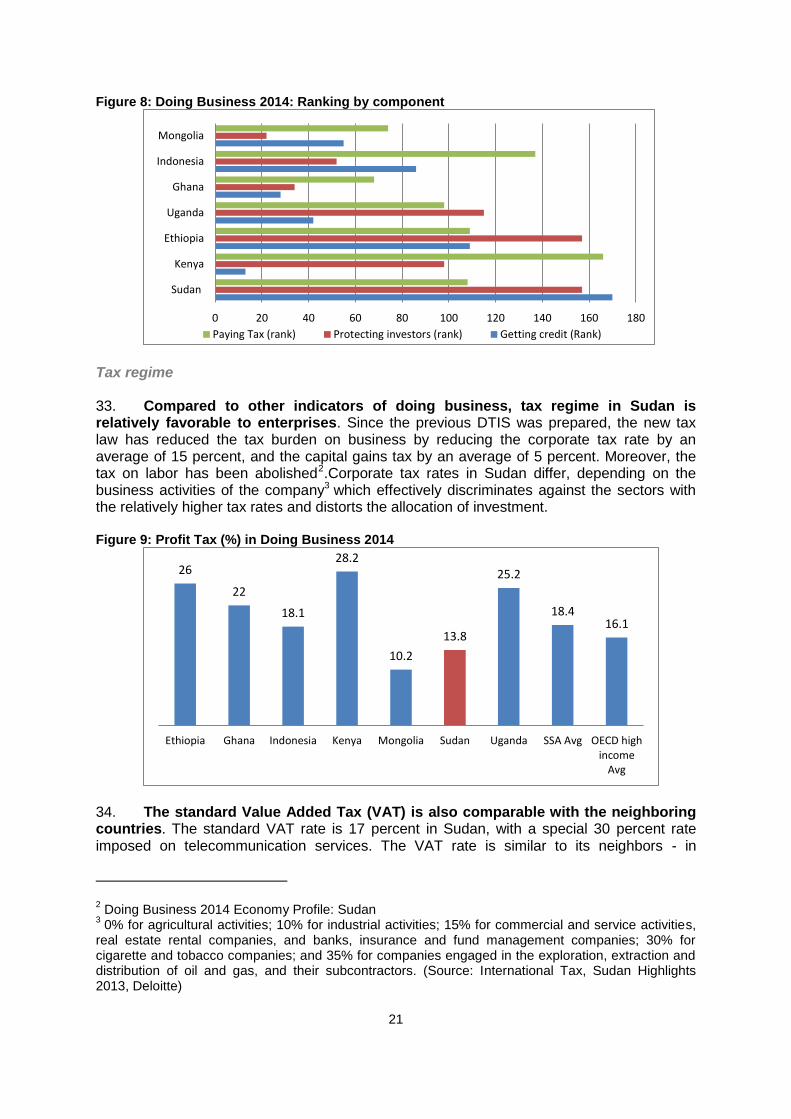
Figure 8: Doing Business 2014: Ranking by component
Tax regime 33. Compared to other indicators of doing business, tax regime in Sudan is relatively favorable to enterprises. Since the previous DTIS was prepared, the new tax law has reduced the tax burden on business by reducing the corporate tax rate by an average of 15 percent, and the capital gains tax by an average of 5 percent. Moreover, the tax on labor has been abolished2.Corporate tax rates in Sudan differ, depending on the business activities of the company3 which effectively discriminates against the sectors with the relatively higher tax rates and distorts the allocation of investment. Figure 9: Profit Tax (%) in Doing Business 2014
34. The standard Value Added Tax (VAT) is also comparable with the neighboring countries. The standard VAT rate is 17 percent in Sudan, with a special 30 percent rate imposed on telecommunication services. The VAT rate is similar to its neighbors - in
2 Doing Business 2014 Economy Profile: Sudan
3 0% for agricultural activities; 10% for industrial activities; 15% for commercial and service activities,
real estate rental companies, and banks, insurance and fund management companies; 30% for cigarette and tobacco companies; and 35% for companies engaged in the exploration, extraction and distribution of oil and gas, and their subcontractors. (Source: International Tax, Sudan Highlights 2013, Deloitte)
0 20 40 60 80 100 120 140 160 180
Sudan
Kenya
Ethiopia
Uganda
Ghana
Indonesia
Mongolia
Paying Tax (rank) Protecting investors (rank) Getting credit (Rank)
26
22
18.1
28.2
10.2
13.8
25.2
18.4 16.1
Ethiopia Ghana Indonesia Kenya Mongolia Sudan Uganda SSA Avg OECD highincome
Avg

22
Uganda, the standard rate is 18 percent and in Kenya at 16 percent (COMESA, 2009)4, respectively. 35. A wide range of activities and services are exempt from VAT. Activities related to agriculture (agricultural products, seeds, and fertilizer), medicines, bread and locally produced wheat flour, animals, meat, fish, chicken and chicken products, and milk and dairy products are all exempted. Financial, insurance, education, and medical services as well as the rental and sale of real estate for residential purpose are also exempted from VAT5. Promoting Foreign Direct Investment 36. Sudan has encouraged private sector investments, aiming at diversifying its economy with foreign direct investment. Sudan had attracted substantial amounts of foreign direct investment (FDI) after the signing of the CPA in 2005, but most of the investment was probably destined for the oil and petroleum sector. Therefore, following the secession of the South Sudan, the amount of FDI has dropped6. The government has established incentives to encourage investment. The new National Investment Promotion Law (provisional decree) was signed by the president on March 2013. This law prohibits discrimination against foreigners and allows both domestic and foreign investors to have access to incentives described in the law and the regulation 7 , such as licensing, tax exemption, and land access. In other words, foreign private entities can establish and own business enterprises, to repatriate capital and profits, on condition that investors open investment account at the Central Bank of Sudan (CBS) before entering into business. Foreign and domestic private businesses may be registered as a sole trader, partnership, a limited liability company (private or public), special concession, or branch of a foreign registered company8. 37. Under the National Investment Promotion Law (2013) all service sectors are, in principle, open to foreign ownership. However, existing government monopolies and other licensing requirements effectively limit the opportunities for private investment in the transportation, media and communications. More precisely, sectors such as railway freight transportation, airport operation, television broadcasting, and newspaper publishing continue to be effectively closed to foreign capital participation. 38. New legislation aims to reduce red tape for investors –both domestic and foreign. The High Council for Investment was established 2011 with a mandate to facilitate investment procedures and follow up on implementing the incentives9. In addition, a new National Agency for Investment is to be established with financial and administrative independence under the new law in 2013. It will act as the administrator for licensing, granting investment projects, and the preparation of investment plans. This Agency will also manage the “investment single window” with the membership of the commissioners of the ministries and other agencies concerned with investment10.
4 COMESA Tax guide 2009
5 Investment Guide 2013, Africa legal Network
6 Inward FDI to Sudan was 2,894.4 US$ million in 2010 and 2,691.7 US$ million in 2011, respectively,
COMESA Investment Report 2012 7
The earlier Investment regulation 2000 (amended in 2003) is available at http://www.sudanembassy.ca/Docs/Investment%20regulations.pdf (Sudanese Embassy for Canada) 8 2013 Investment Climate Statement Sudan, US Department of State
9 Investment Guide 2013, Africa legal Network
10 National Investment Promotion Law of 2013, National Agency for Investment (English Translation)

23
Trading Across Borders 39. Sudan has succeeded in reducing the number of days to import and export with the introduction of automation; however, the operational procedures to import and export have not changed much. The beginning of the introduction of ASYCUDA World coincided with the reduction of time to import and export. While cooperation between the related agencies has improved through the ASYCUDA system, the DB indicators imply the procedure with documents remained largely unchanged. The relatively long time required for importing and exporting are indicative of high trade costs. Indeed the time taken for clearances may be converted into an ad valorem equivalent.11
Figure 10: Doing Business Indicators on Trading Across Borders
40. For a country with sea access Sudan has a relatively low ranking on the trade facilitation component of the Doing Business indicators. The DB2014 ranking for Sudan (155th) on trading across borders is closer to the ones for landlocked countries and slightly worse than the regional average for sub-Saharan Africa (141). Landlocked countries, such as Uganda and Ethiopia in the comparators, often have more penalties than non-landlocked ones in trading across borders12. Sudan with relatively good port infrastructure does not appear to be taking full advantage of its geographic location. It is notable that the cost to import is close to the price for the neighboring comparator landlocked countries. Figure 11: Doing Business 2014: Ranking for Sudan and comparators on Trading Across Borders
11 Nathan Associates (2007), Calculating Tariff Equivalents for Time in Trade, USAID.
12 Alvis et al (2010) Cost of being landlocked Logistics Cost and Supply Chain Reliability, World Bank
0 10 20 30 40 50 60
Documents to export (number)
Time to export (days)
Documents to import (number)
Time to import (days)
DB2014 DB2011 DB2008
0 50 100 150 200
Sudan
Kenya
Ethiopia
Uganda
Ghana
Indonesia
Mongolia
Rank

24
Figure 12: Cost to Import and Export (US$ per containers) for selected countries in Doing Business 2014
Lessons from the Implementation of the 2008 Action Matrix 41. The 2008 Action Matrix made recommendations across four broad areas: (i) increasing productivity in the export sectors; (ii) reducing trade costs; (iii) rationalizing the incentive regime; and (iv), strengthening trade promotion and policy making institutions. In aggregate the Action Matrix endorsed 87 actions that were required to take place within 1-5 years with the majority earmarked for within 1-3 years. The recommendations required action across Ministries, Agencies, Regulatory Bodies, technical working groups and other stakeholders. 11 of the recommendations related specifically to the former Government of South Sudan and are not considered further. Recording implementation by the number of items is merely illustrative as the impact of each item varies widely. 42. Implementation has been very modest –only 4 Actions implemented fully from a total of 76 Action items. From the 76 action items 16 relate to increasing productivity primarily in agriculture, animal husbandry and fisheries; 15 focus on activities aimed at reducing trade costs, 7 on improving the incentives for investment; and 38 relate to institutional strengthening within government for trade policy and promotion activities. Interviews with stakeholders from both government and the private sector established that 4 had been implemented fully, with only 1 of these having a significant impact. Stakeholders considered that implementation had commenced (to varying degrees) for a further 48 tasks, however, for more than one third (28) of the priority items no action was recorded. A summary of the progress is contained in Table 1. A detailed assessment of each recommended action is contained in Appendix 1.
43. The implemented actions largely relate to trade facilitation and while positive their aggregate impact is muted because of the continued high trade costs and significant disincentives to export. The active involvement of donor projects at least partially explains some of the implementation. However, in many areas there has been either very limited progress or no action. These include: strengthening institutional capacity for ensuring effective coordination, negotiation and implementation of trade agreements, simplifying and harmonizing taxes, fees and charges, and diversifying exports.
$0 $500 $1,000 $1,500 $2,000 $2,500 $3,000 $3,500
Ethiopia
Ghana
Indonesia
Kenya
Mongolia
Uganda
Sudan
Cost to export (US$) Cost to import (US$)
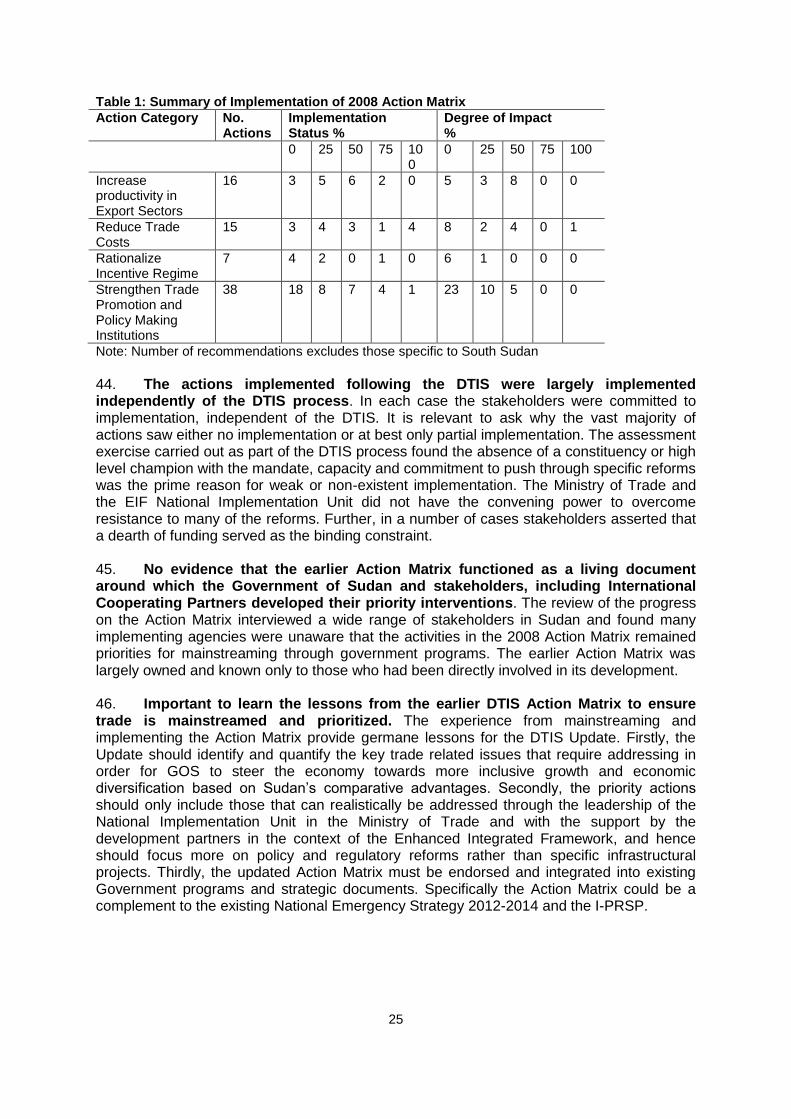
25
Table 1: Summary of Implementation of 2008 Action Matrix
Action Category No. Actions
Implementation Status %
Degree of Impact %
0 25 50 75 100
0 25 50 75 100
Increase productivity in Export Sectors
16 3 5 6 2 0 5 3 8 0 0
Reduce Trade Costs
15 3 4 3 1 4 8 2 4 0 1
Rationalize Incentive Regime
7 4 2 0 1 0 6 1 0 0 0
Strengthen Trade Promotion and Policy Making Institutions
38 18 8 7 4 1 23 10 5 0 0
Note: Number of recommendations excludes those specific to South Sudan
44. The actions implemented following the DTIS were largely implemented independently of the DTIS process. In each case the stakeholders were committed to implementation, independent of the DTIS. It is relevant to ask why the vast majority of actions saw either no implementation or at best only partial implementation. The assessment exercise carried out as part of the DTIS process found the absence of a constituency or high level champion with the mandate, capacity and commitment to push through specific reforms was the prime reason for weak or non-existent implementation. The Ministry of Trade and the EIF National Implementation Unit did not have the convening power to overcome resistance to many of the reforms. Further, in a number of cases stakeholders asserted that a dearth of funding served as the binding constraint. 45. No evidence that the earlier Action Matrix functioned as a living document around which the Government of Sudan and stakeholders, including International Cooperating Partners developed their priority interventions. The review of the progress on the Action Matrix interviewed a wide range of stakeholders in Sudan and found many implementing agencies were unaware that the activities in the 2008 Action Matrix remained priorities for mainstreaming through government programs. The earlier Action Matrix was largely owned and known only to those who had been directly involved in its development. 46. Important to learn the lessons from the earlier DTIS Action Matrix to ensure trade is mainstreamed and prioritized. The experience from mainstreaming and implementing the Action Matrix provide germane lessons for the DTIS Update. Firstly, the Update should identify and quantify the key trade related issues that require addressing in order for GOS to steer the economy towards more inclusive growth and economic diversification based on Sudan’s comparative advantages. Secondly, the priority actions should only include those that can realistically be addressed through the leadership of the National Implementation Unit in the Ministry of Trade and with the support by the development partners in the context of the Enhanced Integrated Framework, and hence should focus more on policy and regulatory reforms rather than specific infrastructural projects. Thirdly, the updated Action Matrix must be endorsed and integrated into existing Government programs and strategic documents. Specifically the Action Matrix could be a complement to the existing National Emergency Strategy 2012-2014 and the I-PRSP.
26
Chapter 3: Trade Policy and Performance Sudan’s trade developments and challenges 47. This chapter describes aggregate trends in export performance since the 2008 DTIS and then, using a rich new dataset on exporting firms for Sudan and comparator countries drills down to examine the characteristics of exporters. This is followed by a description of the structure of nominal protection which measures the price raising impact of tariffs under both the General Tariff, and other duties and surcharges that are applied. 48. Multiple tariff schedules in conjunction with rebates on imported inputs and duty preferences, along with additional para-tariffs including discriminatory excise taxation and Development Tax creates significant protection for Sudanese firms. This encourages them to produce for the domestic market as this is much more profitable than exporting. Simplifying and streamlining trade policies will create a more neutral environment between producing for the domestic or the international market. Reducing anti-export bias will encourage investment in a wider range of economic activities while also stimulating increased linkages to the existing domestic agro-industries and manufacturing sectors. Furthermore, reducing anti-export bias will increase Sudan’s relative attractiveness as a location for activities linked to either regional or global value chains.
49. Sudan remains outside the WTO and is not expected to sign an Economic Partnership Agreement with the EU, however, Sudan participates in both the COMESA and GAFTA Free Trade Areas. Sudan applied for Accession to the WTO in 1994, submitted the first Memorandum on the Foreign Trade Regime in 1999 and participated in the Second Working Party Meeting in 2004. Sudan updated the Memorandum on the Foreign Trade Regime in 2012 and has indicated its commitment to continue with the WTO Accession Process. Although negotiating with the EU as part of the Eastern and Southern African Group Sudan chose not to sign an interim Economic Partnership Agreement (EPA) in December 2007 and is not expected to sign the EPA. Sudan will continue to enjoy preferential access to the EU under Everything But Arms (EBA) which provides for duty- and quota-free access for all products except for arms and ammunition for least developed countries. 50. Economic Sanctions by the United States remain and represent an indirect barrier to trade. Since 1997 the United States has prohibited US firms and individuals from trade with Sudan or conducting any business transaction with the GOS or state-owned enterprises. Imports of gum Arabic are exempt from sanctions. The sanctions impact on access to finance, the sourcing of inputs and replacement technical parts (Sudan Railway Corporation explicitly mentioned the difficulty in maintaining their locomotive fleet). The DTIS team was presented with a number of illustrative examples of the impact of sanctions however no comprehensive studies were made available. It is recommended that a study be undertaken. 51. This section provides an overview of Sudan’s recent trade performance. The review of trade performance (from 2008-2013) is based on detailed commodity composition of trade data received from the Sudan authorities. The report documents the changes in both the commodity composition and the geographical direction of imports and exports. However, anecdotal evidence suggests that trade flows are consistently underreported at
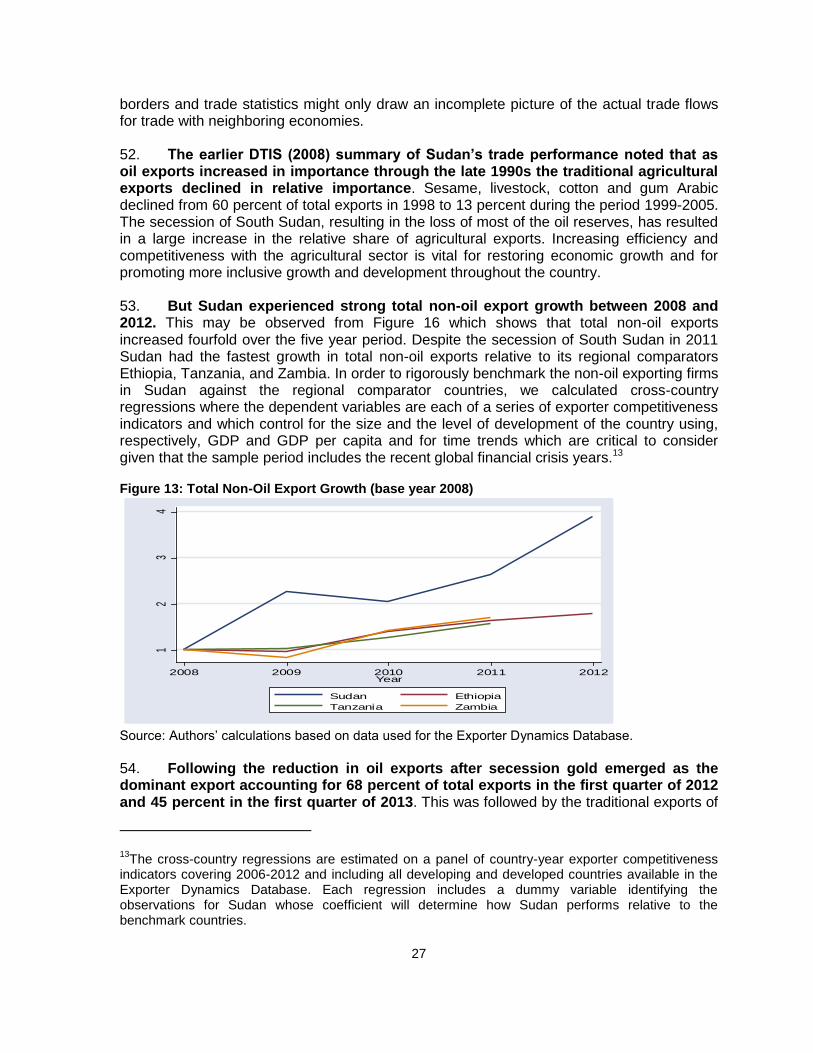
27
borders and trade statistics might only draw an incomplete picture of the actual trade flows for trade with neighboring economies.
52. The earlier DTIS (2008) summary of Sudan’s trade performance noted that as oil exports increased in importance through the late 1990s the traditional agricultural exports declined in relative importance. Sesame, livestock, cotton and gum Arabic declined from 60 percent of total exports in 1998 to 13 percent during the period 1999-2005. The secession of South Sudan, resulting in the loss of most of the oil reserves, has resulted in a large increase in the relative share of agricultural exports. Increasing efficiency and competitiveness with the agricultural sector is vital for restoring economic growth and for promoting more inclusive growth and development throughout the country. 53. But Sudan experienced strong total non-oil export growth between 2008 and 2012. This may be observed from Figure 16 which shows that total non-oil exports increased fourfold over the five year period. Despite the secession of South Sudan in 2011 Sudan had the fastest growth in total non-oil exports relative to its regional comparators Ethiopia, Tanzania, and Zambia. In order to rigorously benchmark the non-oil exporting firms in Sudan against the regional comparator countries, we calculated cross-country regressions where the dependent variables are each of a series of exporter competitiveness indicators and which control for the size and the level of development of the country using, respectively, GDP and GDP per capita and for time trends which are critical to consider given that the sample period includes the recent global financial crisis years.13 Figure 13: Total Non-Oil Export Growth (base year 2008)
Source: Authors’ calculations based on data used for the Exporter Dynamics Database.
54. Following the reduction in oil exports after secession gold emerged as the dominant export accounting for 68 percent of total exports in the first quarter of 2012 and 45 percent in the first quarter of 2013. This was followed by the traditional exports of
13The cross-country regressions are estimated on a panel of country-year exporter competitiveness
indicators covering 2006-2012 and including all developing and developed countries available in the Exporter Dynamics Database. Each regression includes a dummy variable identifying the observations for Sudan whose coefficient will determine how Sudan performs relative to the benchmark countries.
12
34
Expo
rt Gr
owth
2008 2009 2010 2011 2012Year
Sudan Ethiopia
Tanzania Zambia
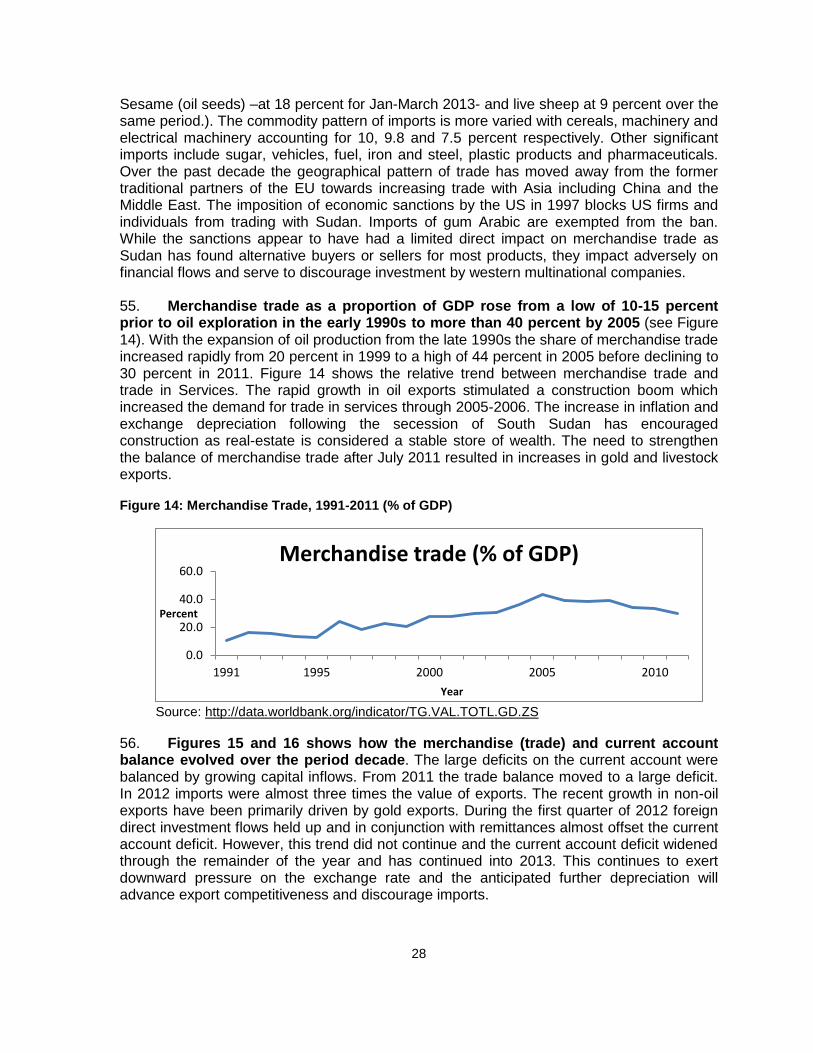
28
Sesame (oil seeds) –at 18 percent for Jan-March 2013- and live sheep at 9 percent over the same period.). The commodity pattern of imports is more varied with cereals, machinery and electrical machinery accounting for 10, 9.8 and 7.5 percent respectively. Other significant imports include sugar, vehicles, fuel, iron and steel, plastic products and pharmaceuticals. Over the past decade the geographical pattern of trade has moved away from the former traditional partners of the EU towards increasing trade with Asia including China and the Middle East. The imposition of economic sanctions by the US in 1997 blocks US firms and individuals from trading with Sudan. Imports of gum Arabic are exempted from the ban. While the sanctions appear to have had a limited direct impact on merchandise trade as Sudan has found alternative buyers or sellers for most products, they impact adversely on financial flows and serve to discourage investment by western multinational companies. 55. Merchandise trade as a proportion of GDP rose from a low of 10-15 percent prior to oil exploration in the early 1990s to more than 40 percent by 2005 (see Figure 14). With the expansion of oil production from the late 1990s the share of merchandise trade increased rapidly from 20 percent in 1999 to a high of 44 percent in 2005 before declining to 30 percent in 2011. Figure 14 shows the relative trend between merchandise trade and trade in Services. The rapid growth in oil exports stimulated a construction boom which increased the demand for trade in services through 2005-2006. The increase in inflation and exchange depreciation following the secession of South Sudan has encouraged construction as real-estate is considered a stable store of wealth. The need to strengthen the balance of merchandise trade after July 2011 resulted in increases in gold and livestock exports. Figure 14: Merchandise Trade, 1991-2011 (% of GDP)
Source: http://data.worldbank.org/indicator/TG.VAL.TOTL.GD.ZS
56. Figures 15 and 16 shows how the merchandise (trade) and current account balance evolved over the period decade. The large deficits on the current account were balanced by growing capital inflows. From 2011 the trade balance moved to a large deficit. In 2012 imports were almost three times the value of exports. The recent growth in non-oil exports have been primarily driven by gold exports. During the first quarter of 2012 foreign direct investment flows held up and in conjunction with remittances almost offset the current account deficit. However, this trend did not continue and the current account deficit widened through the remainder of the year and has continued into 2013. This continues to exert downward pressure on the exchange rate and the anticipated further depreciation will advance export competitiveness and discourage imports.
0.0
20.0
40.0
60.0
1991 1995 2000 2005 2010
Percent
Year
Merchandise trade (% of GDP)

29
Figure 15: Merchandise Trade and services Trade, 2005-2011 (% of GDP)
Source: Derived from http://data.worldbank.org/indicator
Figure 16: Current account components, 2005-2013 (US$ million)
Source: Central Bank of Sudan, various reports. Estimate in 2012, forecast in 2013.
Direction of Trade 57. Asia and the Middle East have increased in importance as a source for import and the major destination for exports. The earlier DTIS (2008) noted that Sudan traded relatively less with Europe and the United States and more with non-OECD and other developing countries. This trend has continued with Sudan increasing its sourcing of imports from Asia and the Middle East. Table 2 shows that the largest EU suppliers in 2006 –Italy, Germany and the United Kingdom witnessed a significant decline in their relative shares from accounting for more than 10 percent in aggregate to less than 7 percent. Excluding sales of oil and petroleum Saudi Arabia is the major destination for exports-mainly livestock and oilseeds. Sudan’s trade with Sub-Saharan Africa is relatively modest although with the
0.0
5.0
10.0
15.0
20.0
25.0
30.0
35.0
40.0
45.0
50.0
2005 2006 2007 2008 2009 2010 2011
Percent
Year
Merchandise Trade
Services Trade
-8,000
-6,000
-4,000
-2,000
0
2,000
4,000
2005 2006 2007 2008 2009 2010 2011 2012 2013
Trade balance
IncomebalanceServicesbalance

30
secession of South Sudan there is considerable potential to increase trade to the new country. 58. Sudan continues to depend on a very small number of markets for most of its agricultural exports. The earlier DTIS highlighted that except for gum Arabic14 and sesame most of Sudan’s agricultural exports were destined for a small number of countries which rendered them vulnerable to market disruption. The report recommended prioritizing diversifying into new markets. 59. Sudan remains largely isolated from the rest of Sub-Saharan Africa (SSA) –very limited trade with COMESA except for Egypt, trade with GAFTA15 is much more important. Exports to the GAFTA countries –primarily Saudi Arabia and Egypt accounted for approximately 25 percent of total non-oil exports. With the notable exception of Egypt which is also a GAFTA member Sudan’s trade with other COMESA members has remained minimal. Indeed excluding Egypt exports to COMESA account for less than 1 percent of total non-oil exports. Trade with other Sub-Saharan African countries has not been significant however there is considerable potential for cross border trade with neighboring countries including South Sudan. Asia is an important trading partner, accounting for almost 20 percent of total imports and almost two thirds of total exports prior in 2006. When oil exports are excluded Saudi Arabia is the largest export partner accounting for more than twenty percent. Table 2: Principal Trade Partners of Sudan in 2006 vs. 2012/13
Source of Imports 2006
Source of Imports 2012
Destination of Exports 2006
Destination of Exports 2013
China 18.2 China 17.7 China 62.9 China 56.7
Saudi Arabia 8.1 India 9.0 Japan 12.9 UAE 15.5
Japan 6.7 Saudi Arabia 7.7 Saudi Arabia
4.7 Saudi Arabia 6.3
Egypt 5.5 Egypt 6.4 UAE 3.3 Canada 1.7
UAE 5.5 UAE 5.0 Canada 1.9 UK 0.3
India 4.3 Bangladesh 3.9 UK 1.7 Egypt 1.4
Italy 4.0 Australia 3.8 Egypt 1.6 Ethiopia 0.7
UK 3.6 Turkey 3.7 France 0.9 Eritrea 0.6
Germany 3.5 Japan 3.4 India 0.9 India 0.7
Note: Shares are based on nominal US$ values of exports and imports Source: For 2006 DTIS (2008) and 2012 derived from trade data provided by Sudan Customs and the Central Bank of Sudan for exports in 2013.
14 Gum Arabic is the one product explicitly exempted from the trade sanctions imposed by the United
States. 15
Members of COMESA implementing the Free Trade Area include Burundi, Comoros, Djibouti, Egypt, Kenya, Libya, Madagascar, Malawi, Mauritius, Rwanda, Seychelles, Sudan, Zambia and Zimbabwe. The other members of COMESA include the Democratic Republic of Congo (DRC), Eritrea, Ethiopia, Swaziland and Uganda (which offers an 80 percent preference on the MFN tariff rate to COMESA members. The members of the GAFTA include 17 Arab countries: Jordan, UAE, Bahrain, Saudi Arabia, Oman, Qatar, Morocco, Sudan, Syria, Lebanon, Iraq, Egypt, Palestine, Kuwait, Tunisia, Libya, and Yemen.
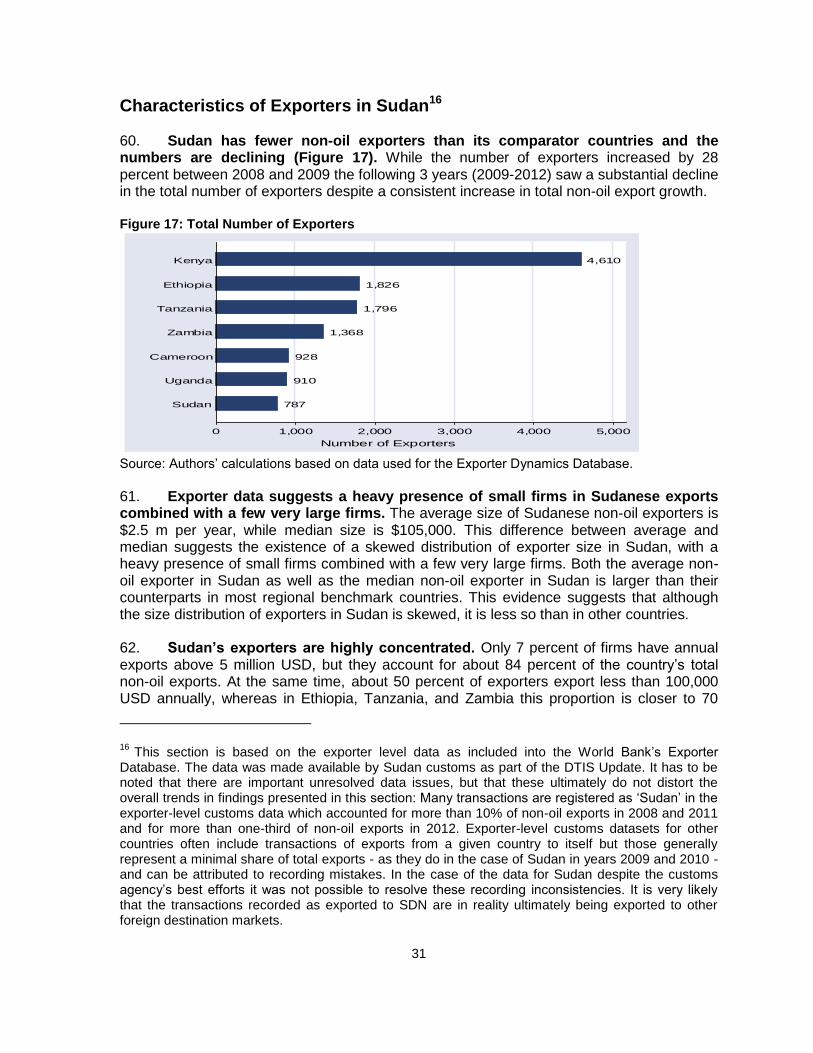
31
Characteristics of Exporters in Sudan16 60. Sudan has fewer non-oil exporters than its comparator countries and the numbers are declining (Figure 17). While the number of exporters increased by 28 percent between 2008 and 2009 the following 3 years (2009-2012) saw a substantial decline in the total number of exporters despite a consistent increase in total non-oil export growth. Figure 17: Total Number of Exporters
Source: Authors’ calculations based on data used for the Exporter Dynamics Database.
61. Exporter data suggests a heavy presence of small firms in Sudanese exports combined with a few very large firms. The average size of Sudanese non-oil exporters is $2.5 m per year, while median size is $105,000. This difference between average and median suggests the existence of a skewed distribution of exporter size in Sudan, with a heavy presence of small firms combined with a few very large firms. Both the average non-oil exporter in Sudan as well as the median non-oil exporter in Sudan is larger than their counterparts in most regional benchmark countries. This evidence suggests that although the size distribution of exporters in Sudan is skewed, it is less so than in other countries. 62. Sudan’s exporters are highly concentrated. Only 7 percent of firms have annual exports above 5 million USD, but they account for about 84 percent of the country’s total non-oil exports. At the same time, about 50 percent of exporters export less than 100,000 USD annually, whereas in Ethiopia, Tanzania, and Zambia this proportion is closer to 70
16 This section is based on the exporter level data as included into the World Bank’s Exporter
Database. The data was made available by Sudan customs as part of the DTIS Update. It has to be noted that there are important unresolved data issues, but that these ultimately do not distort the overall trends in findings presented in this section: Many transactions are registered as ‘Sudan’ in the exporter-level customs data which accounted for more than 10% of non-oil exports in 2008 and 2011 and for more than one-third of non-oil exports in 2012. Exporter-level customs datasets for other countries often include transactions of exports from a given country to itself but those generally represent a minimal share of total exports - as they do in the case of Sudan in years 2009 and 2010 - and can be attributed to recording mistakes. In the case of the data for Sudan despite the customs agency’s best efforts it was not possible to resolve these recording inconsistencies. It is very likely that the transactions recorded as exported to SDN are in reality ultimately being exported to other foreign destination markets.
787
910
928
1,368
1,796
1,826
4,610
0 1,000 2,000 3,000 4,000 5,000
Number of Exporters
Sudan
Uganda
Cameroon
Zambia
Tanzania
Ethiopia
Kenya
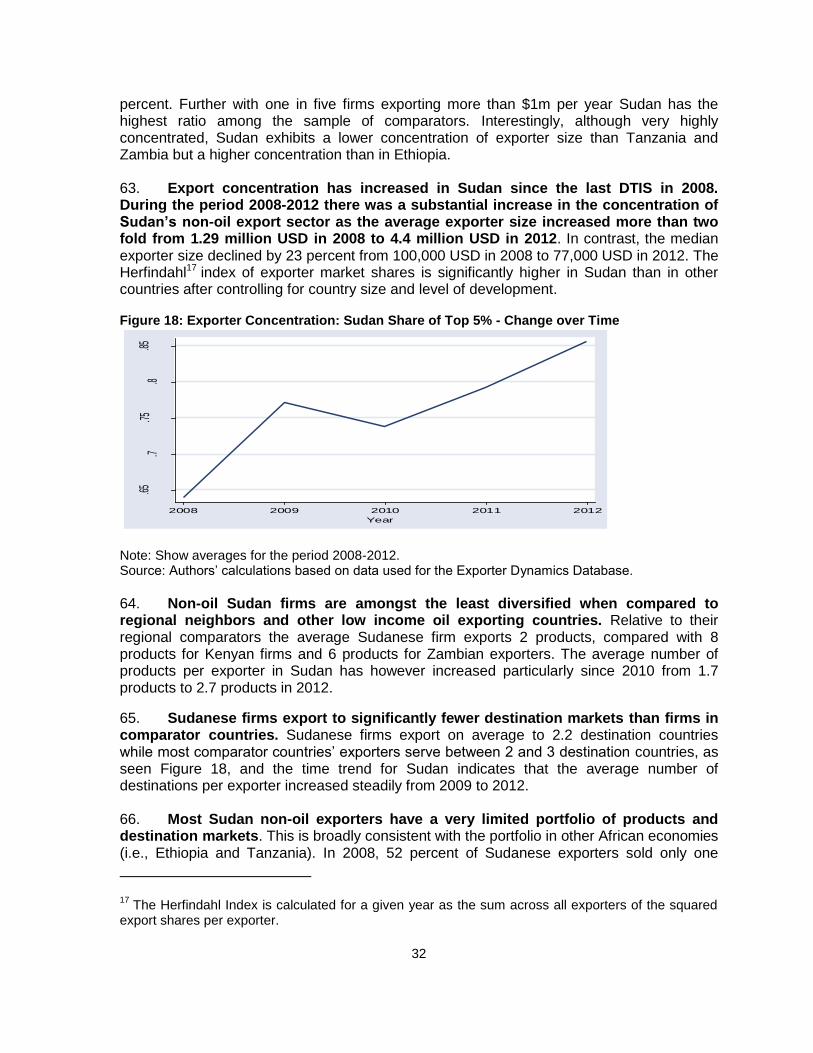
32
percent. Further with one in five firms exporting more than $1m per year Sudan has the highest ratio among the sample of comparators. Interestingly, although very highly concentrated, Sudan exhibits a lower concentration of exporter size than Tanzania and Zambia but a higher concentration than in Ethiopia.
63. Export concentration has increased in Sudan since the last DTIS in 2008. During the period 2008-2012 there was a substantial increase in the concentration of Sudan’s non-oil export sector as the average exporter size increased more than two fold from 1.29 million USD in 2008 to 4.4 million USD in 2012. In contrast, the median exporter size declined by 23 percent from 100,000 USD in 2008 to 77,000 USD in 2012. The Herfindahl17 index of exporter market shares is significantly higher in Sudan than in other countries after controlling for country size and level of development. Figure 18: Exporter Concentration: Sudan Share of Top 5% - Change over Time
Note: Show averages for the period 2008-2012. Source: Authors’ calculations based on data used for the Exporter Dynamics Database.
64. Non-oil Sudan firms are amongst the least diversified when compared to regional neighbors and other low income oil exporting countries. Relative to their regional comparators the average Sudanese firm exports 2 products, compared with 8 products for Kenyan firms and 6 products for Zambian exporters. The average number of products per exporter in Sudan has however increased particularly since 2010 from 1.7 products to 2.7 products in 2012.
65. Sudanese firms export to significantly fewer destination markets than firms in comparator countries. Sudanese firms export on average to 2.2 destination countries while most comparator countries’ exporters serve between 2 and 3 destination countries, as seen Figure 18, and the time trend for Sudan indicates that the average number of destinations per exporter increased steadily from 2009 to 2012. 66. Most Sudan non-oil exporters have a very limited portfolio of products and destination markets. This is broadly consistent with the portfolio in other African economies (i.e., Ethiopia and Tanzania). In 2008, 52 percent of Sudanese exporters sold only one
17 The Herfindahl Index is calculated for a given year as the sum across all exporters of the squared
export shares per exporter.
.65.7
.75.8
.85
Share
of To
p 5%
Exp
orters
2008 2009 2010 2011 2012
Year

33
product to one destination market and accounted for 28 percent of total non-oil exports. By 2012, only 36 percent of firms sold one product to one destination and accounted for just 3 percent of total non-oil exports. In 2008, only 1 percent of Sudanese exporters sold more than ten products and surprisingly they accounted for just 2 percent of total non-oil exports; similarly, in 2012 only 2 percent of Sudanese exporters were highly diversified product-wise and they only accounted for 3 percent of total non-oil exports.18 67. Sudan has no ‘export superstars’ – but in most other countries a small number of multi-product multi-destination exporters account for the majority of total exports in a country thereby driving the sector.19 Assuming ‘diversified exporters’ to be ones that export 4 or more products to 4 or more destinations, they represent only 5 percent of firms and 22 percent of total non-oil exports in 2008 and represent 11 percent of firms and 17 percent of total non-oil exports in 2012. Comparable data from Cameroon, Yemen, Egypt and Cote d’Ivoire all show ‘diversified exporters’ accounting for more than 40 percent of total non-oil exports. 68. Exporter dynamics measured by entry and exit rates are significantly higher in Sudan than in other countries. Sudan has the highest entry and exit rates among all regional comparators in. There is a tremendous degree of churning in export markets: on average in a given year, 59 percent of Sudanese firms that export did not do so in the previous year whereas 57 percent of Sudanese firms that were exporting in the previous year stopped exporting. Entry rates by Sudanese firms into export markets declined drastically between 2008 and 2012. Exit rates also declined however a slower pace than entry rates. In 2011 and 2012 exporter net entry in Sudan became negative which indicates a decline in the number of exporters. 69. Sudan’s non-oil exports are concentrated in a small number of markets and this is not solely a consequence of economic sanctions against Sudan. The low level of diversification in terms of destination markets for its non-oil exports is not solely a consequence of the economic sanctions imposed by the United States since 1997 as Sudan is isolated even within Africa. However, sanctions have exacerbated the isolation through increasing the difficulty in settling cross-border payments which affects trade with all partners including their African neighbors. The United Arab Emirates has been a key trading partner for Sudan over the entire period; Canada was a particularly important partner in 2009 but has declined, and since 2010 Saudi Arabia has steadily become an important market for Sudanese exports (Table 2). 70. Following the secession of the South, Sudanese firms now have the opportunity to export to South Sudan and numbers are rising. Owing to the security situation following secession trade was limited, however, with the agreement (in 2013) to open border crossing points we would expect to see an increase in the number of Sudanese firms exporting to South Sudan in 2014. In 2012 35 firms out of a total of 754 non-oil exporters exported 101 products.20 There are opportunities for Sudan to export agricultural
18 For any panel, these percentages are obtained as the sum of the last two cells in the column
entitled ‘Total’ (corresponding to 11 to 20 products or 20 or more products). 19
See for example Cebecci, Fernandes, Freund and Pierola (2012) and Freund and Pierola (2012). 20
The top three HS-2 digit sectors exported to South Sudan are: live animals (HS 01) which account for 29% of exports, tobacco and tobacco substitutes (HS 24) which account for 18% of exports, and
34
products and foodstuffs to South Sudan as historically, prior to secession the food deficit was met with imports from the north. Reducing trade costs across the border between Sudan and South Sudan would represent a win-win for both countries by benefiting communities on both sides of the border. 71. The United Arab Emirates (UAE) is the main destination market for Sudanese non-oil exports and exporter concentration increased over the period 2008-2012. Concentration in other destinations has been constant with only a slight increase in 2012. Only 8 Sudanese exporters sell to Canada therefore that market is completely concentrated. The share of exports accounted for by the top 5 percent of exporter’s ranges between 50 percent and 60 percent in most destination markets. Some exceptions are the case of UAE where the top 5 percent of exporters account for 99 percent of total non-oil exports in that market in 2012, a very substantial increase relative to 2010 when the top 5 percent of exporters only accounted for 45 percent of total non-oil exports. 72. The average size of Sudan’s exporters to UAE and Saudi Arabia has grown substantially during the period but particularly those exporting to UAE. By 2012, the average size of exporters to the UAE reached nearly three times that of exporters to SAU. The size of the median exporter is more homogeneous across destination markets than the size of the average exporter. It is important to highlight that the median size to all destination markets, except for those classified as exporting to Sudan declines over the period. 73. Looking at specific products in the Exporter Database21 confirms that precious metals are Sudan’s leading non-oil export. The number of precious metal exporters nearly doubled from 47 in 2008 to 87 in 2009 but subsequently declined to 20 in 2012. However, this was not matched by a decline in the value of total exports, on the contrary, that value increased by eight from 2008 to 2012. Sudan benefited from increasing international gold prices that nearly doubled during the 2008-2012 period.22 However, the spectacular growth of precious metal exports was not only a consequence of high prices but also stemmed from a more than four-fold increase in the quantities exported between 2008 and 2009. Recent analysis (for the CEM) does not anticipate significant further rapid growth in output for the gold sector. 74. Oil seeds are the second largest non-oil export sector in Sudan. The main product exported is sesame seeds which account for about 50 percent of the sector’s total exports in any given year. A surge in the number of oil seed exporters in 2009 is followed by a decline in 2010 and then remains constant until 2012. The value of oil seeds exports declined slightly from 2008 to 2010 but recovered by growing more than 50 percent from 2010 to 2012. This important growth was driven by growth in export volumes as quantities of oil seed exports doubled between 2008 and 2012.The oil seeds sector faced unfavorable unit value (price) movements over the period.
vehicles other than railway or tramway rolling stock, and parts and accessories thereof (HS 87) which account for 17% of exports. 21
Please see the background paper for more details on precious metals, oil seeds and live animals 22
Although HS code 71 covers products other than gold, 99.5% of the value of Sudan’s exports in HS code 71 originates in the 4-digit HS code 7108 which is gold.

35
75. Live animals are the third largest non-oil export sector in Sudan. Between 2008 and 2012 live animal exports increased five-fold. This surge is due to a combination of favorable unit value (price) movements as well as a substantial increase in quantities exported. The number of live animal exporters increased from 139 in 2008 to 165 in 2011 but dropped to 129 in 2012. The impressive growth in the sector however only helped it keep up with other growing export sectors in Sudan, as its share in the value of total non-oil exports remained constant at around 9 percent. The importance of live animals in the total number of exporters has declined slightly from 21 percent in 2008 to 17 percent in 2012. Entrants into live animals exports account for a larger share of total entrants than exporters of live animals account for in total exporters. Also exiting traders in the live animals sector represented a particularly high share - 28 percent - of total traders exiting in 2012.
General Duty Schedules and Para Tariffs: High Levels of Protection 76. The General tariff along with the imposition of additional border duties or Para-Tariffs results in Sudan having high levels of protection. Sudan is a member of two free trade areas-COMESA and GAFTA and under both offers duty free access although the para-tariffs continue to be levied. There is some limited overlapping membership between COMESA and GAFTA as both Egypt and Libya are members of both organizations. The tariff schedules include General for all countries, GAFTA, COMESA (members of the free trade area), and COMESA (non-members of the FTA). 77. The General tariff comprises five bands: duty free (zero), 3, 10, 25, and 40 percent. Table 3 shows the 2014 tariff structure. All tariffs are applied on an ad valorem basis to the c.i.f. value of the import, there are no specific tariffs. The 2014 tariff schedule contains 5,221 lines at the HS 8 digit level and is based on the HS-2012 nomenclature23. Approximately 8 percent of General tariff lines are at zero, with a further 19 percent at 3 percent. More than half of all the tariff lines (56 percent) are 25 percent or above. The modal (or most common) tariff rate is 40 percent accounting for 41 percent of all tariff lines and 19 percent of the total value of imports. The economy wide average General tariff is 20.1 percent. 24 The simple average tariff is higher for agriculture relative to industry with HS Chapters 1-24 showing a simple average of 33.2 percent and HS Chapters 25-96 registering 19.0 percent.
78. Only 16 percent of imports in 2012 entered through the zero rated tariff lines. Most capital goods (machinery and electrical) are duty free along with fertilizers (chemicals). Animal and vegetable products have the highest percentage of tariff lines at the maximum 40 percent duty. The 3 percent tariff mainly applies to intermediate products such as chemicals, textiles and metals, with higher rates applied to industrial and consumer goods. There is one tariff line at 50 percent which is reserved for personal imports.
23 This is 54 tariff lines fewer than previously reported before Sudan switched from using the HS 2007
to HS 2012 system of classification. Since the 2012 HS six digit classification contains 5,205 lines Sudan has only 17 specific national level tariff lines at the HS 8 digit level. 24
If Other unclassified imports are excluded the economy wide average increases to 21.4%

36
Table 3: Sudan 2014 Tariff Structure
Tariff (%) Number of Tariff Lines
Percent of Tariff Lines in each Tariff Bands
2012 Imports ($ million)
2012 Imports Percent
Zero 414 7.9 1,396 16.0
3 978 18.7 899 10.3
10 1041 19.9 3,226 37.0
25 859 16.5 1,532 17.6
40 1929 36.9 1,661 19.1
50 1 - - -
Total 5222
Source: Derived from Sudan Customs ASYCUDA Database and COMTRADE
79. In 2012 the average listed tariff (ex ante) was more than twice as high as the actual duty collected rate (ex post)-highlighting the widespread use of exemptions. In 2012 the average tariff weighted by the commodity composition of imports was 16 percent which would have yield $1.39 billion. However, the actual customs duty collected (often referred to as the ex post tariff) in 2012 was $568 million25 which represents an average collection rate of 6.5 percent. The difference between the statutory rates (or ex-ante tariff rate) and the ex post tariff rate is accounted for by duty exemptions and preferential tariffs. The sharp reduction in oil revenues following the secession of South Sudan has increased pressure on all sources of revenue and resulted in increasing dependence on tariff revenue which in 2012 accounts for more than 30 percent of total government income. Table 3 presents a breakdown of the average tariff rates by major sector groupings and shows the divergence between the published schedules and the actual duty paid on imports. These include regional preferences under GAFTA and COMESA, various duty remission schemes, and exceptions for imports from international organizations, diplomats and returning migrant workers. Figure 19: Distribution of Tariff Rates (2012) and Imports based on Statutory Tariffs
Source: Derived from TRAINS database for 2012.
80. Over the past two years Sudan have amended their tariff structure by decreasing a relatively few tariff lines and increasing approximately 500 tariff lines to
2525 We have excluded imports classified as ‘Other’ from these calculations. In 2012 these totaled
$973.7 million and yielded customs duties of $15.9 million.
0%
10%
20%
30%
40%
Duty Free 3% 10% 25% 40%
Tariff Rates
Share of tariff lines in tariff band Share of imports in tariff band

37
the maximum 40 percent. The number of tariff lines at zero (for capital goods) increased from 330 to over 400. The number of tariff lines at 3 percent has remained virtually constant. While over 400 tariff lines increased from 25 to 40 percent, approximately 100 appear to have been increased from 10 percent to 40 percent – a 3 fold increase in protection. The private sector highlighted the impact of the tariff increases on their cost structure. Figure 20: Distribution of Tariff Rates (2013) and Imports (2012) based on Applied Tariffs
Source: Derived from data provided by the Government of Sudan.
Table 4: Sector Groups: Tariff Collection Rates, Imports and Exports for 2012 (Values in US $ million)
HS Codes
Sector Groups Simple Avg. Tariff %
Customs Duty ($m)
Ex Post Duty %
Import (cif)
Ex Post Duty % (incl. para-tariffs)
Export (fob)
01-05 Animal Products 37.2 10.3 11.2 91.9 19.6 387.1
06-15 Vegetable Products 28.7 20.3 4.2 486.2 8.5 357.4
16-24 Foodstuffs 34.6 20.8 2.5 816.5 4.9 20.9
25-26 Minerals 8.4 0.2 0.8 31.2 2.5 9.9
27 Mineral Fuels 8.7 31.3 2.9 1,078.6 6.1 758.0
28-38 Chemicals 7.4 37.6 4.5 828.8 6.6 215.8
39-40 Plastic and Rubber 14.5 41.1 8.5 481.1 12.3 1.6
41-43 Hides and Skins 39.1 3.5 38.0 9.1 58.6 34.8
44-49 Wood 21.3 29.8 11.2 266.6 16.3 5.3
50-63 Textiles and Clothing
30.4 83.4 20.5 407.9 26.8 22.1
64-67 Footwear 35.1 26.9 37.2 72.4 48.7 0
68-71 Stone & Glass 32.3 22.8 19.5 116.9 33.4 2,003.3
72-83 Metals 24.7 53.6 5.9 913.1 7.8 19.3
84-85 Machinery and Elect.
28.7 77.2 4.6 1,666.3 7.5 4.9
86-89 Transport Equipment
15.8 93.6 7.8 1,197.0 22.9 223.2
90-98 Miscellaneous 20.9 15.9 6.2 255.0 11.0 2.2
Derived from data provided by Sudan Customs Authority
0%
5%
10%
15%
20%
25%
30%
35%
40%
Duty Free 3% 10% 25% 40%
Share of tariff lines in tariff band Share of imports in tariff band

38
Trade Policies-Tariff Policy and the Use of Rebates 81. Sudan’s simple average tariff and trade weighted tariff rates of 20 and 22 percent respectively among the highest in the world and are substantially higher than most countries in Africa and the Middle East. Figures 19 and 20 and table 3 shows the allocation of the tariff lines between the five bands of zero, 3, 10, 25 and 40 percent based on the imports in 2012 (from the Sudan CA ASYCUDA database) and the 2008-2013 tariff summary provided by the GOS. In 2012 Just over half of all tariff lines are allocated to the top two bands of 25 and 40 percent and more than half of all imports are in these bands. In 2013 almost 37 percent of tariff lines, fall into the highest 40 percent band. According to the detailed transaction level data provided by Sudan Customs only 9.6 percent of imports enter under statutory duty free tariffs, however, the data provided by the GOS indicates the widespread use of preferences as 35.8 percent of total imports enter duty free. Statutory tariffs are generally higher on final products than on intermediate inputs, particularly in agriculture and light manufacturing which encourages production for the domestic markets. The widespread application of tariffs on imported inputs undercuts local producer competitiveness and discourages integration into regional or international supply chains. In comparison with the earlier DTIS the number of products in the highest tariff band of 40 percent has increased since 2008. Table 4 shows the value of imports according to the tariff that was actually paid (i.e. after receiving rebates). 82. In addition to tariffs on imports Sudan levies additional duties. In 2010 Sudan introduced a new border tax or Para-Tariff -the Development Tax which was introduced in January 2009 at 5 percent and is now levied at 13 percent of the duty inclusive price on all imports except for capital goods, raw materials, medicines and goods imported under the Investment Encouragement Act. Value Added Tax at 17 percent is levied on all imports except for agricultural inputs (which include fertilizers and vaccines). For a good incurring duty at 40 percent the combined effect of the import tariff and the Development Tax will raise prices by 64 percent over the CIF landed price.
83. There is also a 2 percent tax that is treated as a credit against the Business Profit tax and Excise duties are levied on a wide range of imported products. Contrary to WTO and international practices the excise duties and range of products are not aligned with the excise applicable to domestic production. The higher rate of excise duty levied on imported products is analogous to an additional Import Tariff. The discriminatory impact of the excise duties in terms of implicit tariffs is shown in Table 5.
84. The Customs Authority also levies fees and charges for import transactions. The earlier DTIS listed the wide range of fees and charges levied on import consignments in 2006 (table 3.12). Since then the CA has removed a number of the fees and has moved away from ad valorem fees which are incompatible with the GATT (1994) Article 8. The Sudan Addendum to the Memorandum of Foreign Trade Regime (April 2012) noted that all non-tariff fees and charges had been removed26 The Sea Ports Corporation charges were
26 Except for an ad valorem rate of 3 percent on perfumes and cosmetics for the Student Support
Charge.

39
now levied as a specific value, however, the Civil Aviation Charge on imports remained on an ad valorem basis. 85. The States have the right to levy fees against services on a range of items. Table 5: Sudan: Rates of Excise Duties on Imported Goods (percent)
Imported Products Subject to Excise Duty Import
Local Producer
Implicit Incremental Tariff
Refrigerators, Washing Machines, Telephone Sets, Cables, Pistols, Matches, Leather Products, Tomato Paste, Perfumes and Cosmetics, Honey and Soap
10 10
Televisions, Three Wheel Cars, Cement, Air Conditioners, Ceramic Tiles, Prepared Meat, Paints, Articles of Plastics, Fish, Dairy Products, other Animal Products, Trees, Plants, Flower Products, Skins and Straw Products
20 Paints 5, Mineral Water, 10 Cement 10
Paints 15 Mineral Water 10 Cement 10 Others 20
Juices 25 10 15
Sweets, Furniture, Live Animals and Birds, All types of meat, silk products, feather products, artificial flowers, umbrellas, sticks, mineral water
30 30
Motor Cars of a cylinder capacity less than 1000cc 75 60 15
Motor Cars of a cylinder capacity exceeding 1000cc 85 60 25
Water Pipe Tobacco 130 100 30
Cigars and Cigarettes 210 210 0
Source: Derived from Sudan: Tax Reform Strategy for Revenue Mobilization, IMF, May 2013.
Regional Trade Preferences 86. Under the GAFTA and COMESA Sudan offers duty free tariffs for all qualifying imports. For those members of COMESA that are not party to the FTA Sudan offers an 80 percent tariff preference which reduces the 3 percent tariff to 0.6 percent and the 10 percent tariff being reduced to 2 percent, the 25 percent to 5 percent and the 40 percent to 8 percent. Tariffs of 0.6 and 2 percent may be considered ‘nuisance’ tariffs (as defined by the WTO) where the revenue raised is not worth the cost of the additional time and paperwork involved in the collection. 87. Sudan has participated in the COMESA FTA since its launch in 2000. COMESA FTA members have committed to aligning their national tariffs with the COMESA Common External Tariff (CET) within five years. To date, no COMESA member is implementing the CET and Sudan is still assessing whether to implement the COMESA CET. The COMESA CET has a three band structure: zero for capital goods and raw materials, 10 percent for intermediate goods, and 25 percent for finished products. In 2008 Sudan submitted a list of sensitive products to be excluded from the CET. Currently Sudan applies no customs duties on imports from those COMESA countries that have signed the FTA protocol. 88. Sudan offers duty free access to all qualifying imports from GAFTA members. This includes imports from Egypt, Saudi Arabia and the United Arab Emirates which accounted for approximately 20 percent of total imports in 2012.
40
Export Duty 89. Sudan levies export duty on two products, raw hides and skins (15 percent) and Iron waste and scrap metal (25 percent). It also intervenes in the export of staple commodity exports, specifically sorghum. Licenses are required to export sorghum and are routinely refused in years when Sudan is deemed not to be self-sufficient. While the restrictions on sorghum are intended to advance food security they serve to discourage commercial production for export, drive down prices, encourage illegal trade, and contribute to increasing food insecurity while also exacerbating initiatives aimed at reducing poverty. 90. Exporters experience delays in reimbursement for VAT Exemptions. Delays in Exports are exempted from VAT and exporters are eligible for refunds of VAT paid on the imported inputs used in the production of the exports. Exporters complained about the length of time taken for VAT refunds. Based on interviews with the private sector it does not seem that there had been any improvement since the earlier DTIS (see 2008, para 2.34). Delays in refunding VAT paid on imports is equivalent to a tax on exports as it locks up working capital and reduces a firm’s ability to compete in global markets. Many countries have circumvented this problem by allowing companies with a clear tax record to post a bond rather than have to pay the VAT in full when the inputs are imported. Lesotho which exports clothing based largely on imported cloth allows firms to use the bond or deferred payment of VAT on their inputs. There is also evidence that delayed reimbursement encourages importers to under-invoice to assist their cash flow. More efficient reimbursement may actually result in an increase in revenue collected.
Import Restrictions, Domestic Manufacturing and Productivity
91. Import restrictions which were imposed on a wide range of products in 2011 have been removed except for a small number of items for religious reasons. Goods may only be imported (and exported) by individuals or firms that are officially registered by the Ministry of Trade.
92. Manufacturing in Sudan focuses on supplying the domestic market and except for sugar, cement and petroleum is characterized by medium and small enterprises. In aggregate the sector accounts for less than 10 percent of total GDP with most of the activities linked the agricultural sector. These include sugar, food and beverages, textiles and leather. Improving competitiveness within the agro-industrial and manufacturing sector will create both direct employment in the urban areas and stimulate of rural incomes through the increased demand for agricultural inputs. The last Comprehensive Industrial Survey in 2001 found the manufacturing sector employing approximately 160,000 which accounted for 2 percent of the labor force. Two thirds of the value added and 56 percent of the jobs were concentrated in the food products and beverages sector. The 2001 survey found that only two sectors –sugar processing and manufactured petroleum products accounted for 90 percent of export. These are both highly capital intensive activities dominated by a small number of large companies. 93. Recent work based on a firm level survey (Nour, 2011) in 2010 concludes that Sudanese firms have experienced declining productivity as a result of the inability to recruit skilled workers. The Ministry of Industry has identified six priority sectors for support through the UNIDO Industrial Modernization Programme of Sudan (IMPS) which began in July 2013. The sectors include: leather and leather goods, fisheries, agricultural

41
fertilizers, animal feed, food processing, fresh fruit and vegetables, groundnut and edible oils, cotton lint and spinning and textiles. All of these sub sectors are experiencing multiple constraints that reduce their competitiveness, including outdated equipment, poor production techniques, insufficient incentives for suppliers to provide inputs at competitive prices, and high marketing and distribution costs. Many of the sectors continue to be characterized by large scale public enterprises, however, the government has embarked on the privatization of state-owned enterprises, including two of the three tanneries with the third (Gezira) in the process of being privatized.
Trade and Poverty 94. Removing tariffs on food products has the potential to reduce poverty by 12 percent with tariffs averaging 17 percent. The impact of tariff reduction on poverty is estimated based on the assumptions that the reduction in tariffs is equal across all food products and directly translates into an equivalent price reduction of the food products. Thus, households spend less on food products. Further it is assumed that the additional savings from lower prices are spent on additional food items in proportion to the food basket used to calculate the poverty line. Therefore, consumption of households is increased exactly by the amount of savings due to lower prices. Poor households are defined as households with a new consumption below the existing poverty line. 95. Removing the tariff on food products would reduce poverty levels in Sudan. In 2009 the poverty rate in Sudan was 47 percent. Removing the average tariff of 17 percent on food products would reduce poverty to 41 percent. The poverty rate varies considerably across states from 26 percent in Khartoum to 69 percent in Northern Darfur. 96. In both Khartoum and Northern Darfur, about 6 percent of the population would be lifted out of poverty by a removal of tariffs. This translates to 300,000 in Khartoum and 100,000 in Northern Darfur. Poverty would be reduced by 21 percent in Khartoum and by only 8 percent in Northern Darfur. Thus, removal of tariffs does not target states with highest poverty but reduces poverty equally across states relative to the population.
97. Even a modest tariff reduction by 5 percent would lift half a million out of poverty. While a complete removal of tariffs might politically be difficult, a modest reduction in tariffs will also have a significant impact on poverty. A reduction of 5 percent would reduce poverty from 47 percent to 45 percent - equivalent to half a million people. A more ambitious reduction by 10 percent would lower poverty to 43 percent (1.1 million), while a further reduction to 15 percent would lower poverty to 41 percent (1.6 million). 98. Female-headed households stand to benefit more from moderate tariff reductions relative to male-headed households. Female-headed households are slightly less often impoverished with 44.2 percent living below the poverty line compared to 47 percent of male-headed household. Figure 21 B shows the Poverty rates by gender of Household Head for tariff reductions between 0 percent and 17 percent. A small tariff reduction by 5 percent would reduce poverty among female-headed households by 5.4 percent compared to 3.9 percent for male-headed households. In contrast, a complete tariff removal would reduce poverty of female-headed households by 10.9 percent compared to 12.8 percent of male-headed households. Thus, already small tariff reductions would especially benefit female-headed households.

42
Figure 21: Poverty rates per State and by gender of Household Head for reduction in tariffs from 0 percent to 17 percent
A) Poverty rates per State B) Poverty rates by gender of Household Head
Source: Authors’ calculations based on NBHS 2009 data.
Source: Authors’ calculations based on NBHS 2009 data.
Recommendations 99. Reducing trade taxes and tariffs is required to increase and diversify exports. Existing tariff and trade taxation policies results in an incentive structure that discourages exports and encourages production for a heavily protected domestic market. This results in higher prices for all products including basic commodities and foodstuffs which reduces living standards and has a disproportionate impact on the poor. 100. Reducing the dependence on trade taxation when Sudan faces severe revenue challenges and a large budget deficit requires coordination with broader tax reform. Reducing tariffs and trade taxation may result in increased revenue when the import elasticity of demand exceeds unity. Reducing the number of tariff peaks (tariffs lines above 15 percent) and lowering the maximum tariff to 25 percent in conformity with the agreed maximum for the proposed COMESA CET should be a priority. 101. Reducing the use of duty rebates and exemptions to create a more transparent structure can result in additional revenue while also reducing anti-export bias. Currently many investments focused on production for the domestic market qualify for rebates. Under the new Investment legislation all approved projects qualify for duty rebates on the importation of capital goods. Reducing the tariff on all capital goods to zero would improve the incentives for all investors and have a minimal impact on revenue. The large disparity between the listed (ex ante) tariffs and the actual duties collected (ex post) by sector indicates the widespread use of rebates and exemptions in animal and vegetable products and foodstuffs. The reduction of tariffs on these products would have a minimal impact on revenue.
102. Excise taxation should not discriminate against imports and should be imposed on a limited range of products. The rationale for levying excise taxes is to discourage consumption. Excises are usually restricted to a small number of goods with a low elasticity of demand that carry health externalities (for example, tobacco and cigarettes). Excise duties applied to imports will need to be aligned with domestic excise duties Sudan to conform to the requirements of the WTO.

43
Chapter 4: Customs Administration and Border Management Overview and Key Issues 103. The Sudan Customs Authority (CA) has implemented a number of reforms aimed at improving the environment for traders over the past 6 years. This study reviewed27 the current customs situation in the country and the reform program of the CA with an aim of identifying a range of areas were Sudan Customs could take immediate further action to reduce trade costs. The study consider it is important that these areas are addressed in a coordinated fashion through a comprehensive customs modernization program as lessons from other countries suggest that isolated initiatives are unlikely to succeed. 104. Currently, customs control is based on the somewhat outdated standard concept of near 100 percent, real time, physical interventions, with parallel documentary (paper based) processing and an accompanying automated ASYCUDA process. The majority of international trade is processed through Port Sudan. There are in excess of 26 proclaimed entry points (22 of which are connected to ASYCUDA and these account for more than 95 percent of trade) including Khartoum Airport, numerous land border crossing and two river ports. Not all entry points were operational at the time of the mission. Table 6 highlights the relative revenue collection performance. Table 6: Revenue Collection Performance by Sudan, Kenya, Saudi, Jordan and Yemen Customs Administrations, 2012
Country No. of staff
No. of declarations
Tot. Revenue in local currency
Revenue US$
million
Declarations per staff
$ collected per staff
$ collected per
declaration
Sudan 7,818 307,653 7,086,000,000 1,221.7 39 156,270 3,971
Kenya 1456 667,417 707,400,000,000 8,300 4250 5,700,549 12,436
Saudi Arabia
10,154 3,300,000 20,200,000,000 5,386 325 530,431 1,632
Jordan 3,185 1,033,604 288,160,000 407.6 325 127,975 394
Yemen 2,279 263,753 84,835,000,000 395 116 173,322 1,498
Source: WCO Annual Report 2012-2013; Kenya, KSA, Jordan and Yemen Customs Annual Reports 2012; Sudan Customs Administration and World Bank staff calculations.
105. Key indicators continue to show limited capacity to facilitate trade across all the border agencies. For instance, Sudan ranked 155th out of 183 countries in the “trading across borders” category of the Doing Business Report 2013. There is a wide difference between exports and imports: Time to export is 32 days for Sudan, similar to the
27 For this part, the DTIS Update undertook a ‘diagnostic assessment’ which involved interviews and
discussions with relevant government officials and private sector clients and stakeholders. This included the observation of operational practices and procedures and a review of available reports, documents prepared by the government and border agencies and other relevant literature, including recent assessments conducted by other international agencies such as the WCO and UNCTAD. The main mission in January 2014 undertook these activities in Khartoum, Port Sudan, Garri Free Trade Zone and Soba Dry Port.
44
SSA average, but time to import is 21 percent longer in Sudan than in the SSA average (46 vs 38 days). Long transaction times (and cost) are mirrored in the low ranking of Sudan in the Logistics Performance Index (LPI) of 2012 where Sudan continues to rank 148th out of 155 countries. Within the six LPI categories of Customs, Infrastructure, International shipments, Logistics competence, Tracking & tracing, and Timeliness, Sudan ranks below the SSA average in all categories (on a scale 1 to 5 best). 106. The CA shares border management responsibilities with many other national agencies but currently there is limited inter agency coordination. Multiple agencies are present at the main border entry points and while at Port Sudan a ‘one stop shop’ approach has been implemented with the co-locating of some agencies there has been limited streamlining of procedures and duplicative and repetitive checks continue. There is still no ‘single window’ in any border entry point and coordination cannot be relied upon. The process for obtaining all the necessary import and export approvals can be long and time consuming, especially if laboratory testing by the SSMO is required.28 In consultation with the Ministry of Finance and all responsible line Ministries the GCA should conduct a review of the existing administrative arrangements with the aim of improving performance standards, including revenue targets, of the GCA and minimizing potentially conflicting responsibilities. These should be translated into clear performance indicators. 107. A commitment by the Sudan Customs Authority (CA) to increasing consistency and coordination, transparency, efficiency and simplifying procedures would be essential to reducing trade costs. While the CA currently delivers a basic level of services to traders and is committed to further customs modernization its performance continues to falls short of client expectations. Interviews with private sector traders and customs officials identified many aspects of customs administration where administrative and procedural reforms had the potential to significantly reduce clearance times while maintaining customs integrity and protecting the revenue base. 108. The findings and recommendations contained in this study could be used as the basis for developing a comprehensive customs modernization and reform strategy. Achieving improved levels of efficiency, effectiveness and professionalism will require a significant investment of time, resources and government commitment. While the DTIS Update identifies a number of recommendations for immediate action, effective implementation of the key recommendations will approximately 3-5 years. The DTIS recommends that the small (4-6 member), dedicated team already established within the CA in accordance with the recommendations of the WCO mission for Columbus Program Phase 2 to manage the modernization process. This team should report directly to and be authorized by the Director General. It is also recommended that an inter-departmental committee be established to coordinate activities that require actions by other border management or permit issuing agencies.29 Overall responsibility for coordination of border management reform will need to be decided at Ministerial level.
28 These issues are covered in more detail under Standards and Conformity section of the DTIS.
29 This could be incorporated into the existing Technical Committee on Trade Facilitation and
Electronic Business (Ministerial committee based in the Council of Ministers) and the National Working Group on Trade Facilitation and Electronic Business (Chaired by the Customs Authority and based in the Ministry of Trade).

45
The Sudan Customs Authority 109. Organizationally the CA is part of the police force. While it is becoming more common for customs services to be under the administration of the Ministry of Interior, or similar as part of a ‘Homeland Security’ type of border control framework, dual responsibility and oversight is less common. For day-to-day administrative and operational issues the GCA reports to the Ministry of Finance. However in relation to organizational management and staffing matters it is part of the Ministry of Interior, forming part of the Sudanese Police, with a Police Major General as Director General. Under this paramilitary organizational structure there is a strict hierarchical framework with promotion based on seniority, rather than merit and limited flexibility in human resource management issues. Key organizational statistics are shown below in Table 7. 110. The GCA is a member of the World Customs Organization (WCO), ratified the WCO Revised Kyoto Convention (RKC) without reservation in 2009 and is a contracting party to the Harmonized System Convention (the H.S.). Despite this few of the provisions contained in the convention have been implemented, although many are subject of actions listed in the strategic plan. Implementation of the provisions of the convention (and as a consequence, much of the recently concluded WTO Trade Facilitation Agreement) should become the organization’s first priority. Table 7: Sudan Customs Statistics
111. At an institutional level, the CA has a five-year strategic plan covering the period of 2012 to 2016. However, while there are vision, mission and values statements in the strategy they are not clearly linked to the strategy. It is also unclear how implementation will be achieved, performance tracked and progress measured against this plan, or how it will become ‘actionable’.30 The plan is rather limited in scope and appears to be more a statement of ambitions, without clear purpose, rather than a formal strategic management
30 The WCO notes, in its report following the January 2013 ‘Columbus Phase II’ mission it was unable
to improve on the strategic plan (as planned) as it had been adopted before the mission.
1. Director General: Police Major General Sefeddean Omer
2. Number of Staff (2012) 7818 o Officers 2162 o Non-commissioned 5656
3. Average weighted tariff (2012) 20.1% (0%, 3%, 10%, 25% and 40%)
4. Revenue (FY 2010) 7086 M SDG (71% of Govt. tax revenue) o Customs Duties 3567 o VAT on imports 1950 o Excise (domestic) 1339
o Misc. fees / charges 230
5.

46
tool. Without this or any specific policy direction, the organization appears to be more reactive to policy demands from other agencies. Clarification of the expectations or desired outcomes by the Ministry of Finance, in the form of administrative arrangement orders or similar, would allow the CA to develop a more strategic approach to its operations, against which it could undertake continuous monitoring and evaluation of performance by establishing appropriate performance indicators. To this end, formal adoption of the plan by appropriate Ministries should be pursued. 112. The CA strategic planning process requires strengthening. The current CA Strategic Plan (2012-2016) is rather limited in scope and appears more a statement of ambitions, rather than a formal strategic management tool. It is also less clear how achieved performance is being tracked and progress measured against this plan. In order to address these shortcomings the CA Strategic Plan should be revised and updated in consultation with all key internal and external stakeholders with the aim of using it as a basis for the development, agreement and implementation of a comprehensive and future oriented organizational reform strategy. The revised plan should be endorsed by relevant Ministries. 113. This analysis found that the CA is currently functioning and delivering a basic level of services to its stakeholders and clients and has good leadership and management skills. Yet, when compared with performance in the region and international best practice most aspects of customs administration require reform and development. Senior management has a good knowledge of contemporary organizational development skills and abilities however there appears to be capacity constraints below this level and more senior and middle managers need to be equipped with improved leadership and strategic management skills. These capacity challenges result in restricted or at least unclear Delegation of Authority and encourage overly centralized decision making in day-to-day operations which constrains senior management’s ability to focus on more strategic issues or on planning and organizational performance. 114. The stated priorities and objectives of the CA to a modern customs administration require restructuring the existing organizational structure to align more closely with international best practices. There is significant opportunity to better align the organizational structure to make role and function clearer and align with established international practice. Due to unclear organization structure, with a mixture of overlapping geographical and functional accountabilities, decisions are centralized, including those regarding Customs operations. Given the inadequate level of organizational funding available, getting this resource balance correct is crucial. The need to institutionalize contemporary ‘value adding’ functional capacity such as risk-management, audit and intelligence in the organizational structure, also makes this a priority area for reform. Figure 22 below illustrates a model of the contemporary risk-managed regulatory compliance framework.
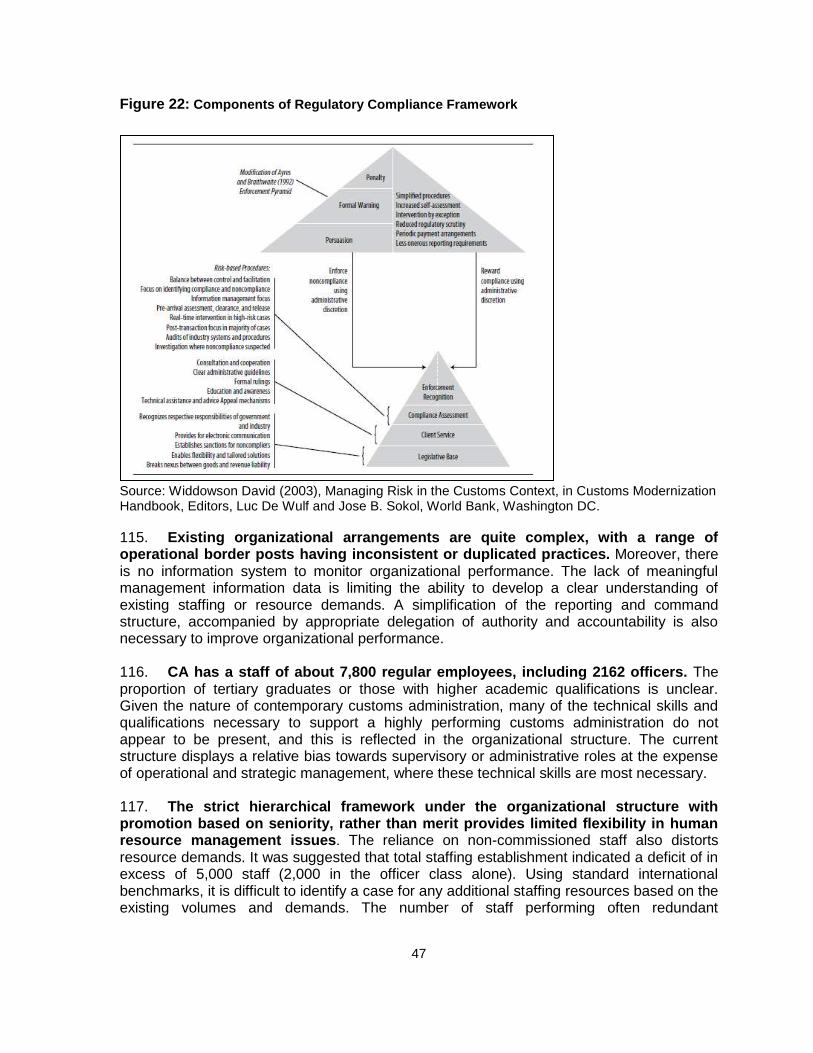
47
Figure 22: Components of Regulatory Compliance Framework
Source: Widdowson David (2003), Managing Risk in the Customs Context, in Customs Modernization Handbook, Editors, Luc De Wulf and Jose B. Sokol, World Bank, Washington DC.
115. Existing organizational arrangements are quite complex, with a range of operational border posts having inconsistent or duplicated practices. Moreover, there is no information system to monitor organizational performance. The lack of meaningful management information data is limiting the ability to develop a clear understanding of existing staffing or resource demands. A simplification of the reporting and command structure, accompanied by appropriate delegation of authority and accountability is also necessary to improve organizational performance. 116. CA has a staff of about 7,800 regular employees, including 2162 officers. The proportion of tertiary graduates or those with higher academic qualifications is unclear. Given the nature of contemporary customs administration, many of the technical skills and qualifications necessary to support a highly performing customs administration do not appear to be present, and this is reflected in the organizational structure. The current structure displays a relative bias towards supervisory or administrative roles at the expense of operational and strategic management, where these technical skills are most necessary. 117. The strict hierarchical framework under the organizational structure with promotion based on seniority, rather than merit provides limited flexibility in human resource management issues. The reliance on non-commissioned staff also distorts resource demands. It was suggested that total staffing establishment indicated a deficit of in excess of 5,000 staff (2,000 in the officer class alone). Using standard international benchmarks, it is difficult to identify a case for any additional staffing resources based on the existing volumes and demands. The number of staff performing often redundant

48
documentary checking and virtually 100 percent physical examinations without demonstrable results highlight this imbalance. 118. There are a number of other fundamental issues in the area of human resource management. The most significant include: the necessity of updating the existing ethics and integrity programs to include transparency issues; inadequate performance management practices; no appropriate mobility or staff rotation policy (particularly in sensitive areas); undocumented job descriptions and duty statements; weakly defined or inappropriate criteria for employment or promotion; and insufficient focus on professional/technical development 119. There are indications that important technical infrastructure and resources (e.g. scanners) are not being used to their full potential because of on-going support and maintenance issues linked to the US sanctions imposed on the country. The investment in such technical infrastructure needs to be accompanied by on-going support and maintenance contracts. It was not clear if the cause of the existing problems was a lack of funding or poor contract management ability (or both), but regardless of the reason, using these resources to their full potential is essential to achieving higher levels of organizational performance. It was noted that user services charges are levied to cover the full cost of services provided however this may also be contributing to inappropriate servicing policies and not being used to support operations. 120. Recent amendments to customs legislation are not sufficient for implementing WTO compatible procedures. While the creation of enabling legislation, in itself, does not guarantee the implementation of new policies and procedures, without it no change is possible. The issues regarding the adoption of GATT (1994) Article 7 are a clear demonstration of this problem. In this regard and based on responses to questions obtained during the study, the Sudan Custom Act will need significant amendment to allow for the adoption of contemporary practices and procedures. This view is supported by the findings of the WTO TFA ‘National Implementation Plan’ assessment (conducted by UNCTAD in March 2013) which identifies that for 11 of the 14 measures not implemented (where responsibility for implementation fall primarily to customs), implementation will require the adoption of new or amendment of existing primary or subordinate legislation.
Customs Systems and Procedures 121. The administrations’ processes and procedures are characterized by a number of rather ineffective operational activities. A lack of clearly defined and publicized set of processes and excessive human intervention in transaction processing results in reduced transparency. Findings in relation to some key elements of customs procedures are detailed below. Risk-based Compliance 122. The CA is trying to give effect to its border control responsibilities in the role of a traditional ‘gatekeeper’, a strategy that it is neither well equipped to implement nor is it seen as being capable of achieving expected outcomes. The existing control environment is based on a 100 percent real time documentary and physical intervention in all transactions. While there is a physical interaction with each transaction, the level of goods examination will vary based on personal knowledge of the inspector. Given that there are few, if any, examples internationally where a 100 percent inspection policy translates to

49
100 percent ‘inspection’ (consignment verification or validation) in an operational sense, it appears unlikely such practices result in the identification of many serious attempts at concealment, revenue evasion or detection of prohibited goods. The only certain outcome is a lack of facilitation. It should be noted that some of these practices appear to be as a direct result of requirements to comply with government policy and do not necessarily reflect poorly on the strategic management of Customs or other border agencies. 123. The CA acknowledges that in adopting virtually 100 percent physical inspection it is not intervening in a systematic way. Even with a total inspection regime, there has to be some selectivity in the level of examination. Any examination of cargo, for national security objectives, that is not driven by intelligence (targeted), must involve a full search of all packages which may take many hours to complete. 31 Other border management agencies also need to be more pro-active in defining customs role and tasking it more specifically. The need to adopt risk-based compliance strategies is especially relevant in the area of standards and conformance (SSMO). 124. The inexistence of a functioning risk management policy represents one of the key challenges for the Sudanese custom system. Internationally there is little evidence to demonstrate that meaningful border management reforms can be achieved without such a risk-based compliance management approach. In this instance it is also clear that in addition to improving levels of trade facilitation, adopting advanced risk management strategies would help improve border security outcomes by directing resources to interventions in high risk transactions. Previous studies by the World Bank have demonstrated that a lower rate of inspection, as part of a risk-based targeting strategy can actually result in increased detections by being more effective. This position is based on a basic assessment of the performance metrics associated with cargo examinations. These demonstrate that based on the current notional policy of 100 percent physical examination, the volume of transactions and the number of examiners, it is simply not possible in the time available to conduct a thorough examination.32 125. Addressing the lack of an effective risk management policy requires fundamental changes to operational activities. ‘Risk-management’ is not a concept that can simply be inserted into the clearance process. It requires a range of supporting operational activities and skills (profiling, analysis, audit, etc.) that fundamentally change the compliance framework. A possible framework is depicted in Figure 23. Access to better quality data, earlier in the transaction process is also essential. All of this would be a significant undertaking in the context of border management in Sudan. The Customs Administration recognizes the importance of establishing an effective risk management policy and had participated in discussions with potential international donors, including the World Bank, with the aim of finalizing a technical assistance project.
31 In a 100% examination environment, customs cannot afford to be shown to have ‘inspected’ a
consignment that is later found to have contained prohibited or restricted goods. 32
While conducting a thorough examination is still a widely adopted practice, it has become less common in more advanced administrations. Risk management has also been shown to lead to increased inspection effectiveness and detection rates.

50
One of two scanners, Port Sudan. (NucTech, 6Mev,
double-tunnel).
Figure 23: Risk Management Process Framework
Source: Risk-Based Compliance Management, World Bank 2012.
Inspection and Cargo Control
126. The non-strategic use of non-intrusive inspection (NII) resources and the physical inspection environment is a concern. The existing non-intrusive (scanning) inspection equipment is not utilized to its full potential and/or is not being used effectively. While there are a number of units in existence and the CA would like more to cope with peak demand. The problem with this proposition is that due to the immense cost of such equipment it needs be used close to full operational capacity before a case for additional resources can be made. This is currently not the case. Business process and practices (both by customs and the private sector) create significant peak demand periods, while at
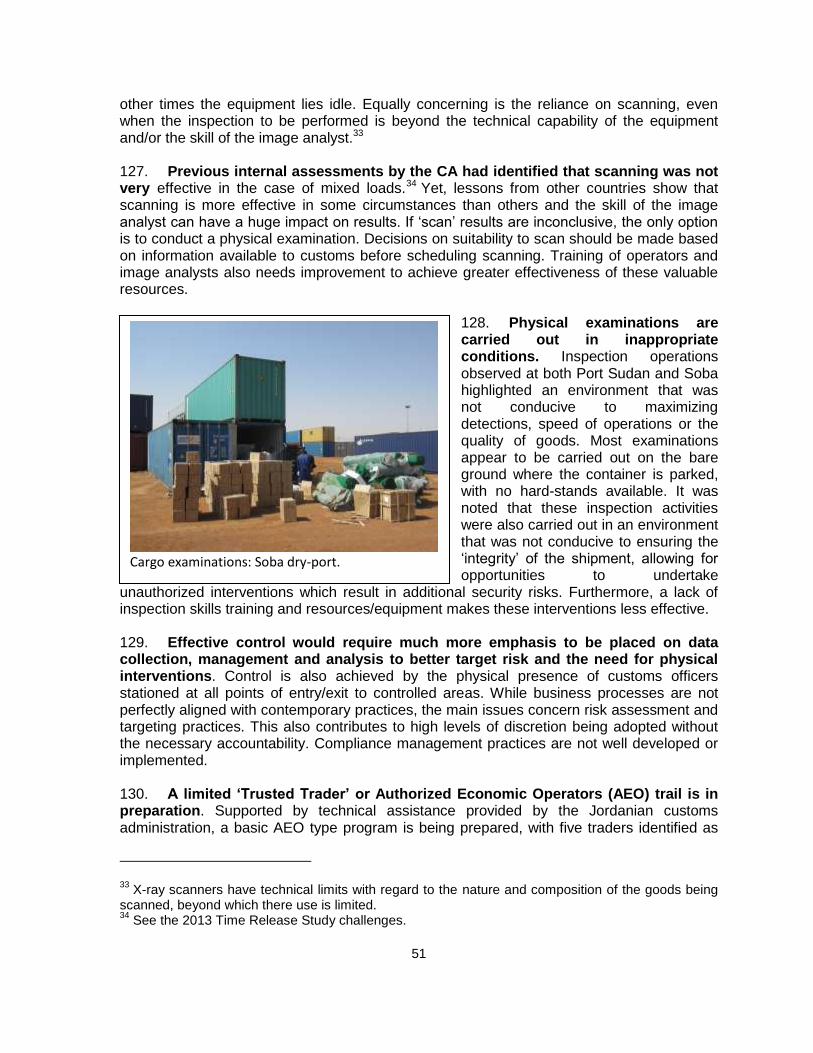
51
Cargo examinations: Soba dry-port.
other times the equipment lies idle. Equally concerning is the reliance on scanning, even when the inspection to be performed is beyond the technical capability of the equipment and/or the skill of the image analyst.33 127. Previous internal assessments by the CA had identified that scanning was not very effective in the case of mixed loads.34 Yet, lessons from other countries show that scanning is more effective in some circumstances than others and the skill of the image analyst can have a huge impact on results. If ‘scan’ results are inconclusive, the only option is to conduct a physical examination. Decisions on suitability to scan should be made based on information available to customs before scheduling scanning. Training of operators and image analysts also needs improvement to achieve greater effectiveness of these valuable resources.
128. Physical examinations are carried out in inappropriate conditions. Inspection operations observed at both Port Sudan and Soba highlighted an environment that was not conducive to maximizing detections, speed of operations or the quality of goods. Most examinations appear to be carried out on the bare ground where the container is parked, with no hard-stands available. It was noted that these inspection activities were also carried out in an environment that was not conducive to ensuring the ‘integrity’ of the shipment, allowing for opportunities to undertake
unauthorized interventions which result in additional security risks. Furthermore, a lack of inspection skills training and resources/equipment makes these interventions less effective. 129. Effective control would require much more emphasis to be placed on data collection, management and analysis to better target risk and the need for physical interventions. Control is also achieved by the physical presence of customs officers stationed at all points of entry/exit to controlled areas. While business processes are not perfectly aligned with contemporary practices, the main issues concern risk assessment and targeting practices. This also contributes to high levels of discretion being adopted without the necessary accountability. Compliance management practices are not well developed or implemented. 130. A limited ‘Trusted Trader’ or Authorized Economic Operators (AEO) trail is in preparation. Supported by technical assistance provided by the Jordanian customs administration, a basic AEO type program is being prepared, with five traders identified as
33 X-ray scanners have technical limits with regard to the nature and composition of the goods being
scanned, beyond which there use is limited. 34
See the 2013 Time Release Study challenges.
52
participants. However, there is no supporting criteria for determining eligibility or identify of potential benefits offered to participants.
131. Some progress has been made in relation to automated payments. There is one bank (Faisal Islamic Bank) now capable of making direct payments from customers’ accounts to customs as part of a trail. To date some 200 importers (or their agents) have utilized this facility, but delays persist, particularly with the transfer of funds from importer to the agents account to enable payment. Further work is needed to promote and encourage this business process. 132. There is currently no post-clearance audit capability. There appears to be a lack of awareness of how this function enables the application of risk-based compliance management. As such a complete audit strategy, linked to risk identification and any compliance management strategy is yet to be developed. 133. The management of Rebates, remissions and exemptions were criticized by traders who cited delays in refunds and onerous administrative procedures. While many of these complaints were more related to ‘industry policy’ issues (what should be exempt), there were legitimate issues surrounding the interpretation of policy (inconsistency) and the nature of administrative practices. Timeliness of payments seemed to be the biggest concern and agreed performance levels may assist in this area as much as in many other areas of customs operations. The earlier DTIS noted delays of four months in receiving rebates. Interviews with the private sector identified that this remained a serious problem. Several private sector representatives indicated that the administrative burden and the lengthy delays in receiving the rebate eliminated any benefits.
Customs Agents and the Licensing of Brokers 134. The use of a customs broker is mandatory and licenses are a valuable commodity. The broking community is well organized and most appeared well versed in customs law. While a broker may technically sub-contract or lease out his license, the licensee remains responsible for all work product. Traders are not permitted to use an in-house broker, but some may retain the full time services of a licensed broker. There is no concept of a corporate license, but some brokers operate as a joint commercial entity. Individual licenses are also restricted to individual physical locations (for example, Port Sudan or Soba dry port), so clearance of an individual transaction may require the services of more than one broker. In such cases brokers form either formal or ad hoc partnerships and agree on commercial terms, so as clients only deal with a single entity. Fees appear generally agreed. 135. The rules for obtaining a customs broker license are freely available and transparent. The significant majority (>90 percent) of brokers are former (retired) customs staff (and some from the police/military) and obtaining a license seems to form part of what is best described as custom officials retirement packages. There are other brokers who have qualified through years of relevant work experience and examination. Brokers were eager to receive additional training and capacity building, but were obviously somewhat hesitant to agree to the ending of their monopoly. 136. For customs valuation, reference values continue to be used as the predominant method of determining customs value. Despite a commitment to apply the

53
provisions of Article 7 of the GATT (1994) (WTO Valuation Agreement) and the introduction of legislation to achieve this, ‘transaction values’ are for the most part ignored. Notionally, the Brussels Definition of Value (BDV) is applied. Current legislative provisions are for the most part consistent with the requirements of Article 7 with one significant exception. Appended to the legislation, which appears for the most part to be a direct transcription of the relevant provisions of Article 7, is a four year phasing-in provision that allows transaction pricing to be ignored where it may have ‘an adverse effect on the national economy’. 137. Reference values35 are used for every transaction where duty/tax is collected. The concept of ‘adverse effect’ appears to be interpreted as needing to collect as much revenue as possible as if actual transaction values could be determined, the amount collected would be the amount owed (the correct legally payable amount) and there would be no ‘adverse’ effect as such. So in practice, the provision is applied to ensure the revenue collected is greater than that would be payable under Article 7. While the same outcome could be achieved in a more transparent fashion by simply increasing duty rates, the current practice encourages and supports inappropriate practices and adds costs and time to clearances. 138. According to customs managers, the need to use of reference values is due to excessive use of fraudulent values on invoices provided by importers, especially from certain countries. This practice cannot be disputed. However, the existing policy of using reference prices does not encourage traders to comply with customs regulations. There is a perception that to be competitive, some traders may try and manipulate the system (by under valuation). 139. Sudan began the transition from ASYCUDA ++ to ASYCUDA World in October 2011 and it is now operational at almost all entry points. Direct Trader Input (DTI) can now be entered remotely and funds can be transferred electronically. A trail of pre-arrival manifest submission has been conducted on some air freight shipment. The Customs Administration is now preparing to upgrade ASYCUDA World to ensure its compatibility with the proposed National Single Window (NSW). The CA stated that the movement to ASYCUDA World has improved cooperation between agencies and reaffirmed their commitment to introducing a Single Window. Preliminary discussions with potential NSW providers have taken place, but no work on specific business requirements has taken place. 140. Duplication of the electronic process with paper does not allow the full benefits of automation to be realized. Hard copy documentation is still being used in parallel to the automated processes. Manual checking of transaction data against prime documents is time consuming, unnecessary and results in procedures that are excessively complex and slow. Most of these activities could be performed ‘post’ transaction and achieve the same result. Manual checking also leads to an excessively high ‘query’ rates by customs, resulting in high volumes of transactions requiring physical interaction with officials at this initial screening point, increasing delays.
35 It is not clear how these reference values are determined, but no evidence of any objective
methodology or commercially supplied databases or subscriptions services were observed.

54
141. Maximizing ASYCUDA’s selectivity and targeting capacity (risk management module) is seen as a key modernization enabler. The ASYCUDA World system is capable of delivering most of the organization’s needs, currently its capacity is not being fully utilized, especially in relation to the risk management module.36 It could be used as leverage to facilitate many of the other reforms necessary. A robust customs I.T. system with appropriate functionality is crucial to the effective operations of any contemporary customs administration. It is therefore important to address issues that prevent the full implementation of automated processing of cross-border transactions. A full transition to the ASYCUDA World platform (adopting full modular systems functionality) could help address many of the current deficiencies.
Transparency, Information and Communication Mechanisms
142. There is significant scope to improve transparency and communication mechanisms. Most border management agencies have websites, but not all relevant information is made publically available. GCA does make some relevant rules and regulation available and there is a Gazette notification system in place. Sudan Trade Point was established in 2001, but its full potential has not been realized. Establishing the appropriate regulatory framework could help turn trade point into a ‘Trade Information Portal’ which would facilitate the development of the NSW by ensuring better agency coordination. 143. Establishing a more accessible, informal (but binding) appeals and rulings mechanism would help encourage greater compliance with custom procedures. A greater focus on education and communication would assist in improving transparency and accountability. The existing systems of appeals through the courts are not well utilized. 144. Given the current requirements for clearance approvals by multiple agencies, any attempt improve levels of trade facilitation must also focus on an ‘Integrated Border Management’ approach. As indicated earlier in this report, the Customs Authority shares border responsibilities with other national agencies, including SSMO, Ministry of Agriculture & Irrigation, Ministry of Livestock & Fisheries, Ministry of Health, Ministry of Information and Communications, and the Ministry of Interior. Coordination among these agencies is limited with too many independent interventions taking place, in many cases on a transaction-by-transaction basis, which can take many days to be completed. Too often the relevant agency is not physically present at the point of importation, and obtaining their approval can be a time consuming task, particularly where laboratory testing may be required. Relationships between the CA and other border management agencies need to be strengthened and used more effectively to coordinate an improved border management approach. The engagement and agreement of all agencies involved in regulatory control of cross-border shipments, whether responsibility for enforcement is delegated to Customs or not, has to be achieved to ensure reforms are imbedded, institutionalized and are sustainable. 145. Communication between the CA and its clients is currently insufficient. There is currently limited communication between the CA and the users, a situation which prevents the CA from adequately addressing users’ issues and concerns. Clients complain about the
36 Adoption of the ASYCUDA ‘Transit’ module is also yet to take place.

55
lack of public information on obligations, rights and how to interact with the CA, and they claim that the CA does not meet clients’ expectations in relation to trade facilitation, specifically with regards to consistency, efficiency and transparency. A greater focus on education and communication would assist in bridging this gap. 146. There is a long history of collaboration and cooperation with international institutions (particularly the WCO) and regional administrations. Yet, it remains unclear what the benefits of these are currently are. A more strategic approach (in relation to the provision of technical assistance) to the management of these relationships would help deliver more meaningful and sustainable outcomes.
Recommendations 147. Continuing to modernize and reform the CA will contribute to reducing trade costs. Further reforms are required for the CA to effectively comply with the provisions of Article 7 of the GATT (1994) on Customs Valuation. Re-engineering CA business processes and procedures are required to implement the WCO TKC and the recently concluded WTO Agreement on Trade Facilitation. 148. Developing a Trade Information Portal would provide a single point of access for all trade related regulations, forms and procedures required for importing and exporting. A Trade Information Portal will promote inter-agency cooperation between all the agencies involved at the border, transparency and due process, and act as preparation for the commitment to implement a National Single Window.
149. Revise the licensing requirements for clearing agents to promote increased efficiency. The criteria for customs clearing agents require updating to focus on the demonstration of professional skills and integrity. Corporate entities should also be eligible to apply for a customs clearing license and importers should have the right to self-clear.

56
Chapter 5: Transport, Transit and Logistics Services Overview 150. Sudan has a relatively low density of transport infrastructure when comparing with other countries in Africa. The transport system in Sudan comprises all the main modes: road, rail, air, maritime, and inland waterway. The country has one major trade gateway, Port Sudan on the Red Sea while road transport is the dominant mode of inland transport. This chapter presents a diagnostic of the state and performance of the country’s transport and logistics system. It focusses on three main categories of issues: infrastructure, regulation and services and three main attributes of system performance, cost, time and reliability. 151. Chapter outline. It starts with a comparative assessment of Sudan’s logistics performance based on the Logistics Performance Index (LPI). This is followed by an evaluation of the performance of the main transport corridor that accounts for more than 90 percent of the international trade traffic, and then presents the main emerging and unresolved issues relating to each of the core components of the logistics system: road, rail inland water, air transport and the quality of logistics services offered by the private sector. The chapter concludes with recommendations for improving the costs and efficiency of logistics services. 152. Overall logistics performance in Sudan is low and even has deteriorated over the last five years (World Bank, 2014). All components of logistics services rank lower in 2014 than they did back in 2007 (Figure 24). However, in theme specific rankings of the LPI the country’s logistics systems have made some improvements since 2010, especially related to infrastructure and customs. The same is not the case though for services typically provided by the private sector, reflected in the LPI scores on timeliness and tracking and tracing of shipments. The scores for both of these dimensions have declined over the past seven years. One possible explanation for the continued decline in timeliness and tracking of shipments is linked to the weak and archaic regulatory framework for logistics services. These weaknesses were identified in the original DTIS in which several actions for reform were proposed. 153. Sudan has made some progress in implementing the logistics related actions identified in the 2008 DTIS. Some of the actions that were implemented either fully or in part include: the development of a dry port at Garri, which is now one of the two major dry ports in the country, the involvement of a foreign operator in Port Sudan and regulatory reforms to allow firms to provide clearing services. These interventions should contribute to an improved logistics performance. Still, reforms in port operations at Garri have only started recently while firms are yet to be registered to provide clearing services. Also among significant developments was the establishment of a one stop shop in Port Sudan and also in Soba Dry Port, where the various government agencies involved in border management are co-located.

57
Figure 24: Sudan Logistics Performance, 2007-2014
Source: Logistics Performance Index, 2014
Transport and Logistics Strategy 154. Historically, the transport system in Sudan was characterized by effective integration of the different modes in operation - ports, railways and inland water transport – but modes are disintegrated nowadays. Since 1977 the level of integration has declined and each mode has evolved separately. Nowadays, road transport dominates the transport scenes, while the other modes have declined in importance and now only have niches in the market. Over the past three decades the deterioration in modal coordination within the Sudanese transport system has resulted in services becoming fragmented with some key nodes such as dry ports emerging more for regulatory controls rather than for mode interfaces at a minimum and value addition as logistics platforms when well planned. Only Garri seems to be playing the latter role. There is considerable opportunity for enhancing the inter-modal optimization of investments 155. The Transport Master Plan, jointly developed between the Ministry of Finance and National Economy and the Ministry of Transport, Road, and Bridges, addresses the challenge of integrating the different modes. In several low and middle income countries the provision of infrastructure is rationalized across various modes and services, so as to provide an integrated system able to serve different market requirements. Current and emerging supply chain needs often form the basis for well-defined logistics strategies. A logistics strategy would seek to address apparent bottlenecks in the system and would include trade-related infrastructure, services and regulations. This is a multi-modal approach involving both the public and private sectors. 156. Sudan needs to develop a comprehensive logistics strategy. The need for large investments in Sudan’s transport and logistics system, in inland ports, railways, roads and services presents an opportunity for a coherent, comprehensive logistics strategy. Poor coordination between modes and services increases costs and jeopardizes reliability. Yet there is great potential for seamless services. The bonded areas with customs facilities and rail access established by the large oil companies are a good example of what can be achieved. There, logistics service providers are able to offer services by railway from the port to the bonded facility, using through bills of lading. Systems put in place for such
0
1
2
3
4LPI Score
Customs
Infrastructure
Internationalshipments
Logisticscompetence
Tracking & tracing
Timeliness
2007
2010
2012
2014

58
facilities can serve as a blueprint for the wider market, just as other systems for expedited clearance that have been designed for humanitarian traffic. 157. Some of the building blocks for an integrated logistics system are already in place. The main plank is the National Transport Master Plan. However, the infrastructure investments it defines need to be complemented with intermodal services to increase efficiency. There are a number of ports, including dry ports, free zones, railway stations, and highways, but only a limited supply of intermodal services exists. For example, although the private sector expects the railways to be a preferred mode, weak intermodal logistics service does not allow the railways to compete with transport by truck. Large firms such as ones in the oil industry may be able to invest in building own facilities to secure their supply chain, but most of the business in Sudan do not afford to invest in costly transport and logistics infrastructure out of their pocket. As Sudan aims to diversify its economy, the support for intermodal transport services, particularly in connecting existing transport modes, becomes imperative to bring products to markets. 158. Infrastructure investments in Sudan’s transport system need to be complemented with policy and regulatory interventions to better integrate logistics services. Currently, each of the government agencies responsible for different modes of transport has their own investment plan. Such plans can be better coordinated with an emphasis on inter-modal interfaces. Importantly, this coordination is much more about institutional arrangements for co-production of plans as it is about the actual investments.37 Fortunately, Sudan has in place multi-stakeholder groups working on logistics related initiatives, which could be expanded and given a wider mandate. Two of the most relevant groups are a committee working on the introduction of a national single window system and a technical committee in the Ministry of Trade which focusses on transport investments.
Transport Corridors 159. In 2012 Port Sudan handled some 5.8 million tonnes of imports, most of which were destined for Sudan. More than 90 percent of Sudan’s international trade traffic passes through Port Sudan. In view of the importance of Port Sudan as a gateway to the region and the world a more detailed review in contained in Appendix 3. Data from Sudan Ports Corporation show that traffic volumes through Port Sudan were growing strongly up until 2009/10 and then fell significantly in 2011. Volume rose from 4.7m tonnes in 2008 to 5.4m tonnes in 2009 (+16 percent) but then fell by more than a quarter to 4m tonnes in 2011, explained to a large extent by the separation of South Sudan. However, since then traffic volume have started recovering, albeit slowly. 160. More than 90 percent of the landed volume moves inland, mostly to Khartoum and a few centers to the south and west. The majority of the traffic is transported by road transport, while a smaller quantity is transported by rail. Figure 25 shows the modal split of import traffic as it moves between the port and the major economic centers and clearance points in Sudan, and Table 8 shows the comparative costs per ton kilometer and transit times.
37 For instance a logistics strategy would be best placed to advise on how to respond to the request of
the road transport union to reduce corporate tax from current 15 % to 10 %.

59
Figure 25: Distribution of Traffic: Port Sudan and Khartoum (2013)
Table 8: Comparative Costs of Different Modes of Transport
Mode Distance (kilometers)
Transit time (hours)
Price (SDG/tonne/km)
Road - Khartoum to Kosti 314 4 0.166
IWT: Kosti to Juba 1,486 0.559
Rail: Port Sudan – Khartoum 787 60 0.059
Source: Author’s own compilation, based on local data obtained in January 2014.
161. The mode split of traffic over the inland transport system is determined by cost and the quality of service of each mode. Road transport is by far the dominant mode, even though direct costs from rail and inland water transport could be lower. However, a more comprehensive measure of costs, that includes also the cost of longer transit times and poor reliability suggest that costs from these latter two modes are higher than for road transport. The total cost is therefore in part explained by the higher fixed costs and lower volumes of traffic carried by the two modes of transport. 162. Efficiency on the trade corridor between Port Sudan and Khartoum is a key determinant of overall logistics performance of the country as it accounts for more than 90 percent of cargo handled through Port Sudan. The Port Sudan – Khartoum Corridor (PSKC) is comprised of road and rail links, a pipeline for petroleum products, and air transport services. The DTIS assessment focused on the movement of goods traffic, as this is the most critical to trade competitiveness.
Port Sudan
5.8m tonnes
Port Sudan (local)
0.4 m tonnes
Khartoum and beyond
5.3m tonnes
Rail
0.5m tonnes
Road
4.8m tonnes
ICDs
4.1m tonnes
Direct delivery
0.8 m tonnes
Direct delivery
0.4m tonnes

60
163. Traffic volume is one of the most useful indicators of performance of a transport corridor and the transport and logistics sector within a country. Volume helps in measuring transport system capacity utilization and assessing any potential bottlenecks as a result of limits imposed by physical infrastructure and the productivity of cargo-handling operations. Volume also helps identify opportunities for investment in infrastructure and logistics services. 164. The Sudan logistics system is not currently operating at full capacity. As a result of the contraction in international trade volumes on the Port Sudan and Khartoum corridor, the overall logistics system of Sudan appears to have spare capacity across all modes of transport used for international carriage of goods (seaports, railways, road, river, and air) and most logistics services.
Logistics Services 165. The provision of logistics services typically involves customs clearing agents, trucking enterprises, and forwarding and warehousing services. In some countries, there are consolidated frameworks for regulating these various businesses. However, the logistics service market in Sudan is fragmented. A weakness in the regulatory regime for logistics services can induce inefficiencies and increase trade cost. This section looks into why the logistics service industry has been so fragmented, and what influence this fragmentation has on logistics performance and efficiency. 166. Improving the regulatory regime for logistics services promises to deliver significant efficiency gains. The National Transport Master Plan in 2010 estimated that the cost of logistics is very high, equivalent to between 25 and 35 percent of GDP compared to between 10 and 15 percent for middle and high income countries. The current regimes impose a high cost burden on logistics service providers and the trading community. There are two main issues that need to be addressed in order to modernize Sudan’s logistics services, both are regulatory, the first on market access and the other on operational responsibilities. 167. While trade logistics is an industry where economies of scale can play a major role in cutting cost and improving services, in Sudan, restrictions on market access result in a logistics system that is dominated by small scale operators. The main reasons for the prevalence of small scale operators include:
The logistics services sector is regulated by multiple government agencies or ministries under a wide range of laws and regulations. Customs clearing agents are under the control of customs while trucks are registered in States but issued a license for the carriage of international trade traffic by the Land Transport Unit under the Ministry of Transport, Roads and Bridges. Also, a Clearing Agent License can only be issued to an individual and not to a company while the Land Transport Unit (LTU) in essence is issuing a permit for a vehicle and are not required by law to oversee the organization of the trucking sector only its capacity.
The regulations governing logistics services are not easily accessible or transparent. Logistics service providers in the private sector do not have a clear understanding of the regulations. When prompted for views during the DTIS main

61
mission, indeed there were quite divergent responses. For example, a number of providers understood that a minimum fleet size of five vehicles was required to establish a trucking firm while others stated there is no requirement on minimum assets. Information on transport related regulations is not clear and not readily accessible to logistics service providers.
Specialist areas of logistics remain unregulated. For example, although several firms in Sudan provide freight forwarding services there is no law that recognizes freight forwarding as a business. The firms use their international networks and other licenses such as trucking to provide freight forwarding services such as booking vessel space, issuing bills of lading, and related activities. In addition, existing regulations do not cover issues around the transfer of liability in a transport chain. This is left to individual firms to agree with their partners how this will be handled and as a result logistics service providers put a premium on some services or take out additional insurance to cover potential losses.
168. Barriers to entry in the logistics sector protect domestic providers. The domination of small scale and individuals as service providers might appear to suggest an industry with low barriers to entry. However, some of the requirements raise the barriers to entry. For instance, foreign investment in logistics services is allowed but only under restrictive conditions. The National Investment Encouragement Act 1999 (amended in 2003, 2007, and 2013) prohibits discrimination against foreign capitals. The new act in 2013 allows foreign and domestic private entities to establish and own business enterprises, to repatriate capital and profits, with condition of opening an investment account at the Central Bank of Sudan (CBOS) before entering into business38. However, there are restrictions to foreign equity ownership in service industries, including railway freight transportation, airport operations. Trucking companies are not supposed to be under this restriction, but effectively they are. Likewise, foreigners cannot obtain a clearing agent license. Yet, local logistics service providers clearly recognize that foreign investors would enhance the capabilities of Sudanese service providers. 169. Foreign transport operators do not play a prominent role in Sudan. Reforming the regulations to encourage increased participation by foreign logistics providers, with their links to regional and global supply chains will assist in improving connectivity and enhancing competitiveness. The trucking bubble of the last few years probably has discouraged entry by foreign operators. Although foreign operators may also have difficulty building a network for business partnership, and without this network, it is difficult to survive in the fragmented regulatory regime. But again, foreign operators could bring their international network and experience to the Sudanese transport industry. So their participation in the logistics service industry would be beneficial in the medium and long term. 170. The highly fragmented logistics sector results in a premium being placed on the management of liability for the risks faced during shipment. Standard practice is to rely on credibility between transport business partners rather than service quality. This may be one of the reasons that laws do not reinforce the control on operations. However,
38 US Department of State 2013 Investment Climate Statement – Sudan

62
normally, once a truck is loaded liability should be valid for the entire journey up to a delivery point. But in Sudan it is not clear who takes out risk insurance, and owners of goods often have to make their own arrangements at high cost and on a shipment to shipment basis. 171. In the majority of trucking service contracts, logistics service providers take liability and arrange insurance by themselves. The insurance charges are often added to their freight price. Logistics services providers have coped with the lack of regulations on liability, taking full responsibility for the shipments at own cost. Also, the current insurance scheme does not encourage trucking operators to improve the quality of transport services as trucking companies rely on insurance prepared by logistics service providers, which is not a direct cost for trucking companies. 172. Sudan regulations do not define logistics services adequately and are lacking some important other elements. The regulations found in the logistics services are 1) the regulations of customs clearance (2012) and the Customs Act (amended in 2010), and 2) the regulation on organizing the work on land transport (1992). Neither of these regulations defines logistics very well. The laws do not reference logistics services. In addition, there are no self-regulations voluntarily prepared by the industry. The regulations describing the licensing requirements covering customs clearance and land transport (i.e., logistics service business) do not address liability issues nor stipulate a minimum capital requirement. Regulations refer to the qualifications of agents, physical address and taxation (in the new investment act), but do not define a required minimum capital. In theory, anyone can start a trucking business once their vehicle is registered. This covers the minimum capital to buy a truck but does not deal with liability insurance to enable transport operators to cover accidental losses.
Clearing and Forwarding Services 173. There is no licensing regime for clearing and forwarding services - a core service in modern logistics. In order to facilitate door to door service, clearing agents handle customs clearance processes and arrange land transport to a final destination or to a warehousing facility. The providers of these logistics services can be individuals or corporate entities. 174. Customs clearing agents are licensed as individuals by customs. Currently, there are over 1,000 licensed clearing agents in the main centers with 460 in Port Sudan and 630 in the Khartoum area. Each agent is registered to operate at a specific location, such as Khartoum (including Garri Free Zoon and Soba Inland Container Depot), Khartoum airport (exclusive), and Port Sudan (including Red Sea Free Zone). Since one agent can have only one location to work, agents in the different locations collaborate with others at different locations in order to provide coordinated services for the same client. Individual clearing agents have built a network of partners through social networks, which so far, seems to be working well. 175. At the same time, there are restrictive qualification requirements to obtain a clearing agent license. Firstly, obtaining a license requires substantial experience in the customs field with an individual needing at least 20 year experience. As a result the majority
63
of clearing agents are ex-customs officers and there are only a couple of companies that have a corporate clearing license39 . Secondly, only Sudanese nationals may receive a license. As a result, it is impossible for private companies to apply for the clearing agent license although the customs regulation in 2012 allows companies to be granted a license40. With this present licensing system, the private logistics service providers hire clearing agents in each customs location to handle their clients’ shipments. In addition, as a prerequisite to apply for a license, a company should be a member of the union of clearing agents. 176. As a result, the existing licensing regime for clearing agents functions as a significant barrier to the emergence of modern logistics operations, where operators may want to offer door to door services. A licensing regime that is limited to individuals prevents corporate entities from establishing seamless and quality logistics services. Much more arranging sub-contracts with other agents increases the overall costs of services and has a negative impact on on reliability and accountability. 177. The prevalence of mostly one person operations, clearing agents and logistics service provider’s limits their ability to provide internationally competitive logistics facilities and services as they are unable to realize the economies of scale that reduce costs and encourage increased investment. Only a few large logistics companies are able to build their own facilities. The rest, a large share of the market, utilize infrastructure and space in the free zones for temporary warehousing and for value added services. Sudan has two Free Zones managed by The Sudanese Free Zones & Markets Co, Ltd.– Red Sea Free Zone (26 sq km) in Suakin and Al Gaili (Garri) Free Zone (20 sq km), 60 km North of Khartoum. According to users of the free zones, the warehouses are well equipped and secure. Therefore, it is more efficient to use the free zones than building costly infrastructure. Garri Free Zone, for instance, provides spaces for tenants to allow simple repackaging and processing activities.
Trucking services 178. Trucking is the main mode of transport in Sudan. Customs clearing agents and private logistics companies work with trucking companies to arrange transportation on behalf of traders. As a result of the deterioration of railway services over the years, more than 90 percent of goods are carried by road transport. The most common vehicle configuration is one that has two trailers and is capable of carrying two forty foot containers. Trucking services are dominated by three different logistics service providers with widespread subcontracting. 179. There are three modes in providing trucking services. First, relatively big logistics companies possess own fleets and drivers. This is the most comprehensive way to manage whole logistics service under their control. Second, non-asset logistics service providers have contracts with their clients to arrange trucking services, these companies
39 Companies that specialize in providing logistics services for specific commodities have a clearing
license with the names of companies. 40
Regulations for Customs Clearance process for the year 2012, The General Directorate of Customs

64
make a sub-contract with trucking companies that possess fleets or hire individuals (not corporate) so that they are still able to provide a series of logistics services with principle contracts with clients. For sub-contracting, a paper contract is prepared between logistics service providers and subcontractors, which describes its responsibility to carry goods. The non-asset logistics service providers tend to have unique criteria to meet the service quality expected from their clients. Third, clearing agents make a contract with their clients and contract out for trucking service to individual truck drivers or trucking companies. The subcontracting by clearing agents is based on their social network. The clearing agents have a paper contract or only a verbal communication to entrust subcontractors with a trucking service. Since they have been business partners for a long time, the agents can provide their clients with reliable trucking services. 180. Notwithstanding the fragmented structure of trucking services, the price of transport between Port Sudan and Khartoum may be considered competitive. Generally speaking, 40 feet container for a round trip cost around 1,000 to 1,500 US dollars plus VAT. As most of the containers coming from Khartoum are empty, the transport cost is always levied for a round trip. It takes one and half to two days. Now that the trucking bubble has ended, freight prices have become more competitive. 181. A national authority, the Land Transport Unit (LTU) of the Ministry of Transport, regulates the trucking industry in a broader sense, in conjunction with state level supervision. The LTU has seven offices across the country, all of which can process vehicle registrations. There are three steps to obtain a permit for trucking business:
completion of a registration at a state traffic authority;
arranging insurance for vehicles, and
Join the Transportation Union of Chambers (required for all corporate entities). 182. Only the LTU can issue an ID for each vehicle once the earlier mentioned three steps are completed. This should be renewed annually. In principle, anyone can start a trucking business if they have a truck, and those with at least 10 trucks (five trucks for petroleum trucks), can be register a company41. Although a physical ID comes from the LTU, logistics service providers consider the state traffic authorities as a regulator, as there is no clear enforcement on transport operations at the national level. Table 9: Annual Absorptive Capacity for members by chamber
The Chambers No. of means of transport
Average Capacity tons
Annual capacity42
[ Port Sudan – Khartoum] (million tonnes)
Heavy Trucks 16,000 65 49.9
Petroleum and liquid transport
1,929 55 5
Lorries and trucks 30,000 10.8
Railways 600 cars 30 0.6
Source: Author’s own compilation, based on local data obtained in January 2014.
41 Source: the Union of Chambers of Commerce
42 Based on 4 trips a month; 48 trips / year, average

65
183. Strictly speaking, the permit from the LTU is not a transport business license; rather, it is a registration for a vehicle. The LTU counts the number of registered vehicles but does not have a registration system of trucking operators. Therefore, while the number of vehicles registered can be determined, it is difficult to get an accurate number of transport operators in Sudan. In 2014, there were 17,000 double trailer vehicles (capable of carrying two 40 ft. containers) and 56,000 vehicles (for 20 ft. containers) registered at the LTU in Khartoum. On the other hand, data from the Union of Chambers of Transportation suggest there were 151 private companies or individuals who are currently the members of the union. In addition, the union estimated that about 2,000 individual truckers operating although they are not the members. Figure 26 shows the numbers of vehicles owned by the members at the Union, which can give us a sense of size of transport industry. 184. The absence of a requirement to register transport operators makes regulating the trucking industry very difficult. One consequence may be an inability to smooth the businesses through economic cycles. In fact, as Sudan has already experienced over the last several years, the trucking sector went through a boom and bust cycle (Box 1). Figure 26: Trucking Fleet Capacity Utilization
* Freight data for 2010 and 2011 were not provided Source: The Union of Chambers of Transportation
-
10,000
20,000
30,000
40,000
50,000
2006 2007 2008 2009 2010 2011
Total tonnage of available Trucks
Total freight actually transported

66
Inland Container Depots 185. Dry port facilities have the potential to facilitate the transfer of cargo throughout the country. Shipping lines can designate a dry port as the final destination of the cargo and assume responsibility for transshipping the cargo at seaports in neighboring countries. A dry port can therefore become the node for fast customs clearance and trans-loading of cargo. 186. Efficient Inland Container Depots (ICD) must streamline and minimize procedural requirements. One way the requirements can be minimized is by sharing information between the first point of entry (vessel notice and cargo manifest in the case of overseas imports) up to the dry port (import declaration documents). Streamlining information requirements requires optimization and non-duplication of processes between the seaport and the dry port. In many instances, it is necessary to have appropriate legal instruments in place covering the set of agreed upon procedures and the transit regime for the transmission of information between point of first entry and place of final clearance. Under these circumstances, data interchange between border agencies, especially customs, is critical to prepare and expedite border formalities. Current transit regimes would seem well suited to exploiting the benefits of a dry port. Presently, the functional dry ports in Sudan are operated by customs. 187. Sudan has five inland container depots at Soba, Kosti, Garri, Al Gedaref, Madani and Al Obaied. Goods imported through Port Sudan can be transported under bond in transit to the dry ports of ICDs as well as to the numerous privately owned bonded warehouses in the country. Of the five, the Soba Dry Port is the largest, followed by Garri,
Box 1: The Trucking industry ‘bubble’ in Sudan
The Sudan trucking industry went through a boom and bust cycle over the past decade. In 2005, there were about 4,000 trucks registered at the Union of Chambers of Transportation. The freight was 75-80 US$ / ton on average in the trucking industry. At that time, the government took an initiative to promote the trucking industry. The government and the Central Bank of Sudan (CBS) supported the sector by providing loans for individuals to purchase trucks. As a result of this initiative many trucks were purchased and introduced into the market. The number of registered trucks jumped to 22,000 by the end of 2007, which translated into an estimated capacity of eight million tonnes per year. However, demand did not change much over the same period and consequently, there was an excess of supply of trucks that led to a drop in the transport prices. By 2007 the price of freight had fallen to less than 30 US$ per tonne on average. The problems faced were compounded by sanctions which increase the costs to the operators for obtaining imported spare parts. As a result, many small trucking enterprises were not able to sustain their operations and went out of business. Since then the sector has stabilized at a lower level of supply. The number of operators registered with the Union has fallen back to 151 after having risen from 60 in 2005 to 260 between 2007 and 2009. The current level of supply is despite the continuation of some of the incentives to expand the trucking in the form of a tax exemption. Imports of 10 trucks or more trucks are exempt from the duty payment and the operator benefits from a three-year income tax exemption. For 50 trucks or more trucks, in addition to the duty exemption, the operators are also exempt from paying income tax for 10 years.

67
which is growing strongly as a destination and customs clearance node in the logistics system. Kosti has previously handled significant volumes of traffic, when the International Warehouse Tracking (IWT) system was operating. It therefore still has potential, once the impediments to IWT operations are removed. 188. Soba Dry Port located some 10km from Khartoum is the largest and oldest dry port in Sudan’s logistics infrastructure. Containers are transported under bond from Port Sudan to the dry port where customs clearance takes place. Presently the dry port is connected only by road to Port Sudan as the railway line is not operational. In other countries, railways provide the most efficient connectivity to dry ports and in India the dry ports are operated by Indian Railways which has a dedicated container railway service. The dry port is undergoing some developments to improve security (through installation of close circuit television). However it still requires paving and additional inspection sheds. Goods are currently exposed to dust and work has to stop when it is raining. 189. Growth of Soba is constrained by the access of trucks from outside Khartoum. Presently Soba handles up to 90 declarations per day. In 2013 the dry port handled a total of 394,285 TEUs. The clearance process is reported to be taken about 3 days while the landed cost of goods passing through the dry port is said to be higher than goods cleared in Port Sudan. Soba provides for up to 5 days of free storage, with an excess time charged on the basis of weight. The main constraint is access to the dry port for trucks coming from outside Khartoum – the daytime ban on trucks means all trucks arrive in the early hours of the morning and most of the cargo clearance is in the morning period. The dry port sees low volumes of activity for most of the day. The authorities have proposed to build a new dry port to the north of Khartoum, which would not be affected by the daytime ban on trucks. 190. Garri Free Zone is increasingly replacing the use of private warehouses. Located some 70km to the north of Khartoum, Garri is an integrated facility that includes a dry port as well as enterprises involved in manufacturing, packing and packaging, and financial services. The dry port facility has grown to serve these and other industries and many importers prefer the free zone as goods can be kept for extended periods without payment of import duties and taxes. It is used also for the consolidation of exports. Current rates for imports to Garri Free Zone, excluding VAT, are SDG 6,000 for a 20ft container and SDG8,000 for a 40 ft. one while transit time is 48 hours. 191. Kosti Dry Port was built by the state-owned Sea Ports Corporation to speed up the transport of goods from Port Sudan to the South, now South Sudan. It was launched in 2005, though operations began only in 2009. It was expected to handle material with a final destination in the South which would be transported to Kosti's dry Port for customs clearance, inspection and storage when the dry port becomes operational. The facility has an area of two million square meters with a capacity of 150,000 containers. 192. The regulatory regime for clearing agents contributes to slower clearance times. The procedure for cargo cleared at inland facilities especially the dry ports, requires all cargo to be scanned in Port Sudan prior to leaving the port. The clearing agents then work with the importer to put up a bond – which can be done anywhere in the country. The bond is equivalent to 125 percent of the applicable duties and taxes for which typically, the importer pays insurance at a premium of 0.5 percent. The agent who will do final clearance inland works with a counterpart at Port Sudan. One of the implications of a regulatory regime that allows only individuals to work as clearing agents is that most do not have the
68
capital to handle the bond and other payments. Invariably, they engage with the importer at all stages that require payment.
Modes of Transport 193. Road transport is the most important mode of transport for the movement of Sudan’s international trade traffic. There are two alternative routes that are part of the PSKC: a) Khartoum-Atbara-Haiaya-Port Sudan which is 794 km long and b) Khartoum-Medani-Gedarif-Kassala-Haiaya-Port Sudan which is 1191 km long. These two main routes are in generally good condition. Both routes have toll stations, seven on the first and nine on the second one. The tolls are charged at a rate of 0.00342 SDG per tonne per kilometer. This rate has not been revised since 2008, ostensibly to keep costs low and promote trade competitiveness. However, as the current toll rate seems not enough to generate sufficient revenue for the National Highway Authority (NHA) to maintain the trunk road network in the country in a good condition a more detailed analysis on the condition of the core network along the major trade corridors is required. 194. An operational practice that has serious ramifications for the rest of the road transport based logistics system is a restriction on trucks entering Khartoum for 18 hours each day. Trucks are allowed only between mid-night and 6 am. The restriction means trucks are parked outside the city for most of the day before they can deliver goods or access the Soba Dry Port. As a result, the Dry Port itself receives traffic only very early each morning. Ideally there should be continuous traffic flow to reduce the cost of moving inventory of goods and also increase the utilization of vehicles. Railway Logistics 195. At 4,578 km, Sudan has the most extensive railway network in Africa, after South Africa. It is a single track Cape gauge network whose construction started in the 1890s. The railway’s main route extends from Port Sudan via Atbara to Khartoum with an alternate link between Haya and Sennar via Kassala. It has branch lines to the north to Karima and Wadi Halfa, and more recent extensions added in the 1990s were for transportation of Sudanese crude oil between El Mujlad and Abu Jabra and between the refinery in Abu Khiraiz and El Obeid station and between Merwi Dam and El Ban. 196. The railways in Sudan have historically had a near monopoly on inland transportion. This is true especially in the important Port Sudan to Khartoum Corridor (PSKC), which connects the country's only deep water port with the capital and the rest of the country. In fact, the transport system was until the 1970s organized around the railways, with both the seaports and river transport being part of the same entity as the railways. The three were separated in the late 1970s, which is also the time when traffic volumes carried by rail started to decline, except for a brief period in the early 1990s (Figure 27).
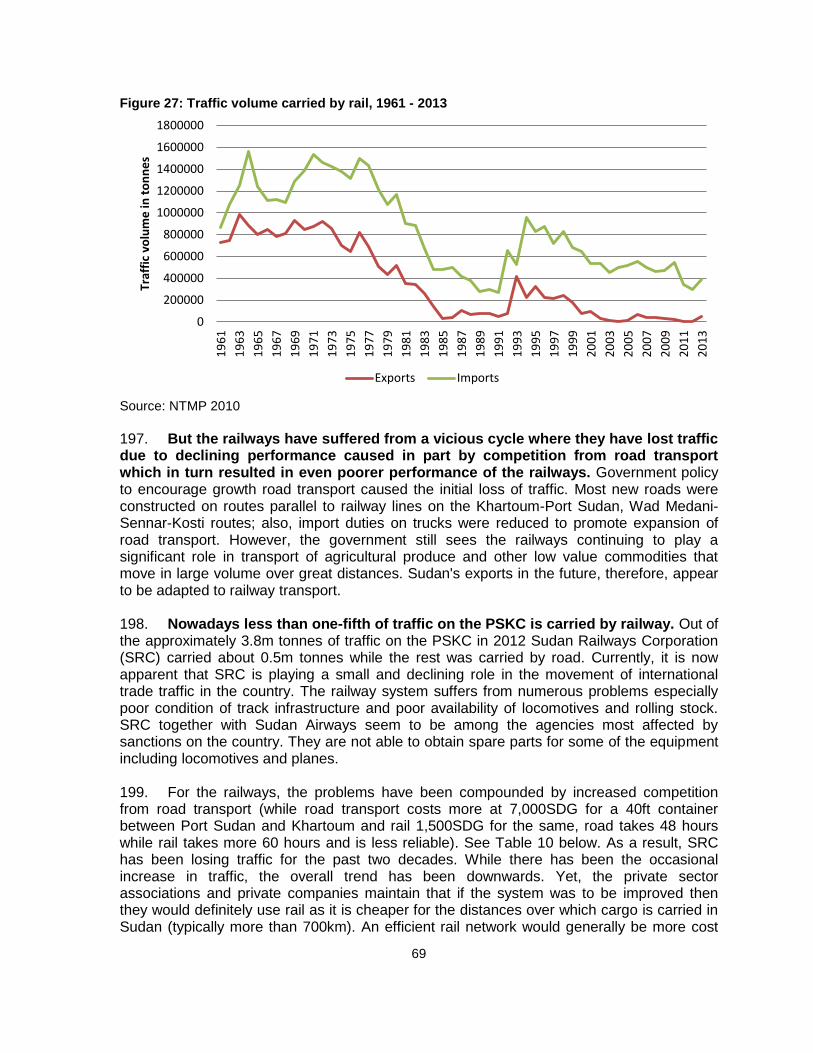
69
Figure 27: Traffic volume carried by rail, 1961 - 2013
Source: NTMP 2010
197. But the railways have suffered from a vicious cycle where they have lost traffic due to declining performance caused in part by competition from road transport which in turn resulted in even poorer performance of the railways. Government policy to encourage growth road transport caused the initial loss of traffic. Most new roads were constructed on routes parallel to railway lines on the Khartoum-Port Sudan, Wad Medani-Sennar-Kosti routes; also, import duties on trucks were reduced to promote expansion of road transport. However, the government still sees the railways continuing to play a significant role in transport of agricultural produce and other low value commodities that move in large volume over great distances. Sudan's exports in the future, therefore, appear to be adapted to railway transport. 198. Nowadays less than one-fifth of traffic on the PSKC is carried by railway. Out of the approximately 3.8m tonnes of traffic on the PSKC in 2012 Sudan Railways Corporation (SRC) carried about 0.5m tonnes while the rest was carried by road. Currently, it is now apparent that SRC is playing a small and declining role in the movement of international trade traffic in the country. The railway system suffers from numerous problems especially poor condition of track infrastructure and poor availability of locomotives and rolling stock. SRC together with Sudan Airways seem to be among the agencies most affected by sanctions on the country. They are not able to obtain spare parts for some of the equipment including locomotives and planes. 199. For the railways, the problems have been compounded by increased competition from road transport (while road transport costs more at 7,000SDG for a 40ft container between Port Sudan and Khartoum and rail 1,500SDG for the same, road takes 48 hours while rail takes more 60 hours and is less reliable). See Table 10 below. As a result, SRC has been losing traffic for the past two decades. While there has been the occasional increase in traffic, the overall trend has been downwards. Yet, the private sector associations and private companies maintain that if the system was to be improved then they would definitely use rail as it is cheaper for the distances over which cargo is carried in Sudan (typically more than 700km). An efficient rail network would generally be more cost
0
200000
400000
600000
800000
1000000
1200000
1400000
1600000
1800000
19
61
19
63
19
65
19
67
19
69
19
71
19
73
19
75
19
77
19
79
19
81
19
83
19
85
19
87
19
89
19
91
19
93
19
95
19
97
19
99
20
01
20
03
20
05
20
07
20
09
20
11
20
13
Traf
fic
volu
me
in t
on
ne
s
Exports Imports

70
effective for shipments over 400km.The absence of a reliable and cost effective rail system increases transport costs for importers and exporters in Sudan. Table 10: Time comparison (40 feet container; Port Sudan – Khartoum
Operation Truck (hours) Rail (hours)
Loading onto vehicle/wagon 2 12
Transport 10 17
Unloading from vehicle/wagon 2 6
Trucking to destination 0 2
Total 14 37
Source: NTMP 2010
Inland Water Transport 200. Sudan has an extensive though not continuously navigable inland waterway that has significant potential to provide a low cost and environmentally friendly transport service. The water way is formed by the navigable sections of the Nile River, from Kosti going south to Juba in South Sudan (extending over 1,435km) and Karima to Dongola connecting to Egypt (330km). However, the waterway is normally navigable from July up until March. Waterweeds can be problematic between Malakal and Juba, slowing down and damaging barge propellers. 201. Inland water transport has not fared well to competition from road transport which is much faster and able to provide door to door services. North of Kosti to Khartoum and beyond, the river has several sections that are shallow thereby restricting the carriage of goods by barges. This poses an interruption in flow, in a part of the national transport system that generates significant demand. Continuing improvements to the road infrastructure are further eroding the competitiveness of inland water transport services. Recently, a road connection between Sudan and Egypt (Qustul- Adendan- Wadi halfa 350 km) was inaugurated in May 2013 43 and is expected to reduce dramatically the cargo volume carried by river transport. There is in fact a vicious cycle where the low volumes using inland water transport mean the total costs of services begin to approach those of road transport, making the mode even less attractive. Table 11: Comparison of Traffic since Privatization in 2008
Cargo / goods Kosti to Juba Juba to Kosti Kosti to Malakal
General Cargo (tons) 6,434 8,562 1,255 721 5,538 7,746
Dry bulk (tons) 0 4 0 0 456 1,078
Liquid bulk (tons) 1,519 3,223 0 0 1,045 461
Total Goods (tons) 7,953 11,789 1,255 721 7,039 9,915
Passengers 398 481 355 548 10 19
Source: NTMP 2010
202. Historically, the section between Kosti and Juba has been the most heavily trafficked portion of the inland waterways transport (IWT) network in Sudan. The system has been used to carry heavy break bulk goods, especially between Kosti and
43 http://allafrica.com/stories/201305200148.html
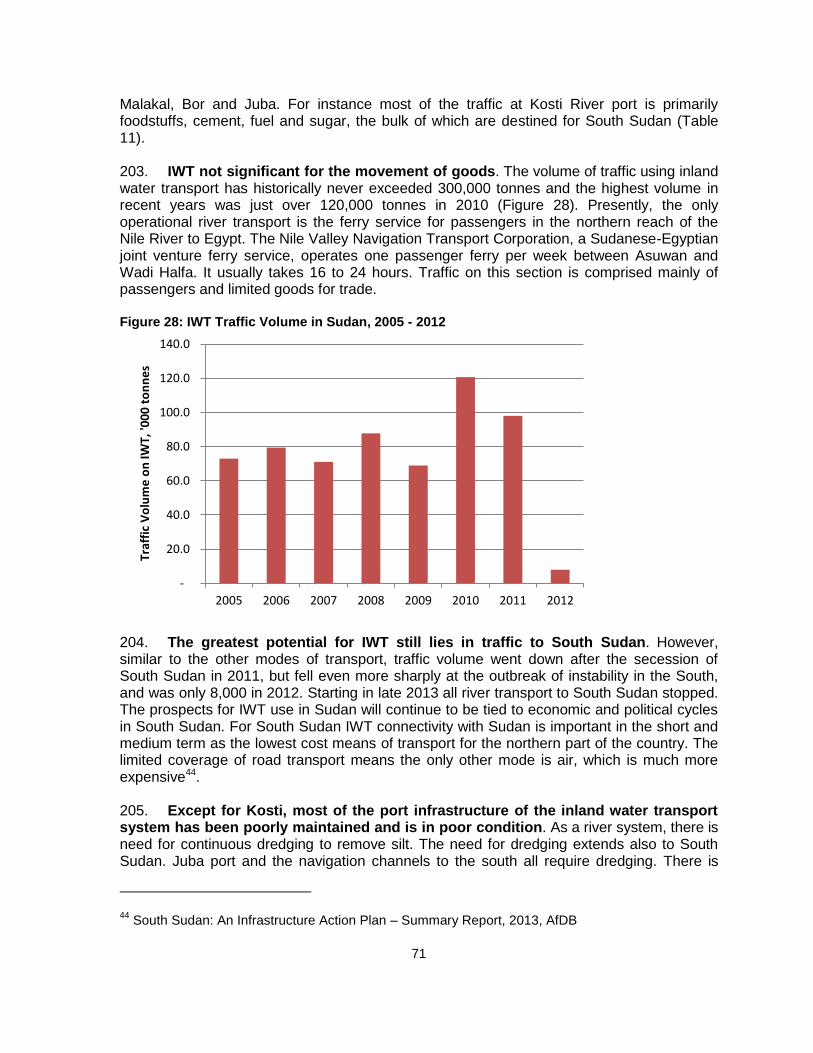
71
Malakal, Bor and Juba. For instance most of the traffic at Kosti River port is primarily foodstuffs, cement, fuel and sugar, the bulk of which are destined for South Sudan (Table 11). 203. IWT not significant for the movement of goods. The volume of traffic using inland water transport has historically never exceeded 300,000 tonnes and the highest volume in recent years was just over 120,000 tonnes in 2010 (Figure 28). Presently, the only operational river transport is the ferry service for passengers in the northern reach of the Nile River to Egypt. The Nile Valley Navigation Transport Corporation, a Sudanese-Egyptian joint venture ferry service, operates one passenger ferry per week between Asuwan and Wadi Halfa. It usually takes 16 to 24 hours. Traffic on this section is comprised mainly of passengers and limited goods for trade. Figure 28: IWT Traffic Volume in Sudan, 2005 - 2012
204. The greatest potential for IWT still lies in traffic to South Sudan. However, similar to the other modes of transport, traffic volume went down after the secession of South Sudan in 2011, but fell even more sharply at the outbreak of instability in the South, and was only 8,000 in 2012. Starting in late 2013 all river transport to South Sudan stopped. The prospects for IWT use in Sudan will continue to be tied to economic and political cycles in South Sudan. For South Sudan IWT connectivity with Sudan is important in the short and medium term as the lowest cost means of transport for the northern part of the country. The limited coverage of road transport means the only other mode is air, which is much more expensive44. 205. Except for Kosti, most of the port infrastructure of the inland water transport system has been poorly maintained and is in poor condition. As a river system, there is need for continuous dredging to remove silt. The need for dredging extends also to South Sudan. Juba port and the navigation channels to the south all require dredging. There is
44 South Sudan: An Infrastructure Action Plan – Summary Report, 2013, AfDB
-
20.0
40.0
60.0
80.0
100.0
120.0
140.0
2005 2006 2007 2008 2009 2010 2011 2012
Traf
fic
Vo
lum
e o
n IW
T, '0
00
to
nn
es

72
also a lack of navigation aids and handling equipment particularly for containers. In general both the infrastructure and services require rehabilitation, as there are numerous vessels that are in a state of disrepair. Several interventions have been proposed to revive the inland water transport system, especially in South Sudan. These include the provision of container handling facilities, emergency rehabilitation at old Kosti port, concessioning the new Kosti port, new infrastructure at Juba and studies on dredging, navigation and river hydrography. Sudan has already taken significant steps to improve IWT services through private sector participation. Table 12: Time and costs associated with transport within Sudan
Route Mode of transport Time (days) Cost per tonne-km (US$)
Khartoum–Malakal Road and river 7 75
Road 5 107
Khartoum–Juba Road and river 13.5 127
Road 7.5
Malakal–Juba River 2 270
Source: AICD calculations based on data from Yoshino and others (2009); UNJLC and FAO (2005); and Keer-MISC ( http://www.keer-misc.com), sited from South Sudan’s Infrastructure – continental perspective, 2011, WB
206. Recent reforms in allowing private sector firms to provide inland waterway transport services provide a firm foundation for the future of the sector. Up until 2007 core logistics services on the Nile were provided by a state enterprise, the River Transport Authority. The Authority was privatized in 2007 resulting in the formation of the Nile River Transport Company (NRTC). NRCT is 70 percent owned by the Aref Investment Group of Kuwait, 20 percent by the Government of Sudan and 10 percent by the Government of South Sudan. The NRTC is the owner and operator of the inland waterways infrastructure in Sudan under a 50 year lease. NRTC started operations in July 2008 when it bought the assets of RTC including the fleet and spare parts. It also signed a contract with an Egyptian firm to rehabilitate its entire fleet of barges, including 17 push tugs (which have a capacity of 2,000 metric tons each) as well as numerous smaller barges designed for carrying oil, dry goods, and passengers. One of its first major investments was to rehabilitate the facilities at Kosti. 207. In 2009, NRTC had 50 operational barges at various stages of rehabilitation from the stock inherited from RTC. The fleet included 13 pushers, plus four rehabilitated ones. It has an estimated total cargo capacity of 50,000 metric tons at that time45. Table 12 shows the traffic volumes before and after privatization and shows that prior to the closure of the routes to the South, traffic volumes had been growing. 208. The NRTC is not the only commercial operator on the Nile as there are six other private operators of vessels46, most with Egyptian capital. However, all the others have ceased their operations, largely due to the closure of the route to South Sudan. For instance, the National Company for Multimodal transport (NMT) of Egypt has engaged in river transport business in Egypt, Sudan and South Sudan. When it was operational in
45 River Cargo Transportation Assessment While Nile River Sudan, February 2009, UNJLC
46 Sudan Interim Poverty Reduction Strategy Paper, No13/318, October 2013, IMF

73
Sudan, Keer Marine, private Sudanese river transport operator, was operating a fleet of barges as well as ports in Sudan. The cessation of cross border transport between Sudan and South Sudan means the river transport service is only operational within South Sudan47. Air Shipments 209. Sudan is connected by regional and international airlines to the key markets for fruit and vegetables and meat in the Middle East. There are eleven regional airports around the country, in addition to the main air gateway of Khartoum Airport. Most of the international shipments by air pass through Khartoum which account for more than half of the cargo volume. Khartoum airport has limited infrastructure and capacity for air exports. It has a warehouse capable of accommodating 600 tonnes of exports and 120 tonnes of fresh produce. Space for passengers is even more limited. Cargo throughput through Khartoum Airport has been on a general downward trend since 2007 except for a momentary pickup in 2011 (Table 13). Cargo volumes through the regional airports fell more significantly, from close to 500,000 tonnes per year in 2008 to just over 20,000 tonnes in 2012. At Khartoum, cargo volume fell from 80,950 tonnes in 2007 to 37,780 tonnes in 2012. Table 13: Cargo Volumes, 2007-2012
Year Khartoum Regional Airports
Domestic International
2007 26,858 54,092 26,348
2008 25,086 50,084 452,581
2009 23,213 39,537 483,402
2010 20,866 32,303 83,889
2011 28,728 31,323 19,309
2012 12,780 25,000 20,060
Source: Author’s own compilation, based on local data obtained in January 2014.
210. The government is building a new airport some 40km to the west of Khartoum. The new airport is envisaged as a transportation hub to link Europe and East and Southern Africa. It will have a runway long enough and infrastructure to handle the largest aircraft in the world. The airport will have passenger capacity of 12m per year and cargo warehouse space of 6,000m2 as well as a cold store with 500 tonne capacity. 211. Presently, air transport is one of the sectors that seem most affected by international sanctions. The national airline, Sudan Airways is not able to maintain its whole fleet and has some aircraft grounded due to lack of spare parts. Some of the international airlines are also not able to repatriate their profits due to non-availability of foreign currency through the official channels. The latter is one of the reasons given for the withdrawal in January 2014 of Lufthansa from the Sudanese market.
47 Operated by a newly established Nile Barges for River Transport Ltd, south Sudanese company.
Source at http://nmt-eg.net/index.php/subsidiaries/nile-barges-sudan
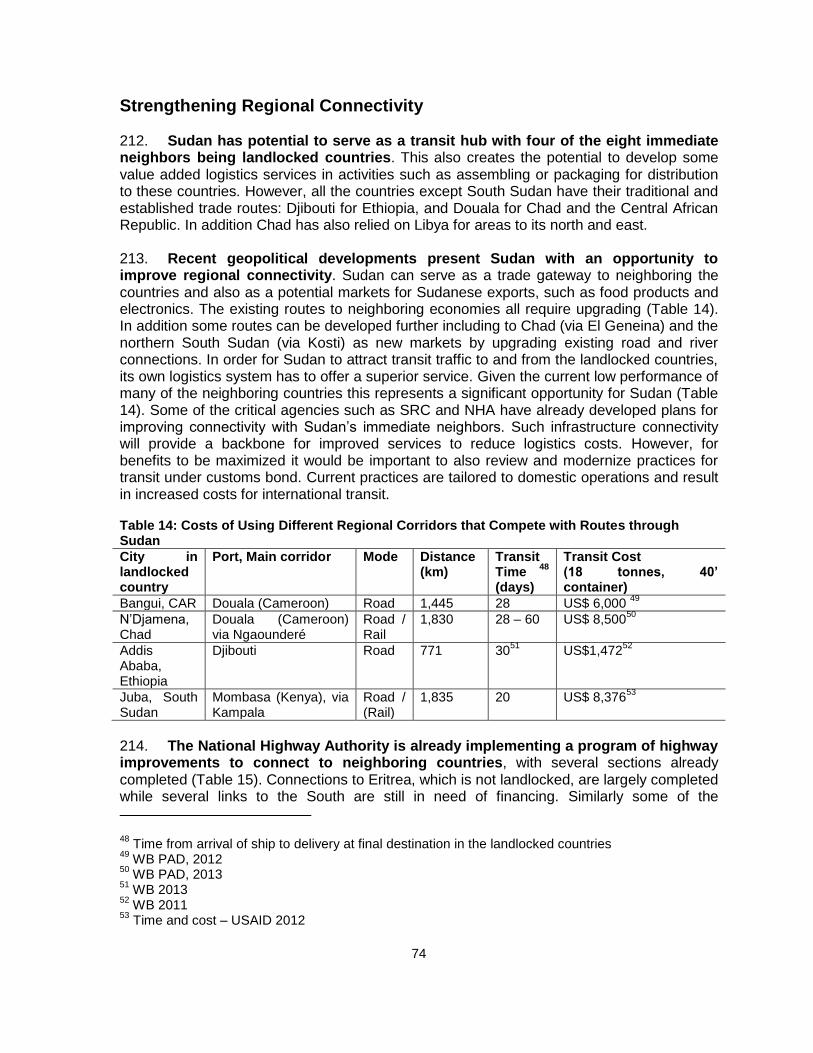
74
Strengthening Regional Connectivity
212. Sudan has potential to serve as a transit hub with four of the eight immediate neighbors being landlocked countries. This also creates the potential to develop some value added logistics services in activities such as assembling or packaging for distribution to these countries. However, all the countries except South Sudan have their traditional and established trade routes: Djibouti for Ethiopia, and Douala for Chad and the Central African Republic. In addition Chad has also relied on Libya for areas to its north and east. 213. Recent geopolitical developments present Sudan with an opportunity to improve regional connectivity. Sudan can serve as a trade gateway to neighboring the countries and also as a potential markets for Sudanese exports, such as food products and electronics. The existing routes to neighboring economies all require upgrading (Table 14). In addition some routes can be developed further including to Chad (via El Geneina) and the northern South Sudan (via Kosti) as new markets by upgrading existing road and river connections. In order for Sudan to attract transit traffic to and from the landlocked countries, its own logistics system has to offer a superior service. Given the current low performance of many of the neighboring countries this represents a significant opportunity for Sudan (Table 14). Some of the critical agencies such as SRC and NHA have already developed plans for improving connectivity with Sudan’s immediate neighbors. Such infrastructure connectivity will provide a backbone for improved services to reduce logistics costs. However, for benefits to be maximized it would be important to also review and modernize practices for transit under customs bond. Current practices are tailored to domestic operations and result in increased costs for international transit. Table 14: Costs of Using Different Regional Corridors that Compete with Routes through Sudan
City in landlocked country
Port, Main corridor Mode Distance (km)
Transit Time
48
(days)
Transit Cost (18 tonnes, 40’ container)
Bangui, CAR Douala (Cameroon) Road 1,445 28 US$ 6,000 49
N’Djamena, Chad
Douala (Cameroon) via Ngaounderé
Road / Rail
1,830 28 – 60 US$ 8,50050
Addis Ababa, Ethiopia
Djibouti Road 771 3051
US$1,47252
Juba, South Sudan
Mombasa (Kenya), via Kampala
Road / (Rail)
1,835 20 US$ 8,37653
214. The National Highway Authority is already implementing a program of highway improvements to connect to neighboring countries, with several sections already completed (Table 15). Connections to Eritrea, which is not landlocked, are largely completed while several links to the South are still in need of financing. Similarly some of the
48 Time from arrival of ship to delivery at final destination in the landlocked countries
49 WB PAD, 2012
50 WB PAD, 2013
51 WB 2013
52 WB 2011
53 Time and cost – USAID 2012

75
neighbors, especially Ethiopia, are also building roads towards their common border with Sudan.
Table 15: Completed Road Improvements Linking to Neighboring Countries
Project name Length Connecting country
Wadi Halfa – Dongla 417 Egypt
Port Sudan – Gabatiet 280 Egypt
Gedarif – Doka – Gallabat 160 Ethiopia
Kassala – El Lafa 24 Eritrea
Gadami – Hemishkorieb 82 Eritrea
Tokar – Garora 180 Eritrea
Khartoum – Rabak – Jowd 411 South Sudan
Source: National Highway Authority.
215. Differences in axle load limits and vehicle technical requirements increases the costs of cross border transport services. Table 16 shows that the axle load limits for Sudan are lower for than the East Africa region. However, Sudan permits trucks to carry two 40 ft. containers up to a gross vehicle weight of 76 tonnes. This is 20 tonnes more than the maximum permitted in the EAC countries. Table 16: Sudan Axle Load Limits Compared to EAC Countries
Axle group Sudan (tonnes) EAC (tonnes)
Single 10 10
Double 16 18
Triple 22 24
GVM Up to 76 56
Source: Author’s own compilation, based on local data obtained in January 2014.
Recommendations 216. There are six main interventions that could be implemented to reduce trade costs in Sudan through addressing transport and logistics challenges: i) Address the key bottlenecks in the road transport sector; ii) improve the railways; iii) reform the regulation of the logistics sector and develop a comprehensive logistics strategy; iv) improve inland water transport in conjunction with other modes; v) strengthen safety regulation oversight in civil aviation and; vi) strengthen regional land transport connectivity. 217. Firstly, address the key bottlenecks in the road transport sector, which will remain a dominant mode of transport for Sudan, even on the core PSKC. As such it is important to make improvements to remove some of the current bottlenecks. The government has already invested significantly in improving road infrastructure including the shorter route between Port Sudan and Khartoum via Atbara, however, there are still sections of the route that need widening, especially those that carry high volumes of traffic. Such widening will reduce delays but will help also to improve safety. 218. Exploring the available options for addressing delays due to truck restrictions in the Khartoum area of which the two that have been suggested are: building a bypass and new bridge to connect to the Soba Dry Port without passing through the city or relocating the dry port to an area north of the city. Each option has pros and cons, and there would also be different cost and performance implications. These options need to be studied in detail. In

76
the short term it is clear that Soba needs paving for proper management of traffic and to improve the overall environment for customs staff and users. 219. Improving the registration system for trucks. Land Transport Unit (LTU) of the Ministry of Transport is responsible for the vehicle registration, but actual regulator is a traffic authority at a state level. The LTU regulates the trucking business through a law which translates into Organizing the Work on Land Transport (1992). The LTU also imposes an inspection on the registered vehicles. Besides, state traffic authorities in each state register and regulate trucking operations in practice. Therefore, the LTU does not have statistics on truck operators at the national level. Manual registration at the state level also contributes to the lack of sharing information with the central government. 220. Secondly, improve the railways through implementing some of the actions already identified in the established Railways Business Plan. In particular the emphasis on enhancing competitiveness of the railways by improving services, scheduled for the Long Term phase should be a guiding principle even in the short term. In addition it is important to (1) improve the infrastructure conditions and service performance on the core corridor linking Port Sudan and Khartoum; and (2) to develop links to key dry ports, to facilitate quick turnaround of wagons as well as customs clearance. The railways have an advantage over road transport in the management of transit cargo for inland clearance. Railways have a simpler regime which can be exploited to competitive advantage. 221. It is important to expand the role of private operators by allowing more third party access to the track infrastructure. The experience with the current private operators has demonstrated the viability of this approach. 222. Thirdly, improving the regulatory regime for logistics services promises to deliver significant efficiency gains. The National Transport Master Plan in 2010 estimated that the cost of logistics is very high, equivalent to between 25 and 35 percent of GDP compared to between 10 and 15 percent for middle and high income countries. The current regimes impose a high cost burden on logistics service providers and the trading community.
223. Logistics services should be defined in the law that clarifies the market access requirement and operational liability. The regulations found in the logistics services are 1) Regulations of customs clearance (2012) and Customs Act (amended in 2010), and 2) Organizing the work on land transport (1992). Neither of these regulations defines logistics very well. The existing regulations describe the licensing requirements covering customs clearance and land transport but strop short of addressing liability issues and do not stipulate a minimum capital requirement.
224. Amend the regulations to encourage increased participation by foreign logistics providers, with their links to regional and global supply chains. This will assist in improving connectivity and enhancing competitiveness. Foreign operators can bring their international network and experience to the Sudanese transport industry. 225. Infrastructure investments in Sudan’s transport system should be complemented with interventions to better integrate logistics services. Currently, each of the government agencies responsible for different modes of transport has their own
77
investment plan. Such plans can be better coordinated in the logistics strategy with an emphasis on inter-modal interfaces. 226. Fourthly, improve inland water transport in conjunction with other modes. River transport has potential to increase regional trade via the Nile River in the long term. Some government agencies, such as Sudan Railways Corporation and National Highways Authority, are looking to better regional connectivity in their plans for infrastructure investment. Moreover, the advantage of investing in river transport would be much cheaper than roads construction. Since private operators used to be active in Sudan, reviving river transport once the operation to South Sudan resumes remains a positive prospect. 227. River transport would also benefit from prioritizing IWT in Sudan in coordination with other modes of transport. It is recognized that the rehabilitation of river ports, handling facilities, dredging of the ports is required. In addition, it is important to increase efficiency of port operations and intermodal connections. Otherwise, river transport cannot compete with the road network although it has a cost advantage. The system would therefore be able to provide better quality services to the South once operations can be restarted.
228. Fifthly, strengthen air safety regulatory oversight to improve global connectivity. Effective oversight is vital for safety and also necessary for accessing European airspace. With improved oversight, Sudanese airlines would be able to expand their international networks. This would also provide a boost to the tourism sector. 229. Lastly, prioritize improving regional connectivity. Sudan has potential to serve as a transit country for several of its immediate neighbors, especially those that are landlocked. Playing such a role would increase the volume of traffic through the Sudanese system, which in turn would lower unit costs especially at the port and on the railways and also offer opportunities for value added services, including packaging and redistribution. However, for Sudan to exploit the apparent opportunity, the performance of the corridors linking it to neighboring countries has to be superior to alternative connections for those countries. The case of South Sudan and the alternatives that have emerged since independence is illustrative of the competing alternatives that exist. 230. Sudan can take several actions to improve its connectivity to neighboring countries. The three main actions are: (i) Continue strategic investments in connecting transport infrastructure and services to neighboring countries. Both the National Highway Authority and Sudan Railways Corporation have prepared plans to improve the connectivity of the road and railway networks to neighboring countries. Priority should be to connect to Ethiopia, which is keen on alternative links especially for its Western part, as well as to Chad and the Central African Republic. The latter two countries were served in part by connections to Libya, which are no longer reliable as well as to Central Africa, especially Cameroon, which are longer. (ii) Harmonize technical standards with neighboring countries. Fundamental to regional connectivity is the harmonization and standardization of infrastructure and services standards across countries.

78
(iii) Establish institutional mechanisms to develop regional corridors. Coordination with neighboring countries is an imperative in order to make sure there are proper and compatible linkages in infrastructure and services for cross border operations. This is a multi-stakeholder exercise requiring the coordination of the many stakeholders involved in the transforming a regional route into a trade and transport corridor. The parties include the government agencies responsible for infrastructure (ports, roads, railways, border posts) and for regulation of services (transport, customs, immigration, security, health, agriculture, trade, etc.), and private sector operators (roads, rail, port, terminal operations, freight forwarding, cargo clearing, finance, etc.). Further, the regional economic communities are able to support harmonization efforts through mobilizing technical and financial assistance.

79
Chapter 6: National Quality Infrastructure and Non-Tariff Measures
Overview 231. In Sudan the National Quality Infrastructure (NQI) is characterized by a centralized approach through a government institution – the Sudan Standards and Metrology Organization (SSMO). The NQI includes standardization, testing, certification, metrology and accreditation which are necessary for proving that products or services meet public policy objectives such as health or safety. The SSMO was established in 1992 as a government institution and functions as both a regulatory body and a testing and certification agency for many of the imports subject to Technical Regulations. Testing and certification is also carried out by other agencies including the Ministry of Health, and the Ministry of Agriculture and Irrigation. Currently SSMO is in the process of establishing an independent accreditation body and draft legislation has been prepared. Modernizing the technical infrastructure to bring it in line with best practice requires a shift in focus to supporting voluntary claims of conformity especially in support of imports and exports. 232. The SSMO reports to the Cabinet Council and is responsible for standards development, accreditation, metrology, testing and inspection. The SSMO was established by the Sudan Standards and Metrology Act of 1992 which was updated in 2003 and 2008. The SSMO has 21 branches in cities and regions across Sudan with 1,379 staff members, most of whom are inspectors. Due to the large geographical area of the country and the many places where products can enter the market, coupled with an approach to regulation which demands a 100 percent verification of compliance of all products, such a large and distributed inspection force is required. 233. SSMO has committed itself to improving the quality of its services and has obtained ISO 9001 certification of its management systems. It also has subjected several laboratories to accreditation audits. As part of its mandate to promote quality in the country, SSMO pursued ISO 9001 certification to lead the industry by example. The laboratory services division has a quality management system in place and in order to improve the recognition of the results delivered has begun a program to seek accreditation to ISO/IEC 17025:2005 (General requirements for the competence of testing and calibration laboratories).54, 234. The structure of the SSMO is consistent with the approach taken by standards institutes in the 1980’s prior to the establishment of the WTO. At that time, the primary focus of the organizations was around developing and implementing basic health safety and quality standards on all commodities. The liberalization of trade practices and the increase in global competition has meant that Standards Institutes like SSMO are now increasingly looking to their role in providing recognized commercial services in support of industry who wish to voluntarily demonstrate to regulators that their products meet required technical standards. Customers of such services see value if the conformity assessment services are widely recognized, the technical standards are aligned in different jurisdictions, and they can have their
54 As part of the ISO/IEC 17025:2005 accreditation 36 test methods in 11 labs have been accredited to
date: 6 of them from the Khartoum laboratory complex and the remainder at the SSMO facility in Port Sudan. Accreditation audits were conducted by the Egyptian Accreditation Council (EGAC) in late 2013. Reports indicate that only minor observations were raised. These were all addressed and the laboratories were accredited in May 2014.
80
products tested once and accepted in many locations. The co-location of services in a single body can lead to perceptions of potential conflicts of interest in that the decisions made in one branch can be perceived as favoring another branch rather than addressing real problems in the market. 235. Sudanese standards are developed to include requirements that can be verified using the test equipment in SSMO laboratories and they do not allow for alternative means of demonstrating conformity. Only standards that can be declared mandatory and for which the inspection function can charge inspection fees are published. Outside its own tests SSMO recognizes test results obtained from Sudan University Research Labs, the Food Research Center, and industrial institutions for research. Outside of these specific laboratories SSMO requires samples to be retested in the SSMO labs. Disputes over measurements between parties are referred to the Board of Director (BOD) following a written submission to the SSMO Director General. The BOD comprises representatives from all the regulatory bodies, national exporters and the private sector. Some private sector representatives considered their membership of the SSMO BOD inhibited appeals in cases where the SSMO carried out the tests. 236. A first step towards modernizing the NQI system would be to prioritize reforms that conform with the WTO Technical Barriers to Trade (TBT) Agreement. The WTO TBT agreement seeks to reduce unnecessary or unfair technical barriers by promoting transparency of regulations by all parties. The TBT Agreement stipulates that the technical regulations should be kept to the minimum that is necessary for the country to achieve legitimate objectives, which include protection of health and safety, protection of the environment and the elimination of deceptive practices (Article 2-3). The agreement further recommends that the technical regulations should seek to use international standards as their basis (article 2-4) and recognize assessment of conformity from competent sources as evidence of conformity to stated requirements. 237. The WTO TBT Agreement articulates a framework that indicates how technical regulations should be developed and effected within a compliant regulatory structure. The framework is illustrated in Figure 30 and shows that the technical regulation should fall within a broader policy framework. Much more, technical regulations should include technical requirements based on a standard and if possible, the standard should adopt an international standard or be aligned as much as possible. In the interest of transparency the administrative procedures should name the regulatory authority and specify the sanctions that can be applied for non-compliance. In fact, transparency and trust to the economy is at the heart of the framework through ensuring attention to due processes by all of the essential components of the NQI. Finally, clarity as to how conformity to the technical requirements of the regulation can be demonstrated would also have to be provided.

81
Figure 29: Technical Regulations Framework Following Best Practice Guidelines
Note: Schematic outline in conformity with the WTO TBT agreement. Source: EAC Quality infrastructure (http://www.eac-quality.net/better-business-with-quality/technical-regulations.html
238. Sudan is committed to acceding to the requirements of the WTO TBT agreement and the Sanitary and Phyto-Sanitary (SPS) agreement as part of the WTO accession process. To this end the Ministry of Trade has a dedicated WTO accession unit whose role is to coordinate the efforts of the different agencies responsible for reaching a satisfactory level of compliance to the requirements of the WTO TBT and WTO SPS agreements as they relate to the trade practices and trade infrastructure in Sudan. The SSMO has been mandated to operate both the WTO TBT and WTO SPS enquiry points.
Standards Development in Sudan 239. As part of its mandate obtained by the 2008 SSMO act, the SSMO develops standards through 51 active technical committees that meet weekly. In those weekly meetings the committees review current standards and develop or adopt new standards to meet new demand. Under the SSMO act of 2008 the SSMO is the pinnacle standards body in Sudan responsible for the maintenance of the collection of national standards, which are numbered as “SDS” as Sudanese Standards. The official catalogue of approved standard includes about 3,000 standards. 240. Since national standards are declared mandatory through a formal Cabinet process, all Sudanese standards are formally approved and deemed to be mandatory. The 2008 act makes provision for the developed standards to be voluntary and then allows for them to be declared mandatory through a separate process. In practice however, all Sudanese standards are declared mandatory. As a consequence, if a standard has been approved for a product; all products produced and sold in the country must conform to the standard. Prior to a new technical regulation being applied the SSMO have stated that they undertake an intensive promotion campaign to raise awareness of the new requirements. The SSMO is mandated to inspect production; points of import; and points of sale to verify conformity. SSMO is entitled to collect a levy related to the cost of regulating the product concerned, the schedule of fees was

82
recently amended and published as a regulation under the act in 2012. It should however be noted that it is not possible to enforce compliance to all of the standards that are currently in the collection as several of the published standards are not suited to regulatory enforcement (such as test methods). 241. The accessibility of standards to industries wishing to export products that are not regulated is limited by this approach. Conformity to standards for quality management like ISO 9001:2008 are required by many purchasers of products, these standards are not readily enforceable as mandatory standards but should be made available for those wishing to follow them voluntarily. Sudanese business in particular has problems obtaining standards from sources outside the country due to foreign exchange controls and the inability to purchase over the internet. 242. Standards are not readily available to those wishing to implement them. The sales and information function is not obvious to visitors to the SSMO facilities and is not visited by many clients. The sales of standards are low and revenues received from the sale of standards are not significant (Table 17). In an attempt to attract more sales, the selling price of standards was reduced by half in 2013 but it appears as if the number of units sold remained the same in 2013 and is on course to perform similarly in 2014. The low number of standards sold is a concern, and although the sale of standards is not the only measure of relevance of the collection of standards, it is a strong indicator that attention should be paid to both the content (standards being developed) and the way in which it is made available. 243. Standards are not sold in the remote facilities in the country. The SSMO web site makes provision for customers to place orders for specific standards by downloading an order form and e-mailing it back to SSMO, customers are also able to order international or foreign national standards for the purposes of export in this manner. This method may appear clumsy in comparison to other national standards bodies that have on-line sales portals but due to sanctions and associated limitations in the banking infrastructure in Sudan, the full range of e-commerce applications is not possible. In order to increase the use and minimize confusion related to standards, SSMO has over the last two years, provided free copies of standards that are declared mandatory by certain ministries. Table 17: Sales of Standards by SSMO 2012-2014
Year Unit Price in
Sudanese Pounds No. of standards
sold Total Amount in
Sudanese Pounds
2012
150 598 89 700
2013
65 577 37 505
2014 until 12.3.2014
65 72 4 680
TOTAL 1 247 SDG 131 885
Source: Author’s own compilation, based on local data obtained in January 2014. Note: The unit price of standards was dropped in 2013 in an attempt to increase sales and use of standards.
244. The complete catalogue of Sudanese Standards is available only in Arabic. Some 3,000 standards have been approved and are considered current; each year some 400 new standards are approved, of these about half are formal revisions of already existing standards to bring them in line with changes in the market – in 2013, 384 standards were approved of which

83
174 were revisions. This number is comparable with economies of similar size. The catalogue is available on the SSMO website with standards classified by the technology unit responsible for approval. There is also a search function to allow customers to search for standards by subject and SDS number. A list of some 450 translated standards was provided and SSMO is working on a program to ensure that as new standards are approved, they are available in both Arabic and English, this will improve the transparency of the standards. 245. There is also collection of 434 translated published standards of which 17 were clearly adopted from ISO or IEC standards. For the remainder, it is not clear if they are adopted or if they have been adapted from foreign standards or if they are unique. If they differ from international standards no record is made as to how they deviate. The WTO TBT code of good practice on standards development requires that when national standards deviate from international norms in the same area, this should be notified. Guidance on a transparent way of adopting international standards is provided in ISO/IEC guide 21:2010 (Regional or National Adoption of International Standards). According to the Standards Administration staff at SSMO the organization is committed to aligning with international norms and in particular aligns its standards with those set by the CODEX Alimentarius commission for food and food products. Regional Standards such as those of COMESA, the European Union (CEN/CENELEC), AIDMO (Arab Industrial and Mining Organization) and SMIIC (Standards and Metrology Institute for Islamic Countries). 246. There is scope to increase adoption of more international standards where possible and enforce requirements in unique national standards to follow international practices on drafting standards. International standards undergo a rigorous technical review as part of their development which seeks to eliminate problems associated with incorrect referencing of requirements. The risk is reduced if the international standards are adopted as national standards. However, in cases when standards need to be drafted to serve unique national needs, the standards development department should adopt editorial guidelines in line with international best practice. Guidance on the drafting of standards as contained in the ISO Directives part 255, is available to members of ISO wishing to amend their own procedures and should be incorporated as part of the editorial policy. 247. There is scope to significantly reduce the number of standards deemed mandatory and increase the number of voluntary standards as well as to harmonize processes with the code of good practice for standardization in the WTO TBT agreement. The SSMO have requested training programs for their staff on the implementation of the code of good practice. As a rule of thumb, standards should be selected more based on needs identified by industry rather than SSMO or other regulators (See Box 2). The provisions of the WTO TBT agreement guide its members how to develop, implement and enforce technical regulations in such a way that reduces unfair and unnecessary barriers to trade in order to open up its markets while at the same time maintaining adequate levels of protection. The agreement promotes the use of National Standards to refer to technical requirements of technical regulations and Annex 3 of the agreement outlines56 how these standards should be developed.
55http://www.iso.org/iso/standards_development/processes_and_procedures/iso_iec_directives_and_iso_
supplement.htm 56
http://www.wto.org/english/docs_e/legal_e/17-tbt_e.htm

84
While the SSMO procedures follow most of the requirements the areas where they are at variance are outlined below.
248. SSMO is a full member of the International Organization for Standardization (ISO) and currently serves on 12 international technical committees. Through the international relations function at the SSMO, participation in international standards organizations is coordinated and maintained. The participation in international committees is currently focused on areas that seem strategically important to the economy. At this stage include: cement, food; environmental management, and information and documentation. There is no clear process in place to describe how SSMO chooses which technical committees to be involved in, and it does not track how effective its participation in the process has been. Some national standards bodies have established advisory forums or advisory or steering committees that help to set
Box 2: Technical Committees for Standards Members of technical committees are appointed by the General Manager responsible for Standards Administration according to tightly defined guidelines laid out in the Standards and Metrology act of 2008. The act makes provision for a cross section of membership from private sector, academics and industry experts, consumer protection societies and regulators. Committees are kept small (limited to 7 persons) although allowance is made for additional members to join upon request, however, this is subject to approval. SSMO has good participation by its stakeholders represented on its technical committees. The technical committees cover most areas of the economy with each covering quite a wide spectrum of work and meet on a very regular basis, the organization claims that the committees each meet every week (which is well above international practice). Representatives serving on the committees are recompensed at a defined rate; this is not uncommon in countries where the majority of standards users are more likely to be affected by standards than driving an agenda to set standards to their own advantage (Standards “takers” rather than standards “makers”) but the market relevance of the standards being developed can sometimes be questioned. The technical committees fall into the areas as follows Standards development is currently dominated by the regulators, drafts are not publicly circulated, insufficient time is allowed for comment, and the standards do not generally follow international standards. The work is carried out in committees of not less than 7 (seven) members who represent the interests of the different stakeholder groups although it should be noted that the interests of regulators tend to dominate these committees with Industry being represented by a single seat from the Businessman’s Federation and consumers on the whole are very poorly represented. During the final enquiry phase of the development process, drafts of the standard are circulated to parties who the committee identifies as “possibly having an interest” for their comment and approval, drafts are not circulated publically or made available to possible stakeholders outside of Sudan (the code of good practice requires that a public enquiry forms part of the process). The prescribed comment period of 60 days for members of the public or interested parties outside the country who may be affected by the publication of the standard, is not maintained. The draft standards and technical regulations are not currently being ‘Notified’ to the WTO TBT committee via the National Enquiry point as required in the WTO TBT agreement. Most of published Sudan standards are not adoptions of international standards. The WTO Code of Good Practice strongly advises that international standards be used as the basis for technical regulations. Furthermore, the current standards work program across all the committees is not made available publically within Sudan or to the trading partners of Sudan as required by the code. Overall, there is scope to review committee procedures in order to improve the openness of the process and to ensure full compliance to the substantive provisions of the WTO TBT Code of Good Practice for standards development. This would allow stakeholders who have a legitimate interest in the standards being developed to make their input and have their voice heard either directly or through legitimate representative structures.

85
national priorities and identify which committees to be involved in in order to achieve those priorities. 249. While the Sudanese standards are published by the SSMO, it is not assumed that the standards are exclusively for the enforcement by the SSMO. For example standards that include the requirements for medical products are enforced by regulators under the Ministry of Health. This is in line with international best practice for technical regulations where a single collection of national standards is referred to by all regulators but in Sudan the coordination between the different regulators is at times problematic. The problems associated with this approach include:
Not all of the standards published in the standards catalogue are suitable as technical regulations – they include standards methods on how to determine parameters and basic procurement type standards (such as SDS 161:2013 Sports Socks for Sudanese army and police forces).
Some of the standards are not enforced at all (by SSMO or other regulators) creating confusion as to which of the remainder of the collection must be adhered to (such as standard test methods although commencing in 2013 the SSMO began to provide these to the Food Research Center, National Health Lab and other regulators).
Some aspects of the standards are enforced by more than one regulator (such as maximum levels of Aflatoxin which is measured in ground nuts by both the SSMO and the Ministry of Agriculture).While the SSMO test Aflatoxin levels for import/export purposes and the Ministry of Health for Safety purposes, it is the same test and is therefore duplicative.
250. The standards do not allow for alternate ways of demonstrating conformity. In the case of the English translations of SDS standards provided, nearly all contain provisions that state that the “product shall be tested” and list or reference a single method to be used for the test. Comments received from members of the private sector and other laboratories operating in Sudan suggest the test methods chosen are based on what SSMO is able to test rather than the risks associated with the product or current developments in the field. This practice implies that if a product is not tested AND the prescribed test method is not used, it does not conform to the requirements of the standards and, by extension since the standard is mandatory, the producer or seller who cannot provide evidence, does not comply with the law. Current best practice would allow for flexibility and can be overcome by redrafting the requirements. The unofficial English translation of the Standards and Metrology Act of 2008 provides for flexibility by allowing the tests undertaken in verifying conformity to be selected based on risk and for a mechanism of recognizing the equivalence of the results obtained using alternative test methods and places the authority for this with the SSMO but the current wording of the standards undermines these provisions.
Conformity Assessment and Accreditation 251. Within the SSMO the Standards Administration Department performs the function of Conformity Assessment. As part of this function test reports and certificates of analysis issued by laboratories and certification bodies other than SSMO are assessed in order to issue a certificate of conformity for the product or consignment. In this process the SSMO officers assess the claims, the competence of the bodies making them, and the test methods and standards referred to. In cases where standards other than Sudanese National Standards (SDS) are used, the unit consults with members of the technical committee to make a judgment

86
as to whether the standards used achieve the same objectives as the SDS. The accreditation status of the issuers is verified and taken into account when making the assessment. 252. The process for equivalence certificates is used for a variety of imports and is in high demand. The high demand for these certificates highlights the extent to which the SDS standards and conformity assessment procedures are not aligned with international norms and practices. Locating the issuing of equivalence certificates in the standards administration ensures a clear separation from the testing laboratories. This is important as there is a potential conflict of interest if the testing laboratories administered the certificate of conformity as they have an interest in maximizing the number of test results. While the process appears to be useful in reducing procedural barriers brought about as a result of the different standards, a concern raised by Industry is that it is simply another cost and procedural delay standing in the way of importing products, the demand for the service would be significantly reduced if the appropriate standards could be aligned with international norms. 253. The SSMO has entered into recognition agreements with several International inspection bodies that carry out pre-export verification (PVoC) in the countries of origin for products imported into Sudan. Multinational inspection bodies such as Bureau Veritas57 are recognized as well as bodies that concentrate on countries or regions from where several products are imported such as the Gulf States and China. Although these agreements are in place, the inspectors operating at ports of entry into Sudan still carry out inspections on all consignments. Indeed the ‘double check’ by SSMO is stated in the agreement signed with the international inspection company. Noteworthy, the inspectors do acknowledge that the PVoC reduces the risk of non-compliance so the verification inspections are often limited to very superficial checks. Inspection fees are still charged and the procedural delays associated with these inspections are a source of frustration to importers and customers of imported products. If the pre-shipment clearance process is not trusted, a better model would be to hold the PVoC partners more accountable for their action and performance, for this reason in other countries where the PVoC model is used, the number of partners is kept low and restricted to those that have a juristic presence in the country so that they can be made to answer for their performance in the countries courts if need be. 254. The Standards Act (2008), and the Metrology Act of (2008) makes provision for the SSMO to be the national point in Sudan responsible for accreditation. The organization formally recognizes certificates and test reports and enters into recognition agreements with inspection bodies outside the country for the purposes of pre-export verification of conformity schemes as mentioned above. However, there is no formal accreditation body operating in the country at this stage. The function of an accreditation body is to formally recognize the competence of conformity assessment bodies and test laboratories and to enter in to mutual recognition agreements (and multi-lateral arrangements) with other countries to ensure that claims of conformity made by bodies in Sudan are recognized and accepted at face value outside the country.
57 SSMO informed the consultants that two ‘well known’ international companies offering inspection services had
been excluded from Sudan because of misconduct by their local agents.

87
255. Accreditation is a formal process of recognizing the competence of laboratories and other providers of conformity assessment services and is normally independent of the functions being recognized. At this stage the SSMO is the largest provider of conformity assessment services in the country. There are other laboratories operating in the country but SSMO covers most of the market for conformity testing in the country with some 20 laboratories as part of the group. The Standards and Metrology act of 2008 provides for SSMO to host the Accreditation Committee or Council which will represent the main institutional vehicle for establishing an independent Accreditation Body. This arrangement might be regarded as a significant conflict of interest if the Accreditation department and the bodies that it recognizes as being competent (the laboratories, certification and inspection services offered by SSMO) are not functionally independent of one another. In order for accreditation to function efficiently (and in accordance with international best practices) it is necessary for decisions to be made without fear or favor to both business units within SSMO and its competitors. 256. Sudan should consider establishing an accreditation focal point with powers to enter into agreement with trading partners with accreditations based on service bodies outside the country. The small number of clients in Sudan would caution against creating a new accreditation institution independent of the SSMO. ISO has developed guidance for developing countries to consider establishing a quality infrastructure and financing National Standards bodies58in which they note that experience with many international accreditation bodies suggests that they require a significant number (more than 100) of clients before they can operate in a sustainable manner. A standalone accreditation body for Sudan with only a few possible laboratories being accredited is not viable at this stage and instead the country should consider an accreditation focal point in the country to formally enter in to agreements with trading partners but will base accreditations based on the services of bodies outside the country. A cooperative model has been proposed in the Southern African region with some degree of success, the model could be replicated in other regions through bodies such as COMESA or EAC.
Product and System Certification 257. International certification bodies are operating in Sudan and several organizations have been certified to international management systems standards. The ISO international survey of accredited certificates issued in 2012 shows that in Sudan 84 companies are certified to the ISO 9001 quality management system; 14 to ISO 14001 Environmental Management systems and 3 to ISO 22000 Food quality management systems. The certification activity is largely driven by export markets and has remained relatively constant over the last few years despite economic sanctions and the independence of South Sudan (Figure 30).
58 ISO.or(2010) Financing NSBs – ISBN 978-92-67-10534-5
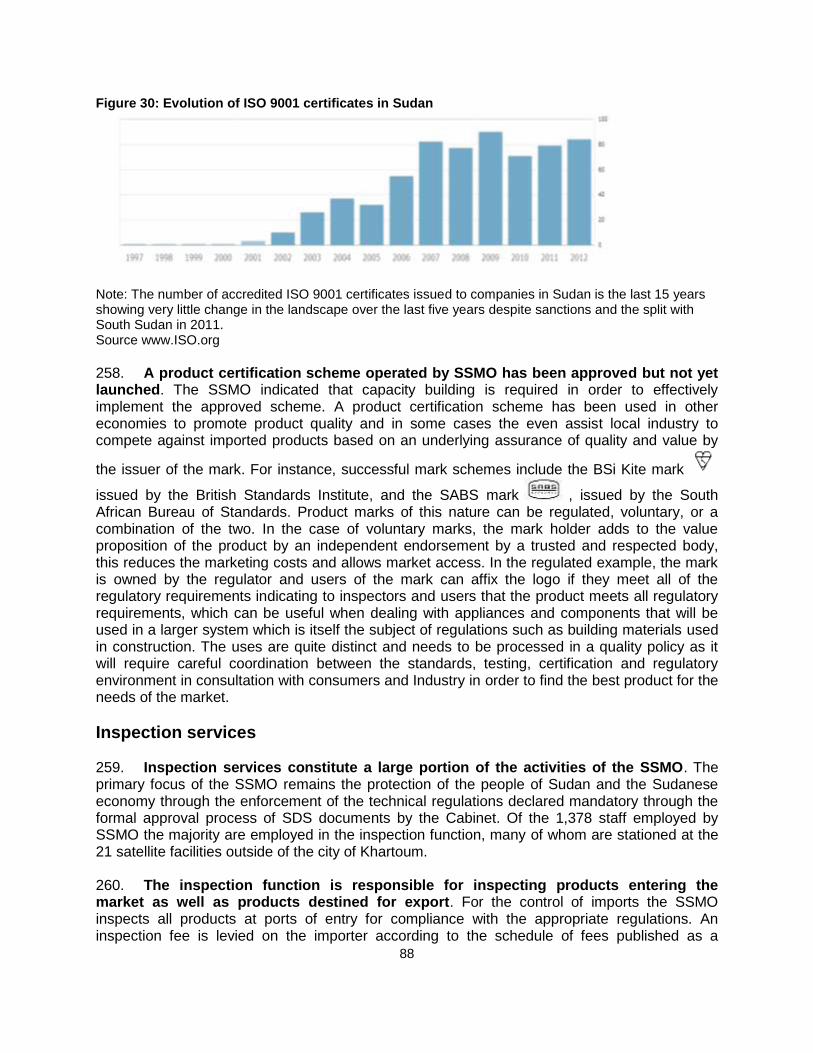
88
Figure 30: Evolution of ISO 9001 certificates in Sudan
Note: The number of accredited ISO 9001 certificates issued to companies in Sudan is the last 15 years showing very little change in the landscape over the last five years despite sanctions and the split with South Sudan in 2011. Source www.ISO.org
258. A product certification scheme operated by SSMO has been approved but not yet launched. The SSMO indicated that capacity building is required in order to effectively implement the approved scheme. A product certification scheme has been used in other economies to promote product quality and in some cases the even assist local industry to compete against imported products based on an underlying assurance of quality and value by
the issuer of the mark. For instance, successful mark schemes include the BSi Kite mark
issued by the British Standards Institute, and the SABS mark , issued by the South African Bureau of Standards. Product marks of this nature can be regulated, voluntary, or a combination of the two. In the case of voluntary marks, the mark holder adds to the value proposition of the product by an independent endorsement by a trusted and respected body, this reduces the marketing costs and allows market access. In the regulated example, the mark is owned by the regulator and users of the mark can affix the logo if they meet all of the regulatory requirements indicating to inspectors and users that the product meets all regulatory requirements, which can be useful when dealing with appliances and components that will be used in a larger system which is itself the subject of regulations such as building materials used in construction. The uses are quite distinct and needs to be processed in a quality policy as it will require careful coordination between the standards, testing, certification and regulatory environment in consultation with consumers and Industry in order to find the best product for the needs of the market.
Inspection services 259. Inspection services constitute a large portion of the activities of the SSMO. The primary focus of the SSMO remains the protection of the people of Sudan and the Sudanese economy through the enforcement of the technical regulations declared mandatory through the formal approval process of SDS documents by the Cabinet. Of the 1,378 staff employed by SSMO the majority are employed in the inspection function, many of whom are stationed at the 21 satellite facilities outside of the city of Khartoum. 260. The inspection function is responsible for inspecting products entering the market as well as products destined for export. For the control of imports the SSMO inspects all products at ports of entry for compliance with the appropriate regulations. An inspection fee is levied on the importer according to the schedule of fees published as a

89
regulation under the Standards and Metrology Act. The fees collected through the issuing of licenses fund the operation of the SSMO. While small income is obtained from the sale of standards and testing and certification done for commercial clients. The SSMO employs several inspectors to inspect batches of products related to the licenses requested. The organization maintains several laboratories that test samples drawn by the inspectors in support of the licensing and inspection process. Not all of the products for which licenses are issued are tested. Tables 18 and 19 below indicate the number of samples received for analysis by the laboratories in support of the inspection activities. The figures show that the inspection activities related to imported products far exceed those of exported products. SSMO indicates that the bulk of the work is concentrated at Port Sudan, Halfa and the Quality Assurance and inspection administration in Khartoum. Table 18: Samples of imports during the years 2012-2013
Year Soba Branch
Garri Branch
Airport Branch
Branches income
Release and Bond Total
2012 1,848 820 52 725 405 3,850
2013 2,342 943 26 842 371 4,524
Source: Compiled by DTIS Team, based on local data obtained in January 2014. Unfortunately data was not available for the larger locations at Port Sudan, Halfa and Khartoum. Table 19: Samples for exports during the years 2012-2014
Year Sent Samples Non –conformed samples Rejected Samples
2012 512 39 4
2013 607 51 9
4102 57 3 4
Source: SSMO.
261. The inspectorate function controls all imported and export consignments, issuing licenses for each. 59 Press reports60 indicate that SSMO issued 64 873 import licenses and 5 211 exportation permits in 2013. With such a high number of certificates being issued, one would expect that if the inspections were supported by test results, that the laboratories would be busier than they are at present. The tables of samples shown above indicate that roughly 10 percent of the licenses issued are inspected by the laboratories of SSMO (5,211 export permits and 600 samples tested; 65,000 import permits and 4,500 samples tested). 262. Products destined for export are inspected by the SSMO, levies charged and export licenses provided prior to clearance. The Inspection and Quality Control unit will test against the customer specifications for the exported product or, in the absence of these, will make use of an appropriate SDS. The program is intended to help exporters to access international markets and at the same time protect the reputation of the local economy by controlling the quality of exported products. Interviews with the local manufacturers and exporters however indicated that the industry found very little value in this service, stating that their clients did not recognize the analyses provided by SSMO often requiring that the tests be repeated on receipt. Industry expressed concern at both the cost and administrative delay
59 The mandate of the SSMO also extends to the granting of licenses for the export and import of
precious metals. In 2013 the SSMO reported analyzed 20,256 kilograms of Sudanese Central Bank exported gold bullions, and a further 4,595 kilograms from local companies 60
Source: www.Sudan safri.net accessed 26 January 2014.
90
incurred as a result of this process. The issuing of export licenses based on conformity to technical regulations is a technical barrier to trade that imposes additional costs on Sudanese exporting companies. The blanket regulation of exports reduces the competitiveness of exports. 263. The WTO and international best practice allows for exceptions to be applied when protecting vulnerable activities such as antiquities, archaeological, and religious and cultural artefacts; scarce and non-renewable resources (such as hard-wood species), and knowledge systems (such as traditional medicines and cures). Table 19 above was supplied by the export quality unit of SSMO and indicates the number of samples inspected for export purposes in the previous two years and in the first two months of 2014. It is interesting to note that less than 10 percent of samples do not conform to the stated standard and that the process allows for the samples to be reworked or reclassified prior to the export license being granted – the resultant percentage of rejected export licenses is low. 264. The Inspection and Quality Control department inspects all domestically produced products at the production site and all imported products at the point of entry into Sudan. SSMO has a presence at all border posts and a team of inspectors operating in the field to carry out inspections of all import consignments and production lots. Inspectors collect inspection fees on samples as prescribed in the regulations to the SSMO act published in 2012 and if they are of the opinion that it is required for samples to be tested, they draw the appropriate samples for further processing. Inspection fees are collected on all lots subject to the inspection levy but not of all of these are sampled and tested. 265. Samples drawn through the inspection process are prepared for analysis by the inspectors before being received by the labs for analysis. This process ensures that the labs do not have direct contact with the parties submitting their samples and in many cases do not know if the products are local or imported or if the products are destined for local consumption or export. This is positive as it reduces the risk of lobbying and encourages impartial test results. 266. High levels of taxation and fee collection as well as procedural delays stemming from extensive and uncoordinated inspection activities are a hindrance to private sector development and growth. Members of the Businessmen Federation as well as its Chamber of Industries express concern over the lack of coordination and recognition between regulators. Anecdotal evidence suggests that in the food industry regulators from SSMO as well as those from the Ministry of Agriculture and Irrigation take samples and conduct the same tests against the same standards before releasing consignments. The differences in testing between the SSMO and the Ministry of Agriculture and Irrigation are not clearly understood by the private sector. 267. Improved coordination between regulators could lower time requirements and cut cost in inspection services related to standards. And in fact, the SPS steering committee within the Ministry of Agriculture and Irrigation is beginning to address the coordination of regulations related to food products and animal preparation, and similar programs should be put in place to deal with technical barriers to trade issues. Further, the Ministry of Agriculture and Irrigation has established a WTO accession unit. Significant progress has been made in agreeing to a common food protection strategy and improving harmonization of the associated technical regulations. While a number of laboratories are in place to support the regulation of the food industry in Sudan, many of them are quite poorly resourced and attention needs to be placed not only on the enforcement of regulations but also on the provision of a reliable and
91
SSMO Testing Areas
General Chemistry Milk and Milk products Lubricants and oils Carbohydrates Cereals products Gum and Gum products Water and mineral salts Aflotoxin Medical and pharmaceuticals Environmental Microbiological Multi-purpose devices Textiles Children’s toys Paints Ceramics and Porcelain Cement Steel Electrical and electronics Plastics Pesticides Fertilizers and pesticides residues Genetically modified organisms (GMO)
transparent testing resource to support the development of agricultural products and the associated processing industries.61
Metrology Services 268. SSMO is mandated to provide measurement traceability to the Sudanese market. However, the laboratories are not accredited and currently are not capable of delivering traceability to the accuracy levels needed in high technology industries. There are also other parameters that are needed and not available through SSMO at the moment. Industry and the testing community alike obtain a lot of their traceability from metrology laboratories outside the country and include facilities in Egypt, South Africa, France and the Gulf states. SSMO has signed several bilateral agreements and has recently joined OIML and BIPM with the aim of enhancing measurement traceability in Sudan.
269. SSMO has the mandate to control enforce legal metrology regulations in the country. The inspectors issue permits for new measuring devices and instruments entering the country however very little post market surveillance of the performance of measuring devices in the market place takes place. The legal metrology division does not have the staff, the equipment or resources to effectively police the market and effectively cover the market in order to provide confidence in the trading infrastructure in the country. While the legislation provides the mandate to enforce the regulations, inspections do not occur frequently and the body relies on complaints by aggrieved citizens in order for it direct its activities. Culturally however, Sudanese citizens are reluctant to lodge formal complaints or report their colleagues for transgressing laws, to the authorities. Without sufficient market intelligence the inspectors are not able to focus their efforts and do not succeed in identifying deceptive practices based on short measures. 270. Addressing private sector needs calls for the establishment of a reference laboratory in the country. A laboratory is needed that can provide, oversee or source measurement traceability for reference by both the public and provide sector. This is true as in some cases disputes between the in process labs of the
manufacturers and the labs of the SSMO and other regulators have arisen as a result of each getting different results when testing samples of the same product. Since the function of metrology forms the basis of reliable measurement and trust, it is important that the function is well established in the country and should be in a position to serve both the private and public
61 Economic sanctions pose certain challenges in terms of laboratories not being able to get access to
equipment, reagents and reference material in order for them to be effective in supporting technical regulations.
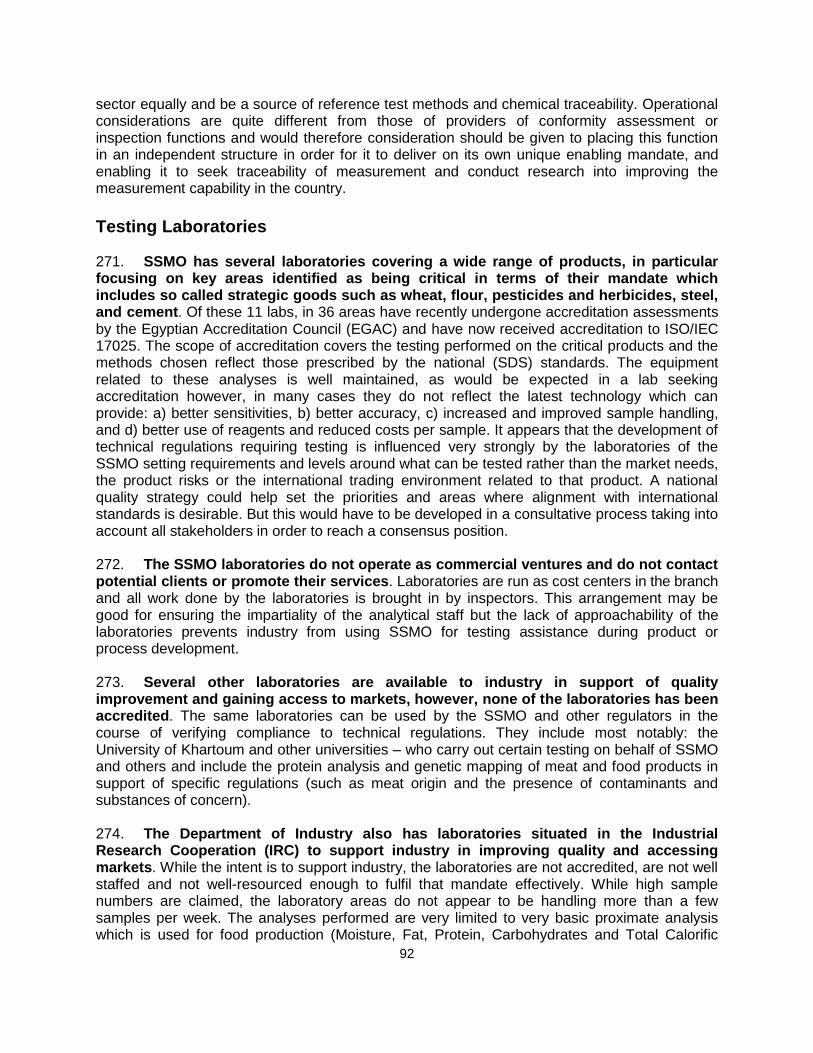
92
sector equally and be a source of reference test methods and chemical traceability. Operational considerations are quite different from those of providers of conformity assessment or inspection functions and would therefore consideration should be given to placing this function in an independent structure in order for it to deliver on its own unique enabling mandate, and enabling it to seek traceability of measurement and conduct research into improving the measurement capability in the country.
Testing Laboratories 271. SSMO has several laboratories covering a wide range of products, in particular focusing on key areas identified as being critical in terms of their mandate which includes so called strategic goods such as wheat, flour, pesticides and herbicides, steel, and cement. Of these 11 labs, in 36 areas have recently undergone accreditation assessments by the Egyptian Accreditation Council (EGAC) and have now received accreditation to ISO/IEC 17025. The scope of accreditation covers the testing performed on the critical products and the methods chosen reflect those prescribed by the national (SDS) standards. The equipment related to these analyses is well maintained, as would be expected in a lab seeking accreditation however, in many cases they do not reflect the latest technology which can provide: a) better sensitivities, b) better accuracy, c) increased and improved sample handling, and d) better use of reagents and reduced costs per sample. It appears that the development of technical regulations requiring testing is influenced very strongly by the laboratories of the SSMO setting requirements and levels around what can be tested rather than the market needs, the product risks or the international trading environment related to that product. A national quality strategy could help set the priorities and areas where alignment with international standards is desirable. But this would have to be developed in a consultative process taking into account all stakeholders in order to reach a consensus position. 272. The SSMO laboratories do not operate as commercial ventures and do not contact potential clients or promote their services. Laboratories are run as cost centers in the branch and all work done by the laboratories is brought in by inspectors. This arrangement may be good for ensuring the impartiality of the analytical staff but the lack of approachability of the laboratories prevents industry from using SSMO for testing assistance during product or process development. 273. Several other laboratories are available to industry in support of quality improvement and gaining access to markets, however, none of the laboratories has been accredited. The same laboratories can be used by the SSMO and other regulators in the course of verifying compliance to technical regulations. They include most notably: the University of Khartoum and other universities – who carry out certain testing on behalf of SSMO and others and include the protein analysis and genetic mapping of meat and food products in support of specific regulations (such as meat origin and the presence of contaminants and substances of concern). 274. The Department of Industry also has laboratories situated in the Industrial Research Cooperation (IRC) to support industry in improving quality and accessing markets. While the intent is to support industry, the laboratories are not accredited, are not well staffed and not well-resourced enough to fulfil that mandate effectively. While high sample numbers are claimed, the laboratory areas do not appear to be handling more than a few samples per week. The analyses performed are very limited to very basic proximate analysis which is used for food production (Moisture, Fat, Protein, Carbohydrates and Total Calorific
93
values). The limited scope of testing available to the industry does not offer much support when seeking to improve their processes.
Recommendations 275. Substantial regulatory reform in the NQI is required to support Sudan to compete in the current international trading environment. The quality infrastructure should be modernized taking into account current international best practice and the needs of stakeholders in the country. Currently all of the functions of the NQI are housed in the Sudanese Standards and Metrology Organization (SSMO) and virtually all trade goods entering or leaving the country are described by Sudanese National Standards (SDS). Further, all published SDS standards have been declared compulsory (technical regulations) which requires that the products described by these standards are subjected to inspection by SSMO inspectors and the suppliers of these products are liable to pay an inspection fee (a schedule of fees is gazetted, the latest version of which was published in 2012). Reforming the NQI requires implementation of the following recommendations:
276. First, in conformity with the new SSMO strategy increase the adoption of international standards as Sudanese National Standards and expend the role of voluntary standards in the Sudanese economy. Currently regulations are not aligned with international norms and the national quality infrastructure does not facilitate access to international markets. The enabling legislation should be reviewed to examine how to eliminate potential conflicts of interest between branches of the quality infrastructure can avoided. This should draw on best practice and the recent regulatory reforms provide a useful benchmark. 277. Second, more closely align Sudanese standards with international standards. The current collection of standards is not closely aligned with international standards, although national standards are developed based on international requirements and making use of international test methods, the requirements often differ potentially creating a technical barrier to trade. Full records of the alignment and deviation from international standards should be maintained for all published standards and should be reported. The standards catalogue should include reference to the source documents if the standards are adoptions and highlight the extent to which they differ, if they are adaptations of international documents. 278. Third, meet all of the requirements of the WTO TBT and WTO SPS agreements and accede to the WTO. The Standards development process should be reviewed in order to ensure that all substantive requirements of the code of good practice for standards development contained in annex 3 of the WTO TBT agreement are adhered to. The National SPS and TBT enquiry points should also be fully operational. 279. Fourth, promote the value of voluntary standards and voluntary conformity assessment in improving quality and accessing competitive markets. SSMO is currently promoting the value of the standards and quality to various organizations and groups, this promotional activity should also include its role in support of industry with the possible goal to increase this part of the business. The voluntary component will include voluntary standards testing, management certification and voluntary certificates. 280. Fifth, repeal the requirement for all products destined for export to be inspected by the SSMO in order to obtain the export license. This inspection for quality by SSMO should become a service offered to private firms on request rather. At present it is apparent that

94
many firms deem the testing unnecessary and question its relevance, other than to raise revenue for the SSMO. 281. Sixth, improve the degree of post market surveillance of legal weights and measures to ensure a reliable system of verification and consumer protection. A program should be launched to increase surveillance of measuring devices used in trade in the market place to increase consumer confidence and form the basis of improving quality. SSMO indicated it would benefit from technical assistance in this area. 282. Seventh, reform the regulatory framework by establishing a functionally independent metrology institute that can provide needed traceability and accurate reference measurements. Prioritize development of a National Metrology Institute to provide traceable and accurate measurement references to underpin the standards infrastructure.
95
Chapter 7: Opportunities for growth through diversification: Agriculture Overview of the Agricultural Sector 283. This chapter reviews Sudan’s agricultural trade patterns over the past five years focusing on the trends in imports and exports and identifying the major traded crops. The paper also will identify factors influencing the availability and price of agricultural inputs such as seeds, fertilizer and pesticides, and identify the trade costs and the role of standards in agricultural trade. Finally, based on the analysis of Sudan’s agricultural sector and taking into account political economy constraints the report identifies priority reforms and recommend possible sequencing including measures that can be implemented nationally and those that may be more effectively addressed at the regional level. 284. Agriculture provides a livelihood to approximately two thirds of the population, accounts for almost one third of GDP (2008-2012), and following the reduction in oil revenues after the secession of South Sudan represents the key to delivering growth, poverty reduction and sustainable development. Agricultural exports increased from 8 percent of total exports in 2011 to 23 percent 2013. Sudan’s main agricultural products are sorghum, cotton, groundnuts, sesame, millet, wheat, cane sugar, gum Arabic, and livestock. 285. The agricultural sector has the potential for significant growth. Sudan’s land is rich and fertile as it benefits from the proximity of the Blue and White Nile rivers and offers great potential for further development through both vertical (productivity) and horizontal (land area) expansion. Sudan’s land area is estimated at 446.4 million feddan62, with 30 percent suitable for agricultural production. Currently only 30 percent is utilized, approximately 40 million feddan is used for arable farming, 52 million feddan is forest and 118 million feddan is range land. 286. Agricultural crops and livestock at approximately 46 percent each account for more 90 percent of total output with forestry and fisheries representing 7 percent. Arable farming comprises three different systems: the traditional rain-fed sector; the mechanized rain-fed sector; and the irrigated sector. The other farming sectors are livestock, fishery and forestry. 287. Subsistence farming characterized by low productivity, the absence of new technology and modern farming practices, remains the dominant type of agriculture within Sudan. It occupies more than 60 percent of the total cultivated land (about 22 million feddan) and employs two thirds of the agricultural population. Characterized by private small-scale farms with access to considerable communal grazing areas that supports extensive livestock production. This farming system is mainly located in western states such as Kordofan and Darfur in addition to White Nile and Blue Nile states. It mainly produces sorghum, sesame, millet and practices pastoralism. This is reflected in its lower average contribution to the total agricultural GDP by only 14 percent during 2006-2009 (Table 20). The traditional rain-fed sector received few support services such as credit, research and extension. Public investments in basic infrastructure for rural and agricultural development are also negligible. The consequence
62 I hectare = 2.4 feddan
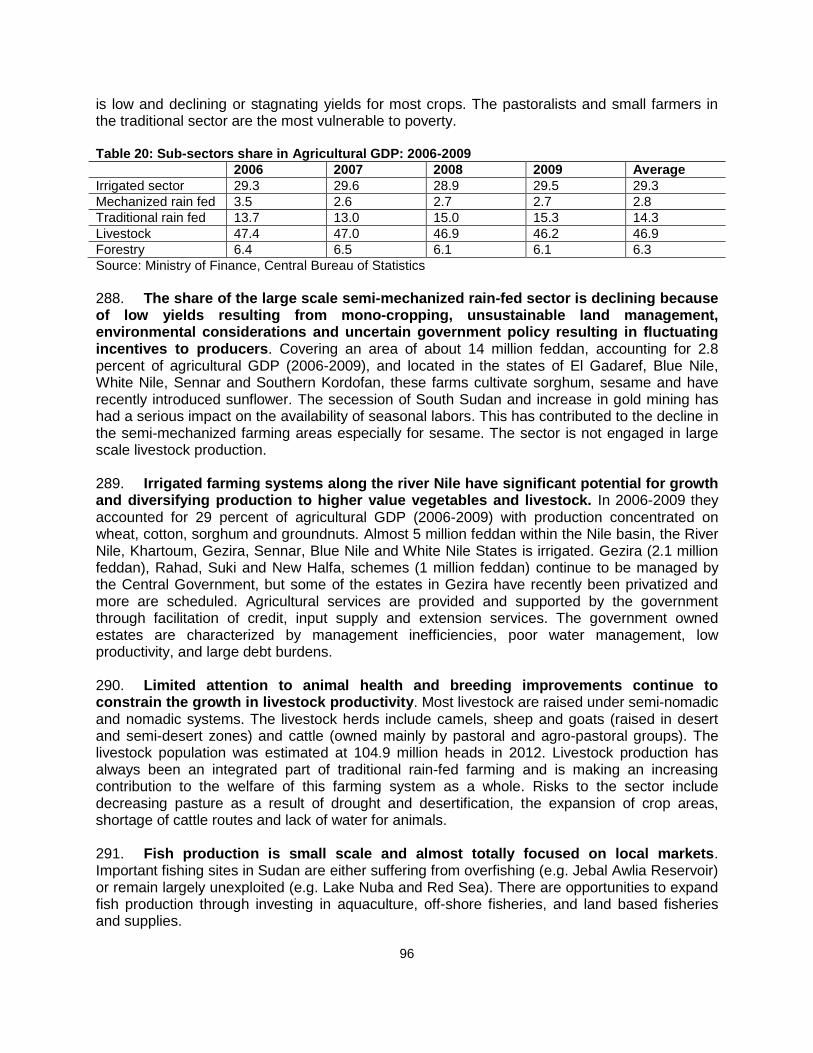
96
is low and declining or stagnating yields for most crops. The pastoralists and small farmers in the traditional sector are the most vulnerable to poverty. Table 20: Sub-sectors share in Agricultural GDP: 2006-2009
2006 2007 2008 2009 Average
Irrigated sector 29.3 29.6 28.9 29.5 29.3
Mechanized rain fed 3.5 2.6 2.7 2.7 2.8
Traditional rain fed 13.7 13.0 15.0 15.3 14.3
Livestock 47.4 47.0 46.9 46.2 46.9
Forestry 6.4 6.5 6.1 6.1 6.3
Source: Ministry of Finance, Central Bureau of Statistics
288. The share of the large scale semi-mechanized rain-fed sector is declining because of low yields resulting from mono-cropping, unsustainable land management, environmental considerations and uncertain government policy resulting in fluctuating incentives to producers. Covering an area of about 14 million feddan, accounting for 2.8 percent of agricultural GDP (2006-2009), and located in the states of El Gadaref, Blue Nile, White Nile, Sennar and Southern Kordofan, these farms cultivate sorghum, sesame and have recently introduced sunflower. The secession of South Sudan and increase in gold mining has had a serious impact on the availability of seasonal labors. This has contributed to the decline in the semi-mechanized farming areas especially for sesame. The sector is not engaged in large scale livestock production. 289. Irrigated farming systems along the river Nile have significant potential for growth and diversifying production to higher value vegetables and livestock. In 2006-2009 they accounted for 29 percent of agricultural GDP (2006-2009) with production concentrated on wheat, cotton, sorghum and groundnuts. Almost 5 million feddan within the Nile basin, the River Nile, Khartoum, Gezira, Sennar, Blue Nile and White Nile States is irrigated. Gezira (2.1 million feddan), Rahad, Suki and New Halfa, schemes (1 million feddan) continue to be managed by the Central Government, but some of the estates in Gezira have recently been privatized and more are scheduled. Agricultural services are provided and supported by the government through facilitation of credit, input supply and extension services. The government owned estates are characterized by management inefficiencies, poor water management, low productivity, and large debt burdens. 290. Limited attention to animal health and breeding improvements continue to constrain the growth in livestock productivity. Most livestock are raised under semi-nomadic and nomadic systems. The livestock herds include camels, sheep and goats (raised in desert and semi-desert zones) and cattle (owned mainly by pastoral and agro-pastoral groups). The livestock population was estimated at 104.9 million heads in 2012. Livestock production has always been an integrated part of traditional rain-fed farming and is making an increasing contribution to the welfare of this farming system as a whole. Risks to the sector include decreasing pasture as a result of drought and desertification, the expansion of crop areas, shortage of cattle routes and lack of water for animals. 291. Fish production is small scale and almost totally focused on local markets. Important fishing sites in Sudan are either suffering from overfishing (e.g. Jebal Awlia Reservoir) or remain largely unexploited (e.g. Lake Nuba and Red Sea). There are opportunities to expand fish production through investing in aquaculture, off-shore fisheries, and land based fisheries and supplies.

97
Trade Performance of Major Agricultural Exports 292. This section addresses the performance and factors influencing the production, marketing and trade of Sudan’s major agricultural exports. Prior to the discovery and exploitation of oil agriculture accounted for most of export revenues. Over the past five years agricultural exports have increased from 329 million US$ in 2008 to 1,625.9 million US$ in 2013, and the share in total export has increased from 3.3 percent in 2008 to almost 23 percent in 2013. Livestock and sesame seeds now account for more than two thirds of the total agricultural exports, while the traditional staples of Gum Arabic and Cotton have seen their relative shares decline over the period 2008-2013. 293. The livestock sector remains under- exploited due to lower productivity as production is dominated by subsistence rather than commercial production. More than 80 percent of the Sudanese rural population relies on rain-fed traditional farming and associated livestock rearing for their livelihoods. There are about 39 million sheep, 30 million goats, 29 million cattle and 4 million camels in Sudan with positive yearly growth rate. Livestock are raised in almost all parts of Sudan, but mostly concentrated in western Sudan (Kordofan and Darfur states) and owned by nomadic tribes production requires increasing stocking rates. The degradation of the rangeland has exacerbated the conflict over land between pastoral groups and farmers especially in Darfur. Realizing the potential for growth requires investments in conflict resolution, rangeland management, and increasing technical inputs in modern livestock management. 294. Livestock export has become an increasingly important part of the economy competing with cash crop sales as the fastest growing non-oil export sector. There is a surge in commercial livestock marketing of camels, goats, sheep and cattle which connected with strong export demand from Sudan main trade partners namely Saudi Arabia, Egypt, and other Gulf states. The strong demand for Sudanese livestock has been underpinned by the Sudan government’s commitment to rehabilitate the livestock export facilities through the provision of veterinary services and quarantine centers. 295. Livestock exports increased almost tenfold over the period 2008-2013. Table 21 summarizes Sudan’s recent export values of livestock products and indicates that the growth is led by the increase of sheep exports from $44 million in 2008 to $477 in 2013, primarily to Arab countries. Live sheep exports account for more than 70 percent of livestock exports and are mainly destined for Saudi Arabia and to a lesser extent the United Arab Emirates and Lebanon. The export of live camels, across the border to Egypt accounted for 14 percent of livestock trade. While hides and skins at 10 percent of livestock export are sold to a wide range of countries including United Kingdom, China, United Arab Emirates, Turkey and Saudi Arabia. Meat exports destined mainly for the UAE, Egypt, Qatar and Jordan exhibited large annual fluctuations and have declined from a peak in 2010, primarily because of the inability to compete with other suppliers due to high cost, quality consideration and unreliable supply63.
63 No cold or frozen meat is exported from Sudan because of inadequate abattoirs, handling and transport
facilities for chilled meat. Small assignments of whole carcass of sheep and goats and quarter carcass of beef are exported through special arrangement between exporters and importers.

98
There is a good opportunity to generate more income and value added from meat exports if these constraints are addressed. Table 21: Livestock Export Value and sub-sector share: 2008-2013
Sheep %
Goats %
Camels %
Cattle %
Meat %
Hides and skins %
Total ($m)
2008 90.0 1.2 1.2 0 1.0 6.5 49.2
2009 72.4 2.6 12.1 1.6 4.6 8.2 202.1
2010 60.5 2.7 6.6 1.4 22.8 7.3 190.9
2011 69.8 2.3 11.6 1.5 5.0 11.1 357.8
2012 66.1 2.1 14.4 3.3 8.8 8.5 432.0
2103 70.0 1.5 14.4 1.1 2.2 10.6 681.9
Source: Bank of Sudan Annual Reports and trade digests
296. Progress in the vaccination and inspections program for sheep destined for export64 adopted by the Ministry of Livestock has been sufficient to prevent any import bans or restriction being imposed by Saudi Arabia and the other GAFTA markets since 2007. The livestock diseases prevalent in Sudan require all animals to undergo quarantine, testing and vaccination before export and before slaughtering if the meat is to obtain an international health certificate. The SPS requirements for the export of livestock are shown below in Table 22. Table 22: Quarantine, Inspection and Vaccination Regime for Sheep Exports
Location/timing Activities
Inspection and vaccination close to production area
First veterinary inspection and vaccination. Animals held in an inspection center under observation for 7–10 days.
Entry into a quarantine area Second inspection at inland quarantine station by veterinarians. Blood sample taken from every animal for brucellosis testing. Animals held for 7–10 days.
Inspection on the way to the port
Third animal inspection in quarantine area by veterinarian. The group of animals receives three certificates: for number of animals, free from infectious and noninfectious diseases, and for animals in good health.
Prior to loading on ships Fourth inspection seven days prior to shipment. Animals are held in quarantine and inspected to verify that they have no evidence of infectious or noninfectious disease and not generally weak.
Animals with a certificate are eligible to be loaded on ships
If animals pass this final inspection all animals intended for export are issued with an international animal health certificate
Source: DTIS 2008.
297. Expanding meat exports continues to be constrained by substandard meat processing facilities and practices. Increasing meat exports would eliminate the SPS hurdles involved in exporting live animals and increase value added in Sudan. At present, the meat processing facilities in Sudan primarily supply the domestic market and do not have either the capacity or the quality to meet foreign markets SPS requirements.
64 The program was approved by the Saudi authorities and requires 100 percent testing of all animals
bound for export.
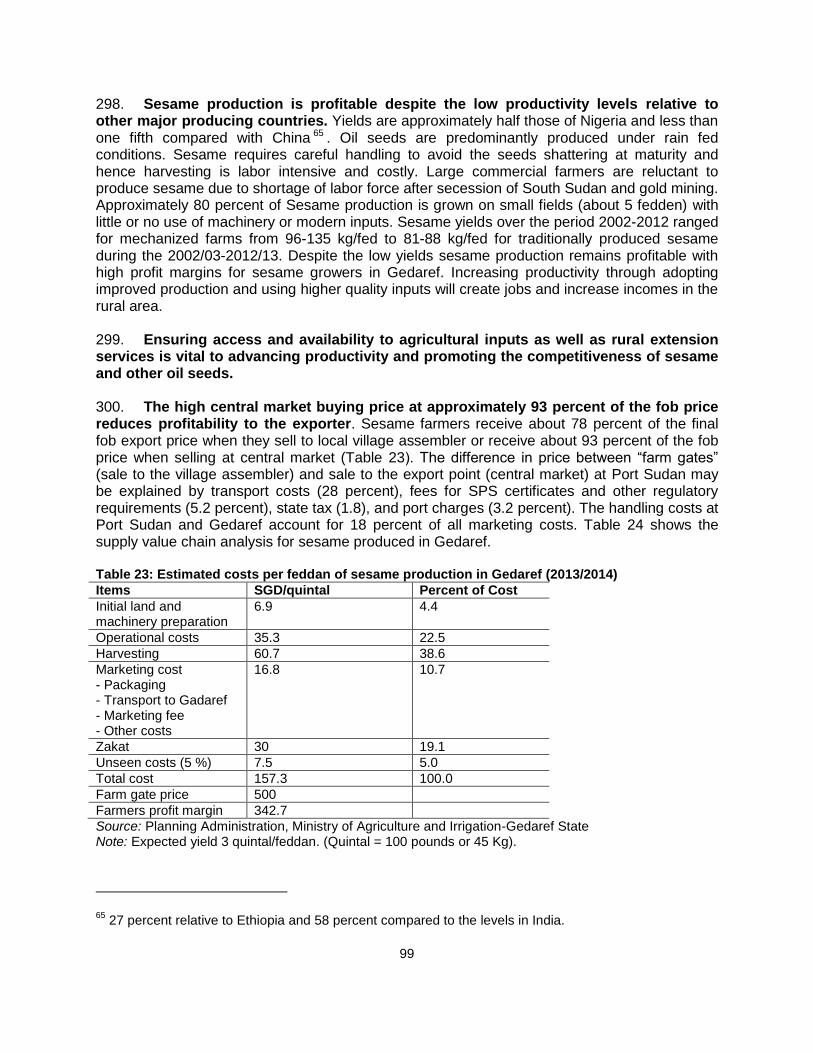
99
298. Sesame production is profitable despite the low productivity levels relative to other major producing countries. Yields are approximately half those of Nigeria and less than one fifth compared with China 65 . Oil seeds are predominantly produced under rain fed conditions. Sesame requires careful handling to avoid the seeds shattering at maturity and hence harvesting is labor intensive and costly. Large commercial farmers are reluctant to produce sesame due to shortage of labor force after secession of South Sudan and gold mining. Approximately 80 percent of Sesame production is grown on small fields (about 5 fedden) with little or no use of machinery or modern inputs. Sesame yields over the period 2002-2012 ranged for mechanized farms from 96-135 kg/fed to 81-88 kg/fed for traditionally produced sesame during the 2002/03-2012/13. Despite the low yields sesame production remains profitable with high profit margins for sesame growers in Gedaref. Increasing productivity through adopting improved production and using higher quality inputs will create jobs and increase incomes in the rural area. 299. Ensuring access and availability to agricultural inputs as well as rural extension services is vital to advancing productivity and promoting the competitiveness of sesame and other oil seeds.
300. The high central market buying price at approximately 93 percent of the fob price reduces profitability to the exporter. Sesame farmers receive about 78 percent of the final fob export price when they sell to local village assembler or receive about 93 percent of the fob price when selling at central market (Table 23). The difference in price between “farm gates” (sale to the village assembler) and sale to the export point (central market) at Port Sudan may be explained by transport costs (28 percent), fees for SPS certificates and other regulatory requirements (5.2 percent), state tax (1.8), and port charges (3.2 percent). The handling costs at Port Sudan and Gedaref account for 18 percent of all marketing costs. Table 24 shows the supply value chain analysis for sesame produced in Gedaref. Table 23: Estimated costs per feddan of sesame production in Gedaref (2013/2014)
Items SGD/quintal Percent of Cost
Initial land and machinery preparation
6.9 4.4
Operational costs 35.3 22.5
Harvesting 60.7 38.6
Marketing cost - Packaging - Transport to Gadaref - Marketing fee - Other costs
16.8 10.7
Zakat 30 19.1
Unseen costs (5 %) 7.5 5.0
Total cost 157.3 100.0
Farm gate price 500
Farmers profit margin 342.7
Source: Planning Administration, Ministry of Agriculture and Irrigation-Gedaref State Note: Expected yield 3 quintal/feddan. (Quintal = 100 pounds or 45 Kg).
65 27 percent relative to Ethiopia and 58 percent compared to the levels in India.

100
Table 24: Value chain analysis for sesame marketing from Gedaref to Port Sudan ( Jan. 2014)
Activities SDG/Ton Percent of total marketing cost
Percent of FOB price
Farm gate price 11,110 78.5
Buying prices (central market) 13,200 93.2
Marketing cost:
- Handling and grading 81.5 13.2
- Sacks and strings 60 9.7
- SSMO export certificate 6.1 1.0
- Quarantine certificate 3 0.5
- Transport to Port Sudan 130 21.1
- Transport value added tax (17.5% from transport cost)
22.75 3.7
- Transport fees (20% from transport cost)
26 4.2
- Handling at port 30 4.9
- Port fees 20 3.2
- Sterilization fee 5 0.8
- Certificate of origin fee 5 0.8
- Phyto-sanitory certificate fee 3 0.5
- International accredited cert. fee 9 1.5
- Export fee (state level) 11 1.8
Total marketing cost 616.5 4.35
Sub-total cost 13,614.3
Insurance (1.5%) 204.2
Total cost 13,818.57
FOB price 14,160
Net margin 341.4 2.41
Source: Compiled from data collected during main mission * The average local price during January is700 SDG/Quintal, and average world price is 2400 US$/Ton. 301. Sudan exports about two third of its sesame production, and is among the main exporters of sesame seeds worldwide (Table 25). Exporting countries include India, Ethiopia, Nigeria, Sudan, China, Paraguay, Myanmar, and Mexico. Sudan ranks second after India in area cultivated. With 10 percent share in total world export of sesame, Sudan’s ranked fourth after Nigeria, India and Ethiopia who had 38, 20 and 16 percent share of the market in 2010. Table 25: Sesame export value and quantities: 2008-2013
Export Share
Quantity Value Unit value Agricultural exports
Total exports
(1000 ton) (million US $) US $/Ton (percent) (percent)
2008 96.7 141.9 1467.4 36.1 1.2
2009 137.6 143.3 1041.4 31.2 1.7
2010 224.1 167.3 746.5 38.2 1.5
2011 211.8 231.0 1090.6 30.2 2.4
2012 208.9 223.5 1069.8 28.5
6.6
2013 242.7 472.7 1947.6 29.0 6.6
Average 186.6 229.9 1227.2 32.2 3.3
Source: Central Bank of Sudan Annual Reports (various issues), and Trade Digests (various issues).

101
Table 26: Direction of sesame trade: 2012-2013
Country 2012 2013
Value (000 US $) Share (%) Value (000 US $) Share (%)
Industrial countries (Greece, Netherland, Ireland, United kingdom)
16590 7.4 11476 2.4
Turkey 519 0.2 12872 2.7
COMESA (mainly Egypt)
21490 9.6 63127 6.5
Other African countries (Algeria and Tunisia)
647 0.3 102946 21.8
Asia (mainly China) 57438 25.6 87590 18.5
Arab Countries (Saudi Arabia, Lebanon, United Arab Emirates)
76254 34.1 90030 19.0
Source: Central Bank of Sudan Annual Reports (various issues), and Trade Digests (various issues).
302. Sesame exports in 2008-2013 accounted for about 32 percent of agricultural exports and about 3.3 percent of total export. Table 25 shows exports value, quantity and share of sesame seed during the period 2008-2012. The international price of sesame exported from Sudan receives favorable prices compared to other African exporting countries because of high quality and grading e.g. recent world prices declared by Sudan Trade Point are 2135 US $/ton for sesame from Sudan compared to 2050 US $/ton for sesame from Ethiopia and 1900 US $/ton for sesame Nigeria.
303. Sudan’s markets for sesame are quite diversified and Sudanese sesame has now penetrated markets in China, Europe and African countries as well as traditional markets in the Gulf and Arab countries. Gulf and Arab countries are the major importers of sesame from Sudan with a share of more than 34 percent in 2012, followed by China with a share of 25 percent. Ethiopia may be considered the major competitor for Sudan in African sesame producers. 304. An estimated 5 million people are involved in Gum Arabic with the belt covering 12 states in Sudan and extends from the eastern borders of Sudan with Ethiopia to the Western borders with Chad and Central Africa, covering an area of 500 thousand square kilometers. Sudan produces high quality (hashab) which comes from Acacia Senegal, and a lower grade (Talha) harvested from Acacia seyal but with the same unique properties as an emulsifier. Productivity remains low and on-farm research have identified the potential for productivity per tree improvements of 47 to 60 percent, and quality improvements through better tapping methods 305. Recent reforms in the marketing of Gum Arabic have improved the incentives for production. Onerous taxation and multiple fees reduced the incentives to produce and market Gum Arabic resulting in a substantial decline in Sudan’s share of the work market over the past four decades. Average production declined from an average of 45 thousand in 1970s to only an average of 11 thousand tons during 2001-2008. Following the reforms there is a sign of production recovery as it increased to 30 thousand tons in 2012 and was estimated to increase to 80 thousand tons in 2013.
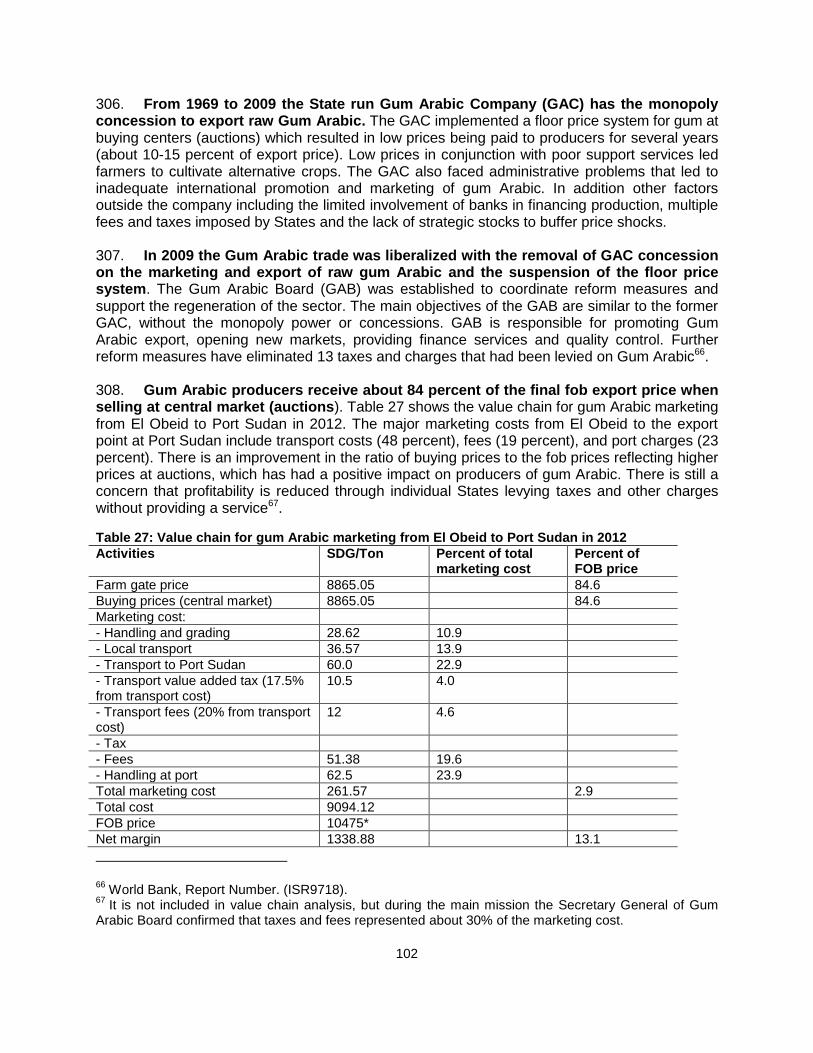
102
306. From 1969 to 2009 the State run Gum Arabic Company (GAC) has the monopoly concession to export raw Gum Arabic. The GAC implemented a floor price system for gum at buying centers (auctions) which resulted in low prices being paid to producers for several years (about 10-15 percent of export price). Low prices in conjunction with poor support services led farmers to cultivate alternative crops. The GAC also faced administrative problems that led to inadequate international promotion and marketing of gum Arabic. In addition other factors outside the company including the limited involvement of banks in financing production, multiple fees and taxes imposed by States and the lack of strategic stocks to buffer price shocks. 307. In 2009 the Gum Arabic trade was liberalized with the removal of GAC concession on the marketing and export of raw gum Arabic and the suspension of the floor price system. The Gum Arabic Board (GAB) was established to coordinate reform measures and support the regeneration of the sector. The main objectives of the GAB are similar to the former GAC, without the monopoly power or concessions. GAB is responsible for promoting Gum Arabic export, opening new markets, providing finance services and quality control. Further reform measures have eliminated 13 taxes and charges that had been levied on Gum Arabic66. 308. Gum Arabic producers receive about 84 percent of the final fob export price when selling at central market (auctions). Table 27 shows the value chain for gum Arabic marketing from El Obeid to Port Sudan in 2012. The major marketing costs from El Obeid to the export point at Port Sudan include transport costs (48 percent), fees (19 percent), and port charges (23 percent). There is an improvement in the ratio of buying prices to the fob prices reflecting higher prices at auctions, which has had a positive impact on producers of gum Arabic. There is still a concern that profitability is reduced through individual States levying taxes and other charges without providing a service67.
Table 27: Value chain for gum Arabic marketing from El Obeid to Port Sudan in 2012
Activities SDG/Ton Percent of total marketing cost
Percent of FOB price
Farm gate price 8865.05 84.6
Buying prices (central market) 8865.05 84.6
Marketing cost:
- Handling and grading 28.62 10.9
- Local transport 36.57 13.9
- Transport to Port Sudan 60.0 22.9
- Transport value added tax (17.5% from transport cost)
10.5 4.0
- Transport fees (20% from transport cost)
12 4.6
- Tax
- Fees 51.38 19.6
- Handling at port 62.5 23.9
Total marketing cost 261.57 2.9
Total cost 9094.12
FOB price 10475*
Net margin 1338.88 13.1
66 World Bank, Report Number. (ISR9718).
67 It is not included in value chain analysis, but during the main mission the Secretary General of Gum
Arabic Board confirmed that taxes and fees represented about 30% of the marketing cost.

103
Source: Planning and Agricultural Economic Directorate, Ministry of Agriculture and Irrigation. Notes: * Fob price calculated at US $ 2500/ton and 4.19/US $ exchange rate in 2012.
309. The ‘Revitalizing the Sudan Gum Arabic Production & Marketing Project’68 has increased the income levels of beneficiary households by 65 percent. The percentage of the gum price received by small gum producers has increased from 15 percent to 50 percent due to increased yields and higher prices through the liberalizing the marketing by abolishing the monopoly of the Gum Arabic Council. About 130 associations in five states consisting of over 11,000 farmers (25 percent women farmers) are involved. The project provides technical and financial support to members of Gum Arabic Producers Associations (GAPAs) in five states (South Kordofan, North Kordofan, White Nile, Sinnar and Blue Nile) who then provide technical extension and advice to small gum producers. This has facilitated increased productivity and improved market access. 310. Expanding the Gum Arabic sector requires the further reductions in the multiple taxes and fees levied at State level, enhancing research and extension services to farmers, and strengthening the Gum Arabic Producer Associations. 311. The production and export of cotton has declined sharply over the past decade due poor margins. Factors contributing to the low profitability and productivity include deteriorating irrigation infrastructure in the Gezira Scheme, poor management of water distribution and maintenance, and the reluctance of farmers to grow cotton especially after new Gezira Act 200569. The bulk of Sudan’s cotton production is in the irrigation schemes especially the Gezira Scheme. During the last season a small scale trial of planting genetically modified cotton (seeds were imported from countries like Brazil and China) were carried out to solve the problems of low productivity and high cost of production with promising results. 312. The cotton sector faces high costs of production and has low productivity due to limited use of agricultural inputs such as fertilizer. Cotton yields (Acala) averaged 528 - 1014 kg/feddan (seed cotton) during the period 2002/03-2013/14 in the irrigated sector. There is a substantial difference between productivity in irrigated and rain-fed sector, as it ranged between 151-606 kg/fed for rain-fed sector. The yield trend in both sectors has been declining through to 2011, however, during the last two seasons an improvement in yield is registered. Table 28 shows that cotton production returns a yield of 11.1 percent to the farmer –which is equivalent to SDG 54 per Quintal.
313. The share of cotton in agricultural exports declined sharply from 15 percent in 2008 to only 1.5 percent in 2012 as farmers in the Gezira scheme moved away from cotton production. The quantity exported declined from 139 thousand bales to only 13.4 thousand bales in 2012, despite an improvement of world prices. There was a partial recovery in 2013, although only for short and medium staple cotton. The sharp decline in export is due
68 The project is Financially supported by World Bank (Multi Donor Trust Fund (MDTF)) and International
Fund for Agricultural Development (IFAD) 69
The largest scheme, Gezira, has experienced a complete change in management in 2009/10 through the implementation of the 2005 Gezira Act, effectively privatizing the Scheme and transferring the responsibility for irrigation to land-owner, water-user associations devolving control and, by association, planting decision-making to the farmers, thereby allowing planting flexibility within the water delivery regimes.
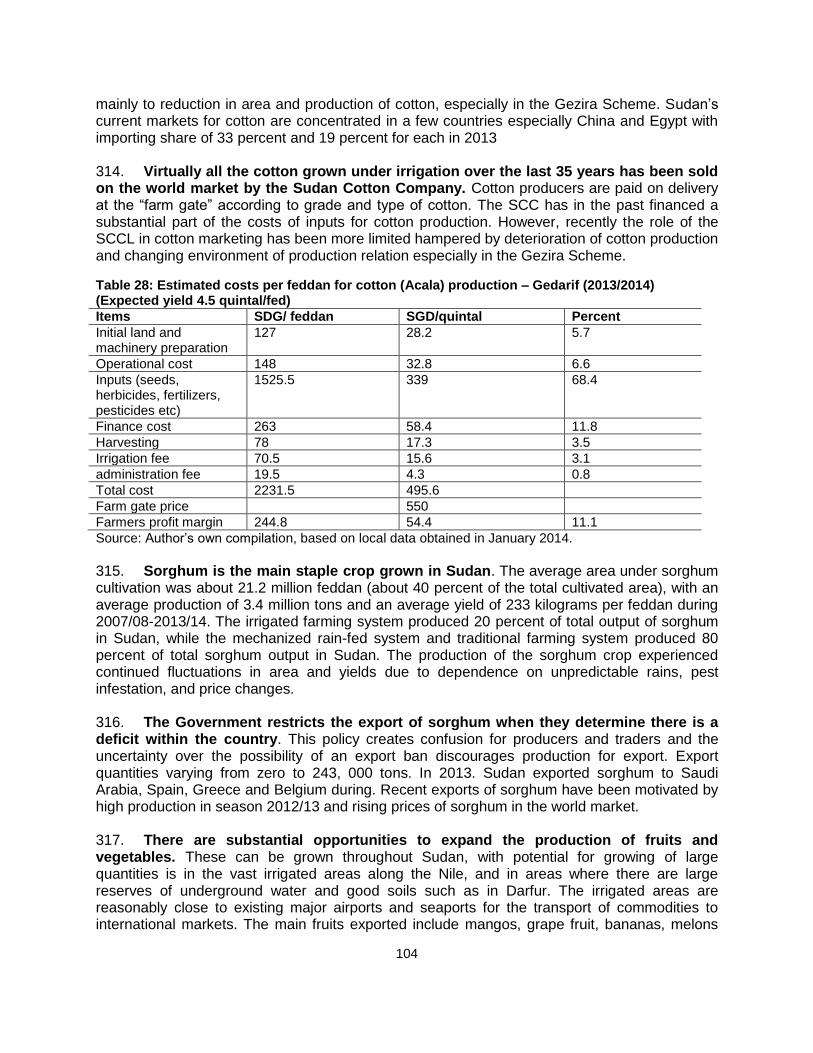
104
mainly to reduction in area and production of cotton, especially in the Gezira Scheme. Sudan’s current markets for cotton are concentrated in a few countries especially China and Egypt with importing share of 33 percent and 19 percent for each in 2013 314. Virtually all the cotton grown under irrigation over the last 35 years has been sold on the world market by the Sudan Cotton Company. Cotton producers are paid on delivery at the “farm gate” according to grade and type of cotton. The SCC has in the past financed a substantial part of the costs of inputs for cotton production. However, recently the role of the SCCL in cotton marketing has been more limited hampered by deterioration of cotton production and changing environment of production relation especially in the Gezira Scheme.
Table 28: Estimated costs per feddan for cotton (Acala) production – Gedarif (2013/2014) (Expected yield 4.5 quintal/fed)
Items SDG/ feddan SGD/quintal Percent
Initial land and machinery preparation
127 28.2 5.7
Operational cost 148 32.8 6.6
Inputs (seeds, herbicides, fertilizers, pesticides etc)
1525.5 339 68.4
Finance cost 263 58.4 11.8
Harvesting 78 17.3 3.5
Irrigation fee 70.5 15.6 3.1
administration fee 19.5 4.3 0.8
Total cost 2231.5 495.6
Farm gate price 550
Farmers profit margin 244.8 54.4 11.1
Source: Author’s own compilation, based on local data obtained in January 2014.
315. Sorghum is the main staple crop grown in Sudan. The average area under sorghum cultivation was about 21.2 million feddan (about 40 percent of the total cultivated area), with an average production of 3.4 million tons and an average yield of 233 kilograms per feddan during 2007/08-2013/14. The irrigated farming system produced 20 percent of total output of sorghum in Sudan, while the mechanized rain-fed system and traditional farming system produced 80 percent of total sorghum output in Sudan. The production of the sorghum crop experienced continued fluctuations in area and yields due to dependence on unpredictable rains, pest infestation, and price changes. 316. The Government restricts the export of sorghum when they determine there is a deficit within the country. This policy creates confusion for producers and traders and the uncertainty over the possibility of an export ban discourages production for export. Export quantities varying from zero to 243, 000 tons. In 2013. Sudan exported sorghum to Saudi Arabia, Spain, Greece and Belgium during. Recent exports of sorghum have been motivated by high production in season 2012/13 and rising prices of sorghum in the world market. 317. There are substantial opportunities to expand the production of fruits and vegetables. These can be grown throughout Sudan, with potential for growing of large quantities is in the vast irrigated areas along the Nile, and in areas where there are large reserves of underground water and good soils such as in Darfur. The irrigated areas are reasonably close to existing major airports and seaports for the transport of commodities to international markets. The main fruits exported include mangos, grape fruit, bananas, melons

105
and lemons, and the vegetables include green beans, onions and sweet peppers. To date fruits and vegetables account for less than 1 percent of total agricultural exports. The major constraints facing the production of fruits and vegetables are low productivity characterized by lack of improved seeds, low yield, lack of uniform output quality, and poor post-harvest handling. Research facilities, extension services and marketing channels all need to be improved. 318. The government has encouraged the establishment of specialized companies to support the production and export of fruits and vegetables to meet international standards. These include: the Sudanese Company for Horticultural Exports which is expected to contribute to the supply of inputs such as seeds, packaging material, transportation facilities, and marketing experience in melon, green beans, onion, mango, and lime; the Bustan Investment Company and the Neshaishiba Investment Company for production and export of Galia melon; and the Export Promotion Village which aims to provide grading facilities (sorting and packing) with modern technologies and supply of appropriate transportation and storage facilities including cold transportation and cold storage facilities to reduce costs and increases export competitiveness of Sudan fruit and vegetable exports, 319. The National Institute for the Development of the Horticultural Exports was established in 1993 to conduct studies and research on promotion of Sudan exports of fruits and vegetables. The Institute is expected to conduct socio-economic studies that include marketing surveys, technical and economically viable studies for exports, field technical studies related to field experiments for improving productivity and quality of horticultural crops.
320. Sudan has gone from being a net sugar exporter in the 1990s to a large net
importer as domestic policies discriminate against local producers. Sudan is a relatively
low cost producer of sugar and has potential to expand production to supply both the domestic
market as well as expand access into the preferential GAFTA, COMESA and EU (under EBA)
markets. Regrettably, a combination of both domestic and international policies have
undermined this potential and resulted in the domestic industry experiencing severe short term
losses.
321. Domestic producers face a tax burden of $126/per tonne over imported sugar.
Following a record surge in commodity prices in the 2000s, the global price of sugar has
subsequently declined by 45 per cent in US $ prices in the four year period ending July 31,
2014. Sudan introduced significant tax changes in June 2012 when the import tariff of 40 per
cent, the excise duty of 17 per cent, VAT of 17 per cent, and Advanced Business Profit Tax of 1
per cent were all reduced to zero on imports. Excise, VAT and BPT continue to apply to
domestic producers who also have to pay state taxes and a surcharge for the White Nile
Project. This leaves domestic producers with a tax burden of $126/tonne (2013/14). The
overvaluation of the exchange rate has further exacerbated the challenges facing the domestic
sector.
322. The growing divergence between import prices and officially agreed domestic
prices are crowding out sales of domestic sugar. The decline in the international price of
sugar, coupled with a significant decline in the landed price (Khartoum) of sugar has not been
matched by a comparable reduction in the final price of sugar paid by consumers. Attempts to

106
maintain the officially agreed domestic price to consumers in local currency and also the margin
between the ex-factory price and the consumer price have resulted in increasing volumes of
imported sugar being sold below the agreed fixed prices. Indeed in 2014 sales of imported
sugar virtually drove domestically produced from the market.
323. In the near term expanding the Sudanese sugar industry requires a competitive
exchange rate and the implementation of tax neutrality between domestic production and
imported sugar 70 .In the longer term further work is required on environmental
sustainability given sugar’s heavy water use. Consumer prices would benefit from abolishing
the official price, and the removal of excise duty subject to ensuring this is revenue neutral. The
earlier DTIS recommendations (which remain valid) included reducing government involvement
in the major sugar companies, and developing incentives for the delivery of services (health,
education) to local communities through introducing tax credits. Recent work has identified
sugar’s high water requirements relative to alternative crops and additional analysis is required
taking into account long term environmental sustainability.
Factors Affecting Competitiveness of Agricultural Exports 324. The availability and access to agricultural inputs71 at competitive prices is one of the main factors affecting the productivity, profitability and competitiveness of agricultural production. Agricultural inputs are exempt from both custom duties and the use of the official exchange rate for their imports. However, according to the ABS imported agricultural inputs are not duty free. There is tariff for imported fertilizers and seeds of 3 percent, insecticide and pesticide on small containers 10 percent plus 13 percent development tax. However large containers of insecticide and pesticide of 200 liters are zero rated. 325. The supply of agricultural inputs is mainly through the state owned Agricultural Bank of Sudan, with the private sector playing a minor role. The Federal Ministry of Agriculture and Irrigation is responsible for qualifying companies for agricultural inputs imports through tenders. The Ministry is also providing services to the farmers through the extension unit, and provides subsidies to the small traditional rain-fed farmers (in kinds). The Ministry of Agriculture is responsible for setting agricultural standards for imported and exported commodities through Plant Quarantine Department. 326. Most the local seeds are marketed without any quality control. Improved seeds are concentrated in the irrigated sector; and minimal use on the rain-fed firms, notably in Blue Nile State. Local seed, either kept from the previous year or bought from local markets, is the main seed source throughout Sudan. These seeds, comprising second generations of improved varieties, are marketed without quality control other than local knowledge of source. 327. Improved seed technology is essential for bridging the gap between yields in demonstration trials and farmers’ fields. Until recently, seed production and certification was handled by the central government through the Seed Unit of the Extension Department in the
70 This would require at current prices (2013/14) a levy on imports of $126/tonne.
71 Namely: seeds, chemical, machineries and post-harvest material like packaging
107
Ministry of Agriculture and Irrigation. National seed production was limited to field crops, while horticultural crop seeds were usually imported. In a move to improve production of good-quality seed and boost the use of improved seed, Arab Sudanese Seed Company was formed through public-private partnership. The government donated physical assets and has a share of 42 percent of the company’s capital. The remainder was financed by the Arab Authority for Agricultural Investment and Development (AAAID). 328. Agricultural input supply faces many constraints. These include: 1. distorted agricultural inputs market; 2. deferred payment increase the cost; 3. shortage of storage capacity and unspecialized input stores; 4. low local production of inputs as for example the local production of seeds cover only 10 percent of domestic needs; 5. lack of hard currency, and 6. delay of inputs supply, lack of substitute, and high insurance cost. Most recently, there is a shortage of labor supply with increased daily rates due to the return of internally displaced persons (IDPs) to the South, more attractive non-agricultural labor opportunities in the fast-growing urban centers and in the gold fields, and the large increase in harvestable area.
329. Cumbersome regulations, technically weak public agencies and restrictions on private sector involvement undermine the availability of agricultural inputs. All agricultural inputs require an SSMO certificate and restricted products require additional certificates and letters of permission from the appropriate regulatory body. Pesticides require a letter from the National Pesticide Council. Seeds require a germination certificate from the Ministry of Agriculture (Seed Unit), and certificates from both the Plant Quarantine Department and the Plant Protection Department. The National Seed Administration (NSA) is responsible, under the Seed Law of 2010, for certifying and monitoring the production, release and utilization of all seeds. The NSA has limited technical and financial resources and is currently receiving technical assistance through an IFAD project. The government Agricultural Research Corporation (ARC) has a program for seed multiplication for registered and certified seeds. There is virtually no effective competition from private sector seeds companies. 330. Agricultural extension services in Sudan are provided by the government through the Ministry of Agriculture and Irrigation and the Ministry of Livestock and Fisheries. Increasing agricultural productivity requires extension services to be improved. Given the fiscal constraints facing the Government it is recommended that private companies selling inputs (seeds, fertilizers) and major marketing/buying companies be encouraged to deliver technical advice through extension services and the increased use of contract farming. 331. The Technology Transfer and Extension Administration (TTEA) is responsible body for agriculture extension services. The objectives of TTEA include the development of agriculture; improvement in the production quality; enhancement of farmers’ income through rational exploitation of natural resources; comprehensive human prosperity via profitable, sustainable agriculture; and making agricultural products competitive in international markets with the aim of assuring food security and increasing agricultural revenues. TTE has four main thematic programs, namely improving crop productivity, promotion of improved seeds, integrated mechanization, and rural women development. The TTEA established administrations network in the state ministries responsible for agriculture and worked closely with the states, ARC and universities to facilitate the transfer of technology to farmers. The TTEA also maintains a Technology Transfer Center and relevant Stations whose mandate is to transfer technical information to stakeholders including farmers.

108
332. Government delivery of Livestock and Fishery extension services do not appear to be contributing to significant increases in productivity. For livestock extension services, the General Directorate of Extension, Technology Transfer and Pastoralists’ Development is responsible for extension matters related to livestock owners, pastoralists and fishermen. The Directorate runs its grassroots programs based on the needs of pastoralists, animal owners, producers and fishermen. It develops strategies and programs of animal resources sector that concentrates on livestock, trans-boundary and zoonotic disease control, in addition to the promotion of animal production and fisheries. 333. Prioritize involving the private sector in delivering extension services. In addition to the Federal Government state ministries of Agriculture and state ministries of livestock and Fisheries72, also provide extension services. Some universities make a contribution to extension mainly through training. Examples include the Extension and Rural Development Department at Sudan University of Science and Technology and Department of Agricultural Extension and Rural Development at University of Khartoum. Famer based organizations, including Farmer Union and Pastoralist Union, play key roles in farmer-to-farmer extension activities, influencing extension policy, assessing extension performance, and helping in setting extension priorities. Extension services remain weak and more attention needs to be given to using ‘tried and tested’ approaches with well-trained professionals-this includes the private sector.
Recommendations 334. The recommendations in the earlier DTIS (2008) remain valid. The agricultural sector continues to be characterized by Low productivity, limited stock offtake, high animal morbidity and mortality rates stemming from a combination of institutional and farm level constraints. Removing the monopoly of the Gum Arabic Council has stimulated higher production and allows farmers to benefit from increased prices. 335. Increasing access to agricultural inputs through reforming the procedures for licensing seeds and fertilizer, funding research on the benefits of using micro dosages of fertilizer and other inputs. Further work is required on land tenure policies to increase security of tenure which would encourage longer term investments.
336. Extension services need to be strengthened and expanded. Private extension services should be encouraged alongside the commitment to improve the quality of government extension services. The private sector has the potential to play an important role in providing information on quality standards for export markets.
337. Remove the numerous State fees and taxes that are not related to a service provided. This will be challenging given the fiscal position of many States and their demand for revenue. Documenting the build-up of fees and taxes along selected agricultural value chains would assist in highlighting their adverse impact on expanding and diversifying production.
72 In some states, both ministries have been merged to form a single ministry

109
Chapter 8: Trade in Services Overview 338. Services and trade in services have an important role in economic diversification. Services are essential intermediate inputs and have the potential to enhance productivity and increase technology and skills transfers through significant positive spillover effects throughout the economy. Services sectors can help Sudan diversify its economy and reduce poverty. For example, while the agricultural sector is viewed as an important engine of growth, it has remained far below its potential and the country has stayed a net importer of agricultural products. To increase agriculture production the productivity of farms will have to improve. That means better transport infrastructure, agricultural technology and support services including financing. 339. Sudan’s economy faces numerous challenges that hamper the development of the services sector. While services such as transport and logistics, financial services or energy are addressed in the context of various World Bank or other development partner projects, higher-value knowledge-intensive services such as business services remain largely neglected. 340. Most business services sectors are characterized by weak regulatory frameworks. While regulatory self-assessments by ministries and regulators seem to suggest that the frameworks in place are adequate, the private sector points to numerous regulatory weaknesses. Also, the absence of adequate regulations and standards was mentioned by stakeholders from both the public and the private sectors. There seems to be a strong interest in developing the necessary regulatory framework using “good practice” from the region or elsewhere as guidance. Additional constraints in business services sectors are skills shortages and mismatches. 341. This chapter focuses on professional services, a set of higher-value knowledge-intensive services sectors that are characterized by high regulatory intensity and are crucial for skills generation. A diagnostic of professional services markets in Sudan based on a recent World Bank Survey on Professional Services highlights the demand and the constraints to the provision of adequate professional services in Sudan. The chapter shows the importance of both exports and imports of high-value added, sophisticated services and professional skills for export diversification and increased competitiveness. The chapter also illustrates how regulatory and trade policy reforms can be coordinated as part of regional and multilateral negotiations. Policy recommendations call for action in four areas: education, regulation of professional services, trade policy, and labor mobility at both the national and international level.
Trade in Services in Sudan 342. Sudan’s share of services Value Added (VA) in GDP is lower than expected for a country at its level of development. A comparative assessment of the share of services VA in GDP for Sudan and selected Sub-Saharan African countries reveals that Sudan’s falls below the fitted curve in 2000-2 and 2010-12, implying a smaller services sector than expected for the country’s level of development (Figure 31)

110
Figure 31: Services Value Added and Development in 2000-02 versus 2010-12
Source: World Development Indicators
Note: The figure shows scatter plots of average services value added as a percentage of GDP against the log of average GDP per capita in purchasing power parity (PPP, current international USD) for the periods 2000-02 (left panel) and 2010-2012 (right panel). The line indicates the fitted values obtained by a linear prediction of the relationship between share of services in total value added and income per capita. This line reflects a stylized fact that in richer countries the services sector tends to represent a larger share of the economy. The figure can be used to analyze whether the share of the services sector is higher or lower than what it should be given a country’s level of development.
343. Growth of services exports remains below that of goods exports and GDP growth. Sudan stands in stark contrast with most neighboring countries regarding growth of services exports compared to that of goods exports and GDP. While most Sub-Saharan African countries register more dynamic growth rates for services as compared to goods exports or GDP growth, Sudan’s services exports performance remains below potential (Figure 32). Figure 32: Sudan’s Exports of Goods, Exports of Services and GDP Growth, 2005-2012
Source: World Development Indicators 344. Interestingly, Sudan registers more dynamic growth rates for other commercial services exports than for exports of travel or transport services (Figure 33). This suggests that some modern, high value added services sectors already contribute to export diversification
0
5
10
15
20
25
2005 2006 2007 2008 2009 2010 2011 2012
Ind
ex 2
00
5=1
Exports of Goods Exports of Service GDP

111
and provide new opportunities for export development. Indeed, a recent survey of providers of professional services carried out by the World Bank shows that about one third of respondents in Sudan reported exports of services in 2011 (19 out of 60), a higher proportion than in most COMESA countries (15.7 percent at the COMESA level). These exports of professional services concerned for the most part regional clients, and represented on average a third of exporters’ total revenue. This suggests that there is potential to develop Sudan’s services exports provided an appropriate trade policy and regulatory framework are put in place and obstacles faced by professionals are lifted domestically and at the regional level. 345. Sudan’s services imports are undiversified. Imports of services can drive Sudan’s competitiveness. Imports of intermediate inputs such as transport services, construction, insurance and other business services can improve the productivity of manufacturing and services firms. Also, services can help address shortages in crucial sectors of the economy. For example, imports of professionals help alleviate Sudan’s skills shortages in healthcare, education or professional services. However, at this stage Sudan’s services imports are for the most part constituted of transport and travel services (Figure 34). Sudan’s access to competitive services from which to draw high quality services inputs is inadequate. Poor access to such critical services translates into competitive disadvantage in any sector, be it services, manufacturing or agriculture. The fragmentation of regional markets for these services by restrictive regulatory policies and regulatory heterogeneity prevents Sudan from fully benefiting from the potential gains from greater trade in services. Again, regional cooperation to facilitate the movement of various professionals could help address skills shortages or gaps in relevant sectors. Figure 33: Exports of Transport, Travel and Other Commercial Services, Sudan, 2005-2012
Source: World Development Indicators
346. Ensuring efficient access to a wide range of services is a key determinant in international competitiveness and efficiency. The chapter identifies the constraints to the development of profession services, showing how inadequate domestic regulations in conjunction with a lack of regional cooperation are holding back the development of the national markets for services, create skills shortages and skills mismatches with negative implications for competitiveness, and limit exports.
0
5
10
15
20
25
2005 2006 2007 2008 2009 2010 2011 2012
Ind
ex 2
00
5=1
Other Commercial Transport Travel
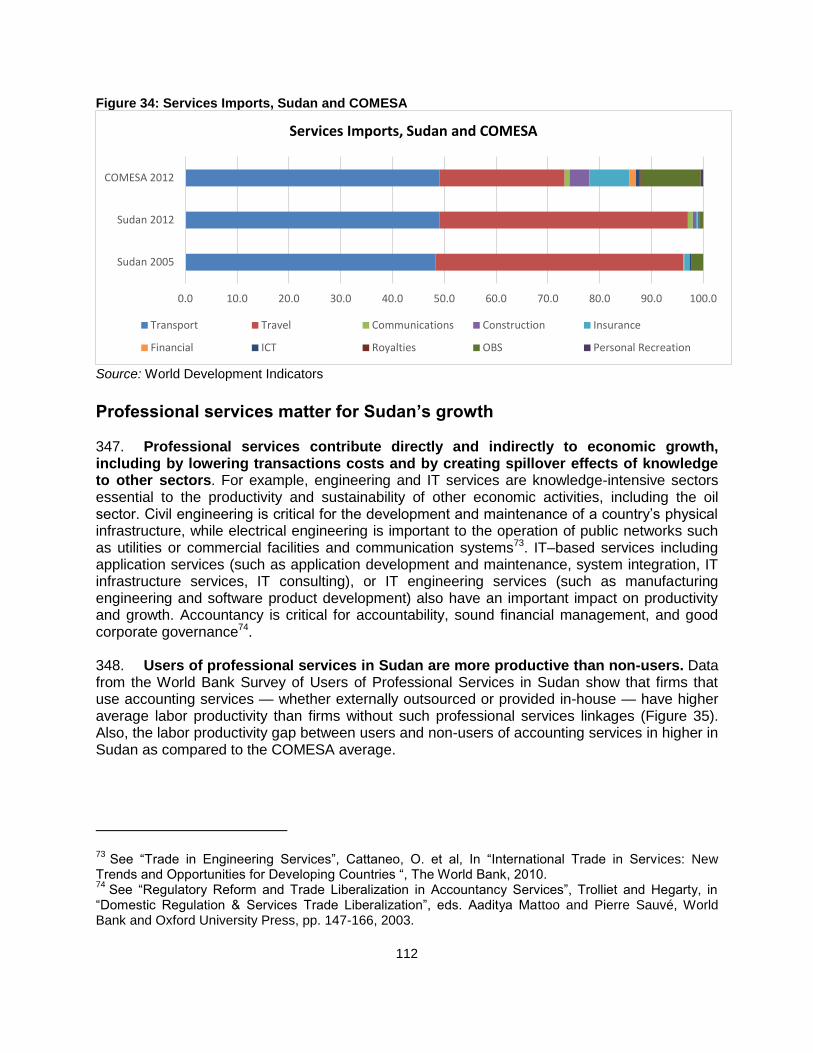
112
Figure 34: Services Imports, Sudan and COMESA
Source: World Development Indicators
Professional services matter for Sudan’s growth 347. Professional services contribute directly and indirectly to economic growth, including by lowering transactions costs and by creating spillover effects of knowledge to other sectors. For example, engineering and IT services are knowledge-intensive sectors essential to the productivity and sustainability of other economic activities, including the oil sector. Civil engineering is critical for the development and maintenance of a country’s physical infrastructure, while electrical engineering is important to the operation of public networks such as utilities or commercial facilities and communication systems73. IT–based services including application services (such as application development and maintenance, system integration, IT infrastructure services, IT consulting), or IT engineering services (such as manufacturing engineering and software product development) also have an important impact on productivity and growth. Accountancy is critical for accountability, sound financial management, and good corporate governance74. 348. Users of professional services in Sudan are more productive than non-users. Data from the World Bank Survey of Users of Professional Services in Sudan show that firms that use accounting services — whether externally outsourced or provided in-house — have higher average labor productivity than firms without such professional services linkages (Figure 35). Also, the labor productivity gap between users and non-users of accounting services in higher in Sudan as compared to the COMESA average.
73 See “Trade in Engineering Services”, Cattaneo, O. et al, In “International Trade in Services: New
Trends and Opportunities for Developing Countries “, The World Bank, 2010. 74
See “Regulatory Reform and Trade Liberalization in Accountancy Services”, Trolliet and Hegarty, in “Domestic Regulation & Services Trade Liberalization”, eds. Aaditya Mattoo and Pierre Sauvé, World Bank and Oxford University Press, pp. 147-166, 2003.
0.0 10.0 20.0 30.0 40.0 50.0 60.0 70.0 80.0 90.0 100.0
Sudan 2005
Sudan 2012
COMESA 2012
Services Imports, Sudan and COMESA
Transport Travel Communications Construction Insurance
Financial ICT Royalties OBS Personal Recreation

113
Figure 35: Average Productivity of users vs. Non-Users of Accounting Services, Sudan and COMESA
Source: World Bank Surveys of professional services in COMESA, 2013
349. Respondents to the World Bank Survey of Users of Professional services listed a number of channels through which professional services affect their productivity and performance. While many respondents indicated that they use accounting services because of statutory requirements, they also name accounting services as useful for maintaining and improving existing activities within enterprises and as helpful in accessing loans. Accounting and audit services also help manage costs, expenses and income of the firm, disclose the company's financial health, undertake future planning and comply with tax laws and requirements. Engineering services help firms understand technological advancements and how to use them effectively to construct, install, and maintain their machineries in normal operating condition. Still, such knowledge intensive services remain largely neglected and their development and export potential remains overlooked. High demand for professional services in Sudan 350. The business surveys undertaken in Sudan report a high level of demand by the surveyed firms. The results of the user surveys (shown below in Figure 36) suggest that accounting, engineering and legal services are important intermediate inputs in the production of many sectors with more than 50 percent of all interviewed enterprises using such services at least once per year. Demand for these services is expected to increase with economic growth in Sudan.

114
Figure 36: Usage of professional services, Sudan
Source: World Bank Surveys of professional services in COMESA, 2013
351. There is demand for basic and more sophisticated professional services. The surveys show that there is demand all types of services — from accounting and auditing, to tax advice and management consulting. Financial auditing is the main source of revenue for accounting and auditing firms in Sudan, followed by accounting/bookkeeping and management consulting and tax advice (Figure 37A). Engineering firms in Sudan earn on average the largest fraction of their revenues from providing planning and managing maintenance survey sites, other services related to engineering and project management services (Figure 37B).
Figure 37: Demand for Accounting and Engineering Services in Sudan
A: Demand for accounting services in Sudan
B: Demand for engineering services in Sudan
Source: World Bank Surveys of professional services in COMESA, 2013 352. The high usage of professional services and the higher productivity of Sudanese firms that use professional services than that of non-users may suggest that professional services are equally important for the development of the economy as they are in more developed economies.

115
Skills shortages of both highly skilled and middle level professionals are observed in Sudan 353. Despite demand for professional services Sudan is characterized by limited availability of professionals and skills mismatches in engineering and accounting services. While detailed data on the exact magnitude of professional skills shortages in Sudan is unavailable, consultations with practitioners confirmed that the current demand for qualified accountants or engineers in Sudan is growing and is much larger than the available supply. 354. Supply of professional services is limited by rent-seeking opportunities. Even though professionals in Sudan receive high nominal wages relative to their counterparts in other African countries (43) – reflecting their scarcity relative to demand for their services, our interviews revealed that there are limited incentives to become and practice as a professional in Sudan given rent-seeking opportunities in the public and the oil sectors. A more severe scarcity of engineers as compared to that of accountants in Sudan is reflected by the earnings differential between those two types of professionals (compare Panel A and Panel B of Figure 38).
Figure 38: Average gross monthly salaries in Sudan
Panel A: of accounting professionals Panel B: of engineering professionals
Source: World Bank Surveys of professional services in COMESA, 2013 355. It is worth noting that discussions with the private sector revealed that Sudan is facing not only a shortage of highly skilled professionals but also middle-level skills shortages. Middle-level professionals who can provide services to under-served client segments and produce large economic gains are a sometimes underappreciated category of professionals. For example, accounting technicians can provide basic recordkeeping services needed by SMEs. Engineering technicians can provide basic or standardized engineering services and are crucial in supporting engineering projects. Thus, the absence of middle-level professionals in Sudan needs to be addressed. In the context of the shortages of professionals at all levels and given that it is less costly and less time consuming to train middle-level professionals, the development of middle-level/technical professionals should be Sudan’s priority in terms of skills formation. Explaining the skills shortages and the underdevelopment of markets for professional services in Sudan 356. Factors related to education, domestic regulation, trade and labor mobility explain skills shortages and skills mismatches in professional services in Sudan. Weaknesses in primary,

116
secondary and tertiary education limit the ability of students to acquire professional skills. From a regional perspective, enrollment in higher education is higher in Sudan than in other Sub-Saharan African countries and is similar to that in Middle Eastern and North African countries, but the education sector shows weak learning outcomes at all levels75. Given the relatively high enrollment rate in higher education, it is important that students acquire the skills that match those needed by the labor market. 357. Weak regulatory framework can explain the underdevelopment and the segmentation of markets for professional services. Professional services have traditionally been subject to a high degree of regulation, as a result of direct governmental regulation and of rules adopted by self-regulatory bodies (professional associations). These regulatory measures affect the entry and operation of professionals and professional services firms, and can undermine competition and constrain the growth of the sector.
358. Based on the results of a regulatory self-assessment performed by Sudanese ministries and professional associations, Sudan seems to have a moderate regulatory framework for professional services. Entry requirements, such as pre-qualification requirements, licensing or membership in a professional association, as well as regulations affecting the conduct/operations of professional service providers such as price regulations, advertising prohibitions or restrictions on multidisciplinary activities, tend to be less stringent in Sudan than in neighboring countries. For instance, according to the interviewed authorities, the range of exclusive activities reserved to engineering and legal professionals in Sudan are among the least restrictive in Sub-Saharan African countries. 76 Also, there are no price regulations affecting professional services, and advertising prohibitions concern only accounting services. A more detailed description of the regulatory frameworks in all examined professional services in Sudan is presented in Box 3.
75 World Bank (2012), The status of the education sector in Sudan.
76 Highly skilled professionals in the different professional services sectors generally have exclusive rights
to perform certain activities (e.g., auditing, representation of clients before courts, advice on legal matters, feasibility studies, design and planning).

117
359. The private sector identifies several regulatory barriers affecting professional services in Sudan. Additional information on the severity of regulatory barriers comes from the 2012-13 World Bank business surveys and is presented in Figure 39. This suggests that transparency and requirements to participate in public procurement as well as the speed of accreditation and qualifications procedures are among the top regulatory constraints faced by
Box 3: Domestic Regulation in Professional Services in Sudan In Sudan’s accounting sector, there are mandatory continuing education requirements for members of the profession, while for both the accounting and the legal sector there are additional requirements include passing the professional examinations to become a full member of the profession. There are practical training requirements to become a full member of the accounting, engineering and legal professions - 1 year for law practitioners, 3 years for accounting professionals and 5 years for engineers. In addition, the accounting and the legal professions are also subject to other educational or vocational requirements over and above the academic degree to enter the profession (example, the legal profession requirement is a 1 year post-graduate course). All three sectors also regulate access to the profession through compulsory licenses or authorization granted by the Sudan Bar Association in legal services, the Accountancy and Audit Profession Organization (AAPOC) in accounting services, and the Engineering Council for engineering services. Licenses are renewed periodically (for example, every 2 to 5 years for engineering). In the engineering sector, although there are no requirements for passing a professional examination to become a member, there are requirements pertaining to practical training (a few years for engineering technicians and 5 years for engineers). All these requirements are in addition to the mandatory university degree obtained to practice legally. In Sudan, engineering and legal services are not subject to exclusive rights of practice by engineers or lawyers; the scope of exclusive rights is broader in accounting services. Highly skilled professionals in professional services sectors have exclusive rights to perform certain activities (e.g., auditing, representation of clients before courts, advice on legal matters, feasibility studies, design and planning). The argument in favor of exclusive rights is that they can lead to increased specialization of professionals and guarantee a higher quality of service. But the negative price and allocation effects of exclusive rights, which act as monopolies, can be substantial, especially if they are granted for standardized services that can be provided at a lower cost by less-regulated or non-regulated providers – such as the middle-level professionals in these sectors. In the accounting sector, except for matters related to management consultancy services, investment advice, legal advice and representation, and expert witness in accounting, all other accounting type works fall under the exclusive rights domain of certified accounting professionals. The following activities are specifically provided by accounting professionals only: Traditional accounting (book-keeping); Statutory audit; Non-statutory audits; Audit of mergers and of contributions in kind; Insolvency practice; International audit; Tax advice and Tax representation Regulation affecting the conduct/operations of professional services providers in Sudan seems to be less severe than in many neighboring countries. In all professional services, fees tend to be negotiated freely between practitioners and clients, but there is a Fee Committee at the Bar Association that deals with complaints from clients. All types of legal entities are permitted in engineering. By contrast, only sole proprietorship and general partnerships are permitted in accounting. Also, advertising is prohibited in accountancy but seems to be allowed in engineering and legal services. Source: Regulatory surveys undertaken in 2012 and 2014.

118
professional services providers in Sudan. Restrictions affecting competition such as advertising prohibitions and fees/price regulations are also important barriers for business. 360. Trade barriers and immigration regulation can explain the segmentation of markets for professional services. Trade barriers can limit competition and the efficiency of professional service providers. In general, foreign entry restrictions include: (i) restrictions on the movement of natural persons (nationality and residency requirements, quotas, economic needs test, limits on the length of stay, recognition of academic and professional qualifications); (ii) restrictions on the establishment of commercial presence (restrictions on foreign ownership, limits on the type of legal entry, limits on the scope of business); (iii) restrictions on cross border trade (entry restrictions and limits on the scope of business); and (iv) restrictions on labor mobility (procedures for hiring a foreign worker). Figure 39: Top regulatory constraints in faced by professional services providers in Sudan
Source: World Bank Surveys of professional services in COMESA, 2013 361. Trade restrictions in professional services are quite severe in Sudan. Explicit barriers to trade that cover foreign entry restrictions and discriminatory conduct restrictions, and broader labor mobility limit competition and the efficiency of professional service providers in Sudan. Key barriers relate to regulations pertaining to licensing and qualification requirements. The accounting and legal sector uses the labor market test or economic needs test for license application by foreign services providers. Other explicit trade barriers affecting professional services in Sudan include: nationality requirements to provide certain professional services, prohibitions to use the name of the parent company, requirements to employ a certain percentage of nationals and restrictions on the composition of management of foreign professional firms established in Sudan. Foreign professional degrees are recognized on an ad-hoc basis. Similarly, work permits are allocated and extended on a case by case basis. The public procurement of government contracts for accounting and legal services are also quite rigorous in Sudan – numerous services cannot be sold by foreign providers to the government. There are ownership and control limits and restrictions on the form of entry for foreign firms in all professional services sectors. In terms of trade restrictions on importing professional services through mode 1, there is little possibility for a domestic resident firm/individual to obtain professional services directly from a foreign professional services firm or office located outside the country.

119
Implications for policy action 362. The national markets for professionals and professional services in Sudan remain underdeveloped. The main priorities relate to coordinating the needed regulatory reforms with trade liberalization, and addressing the skills shortages and the skills mismatches affecting professional services. This suggests policy action in the following areas: education, regulation of professional services, trade policy, and labor mobility at the national and regional levels. Policy action at the national level 363. Reforms at the national level need to focus on the development of framework conditions that facilitate the growth of professional services and address skills shortages and skills mismatches. In the short term, reforms need to focus on the developments of the necessary regulatory framework and incremental, qualitative improvements in domestic regulations that hamper the growth of the sector. Top regulatory constraints identified by the private sector include regulations regarding participation in public procurement processes, competition issues, the qualification and licensing requirements and registration and other administrative procedures that limit the entry and the operation of professional services firms. The regulatory reform process needs to involve the private sector. In the long term, faculties and other training programs must be created, improved and expanded to satisfy professional training needs, but this must be planned and carried out in a manner that will increase not only the quantity but also the quality of offerings. 364. Sudan should continue earlier progress made in the education sector. For example, its success at increasing enrolment at the primary and secondary levels generates growing demand for vocational and higher education. The absence of links between educational systems, employers, and users of services prevents young graduates from acquiring market-relevant skills. Several stakeholders from the private sector have emphasized the coordination problems between employers, professional associations, and education institutions in the content of educational programs for engineers and accountants. Policy actions to encourage collaboration between universities, professional associations, and the private sector, for example through internships, could help students acquire skills and practical training. Such collaborative actions are required to better understand and strengthen the links between the curricula and the skills required to support the expansion and diversification of the economy. The requirements for medium and high-level skills in more sophisticated business services need to feature in Sudan’s Education Sector Plan to mobilize both internal and external financing. Policy action at the regional and multilateral levels 365. Regional integration and multilateral negotiations offer opportunities for implementing regulatory reforms and reducing the skill gap through services liberalization. Sudan is a COMESA-member and is currently negotiating its WTO accession. How far and how quickly Sudan will proceed depends on political and economic considerations. Ideally, liberalization would be non-preferential so that domestic users of professional services have access, and domestic professionals can benefit from exposure to the best service providers in the world. This protects countries from suboptimal regional providers. If, however, reciprocal liberalization at the regional level is politically more feasible, then Sudan ought to weigh the unquestionable benefits of market opening, even in the narrow regional context, against the possible costs of giving a first-mover advantage to what may be a second-best regional service provider.
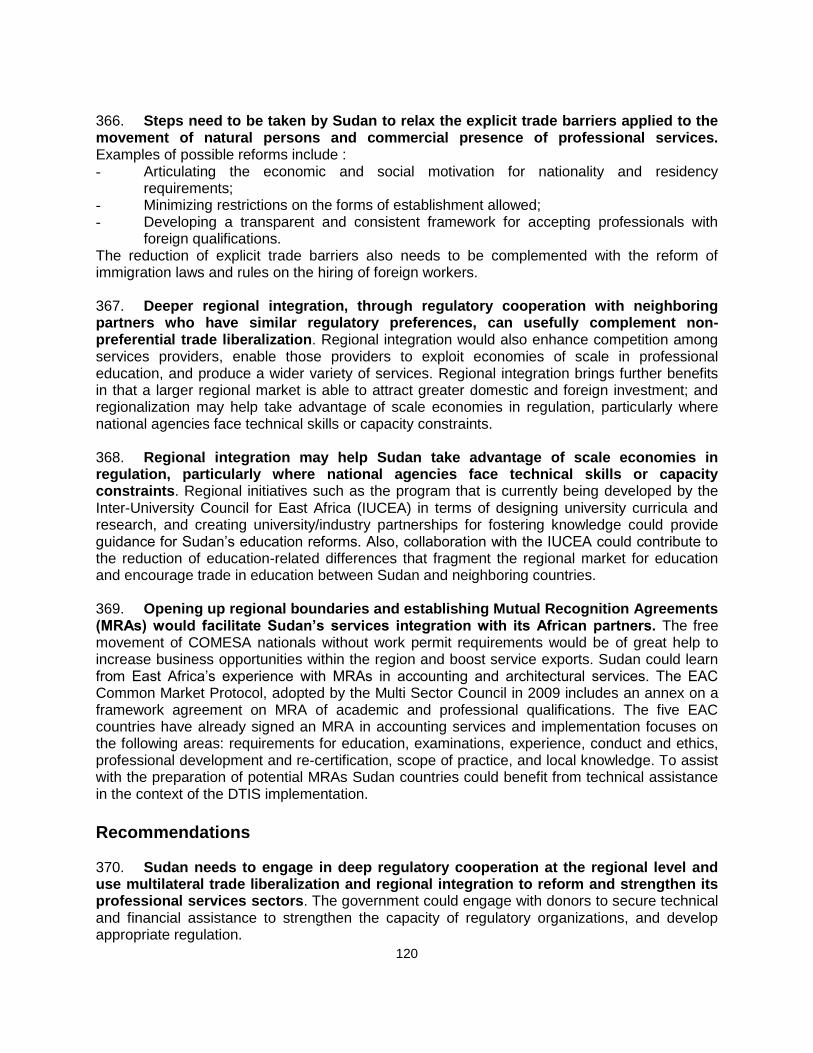
120
366. Steps need to be taken by Sudan to relax the explicit trade barriers applied to the movement of natural persons and commercial presence of professional services. Examples of possible reforms include : - Articulating the economic and social motivation for nationality and residency
requirements; - Minimizing restrictions on the forms of establishment allowed; - Developing a transparent and consistent framework for accepting professionals with
foreign qualifications. The reduction of explicit trade barriers also needs to be complemented with the reform of immigration laws and rules on the hiring of foreign workers. 367. Deeper regional integration, through regulatory cooperation with neighboring partners who have similar regulatory preferences, can usefully complement non-preferential trade liberalization. Regional integration would also enhance competition among services providers, enable those providers to exploit economies of scale in professional education, and produce a wider variety of services. Regional integration brings further benefits in that a larger regional market is able to attract greater domestic and foreign investment; and regionalization may help take advantage of scale economies in regulation, particularly where national agencies face technical skills or capacity constraints. 368. Regional integration may help Sudan take advantage of scale economies in regulation, particularly where national agencies face technical skills or capacity constraints. Regional initiatives such as the program that is currently being developed by the Inter-University Council for East Africa (IUCEA) in terms of designing university curricula and research, and creating university/industry partnerships for fostering knowledge could provide guidance for Sudan’s education reforms. Also, collaboration with the IUCEA could contribute to the reduction of education-related differences that fragment the regional market for education and encourage trade in education between Sudan and neighboring countries.
369. Opening up regional boundaries and establishing Mutual Recognition Agreements (MRAs) would facilitate Sudan’s services integration with its African partners. The free movement of COMESA nationals without work permit requirements would be of great help to increase business opportunities within the region and boost service exports. Sudan could learn from East Africa’s experience with MRAs in accounting and architectural services. The EAC Common Market Protocol, adopted by the Multi Sector Council in 2009 includes an annex on a framework agreement on MRA of academic and professional qualifications. The five EAC countries have already signed an MRA in accounting services and implementation focuses on the following areas: requirements for education, examinations, experience, conduct and ethics, professional development and re-certification, scope of practice, and local knowledge. To assist with the preparation of potential MRAs Sudan countries could benefit from technical assistance in the context of the DTIS implementation.
Recommendations 370. Sudan needs to engage in deep regulatory cooperation at the regional level and use multilateral trade liberalization and regional integration to reform and strengthen its professional services sectors. The government could engage with donors to secure technical and financial assistance to strengthen the capacity of regulatory organizations, and develop appropriate regulation.
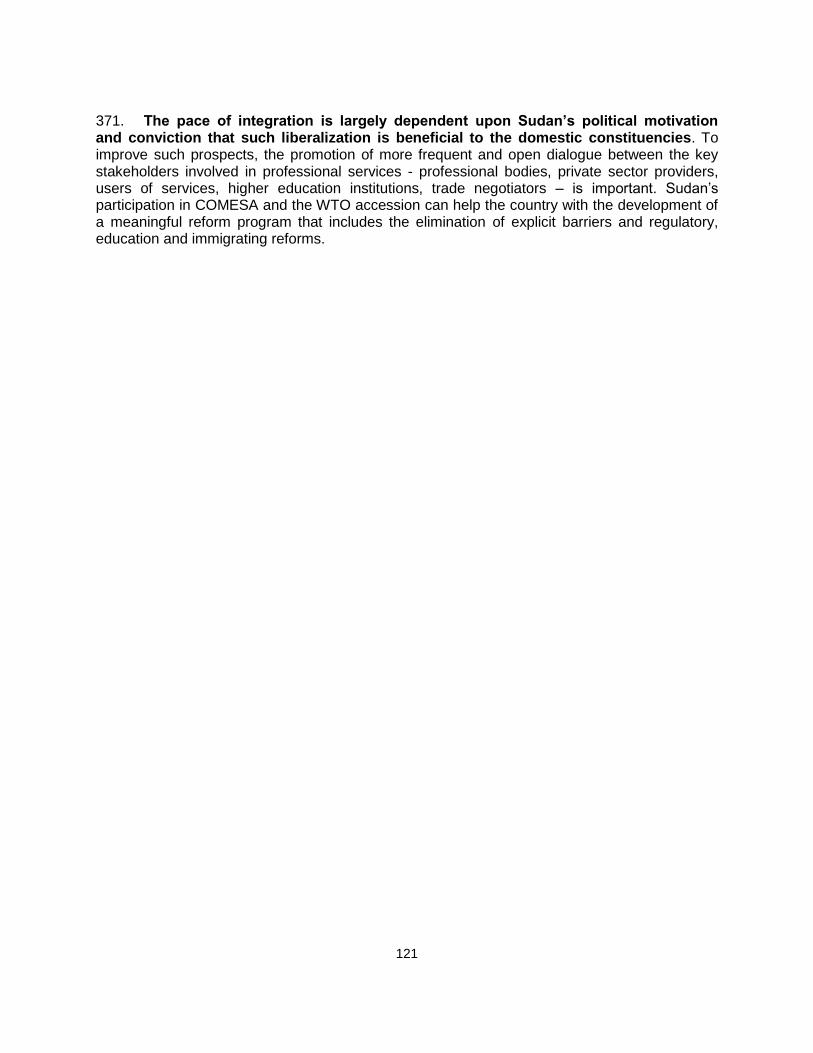
121
371. The pace of integration is largely dependent upon Sudan’s political motivation and conviction that such liberalization is beneficial to the domestic constituencies. To improve such prospects, the promotion of more frequent and open dialogue between the key stakeholders involved in professional services - professional bodies, private sector providers, users of services, higher education institutions, trade negotiators – is important. Sudan’s participation in COMESA and the WTO accession can help the country with the development of a meaningful reform program that includes the elimination of explicit barriers and regulatory, education and immigrating reforms.

122
Chapter 9: Opportunities for growth through diversification: Tourism Overview and Key Issues 372. Sudan has an opportunity to become an important global tourism destination. While largely unknown, Sudan has compelling attractions that could be of strong interest to tourists that seek out culture, adventure, wildlife, and scuba diving opportunities. Realizing this potential requires the removal of regulatory and policy constraints, ensuring stability and security and improving the country’s image in international markets. Addressing these issues will provide the foundation for a productive and dynamic tourism sector in Sudan that can make significant contributions to economic growth, employment generation, cultural and environmental preservation, and social inclusion. 373. Sudan is home to a number of world-class tourism attractions based on its unique cultural and natural resources. However, the reality of a country rich in natural and cultural resources has been overshadowed by the negative consequences of a lengthy civil war and social conflict culminating in the secession of South Sudan in July 2011. Even after South Sudan’s secession in July 2011, Sudan continues to suffer from insecurity77. 374. In terms of culture, the country is well endowed with temples, monuments, and tombs dating back to the time of ancient Egypt, with which the Sudanese lands were closely connected. In fact, Sudan hosts a collection of pyramids that even outnumbers those found in Egypt. The influences of Christianity (6th century) and Islam (as of the 7th century) are also reflected in churches, mosques, and numerous religious antiquities.
375. The country has a diversity of natural attractions in line with its varied ecosystems. The West is characterized by semi-desert conditions, the North is dominated by the arid Nubian Desert, the East contains over 700km of Red Sea Coast, and the South contains forested mountains, swamps, and rainforest. The country has eight national parks, two of which being marine-based. Some of the land-based parks have pockets of terrestrial wildlife that attract tourists interested in safaris. There is also a small hunting market. Yet the country’s top nature tourism product is scuba diving along the well-preserved coral reefs that line the Red Sea Coast.
376. The 2011 secession of South Sudan has helped create momentum towards tourism development in Sudan. First, it has contributed to a process that may lead to the onset of normalization of relations with the wider international community, which is an important step towards attracting more tourists. Second, the loss of a significant portion of its oil revenues78 after secession has forced the government to look at new ways to diversify the economy. Among the various options, the government has made some indications that tourism could become a greater priority.
77 From internal rebellion, tensions with neighbors, and permeable borders that expose the country to
security threats 78
ISN 2014- 2015: It is estimated that Sudan has lost around 70 percent of the oil revenue due to the secession of South Sudan.

123
377. The Qatar-Sudan Archaeological Project signed in April 2013 is a high profile development in support of the sector and has the potential to serve as a catalyst for broader based tourism development in the future. The government of Qatar79 has agreed to provide Sudan with a grant of US$135 million to develop the country’s cultural heritage, with a strong focus on archaeological sites and museums. The project will also address some tourism challenges faced by Sudan, such as accommodation, marketing, interpretation, and transportation to the archaeological sites. For it and subsequent initiatives to be successful, significant improvements will be needed to improve the country’s tourism enabling environment. Impediments related to tourism planning and policies, human resource development, image and marketing, product development, and air and land access will be discussed further within this chapter. Recommendations to address these challenges will also be provided.
378. But issues related to the Sudan’s country image prevail as the key obstacle to further development of the tourism sector. Addressing those issues requires a demonstrable commitment to tourism by enacting key policy changes. Image problems are particularly prevalent among post-conflict countries. Yet many countries, particularly in Africa, have seen success in their post-conflict tourism development efforts. Sudan needs to take some critical initial steps, firstly reducing the bureaucracy and red tape required for obtaining visas, permits, and licenses. Sudan needs to show that it is open to tourism and truly work towards its facilitation. 379. Without stability and security, tourist development efforts will yield limited returns. With them, and in combination with effective sector stewardship, the country’s image will improve.
Size and Structure of the Tourism Sector 380. Sudan lags far behind most of it regional comparators such as Egypt, Ethiopia, Tunisia and Yemen in regards to the development of the tourism sector. Obtaining reliable figures on tourism spending is a major challenge with estimates ranging from $94 million in 2010 to $687 million in 2012. Even using the recent high estimates Sudan’s tourism industry is very small (Figure 40). According to Sudan’s Ministry of Tourism, Antiquities & Wildlife (MTAW), the country earned US$687 million from 555,710 international tourist arrivals in 2012. Official data submitted by Sudan to the United Nations World Tourism Organization (UNWTO) for 2011 had reported receipts of US$185 million based on 536,000 international arrivals. It is difficult to reconcile this large year-on-year increase in receipts, particularly in light of the fact that first semester receipts from South Sudan had been included in the 2011 figures. Furthermore, UNWTO reports official receipts figures from 2010 as US$94 million based upon 495,000 international arrivals to Sudan.
79 Qatar-Sudan Archaeological Project’s CEO: “This agreement comes in the framework of the joint
Qatari-Sudanese project which aims to develop archeological research and exploration, and protect archeological heritage in the Republic of Sudan, particularly in the River Nile and Northern states.
124
Figure 40: Direct Contribution of Tourism to GDP, Selected Countries (2007-2012)
Source: UNWTO (2014) Note: Average for the period 2007-2012.
Contribution to GDP and Exports 381. Tourism’s total contribution (when including both direct and indirect services) to the Sudanese economy in 2012 is 3.1 percent of GDP. Yet, according to the World Travel and Tourism Council (WTTC) the tourism sector directly contributed only 1.3 percent to Sudanese GDP in 201280 (see Figure 41). This figure reflects the economic activity generated by industries such as hotels, travel agents, airlines and other passenger transportation services (excluding commuter services), and restaurants. 382. Tourism was directly responsible for 137,000 jobs in Sudan or 1.1 percent of total employment in 2012 according to the WTTC and earned $90 million in visitor exports. Figure 42 gives the details, but it has to be noted that it also includes South Sudan. This represented only 1.7 percent of the countries’ exports that year. As was the case with contribution to GDP, the 2012 figure is higher than that of the preceding year (121,500) but well below the estimate of 173,000 from 2009. When considering jobs indirectly supported by the sector, tourism’s total contribution to employment was estimated at 350,500 jobs (2.9 percent of total employment). These figures differ considerably from MTAW’s official estimates for sector employment in 2013: 13,500 direct jobs and 9,000 indirect jobs.
80 WTTC figures are for Sudan and South Sudan (as if secession had not occurred).
0
2
4
6
8
10
12
Egypt Ethiopia Sudan Tunisia Yemen
Arrivals Receipts

125
Figure 41: Direct Contribution of Tourism in Sudan to GDP (2007-2012)
Source: WTTC (2013) Figure 42: Direct Contribution of Tourism in Sudan to Employment (2007-2012)
Source: WTTC (2013)
International visitors Sudan received an estimated 555,710 international tourist arrivals in 2012. This represented a year-on-year increase of 3.6 percent, surprising in light of the fact that South Sudan seceded in the middle of 201181 (see Figure 43). The increase in international arrivals from 2010 to 2011 (from 495,161 to 536,400) was even greater (8.3 percent) and also somewhat unexpected given the loss of second half arrival figures due to the secession. It is important to note that most of the international arrivals do not come from leisure tourists. Based
0
20
40
60
80
100
120
140
160
180
200
2007 2008 2009 2010 2011 2012
Cn
trib
uti
on
to
Em
plo
yme
nt
in '0
00
126
on information provided by local tour operators, it is estimated that no more than 10 percent of the arriving tourists are leisure travelers. The majority are business tourists and those visiting friends and relatives (VFR). Leisure tourists tend to be the most highly coveted tourists as they generally spend more overall than other types of tourists. VFR tourists generally do not stay in hotels or take tours around the country. The business tourist segment includes a high number of foreign aid workers, particularly those with projects in the Darfur area. MTAW estimates that among the leisure tourism segments, cultural and beach/diving tourists generally stay 7-14 days, wildlife tourists stay 10-30 days, and adventure tourists stay 7-10 days. Figure 43: International Tourist Arrivals (2007-2012)
Source: Ministry of Tourism, Antiquities and Wildlife
383. Every year a sizeable number of African Muslims travel through the country en route to Mecca as part of the Hajj pilgrimage, blurring Sudan-bound tourism statistics. Those pilgrims often use Port Sudan as a departure point to cross the Red Sea, and hence camp in the Sudanese territory for several weeks while waiting for their licenses to be issued. Their in-country expenditures are likely to be quite limited. In addition to international tourists, MTAW estimates that there are another 55,000 domestic tourists that travel through the country. 384. The largest number of international arrivals into Sudan comes from Europe. While MTAW does not publish arrival statistics broken down by country of origin, it indicates that the largest number of tourists comes from Europe, followed by Asia, the Middle East, Africa, and the Americas. The high season for tourism is from November to May, which corresponds with the cooler months. Temperatures between July and September can be extremely high and therefore act as a deterrent to most leisure tourists. 385. The main gateway into Sudan by air is the Khartoum Airport (KRT), which receives flights from 19 destinations in Africa, the Middle East, and Asia. The Port Sudan airport receives flights from two international destinations: Cairo and Dubai. In 2013, KLM and Lufthansa decided to cancel their operations into Khartoum at present there are no nonstop flights to/from Europe. The most frequent routes connect Khartoum with Jeddah (33), Cairo (33), Juba (20), Qatar (17), Addis Ababa (16), and Dubai (15). 386. Sudan Airways has served as the national carrier since 1940. Since its privatization in 2007, Sudan Airways’ 80 percent shares belong to the government and 20 percent to private shareholders. The airline is currently experiencing severe financial troubles. This in part stems from the US sanctions that began in 1997, which increase the cost of aircraft spare parts. Sudan
0
100000
200000
300000
400000
500000
600000
2008 2009 2010 2011 2012
Nu
mb
er
of
Inte
rnat
ion
al
Arr
ival
s

127
Airways has also suffered from a 2010 ruling by the EU82 banning it from flying into any of its member countries due to safety concerns. 387. Sudan Airways currently offers regularly-scheduled domestic flights to five locations: El-Fasher, Geneina, Kassala, Nyala, and Port Sudan. There are four other domestic air carriers operating in Sudan. While the country has 72 airports, only 15 have paved runways. 388. It is hard to access Sudan by land due to poor roads. The most convenient crossing points are from Ethiopia and Egypt, although the latter is often closed due to diplomatic and trade issues between Sudan and Egypt. The principal seaport is Port Sudan, from which ferries cross to Jeddah in Saudi Arabia. Another commonly traveled route is the Lake Nubia ferry that connects Wadi Halfa in the north to Aswan, Egypt.
Accommodations 389. According to MTAW, the country’s establishments offer a total of 16,700 beds. Of these, 8,118 are in categorized hotels and 8,582 in uncategorized hotels. The total number of accommodations establishments has not been published. However, MTAW indicates that there are only 10 hotels with four or five stars—most of which located in or near Khartoum. MTAW also estimates that there are 60 leisure tourism-oriented resorts. It is common in Sudan to rent apartments or villas, with MTAW statistics indicating that there are 3,846 apartments and 55 villas available to tourists. Tourism Service Providers 390. MTAW indicates that there a total of 14 registered tour operators in Sudan with scuba diving being one of the most important tourism activities. According to MTAW, there are only three diving operators in the country. Apparently only one is internationally certified by the Professional Association of Diving Instructors (PADI). Most tourists who come to Sudan for diving tourism book their tours through international operators who operate live aboard diving vessels. There are an estimated 15 live aboard vessels working off the coast of Sudan. These vessels, most of which fly international flags, have all necessary diving equipment and offer all-inclusive service to tourists, including a decompression chamber in one of the vessels. There are other tourism service providers and Table 29 contains the number of companies involved in other key areas of tourism service provision. Overall, tourism service providers are still limited in numbers, somewhat reflective of the limited tourism sector in general. Table 29: Other Tourism Service Providers
Source: MTAW (2014)
Tourism Policy and Institutional Framework
82 Aviation Safety Network: http://aviation-safety.net/database/operator/airline.php?var=5245
Type of Service Companies
Car hire companies 113
Ground transportation 40
Travel agencies 14
Scuba Diving Operators 3
Restaurants 269
128
391. The Ministry of Tourism, Antiquities and Wildlife (MTAW) is the sole body charged with managing the tourism sector in Sudan and is responsible for all tourism development issues in Sudan including policy setting, standards and licensing, tourism investment promotion, wildlife protection, and marketing. The MTAW, is organized into three specialized units: 83 (1) The General Directorate for Conservation and Protection of Wildlife, responsible for establishing and maintaining parks and reserves; (2) The Police Department for Tourism Security and National Heritage, responsible for tourist safety as well as the protection of antiquities, artefacts, and national heritage; (3) The National Cooperation for Antiquities and Museums, responsible of establishing new museums and conducting archaeological surveys, research, and excavation 392. There are several private tourism associations 84 organized by specific sub-sectors. Yet they have few members and therefore do not represent the majority of businesses in the industry. They include the Hotel Association, Tour Operation and Travel Agencies Association, Limousine Association, Apartments Association and Touristic Transportation Associations. There is no umbrella organization to represent the interests of the entire tourism sector organization. Because of the association’s limitations, private sector operators within the tourism value chain tend to work on an isolated basis. Hotels generally have their own advertising programs and for most activities such as cultural heritage travel and scuba diving rely on direct contacts through the Internet and international tour operator representation. 393. In 2004 the MTAW developed a 25-year tourism strategy with technical assistance from UNWTO. It contains 24 specific suggestions, out of which seven items have been subsequently prioritized: (1) Enactment of laws regulating tourism activities in Sudan; (2) Execution of comprehensive surveys (comprising tourism assets, infrastructure, facilities and manpower) in all States; (3) Preparation and dissemination of improved promotional materials; (4) Drawing up of a tourism investment portfolio for the local and foreign markets; (5) Facilitation of entry procedures (immigration, customs); (6) Training of staff through co-operation with friendly and sisterly nations; and (7) Rehabilitation and modernization of Arous tourist village and Erkowit summer resort (both near Port Sudan).
394. In 2007, the Government of Sudan created a six-year political plan which included a strategy for tourism. It has little specific detail, but lists a number of objectives and goals. Within the objectives section, it highlights how tourism can boost the economy, create employment, attract foreign investment, improve living standards, alleviate poverty, and empower communities to protect wildlife. The list of goals includes increased protection of cultural heritage, establishment of more museums and monuments, creation of new nature reserves, establishment of new tourism training institutions, construction of new accommodations and tourism facilities, and the establishment of tourism ministries at the state level.85
83 http://world2013.itu.int/exhibitors/ministry-of-tourism-antiquities-wildlife/
84 Information given by the MTAW
85 http://www.anc-sudan.com/sixyears.htm
129
395. The Tourism Development Plan (2014) represents a welcome update taking into account the changes following the secession of South Sudan. Tourism plans provide critical guidance for managing the sector and given the fast-changing nature of the industry most tourism plans are updated every 5 to 10 years. The new Plan looks to the tourist sector to support local community development create employment, and contribute to protecting the natural and cultural heritage. The Plan contains a long list of commitments including increasing the size of the reserved areas (to 17 per cent of total land area), carrying out a tourism survey, developing a media plan to improve the image of Sudan, rationalizing the legal and regulatory framework, facilitating the issuing of visas, and establishing investment incentives for the private sector. The 2014 Plan identified three broad activity areas: infrastructure development (and rehabilitation); legal and institutional reform; and tourism promotion. The updated Tourism Development Plan represents a positive step forward by the GOS.
Tourism Development Challenges 396. A number of severe challenges to tourism development can be identified for Sudan to realize its potential to become a viable center for tourism in the region. The most significant constraints are highlighted below organized into five categories: Policy and Planning, Human Resource Development, Air and Land Access, Product Development, and Marketing. Policy and Planning 397. The current visa regime is not conducive to tourism. Unlike most other export sectors, tourism depends upon the customer coming to the place where the products and services are supplied. As this entails cross-border movements of tourists, immigration and entry/exit control regulations play an important role in the sector. Travel to Sudan is bureaucratic, time consuming, and expensive for the tourist. Unlike nearly every other country in Africa, no tourists are eligible to obtain visas on arrival in Sudan. Instead, all tourists need to procure visas prior to arrival (or work with a registered local tour operator who can arrange for a counter visa for an additional cost). This process is not only expensive (approximate visa cost US$100) but also requires the additional logistical burden of having to acquire a letter of invitation/introduction. Those not living in cities with a Sudanese consulate must bear the additional costs of sending application materials to a Sudanese consulate through a courier service. 398. In-country bureaucratic procedures are an impediment to the free flow of tourists. Visitors are required to register with the Ministry of Interior within three days of entering the country. Registration costs US$60 in Khartoum and can consume the better part of a day. Alternatively many hotels will complete the registration on behalf of the tourist, but this still entails the tourist spending at least 24 hours in Khartoum before proceeding to the desired destination. Registration can be also done at the Red Sea for tourists that fly directly into Port Sudan. Additionally, tourists are required to obtain permits from the Ministry of Tourism for land travel and photography of any kind (at no cost). These extra burdens and costs, for which no parallel can be found within countries trying to promote tourism, act as a strong deterrent to prospective tourists. 399. US sanctions against Sudan blocks access to tourism technology and use of credit cards. The US embargo has had a negative impact on tourism to the country, both in terms of creating a much more challenging business environment for operators as well as creating a major inconvenience for tourists. Tourism businesses face major challenges when
130
trying to obtain essential equipment such as commonly-used front desk and restaurant management systems. Without the ability to use credit cards, they must spend time and money to obtain licenses in order to make international transfers of funds. The embargo also results in high transactional costs for tour operators and hotel owners to receive funds sent by international tour operators via non-commercial banking systems such as Western Union or wired through third party accounts in neighboring countries. 400. Most importantly, international tourists are accustomed to using a credit card to guarantee services prior to arrivals or paying for services once in the country. Many also rely upon being able to withdraw local currency through ATM machines. Yet, as ATM and credit cards are not accepted in Sudan, tourists are forced to bring all the funds needed for their trip in cash. For example, a family of four visiting the country for 10 days (at an average expenditure rate of US$150 per person) would need to carry US$6,000. This is not only a major inconvenience, but also creates safety concerns. Likewise, it represents an added risk to tourism businesses, which have to ensure services (accommodations or tours) without a guarantee of being paid in case the tourists do not appear. 401. Tourism statistics collection efforts have numerous gaps undermining efforts for tourism planning and development. It is difficult to undertake tourism planning and development without robust and reliable statistics. This is a problem which many African countries face. Yet in the case of Sudan, tourism statistics collection and reporting is particularly rudimentary. Data on international arrivals and receipts, arguably the most important tourism metrics, appear to have inconsistencies. Furthermore, MTAW does not publish arrivals information by country of origin, purpose of visit, port of entry, or month of entry. MTAW also does not regularly conduct tourist motivation and expenditure surveys. As such, it does not have accurate figures for key data areas such as length of stay, primary and secondary motives for visit, daily expenditures, area(s) visited, level of satisfaction, and intention to return. Additionally, statistics on accommodations establishments and other tourism service providers appear to be incomplete. Human Resource Development 402. Low institutional capacity constrains tourism development. As MTAW is responsible for every aspect of tourism development in the country, much depends upon its ability to effectively guide the sector. Yet there are important capacity constraints within MTAW. Likewise, there are important gaps within the private sector, both at the association and individual business level. 403. The tourism workforce lacks skills required by industry. Tourism business owners report that there is a significant gap between the skills that the tourism labor force currently possesses and those which they require. More specifically, the existing labor force, while friendly and welcoming, does not have the necessary language and service training needed to work in the sector. Two training colleges and four universities offer tourism courses however these institutions lack qualified instructors as well as the necessary training equipment and facilities.
131
Image and Marketing
404. Perception of Insecurity continues to harm tourism image. Years of civil war and social strife have resulted in a very poor tourism image for the country. This is regularly reinforced through the news media and many governments’ official travel warnings. Marketing and public relations activities that are able to effectively reinsert post-conflict countries onto the international tourism map are highly challenging endeavors that require effective marketing accompanied by financial resources. Yet the tourism sector in Sudan has a very modest marketing operation. The Department of Tourism’s annual marketing budget of approximately US$200,000 allows for only the most basic of promotional activities. As such, the country has only been able to attend a few international tourism fairs in recent years and has not been able to update its marketing materials. Of note, however, is that MTAW launched an International Tourism and Marketing Fair86 in 2013 to inform the market of the country’s tourism attractions and investment opportunities. Lessons could be learned from other countries, notably Rwanda, which turned around its image after civil war and genocide in the 1990s (Box 4). Product Development 405. Sudan’s array of tourism products is very limited. Given Sudan’s limited focus on tourism in the past, it is not surprising that there are few well-developed products. This is evidenced by the fact that there are only ten five or four-star hotels in the entire country. Outside of the capital, few hotels of international standards exist, with vast spaces that have no lodging options whatsoever. The number of tour operators, restaurants, and other tourism service providers is also indicative of a nascent sector. Furthermore, there are very few tourism sites or attractions that have been planned and are under skilled management. The vast country only has eight national parks and of these, half do not have management plans. 406. Attracting private investment into the tourism sector is difficult in Sudan’s case. Attracting both domestic and foreign tourism investment is highlighted as one of the sector’s top priorities both within the 2014 tourism strategy and the 2007 six-year political plan. With the exception of the large commitment from the Qatari government, investment has not materialized. This is fact one of the main reasons that the range of tourism products is so limited. For domestic investors, capital is very difficult to access within the country. Furthermore, few foreign tourism investors are attracted to the country given the poor current investment climate. This includes a number of the issues mentioned earlier such as the onerous visa regime, financial difficulties related to the US Sanctions, and lack of strong sector leadership. Land policy also remains a challenge for investors. 407. The infrastructure at or near tourism sites is insufficient. Numerous infrastructure gaps exist in and around tourism sites of current or potential importance. MTAW highlights the lack of electricity along the Eastern Circuit, Northern Circuit, and national parks such as Dinder and Senganaib. It also indicates the scarcity of water along the Northern Circuit. Road and airport infrastructure is discussed in the following section.
86 Organized by the Ministry of Tourism, Antiquities & Wildlife. Venue: Buri Fair Ground, Khartoum, 8-12
April 2013.

132
Air and Land Access 408. International air access is Limited and on the decline. Lufthansa and KLM’s cancellation of routes connecting Khartoum to Frankfurt and Amsterdam, respectively, makes attracting European tourists considerably more difficult. Furthermore, the EU ban of Sudan Airways prevents the airline from filling the gaps created when these two airlines abandoned their Sudan operations. Nevertheless, there is still good international access to Khartoum via the Middle Eastern hubs of Doha, Dubai, and Abu Dhabi. Yet access to Port Sudan, a logical tourism hub for Sudan, is currently limited to just one weekly flight from Cairo and Dubai, respectively. 409. There is limited and unreliable domestic air coverage. Sudan is not only a very large country, but its principal tourism attractions are quite spread out. Yet the number of domestic routes to key tourism areas such as Port Sudan is very limited and unreliable, which makes trip planning very difficult for tour operators and individual tourists--even a few hours delay can adversely impact carefully laid travel plans for successive days. 410. This is paired with inadequate road access to key tourism sites. The limitations in air travel are all the more constraining in light of the country’s poor road network. The main road to the principal tourism sites in the North and Nile state is extremely busy with heavy goods and access to several cultural sites is challenging (with inadequate signage).
Box 4: Rwanda Rising – A Nation Rebuilds and Rebrands In 15 years, Rwanda has changed its reputation from that of genocide to that of a premier tourism destination in East Africa. Kigali, the capital, boasts internationally-branded tourist hotels, gourmet cafes, Wi-Fi, and shopping malls. The leadership of President Paul Kagame has been much credited with the rebranding success. The two most striking elements to the re-branding campaign are as follows:
1) They dramatically changed the message. The story about poverty and genocide was acknowledged - and then replaced by one of optimism, investment and success. The president spent much time in the USA courting businessmen and showing a different face to the one people were expecting.
2) They practiced what they preached. These were not empty promises and fabricated successes. Each positive story that came out could be witnessed and validated, lending huge credibility and a real sense of optimism and change to the nation brand. In a digital age where everyone has a phone and can be a reporter - this truth becomes more and more important.
The country was also very successful in positioning itself around its primary tourism draw: highland gorillas. With limited financial resources to conduct its branding campaign, the country utilized creative and cost-effective mechanisms. For example, it enlisted the support of Hollywood celebrities such as Sigourney Weaver (who played Dian Fossey in the movie “Gorillas in the Mist”) and Daryl Hannah. It also generates a large amount of international press by inviting international luminaries to participate in Kwita Izina, the annual gorilla naming ceremony. Based on box from The World Bank (2013b).
133
Recommendations87 Short-term policy recommendations 411. Streamline in-country registration procedures through one-stop shop. While each country must balance economic benefits against security needs, it is recommended that the current in-country requirements be greatly streamlined and facilitated through a “one-stop-shop” approach. This would allow the tourist to visit one single office, where he or she would be able to officially register and also obtain permits for travel and photography in a timely manner. Eventually, however, it would be advantageous from a tourism perspective to eliminate such requirements altogether. 412. Improve statistics collection efforts. Reliable and consistently collected data is necessary for measuring the sector’s performance and making important decisions in areas such as product development, investment promotion, and marketing. MTAW should first focus on ensuring that accurate arrivals data is collected and input into electronic systems. It can then be parsed into meaningful data sets that reveal important information such as country of origin, purpose of visit, port of entry, and monthly/seasonal flows. Soon thereafter, the information should then be placed on the MTAW website so that it is easily accessible to all public and private sector stakeholders. 413. Collect visitor expenditure and satisfaction surveys at least once every two years. This would be done ideally with data capture both in the high and low season. Such feedback would provide important data regarding the visitor’s reason for visit, length of stay, expenditures, and level of satisfaction. Finally, inventories capturing data on accommodation capacity and sector employment should be conducted annually. 414. Provide short courses to build MTAW tourism capacity. A survey should be conducted within MTAW to determine critical knowledge gaps amongst staff members. These may include areas such as tourism planning, product development, and marketing. A series of short courses should then be offered to address these needs. If suitable trainers cannot be found in Sudan, they can be recruited from countries that have faced similar challenges to Sudan. 415. Offer Training-of-Trainer courses in key hospitality themes. Based on a review of critical skills and knowledge gaps among tourism service providers, several courses should be offered utilizing the training-of-trainers (ToT) format. Courses should be geared towards front-line service workers such as hotel reception workers, waiters, cleaning staff, and tour guides. Those taking the course, however, would be managers of hotels, restaurants, and tour operators (including representatives of the private sector associations) as well as instructors at the tourism training institutions. They would then be able to pass on the information through subsequent training courses of their staff and students.
87 Recommendations are divided into three categories: short term, medium term, and long term. Short
term initiatives are those who implementation should begin within the next year. Medium term initiatives are those whose implementation should begin between one and two years from the current date. Long term initiatives are those that would likely commence after two years, although earlier implementation should not be precluded.
134
416. Develop marketing/PR strategy to improve the country’s image and international visibility. It is possible to change negative perceptions of a country and create a positive national image through a skilled marketing and PR campaign. For example (Box 4), Rwanda, in the aftermath of the genocide, was able to successfully position itself as the world’s premier destination for seeing mountain gorillas. Sudan should similarly design a strategy aimed at positioning it as an up-and-coming tourist destination, highlighting its unspoiled archaeological sites and pristine coral reefs. The plan must outline a cost-effective approach through the strategic selection of appropriate distribution channels. These will likely include engagement with the international media through press releases and press trips that can help present the country in a different light. 417. Focus tourism development efforts on a few priority clusters. While there are a number of areas that seem to hold tourism potential, destination development should take a phased approach. Priorities should be set based upon studies of market demand and availability of investment capital. Given the large amount of capital that had been pledged by the Qatari government, the upcoming archaeological project should to some extent dictate future tourism development corridors. An area on the Red Sea Coast with strong scuba diving potential would also seem to be a logical option for initial development. Medium-term policy recommendations 418. Allow visas on arrival for select source countries. In order to facilitate travel to the country, as well as send a strong signal to the market that Sudan is truly open for tourism, visas on arrivals for select countries should be offered at all major border posts. The list of eligible countries may be small initially, as this may allow for easier buy-in from the country’s security apparatus. Gradually, as confidence builds, more countries can be added to the list. It is important to note that the country’s security should not be compromised through this policy, as immigration officials will still be able to conduct full background checks on incoming tourists and compare their names against the country’s “watch list”. The country will still retain the right to refuse entry to anyone deemed a security risk. See Box 5 for some insights from the UK on attracting Chinese tourists. 419. Reinforce regulations for cultural preservation and environmental protection. One of the advantages of having received few tourists in the past is that important cultural and natural resources have not been over-exploited. This includes some virtually untouched archaeological sites and the still pristine coral reefs that line the Red Sea. Yet as Sudan prepares to receive more tourists, it should heed lessons learned from other destinations that allowed unplanned and poor regulated tourism to inflict irreversible damage on some its most treasured assets. This is an opportune time for Sudan to review legislation that governs its cultural and environmental heritage so as to ensure that tourism will serve to protect rather than degrade the country’s valuable resources. 420. Build on the new national tourism plan. The new national tourism plan recognizes Sudan’s present situation and outlines the overall vision and strategy for sustainable development of the country through tourism. While a large number of interventions and actions are proposed it would be useful to develop this further by producing a very specific and practical action plan. The focus should include national-level as well as destination-level approaches. It is important that the detailed action plan be created through collaborative process, including all sectors involved in tourism development (i.e. environment, transport, health). This can help
135
secure broader sector buy-in among key stakeholders. A solid strategic approach to tourism development will also help inspire confidence among potential investors. It is recommended that it be accompanied by a Monitoring & Evaluation (M&E) plan so that implementation performance can be regularly tracked.
421. Upgrade the tourism training institutions. The most critical component of this endeavor will be to build the capacity of instructors. This can be achieved in part through the aforementioned Training of Trainers (ToT) courses. Also, Sudan may seek to undertake exchanges through which seasoned faculty of schools in allied nations spend a few weeks or even a semester teaching courses. They may also provide guidance on course curricula. Upgrading of equipment and facilities to better reflect current industry realities will also be important. 422. Create a national tourism brand. As an extension of the marketing strategy, Sudan should endeavor to produce a highly-recognizable brand. An experienced destination branding company should be engaged to ensure professional output. Also, a highly inclusive process should be utilized to ensure broad stakeholder buy-in. The brand should ultimately highlight the country’s comparative advantages within both the regional and global context. 423. Search for ways to integrate local communities into tourism offer. If tourism does not benefit local populations, it is unlikely to succeed in the long run. Destination development should be driven by the potential livelihood opportunities for local populations. Communities that are well integrated into tourism plans and able to derive benefits from tourism are far more likely to help preserve the natural and cultural resources that attract tourists. Furthermore, interaction with communities tends to greatly enrich the tourist’s experience, thus adding value to the product that is being offered. 424. Work with the Civil Aviation Authority to improve safety so the EU Ban on Sudan Airways is lifted. The cancellation of Lufthansa and KLM flights combined with the EU ban serve as a major barrier to attracting tourists from most of the largest cultural, natural, and
Box 5: UK Visa Reform Targets Chinese Tourists In a targeted attempt to lure Chinese tourists to the UK, the Government has simplified the visa application process for Chinese nationals. Tourism body Visit Britain recently calculated that 61% of Chinese people who chose not to come to Britain were put off by the visa process. As Chinese visitors spend around three times as much as other visitors, the UK believes they should be doing anything they can to attract more - to help to boost the economy. The UK attracted around 149,000 visits from China in 2012, but it was outperformed by European rivals such as France and Germany. Visit Britain is looking to increase this to 382,000 visits by 2020. New measures include a shortened online application form, with translated forms available from April 2013, dedicated Embassy staff to help business travelers with their applications, reduced documentary requirements and the option for applicants to keep their passports while visas are processed. These measures were all identified by the Government as areas where they could out-compete the visa requirements of the Schengen member states, as well as Australia and the USA. "China is a key growth market for international tourism and a market in which Britain needs to compete effectively to ensure that we continue to be in the top 10 of tourism destinations. Improvements in the visa process will support our ambition to attract 40 million visitors a year by 2020." Visit Britain, January 2013. Based on box from The World Bank (2013b).
136
adventure tourism markets. Sudan’s Civil Aviation Authority should work diligently to improve the internal procedures it uses to ensure that Sudan Airway’s planes are maintained and serviced according to the highest international safety standards. Once the ban is lifted, Sudan Airways will then be able to re-establish direct flights between Sudan and Europe. 425. Negotiate with international airlines to increase flights to Port Sudan. Given the unreliable access from Khartoum, Port Sudan will need to receive more direct international flights if it is to develop into a tourism hub. If foreign carriers see significant investment in hotels and infrastructure, they will be more inclined to add routes or increase current frequencies to Port Sudan. This is particularly likely in the case of the proactive and highly competitive carriers from Gulf countries. Nevertheless, there is still an important role for the government to play in attracting additional airlift. In some cases, this may include provision of fiscal incentives for entering into the market.
Long-term policy recommendations 426. Strategically upgrade the tourism infrastructure in the country. Based on key tourism sites and circuits that have been prioritized, infrastructure upgrades will be critical. These should primarily focus upon areas such as electricity, water, and internet connectivity. This will involve liaising with other government agencies so that they can incorporate tourism requirements into their decision making processes. 427. Prioritize strategic tourism roads for upgrading. MTAW should ensure that its road priorities are underscored when the government makes plans for national road upgrading projects. MTAW has indicated that roads leading to Dinder National Park as well as Nagaa and Musawarat are of prime importance. Furthermore, decisions should be based on the tourism clusters that will be prioritized for development in the coming years.

137
Appendix 1: DTIS 2008 Action Matrix Scorecard In this annex, the status of each action of the DTIS 2008 is presented, as per December 2013. The status is presented based on the following key: 100% - Fully implemented 75% - Mostly implemented, but key areas are missing 50% - Half implemented 25% - Implementation has started, but implemented is well below half way 0% - Implementation has not started, or implementation started but the effort ended over the past ten years. The degree of impact is presented based on the following key (where relevant this impact is represented by the author’s perceived decline in trade costs. E.g. 25% represents a low reduction in trade costs caused by the action in 2013 compared with 2008): 100% - Full intended impact 75% - Above average rate of impact 50% - Average rate of impact 25% - below average rate of impact but above insignificance 0% - insignificant or zero impact
Theme Activities Implementation rate %
Degree of Impact %
Reasons for success/ failure
Increase Productivity in Export Sectors Activities 1 A increase resources for agricultural and animal husbandry and fisheries and micro-agro industrial research
Staff, equip, and fund research into raising yields of existing and potential exports
50 50 Research for raising productivity in agricultural crops continued with limited budget and a lot of varieties that suit Sudan conditions were released (main emphasis on cereals, cotton and horticultural crops). For animals research has been implemented with attention to boost vaccines production satisfying the needs to protect livestock from contagious diseases and continue efforts of genetic improvement as well as efforts to propagate findings of research in aquaculture. Research centers in Darfur States like needs to be improved. They are lagging behind due to insecurity and lack of budget.
2%of agricultural GDP spent on research over 5 years
0 0 No quota for agricultural research. Support from donors has declined.
Select priority sectors for targeted 75 50 For animals research is targeting genetic improvement for beef and

138
research efforts, with specific sequencing of activities over a five year timeframe
dairy as well as poultry and improving quality of produce. In agricultural crops research is targeting export-oriented goods (traditional and new). Because of limited budget from government and lack of external support, achievement is attributed to classification of historical contributions and results of improving practices
Carry out land tenure policies and studies
0 0 Land tenure issue has not solved because of its complexity. Government owns 90% of land and lends to farmers with long-term lease contract. However, if a farmer lives at the land for more than 10 years, s/he can claim land entitlement, which makes land tenure issue complex. Government seems to give up solving this complexity. Instead, government now gives 25% of newly irrigated, developed area to investors living in the area as compensation.
Adopt input subsidies policy to small producers
75 50 Government provides subsidies for emergency intervention case by case only. Government stopped subsidies in 2011 and now provides support in other forms. The main reason is lack of government prioritization (and also lack of budget?). Subsidies scheme until 2011 was: 25% of fuel price, pesticide and fertilizer price, 22% for other inputs, and free seeds for sorghum and cotton. The reason for stopping subsidies is mismanagement and corruption. Now farmers get subsidized input at subsidized price through banks, not from government because banks are more reliable than state governments which can use the fund for other purposes.
Coordination of research institutions at the national level
25 25 National coordinator for agricultural research was placed at M. of Science and Technology till 2011. Recently ARC designed three committees for research coordination (crop protection, husbandry, varieties). Higher Council for Research has been proposed but not realized. The progress is limited due to a lack of government interest.
Strengthen & support production and marketing cooperatives and establish export centers
25 25 Support to exporters has been implemented by distributing manuals. Export centers were established but are not functioning due to limited export competitiveness of small scale agricultural products exporters. The main reason is, therefore, attributed to lack of constituency.
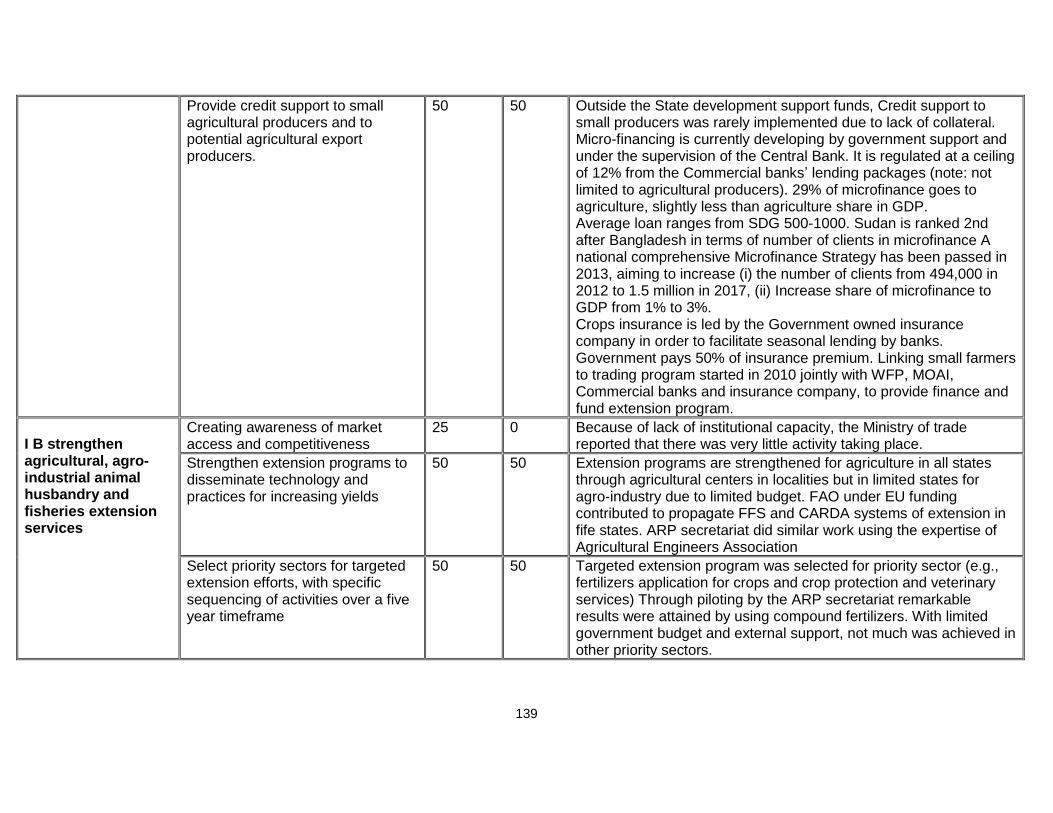
139
Provide credit support to small agricultural producers and to potential agricultural export producers.
50 50 Outside the State development support funds, Credit support to small producers was rarely implemented due to lack of collateral. Micro-financing is currently developing by government support and under the supervision of the Central Bank. It is regulated at a ceiling of 12% from the Commercial banks’ lending packages (note: not limited to agricultural producers). 29% of microfinance goes to agriculture, slightly less than agriculture share in GDP. Average loan ranges from SDG 500-1000. Sudan is ranked 2nd after Bangladesh in terms of number of clients in microfinance A national comprehensive Microfinance Strategy has been passed in 2013, aiming to increase (i) the number of clients from 494,000 in 2012 to 1.5 million in 2017, (ii) Increase share of microfinance to GDP from 1% to 3%. Crops insurance is led by the Government owned insurance company in order to facilitate seasonal lending by banks. Government pays 50% of insurance premium. Linking small farmers to trading program started in 2010 jointly with WFP, MOAI, Commercial banks and insurance company, to provide finance and fund extension program.
I B strengthen agricultural, agro-industrial animal husbandry and fisheries extension services
Creating awareness of market access and competitiveness
25 0 Because of lack of institutional capacity, the Ministry of trade reported that there was very little activity taking place.
Strengthen extension programs to disseminate technology and practices for increasing yields
50 50 Extension programs are strengthened for agriculture in all states through agricultural centers in localities but in limited states for agro-industry due to limited budget. FAO under EU funding contributed to propagate FFS and CARDA systems of extension in fife states. ARP secretariat did similar work using the expertise of Agricultural Engineers Association
Select priority sectors for targeted extension efforts, with specific sequencing of activities over a five year timeframe
50 50 Targeted extension program was selected for priority sector (e.g., fertilizers application for crops and crop protection and veterinary services) Through piloting by the ARP secretariat remarkable results were attained by using compound fertilizers. With limited government budget and external support, not much was achieved in other priority sectors.
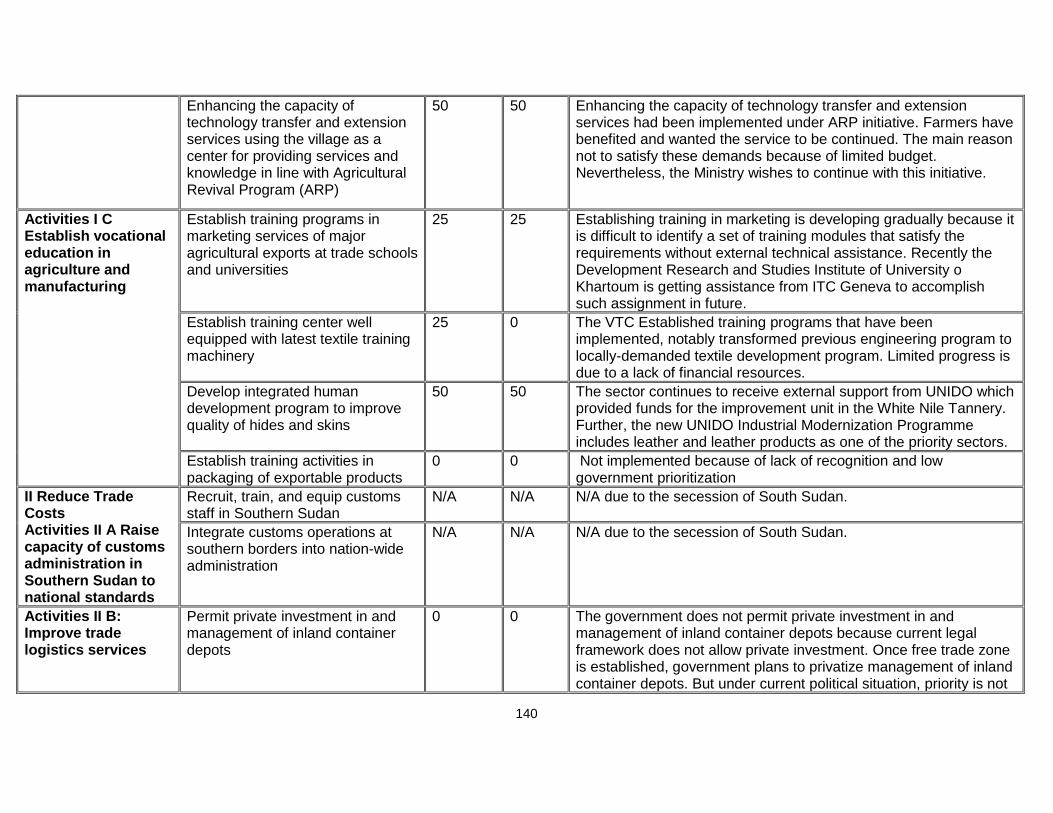
140
Enhancing the capacity of technology transfer and extension services using the village as a center for providing services and knowledge in line with Agricultural Revival Program (ARP)
50 50 Enhancing the capacity of technology transfer and extension services had been implemented under ARP initiative. Farmers have benefited and wanted the service to be continued. The main reason not to satisfy these demands because of limited budget. Nevertheless, the Ministry wishes to continue with this initiative.
Activities I C Establish vocational education in agriculture and manufacturing
Establish training programs in marketing services of major agricultural exports at trade schools and universities
25 25 Establishing training in marketing is developing gradually because it is difficult to identify a set of training modules that satisfy the requirements without external technical assistance. Recently the Development Research and Studies Institute of University o Khartoum is getting assistance from ITC Geneva to accomplish such assignment in future.
Establish training center well equipped with latest textile training machinery
25 0 The VTC Established training programs that have been implemented, notably transformed previous engineering program to locally-demanded textile development program. Limited progress is due to a lack of financial resources.
Develop integrated human development program to improve quality of hides and skins
50 50 The sector continues to receive external support from UNIDO which provided funds for the improvement unit in the White Nile Tannery. Further, the new UNIDO Industrial Modernization Programme includes leather and leather products as one of the priority sectors.
Establish training activities in packaging of exportable products
0 0 Not implemented because of lack of recognition and low government prioritization
II Reduce Trade Costs Activities II A Raise capacity of customs administration in Southern Sudan to national standards
Recruit, train, and equip customs staff in Southern Sudan
N/A N/A N/A due to the secession of South Sudan.
Integrate customs operations at southern borders into nation-wide administration
N/A N/A N/A due to the secession of South Sudan.
Activities II B: Improve trade logistics services
Permit private investment in and management of inland container depots
0 0 The government does not permit private investment in and management of inland container depots because current legal framework does not allow private investment. Once free trade zone is established, government plans to privatize management of inland container depots. But under current political situation, priority is not

141
given to this issue.
Permit corporate entities to provide customs clearance services
0 0 Both the General Customs Administration (GCA) and MOF officials said that the government does not permit (fully private) corporate entities to provide customs clearance services due to a lack of government prioritization. As is the same for private investment in container depots, government is interested in permitting in near future. The corporate entities currently under operation are ex-customs officers. The main reason of no progress is a lack of government priority. While GCA supports opening up customs clearance to private corporate entities, MOF stated that current situation is fully privatized. This is already adopted and the services providers are grouped in associations at sea ports as well as air ports
Provide technical assistance for freight forwarders from the International Federation of Freight Forwarders Associations
50 50 The Sea Ports Corporation is organizing such activities in connection with the freight forwarders when funds are available
Conduct comprehensive review of regulatory framework governing entry and operation of trade logistical services providers
50 0 This activity is entrusted to The National Committee on Trade Facilitation as reported by high officer of the National Customs Authority The National Committee on Trade Facilitation was formed in 2007 to address problems of trade facilitation. Working group was established in 2011 to assess the needs and priorities to facilitate trade. Notable achievement was the preparation of the national plan for the enforcement of the requirements of trade facilitation in March 2013 with support from UNCTAD. The plan finds that out of 39 international standards on trade facilitation, Sudan: (i) fully applied 14 standards such as the right to appeal, pre-shipment procedures and temporary entry; (ii) partially applied 15 such as publication of customs time release study and freedom of transit; and (iii) not implemented 10 standards such as single window. However, implementation of partially applied and non-implemented standards shows limited progress. There could be two reasons behind this: (i) the report has not been approved by the Cabinet; and (ii) lack of budget and donor support to enforce the remaining

142
standards not implemented.
Activities II C reduce bottlenecks at Port Sudan
Conduct WCO time release study to clarify contributors to bottlenecks
100 0 The study was conducted by the GCA and a copy was provided with explanations on progress.
Introduce single window for all border clearance operations
25 25 It is still underway to introduce single window for all border clearance operations. Sudan needs (i) to fully implement recommendations by the above reports; (ii) to promote cooperation between customs authority and other relevant government agencies and border control; (iii) to establish network connectivity among government agencies; and (iv) to enhance capacity building of their staff. The main reason for progress at Port Sudan and no progress at land border points is attributed to external support.
Accelerate concession of port management
100 25 implementation was delayed because of resistance from interest groups Acceleration of concession of port management was implemented. 10 companies bid for concession of port management and Philippine’s company won the bid. Port management started in October 2013, so cannot evaluate the impact at this moment.
Raise storage fees to discourage use of port facilities as a warehouse
100 100 It was fully implemented by putting facilities in an enclosure far away from the port yards.
Introduce one-stop shop for all border clearance operations
100 50 The one-stop shop has been introduced at Port Sudan.,. Establishment of one-stop shop is particularly important at border posts with South Sudan, Ethiopia and Eritrea.
Activities II D Build/ Improve SPS capacity
Develop nation-wide standards action plan with the objective of reducing regulatory overlap and increasing investment in trade
25 0 Government formed a joint technical committee to reduce overlap. But the committee is temporally stopped due to change in personnel. Federal ministries and agencies handle issues related to SPS matters due to lack of reform in legislative and regulatory framework. Investment in key functionalities and enhancement of rules supporting implementation are limited. This leads to following constraints: (i) the number of mandatory standards that are aligned with international standards is relatively low; (ii) the ability to provide traceability to the market is very low; (iii)no accreditation body to formally recognize competence that is able to enter into cross border agreements; and (iv) the non-acceptance of international tests results in widespread redundant

143
testing.
Raise awareness of quality assurance and regulatory compliance among producers
50 50 SSMO has state offices which are entrusted with raising awareness among producers on quality assurance and compliance but still a long way to go
Provide extension services to producers to introduce Good Management Practices (especially along value chains for livestock/meat, horticulture, and processed foods)
75 50 This activity was implemented jointly (SSMO in coordination with Ministries of Agriculture, and Livestock and Fisheries) but with average degree of impact
Strengthening institutions responsible for SPS activity
25 0 Due to lack of (i) sufficient legislative and regulatory framework, (ii) sufficient operations such as inspection procedures and certification system, and (iii) infrastructure, capacity of SPS-related institutions remain weak. As pointed out in Action 27, the main reason for this lack of progress is lack of capacity, budget and interest.
Activities II E Streamline national customs procedures and harmonize them with WTO rules
Revise customs laws to comply with WTO rules on valuation, appeals, etc.
25 0 The legislation was amended however, Customs continues to rely on physical inspection and use the BDV
Undertake institutional changes to introduce risk-based selection: develop risk profiles, introduce post-clearance activities, etc)
0 0 There has been no progress in using risk assessment and post-clearance auditing is not being implemented.
III. Rationalize Incentive Regime Activities III A Simplify and harmonize taxes, fees, and charges
Introduce single window for all border clearance operations
25 25 Refer Action 24.
Eliminate taxes on imports other than ordinary customs duties (i.e., “other duties and charges”)
0 0 Taxes on imports continue to be applied and additional border taxes have been imposed since the last DTIS (Development Tax). Capital goods and agricultural inputs are exempted from customs as well as Development Tax.
Undertake state-level review with the objective of rationalizing sub-national taxes and fees levied on interstate trade, in light of the state and lower level legal framework
25 0 Presidential decrees were issued to harmonize and rationalize taxes and fees levies on interstate trade but still the states constitutions and legal framework open room not consistent with fiscal federalism.
Harmonize taxes on crops and 0 0 This was not implemented the Tax on livestock is intended to
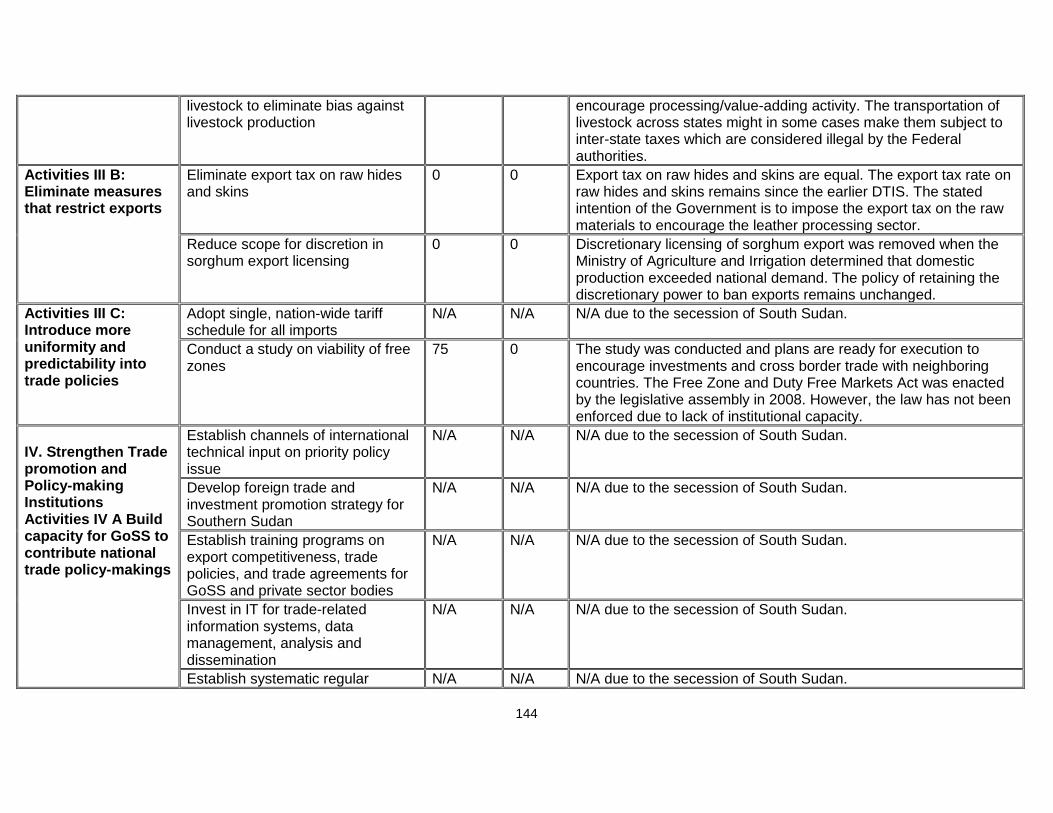
144
livestock to eliminate bias against livestock production
encourage processing/value-adding activity. The transportation of livestock across states might in some cases make them subject to inter-state taxes which are considered illegal by the Federal authorities.
Activities III B: Eliminate measures that restrict exports
Eliminate export tax on raw hides and skins
0 0 Export tax on raw hides and skins are equal. The export tax rate on raw hides and skins remains since the earlier DTIS. The stated intention of the Government is to impose the export tax on the raw materials to encourage the leather processing sector.
Reduce scope for discretion in sorghum export licensing
0 0 Discretionary licensing of sorghum export was removed when the Ministry of Agriculture and Irrigation determined that domestic production exceeded national demand. The policy of retaining the discretionary power to ban exports remains unchanged.
Activities III C: Introduce more uniformity and predictability into trade policies
Adopt single, nation-wide tariff schedule for all imports
N/A N/A N/A due to the secession of South Sudan.
Conduct a study on viability of free zones
75 0 The study was conducted and plans are ready for execution to encourage investments and cross border trade with neighboring countries. The Free Zone and Duty Free Markets Act was enacted by the legislative assembly in 2008. However, the law has not been enforced due to lack of institutional capacity.
IV. Strengthen Trade promotion and Policy-making Institutions Activities IV A Build capacity for GoSS to contribute national trade policy-makings
Establish channels of international technical input on priority policy issue
N/A N/A N/A due to the secession of South Sudan.
Develop foreign trade and investment promotion strategy for Southern Sudan
N/A N/A N/A due to the secession of South Sudan.
Establish training programs on export competitiveness, trade policies, and trade agreements for GoSS and private sector bodies
N/A N/A N/A due to the secession of South Sudan.
Invest in IT for trade-related information systems, data management, analysis and dissemination
N/A N/A N/A due to the secession of South Sudan.
Establish systematic regular N/A N/A N/A due to the secession of South Sudan.

145
cooperation between MoFT and MCI
Build capacity for GoSS to contribute to national trade policy-making
N/A N/A N/A due to the secession of South Sudan.
Activities IVB: Improve trade promotion services
Establish Trade Points in Southern Sudan
N/A N/A N/A due to the secession of South Sudan.
Establish Trade Information Center in Southern Sudan
N/A N/A N/A due to the secession of South Sudan.
Identify technical requirements for access to alternative livestock and meat export markets
25 25 Some work aimed at identifying alternative livestock and meat markets was carried out however there was no follow up.
Identifications of poor’s tradable goods, mainly in the rural areas
75 25 The UNDP in partnership with relevant central and state agencies conducted various pro poor value chin analyses mainly in Darfur states for groundnuts, livestock, hibiscus and honey.
Establishment of share-holding company owned by poor themselves at the local and state level for exports
25 25 Not implemented, but the cooperative training center of the Ministry of trade is planning to encourage clusters of each export commodity to organize themselves in cooperatives. In the website of the Ministry of Social Welfare, there are three social security funds functioning in all states and localities, the most important of which is the Zakat Fund based on Islamic doctrines to support the poor with a very efficient income distribution facility.
Formulation of good governance practices and anti-corruptions laws, act and other legislative requirements to protect the poor’s incomes
50 25 Efforts are underway if measured by formulated constitutions and enacted laws following the Comprehensive Peace Agreement settling the long standing war in southern Sudan and Peace Accords for Darfur and Eastern Sudan, but unfortunately there are still outstanding issues need to be taken towards social inclusion as expressed clearly by the Higher Coordination Council for Decentralized Government
Data dissemination about export market prices
50 50 The Sudan Trade Point and Trade Information Centre have taken the task effectively and they have enlisted 3,3000 clients who receive export market prices on daily basis by email Data delivered includes: exchange rate, international and domestic prices of main export commodities (sesame, gum-Arabic, metals, etc). The
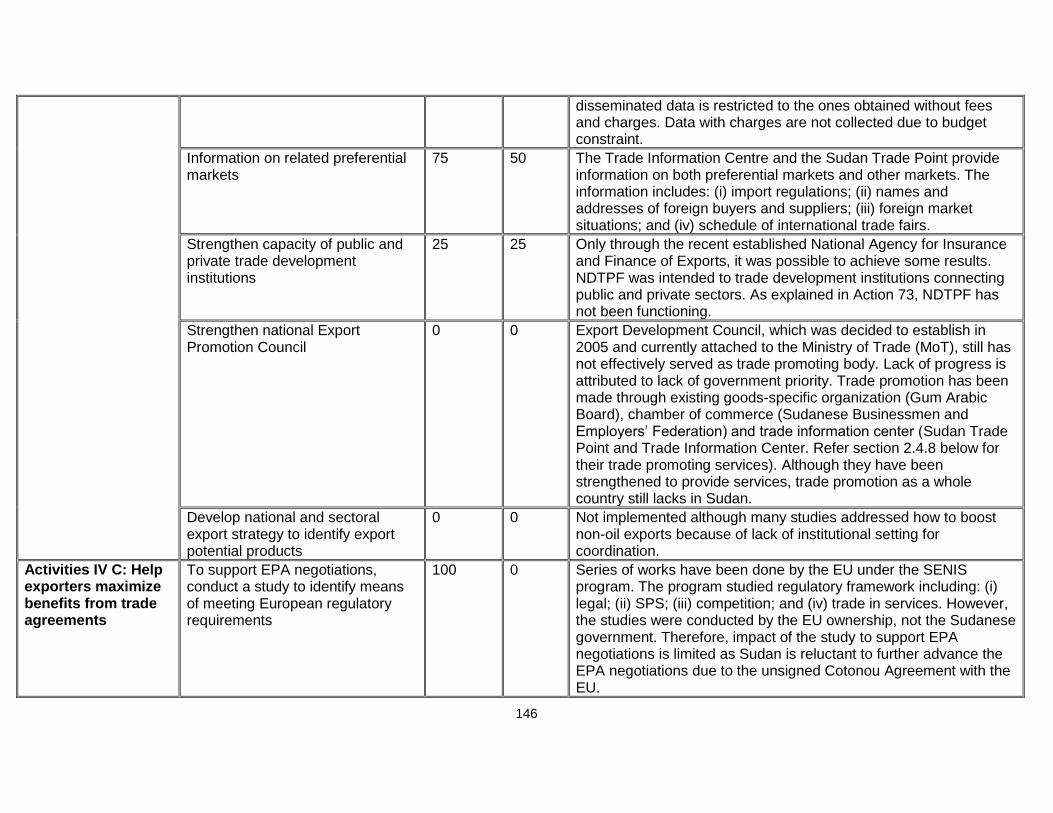
146
disseminated data is restricted to the ones obtained without fees and charges. Data with charges are not collected due to budget constraint.
Information on related preferential markets
75 50 The Trade Information Centre and the Sudan Trade Point provide information on both preferential markets and other markets. The information includes: (i) import regulations; (ii) names and addresses of foreign buyers and suppliers; (iii) foreign market situations; and (iv) schedule of international trade fairs.
Strengthen capacity of public and private trade development institutions
25 25 Only through the recent established National Agency for Insurance and Finance of Exports, it was possible to achieve some results. NDTPF was intended to trade development institutions connecting public and private sectors. As explained in Action 73, NDTPF has not been functioning.
Strengthen national Export Promotion Council
0 0 Export Development Council, which was decided to establish in 2005 and currently attached to the Ministry of Trade (MoT), still has not effectively served as trade promoting body. Lack of progress is attributed to lack of government priority. Trade promotion has been made through existing goods-specific organization (Gum Arabic Board), chamber of commerce (Sudanese Businessmen and Employers’ Federation) and trade information center (Sudan Trade Point and Trade Information Center. Refer section 2.4.8 below for their trade promoting services). Although they have been strengthened to provide services, trade promotion as a whole country still lacks in Sudan.
Develop national and sectoral export strategy to identify export potential products
0 0 Not implemented although many studies addressed how to boost non-oil exports because of lack of institutional setting for coordination.
Activities IV C: Help exporters maximize benefits from trade agreements
To support EPA negotiations, conduct a study to identify means of meeting European regulatory requirements
100 0 Series of works have been done by the EU under the SENIS program. The program studied regulatory framework including: (i) legal; (ii) SPS; (iii) competition; and (iv) trade in services. However, the studies were conducted by the EU ownership, not the Sudanese government. Therefore, impact of the study to support EPA negotiations is limited as Sudan is reluctant to further advance the EPA negotiations due to the unsigned Cotonou Agreement with the EU.

147
Creating awareness about challenges benefits of membership in the WTO and the process of accession
0 0 First of all, the government needs to understand the implications of accession to WTO accession, i.e., benefits, costs and risks. It is only after the government recognizes these implications when it starts to establish effective communication and coordination within the government and with private sector in order to raise their awareness. This action should remain valid for 2014 DTIS update.
Establish program to train private sector organizations in meeting COMESA rules of origin requirements
0 0 Training activity has not been established well as pointed out in 2008 DTIS for two reasons: (i) firms aggressively export to COMESA markets have already implemented voluntarily to meeting the COMESA and other preferential agreements' rule of origin requirements; and (ii) both government and other traders are reluctant for competition and have no interest in exporting as they lack external competitiveness.
Establish a PPP on MTS (Multilateral trading system)
0 0 Due to inactivation of NDTPF (refer Action 73), Public-Private-Partnership (PPP) has not established. It is attributed to lack of interest in both public and private sectors.
Commission marketing studies identifying export opportunities in preferential markets
50 25 Various Government entities noted that marketing studies were undertaken with external funds through COMESA as part of the preparation for moving towards a customs union.
Strengthen the export strategy capacity in Sudan.
25 0 There has been little increase in capacity to promote exports.
Elaborate an in-depth national export strategy
25 0 Implemented by the three-year Emergency Economic Programme (2012-2014) after the secession of South Sudan. It identified four export crops: livestock, oilseeds, Gum Arabic and cotton. However, it just identified items but lacked clear strategy to increase exports of these items because of lack of government interest and capacity.
Identify products and services with high potential, contributing to diversification of exports
75 25 This activity has been considered as a top priority to guide the strategic planning of the various government entities and the private sector as reported by the Ministry of Trade. Identified products and services are: horticulture, medicinal and aromatic plants and spices and a wide selection of value added agro-industrial products.
Undertake sector export strategies 25 0 Still pending issue awaiting strengthening of the institutional capacity (with additional staff)

148
Activities IV D: Increase coordination in trade and policy making
Formulate trade policy for Sudan and strengthen trade policy in overall policy setting
50 50 The Ministry began the process but has not produced a draft trade policy for discussion.
Institutionalize coordination between trade policy making and other relevant bodies through “Consultative Trade Policy Council”
Study to clarify responsibilities in trade policy making between relevant bodies
0 0 The trend of Government restructuring just started in Mid 2011 after the secession of Southern Sudan and more concrete steps are yet to be taken after a careful study
Strengthen and institutionalize public private cooperation
0 0 Refer Action 62.
Strengthen Export Credit and Guarantees Agency through capital and awareness raising
75 50 The National Agency for Insurance and Finance of Exports (NAIFE) was established in 2005 and started its operation in January 2006. The main objective is to promote Sudanese exports (excluding oil and gold) through insurance and re-insurance of Sudanese exports and lending to export-oriented firms. NAIFE also provides promotional activities to enhance competitiveness of Sudanese exporters. Volume of export credit and guarantees has been increasing since its establishment from US$79 million in 2010 to US$188 million in 2013. NAIFE provides short- and medium-term finance and guarantees to pre- and post-shipping finance for exporting goods and services. Beyond export credit and guarantees, NAIFE also provide short- and medium-term lending to export-oriented firms to help expand their capacity.
Activities IV E: Improve awareness on trade policy issues
Broaden mandate of NDTPF on public awareness and coordination to all trade negotiations
0 0 Very little that has done to improve awareness on trade policy issues because of limited budget and lack of external support NDTPF has not been functioning. Since its establishment in 2004, NDTPF suffered from (i) lack of budget, (ii) continuous change in members representing stakeholders, (iii) lack of interest and weak participation of members, and (iv) lack of training. Therefore, primary action should be to reactivate NDTPF with sufficient budget and giving incentives for stakeholders.
Activities IV F: Training staff 0 0

149
Strengthen National Export Promotion Council
Refer Action 57.
Link to best practice institutions 0 0 Same as above.
Link to private sector 0 0 Same as above.
Activities IV G: Strengthen trade policy making capacity
Modernize units for multilateral, regional (WTO, GAFTA, COMESA, GSP, GSTP) and bilateral negotiations
50 50 Such units which are the affiliates of the Ministry of Trade with representative in the bilateral negotiations are performing with sub-optimal staffing and facilities because of limited budget and lack of external support
Training of staff (English, Computer, Trade economic and Trade law)
25 25 Only partially (not regularly) implemented by Training division at Ministry of Trade because of low government prioritization and limited budgets.
Establish Monitoring and Evaluation capacity
0 0 Not implemented because of low government prioritization and lack of institutional capacity.
Strengthen trade missions in key embassies
0 0 Not implemented.
Strengthen trade policy department to implement and monitor new laws, include anti-dumping, competition and trade regulation laws
0 0 Those laws enacted by the legislative assembly in 2009 have not been enforced due to lack of institutional capacity. Therefore, relevant trade policy department has not been strengthened to effectively implement and monitor those laws.
Strengthen and modernize MoFT state offices
25 0 Little was accomplished outside the domain of the trade sub- points and with expanding the mandate of the Ministry to cover internal trade and look after the cooperative movement, trade offices will be strengthened
Activities IVE: Strengthen Information, Research and training in trade
Awareness raising and training in trade issues (Foreign Trade Institute to be created)
50 25 Although no new foreign trade institute has been created, Sudan Trade Point (STP), has been expanding its capacity to raise awareness and provide training at State level through its nation-wide network. The objectives of STP include: (i) development of foreign trade systems, and compilation, documentation and dissemination of trade information; (ii) facilitation of business process and raising awareness of small and medium-sized enterprises and assist them in reaching to international markets; (iii) promotion of exports and investments; (iv) strengthening of links
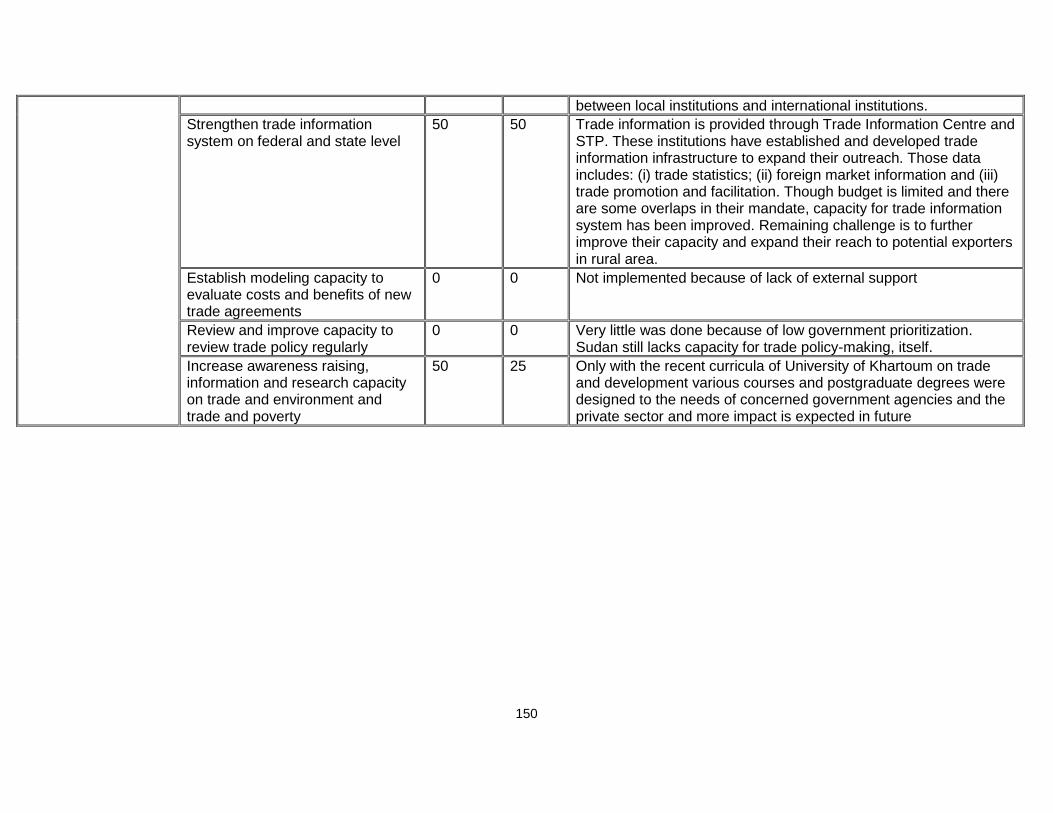
150
between local institutions and international institutions.
Strengthen trade information system on federal and state level
50 50 Trade information is provided through Trade Information Centre and STP. These institutions have established and developed trade information infrastructure to expand their outreach. Those data includes: (i) trade statistics; (ii) foreign market information and (iii) trade promotion and facilitation. Though budget is limited and there are some overlaps in their mandate, capacity for trade information system has been improved. Remaining challenge is to further improve their capacity and expand their reach to potential exporters in rural area.
Establish modeling capacity to evaluate costs and benefits of new trade agreements
0 0 Not implemented because of lack of external support
Review and improve capacity to review trade policy regularly
0 0 Very little was done because of low government prioritization. Sudan still lacks capacity for trade policy-making, itself.
Increase awareness raising, information and research capacity on trade and environment and trade and poverty
50 25 Only with the recent curricula of University of Khartoum on trade and development various courses and postgraduate degrees were designed to the needs of concerned government agencies and the private sector and more impact is expected in future

151
Appendix 2: Firm Level Exporter Dynamics – Product Details Precious Metals88 Precious metals are Sudan’s leading non-oil export. The number of precious metal exporters nearly doubled from 47 in 2008 to 87 in 2009 but subsequently declined to 20 in 2012. However, this was not matched by a decline in the value of total exports, on the contrary, that value increased by eight from 2008 to 2012. Sudan benefited from increasing international gold prices that nearly doubled during the 2008-2012 period. However, the spectacular growth of precious metal exports is due not only to high prices but also to a substantial increase in quantities exported, particularly between 2008 and 2009 when quantities increased more than four-fold. Although the value of precious metal exports has been increasing since 2008, its share in Sudan’s total non-oil exports declined from 2010 to 2012. There is a significant concentration of precious metal exports: precious metal exporters represent 3 percent to 10 percent of the number of exporters in Sudan but account for over 60 percent of the value of total non-oil exports. In 2012 the precious metal sector represented less than 1 percent of the number of entrant exporters and 5 percent of the ‘exiter’ exporters from Sudan.
Since the value of exports increased and the number of exporters declined between 2008 and 2012 in the precious metals sector, the average size of precious metal exporters naturally increased. The size of the average precious metal exporter was 5.5 million in 2008 and 100 million in 2012. The size of the median precious metal exporter is upward trending until 2011 but then drops dramatically. In terms of the average size of precious metal exporters, the growth is driven by growth of incumbent exporters. The average size of entrants is much smaller than that of incumbents and that gap widens with time. Suprisingly, the median incumbent in precious metals is smaller than the median entrant in the sector The median size of both incumbents and entrants falls from 2009 to 2012.
In terms of the exporter size distribution, the Herfindahl Index indicates a high concentration of precious metal exporters’ shares in Sudan, and exports only get more concentrated over time. Exports of precious metals are driven almost entirely by a few very large exportes. In 2012 nearly 100 percent of exports were concentrated in the largest 10 percent of firms selling more than 5 million USD dollars annually. This stands in contrast to 2008 when firms with more than 5 million annual exports accounted for 21 percent of the total number of exporters and 77 percent of total precious metal exports. The data indicate that small exporters thrived in 2012: 65 percent of Sudan’s precious metal exporters exported less than 100 thousand USD in that year. In 2012 there were only 6 destinations recorded for Sudan’s precious metals exports: United Arab Emirates, Sudan, Canada, Swaziland, European Union, and Aruba. The United Arab Emirates was the only destination with multiple Sudanes firms exporting whereas there is only one firm that serves in each of the other destinations. Seventeen Sudanese precious metal exporters sold to the United Arab Emirates in 2012, of which only one was an entrant. The entry rates of precious metal exporters into the United Arab Emirates droppped dramatically between 2009 and 2012 while the exit rates doubled during the same period. Exporter entry and exit
88 Although HS code 71 covers products other than gold, 99.5% of the value of Sudan’s exports in HS
code 71 originates in the 4-digit HS code 7108 which is gold.
152
rates cannot be calculated for the other destinations because only one incumbent exporter serviced those destinations.
Oil Seeds89
Oil seeds are the second largest non-oil export sector in Sudan. The main product exported is sesame seeds which account for about 50 percent of the sector’s total exports in any given year. A surge in the number of oil seed exporters in 2009 is followed by a decline in 2010 and then remains constant until 2012. The value of oil seeds exports declined slightly from 2008 to 2010 but recovered by growing more than 50 percent from 2010 to 2012. This important growth was driven by growth in export volumes as quantities of oil seed exports doubled between 2008 and 2012.The oil seeds sector faced unfavorable unit value (price) movements over the period. Although the value of oil seed exports increased between 2008 and 2012, its share in Sudan’s total non-oil exports declined dramatically from 30 percent in 2008 to 10 percent in 2009 and thereafter. The oil seeds sector accounts for an important share of the number of Sudanese exporters, about 25 percent each year. The oil seed sector’s shares of exiters are close to its share of exporters; however, its share of entrants is higher (close to 30 percent). The higher entry rate relative to the exit rate suggests that the oil seeds sector is a growing export sector for Sudan. The average size of oil seed exporters declined from 1.2 million USD in 2008 to 800 thousand USD in 2009 but then almost doubled until 2012, reaching 1.5 million USD in 2012. This increase in the average size of exporters was driven by the increase in the average size of incumbents, as the average size of entrants actually declined over the period. The median oil seed exporter is much smaller than the average exporter and actually declined from 220 thousand USD in 2008 to 150 thousand USD in 2012, after increasing in between those years. The median size of incumbents increased whereas the median size of entrants declined from 2009 to 2012.
The Herfindahl Index of Sudanese oil seed exporters’ market shares suggests low levels of concentration taking on a value of 0.04 in 2008 and 0.03 in 2012. The size distribution of oil seeds exporters is mostly characterized by small exporters, nearly 70 percent of which sell less than 500 thousand USD. In contrast, the largest exporters selling more than 5 million USD represent 10 percent of exporters in 2012 – which is actually a relatively high share for this size group compared to what is seen in other sectors - and account for nearly 70 percent of oil seed exports. In 2009 entrants into oil seeds exports represent almost three-quarters of the total number of Sudanese oil seeds exporters with the other 26 percent being incumbent firms, as shown in Panel A of Figure 25. But in 2012, only 59 percent of oil seeds exporters were entrants. Panel B shows that not only the number of entrants declined between 2009 and 2012 but the entrants’ share in total oil seeds exports also fell dramatically from from 78 percent to 28 percent. This implies that entrants in 2012 were fewer and substantially smaller than in 2009. Panel C shows
89 The oil seeds export sector is defined by all export products within 2-digit code HS 12. The label for HS 12 is “Oil seeds and
oleaginous fruits; miscellaneous grains, seeds and fruits; industrial or medicinal plants; straw and fodder” that for short we refer to as “oil seeds”.
153
that exit rates have also declined but not nearly as fast as entry rates. About 62 percent of oil seeds exporters that exported in 2008 did not export in the following year and that rate decreased to 59 percent in 2012.
The average number of destinations per Sudanese oil seeds exporter increased from 2 in 2009 to 2.3 in 2012. The main destinations for Sudanese oil seed exports in 2012 are the destination registered as Sudan itself (27 percent), China (19 percent), Egypt (18 percent), Saudi Arabia (5 percent), and the European Union (5 percent), as seen in Figure 26. China has rapidly become a crucial market for Sudanese oil seeds exports accounting for only 2 percent of those exports in 2008 but for 29 percent in 2010 and declining to 19 percent in 2012. China also increased its relevance in terms of the share of Sudanese oil seeds exporters it attracts which increased from 5 percent in 2008 to 13 percent in 2012. Egypt and Saudi Arabia are historically important markets for Sudanese oil seed exports but their importance has been declining. The share of oil seed exporters selling to Egypt declined from 37 percent in 2008 to 19 percent in 2012 while that selling to Saudi Arabia declined from 20 percent in 2008 to 16 percent in 2012. The European Union has accounted for relatively constant shares of Sudan’s oil seed exports (5 percent) and oil seed exporters (13 percent). Entry and exit rates for Sudanese oil seeds exporters’ dynamics are high in the four main markets although they declined in 2012, particularly in China. In 2009 entry rates were higher than exit rates in all four destinations whereas in 2012 exit rates were higher than entry rates in all four destinations.
Live Animals90
Live animals are the third largest non-oil export sector in Sudan. Between 2008 and 2012 live animal exports increased five-fold. This surge is due to a combination of favorable unit value (price) movements as well as a substantial increase in quantities exported. The number of live animal exporters increased from 139 in 2008 to 165 in 2011 but dropped to 129 in 2012. The impressive growth in the sector however only helped it keep up with other growing export sectors in Sudan, as its share in the value of total non-oil exports remained constant at around 9 percent. The importance of live animals in the total number of exporters has declined slightly from 21 percent in 2008 to 17 percent in 2012. Entrants into live animals exports account for a larger share of total entrants than exporters of live animals account for in total exporters. Also exiters in the live animals sector represented a particularly high share - 28 percent - of total exiters in 2012. The average size of live animal exporters grew from 500 thousand USD in 2008 to 2.6 million USD in 2012, almost doubling between 2011 and 2012. Most of the growth in exporter size was due to the size of incumbents although the size of entrants also increased between 2009 and 2012. The median size of live animals exporters also increased from 2008 until 2012, primarily due to the growth of the median incumbent rather than growth of the median entrant. The majority of live animal exports are accounted for by the largest exporters selling over 5 million USD annually in every year. The Herfindahl index of live animals exporter market shares
90 The Live Animals export sector is defined by all export products within 2-digit HS code 01.

154
in Sudan fell from 0.13 in 2008 to 0.03 in 2012 and generally suggests a low degree of concentration. In 2008 92 percent of exporters had annual exports of live animals of less than 500 thousand USD (with 55 percent being small exporters with annual exports below 100 thousand USD) but that share of small exporters declined to 15 percent in 2012 while the share of medium-sized and large exporters grew. Sudan’s live animal exports become increasingly more concentrated in the largest exporters from 2008 to 2012 while the share of exports accounted for by small and medium-sized exporters decreased. Sudan’s live animal exporters are not very diversified by destination, selling on average to 1.27 destinations in 2008 but that number improved over the 2008-2012 period to 1.74. The main destination for live animal exports in 2012 is Saudi Arabia (66 percent). In 2008 that percentage was a mere 8 percent. In contrast, Egypt, which was the main market for live animal exporters in 208 with 78 percent market share declined by 2012 to only 8 percent of exporters. Entrants into Sudan’s main destination markets for live animals, Saudi Arabia and Sudan, exhibit declining entry rates between 2008 and 2012 whereas the entry rates into Egypt and the United Arab Emirates increase between 2008 and 2012, as seen in Figure 33. Another important pattern to highlight is that exit rates in all four main destinations in 2012 were higher than in 2008 and higher or equal to the corresponding entry rates.

155
Appendix 3: Trade Gateway Performance: Port Sudan Port Sudan is the main gateway for imports to Sudan. Exports, especially livestock, agricultural goods and oil (crude and derivatives) are being handled at specialized facilities mainly in Swakin. It is largely a feeder port, with goods trans-shipped through ports in the Middle East. Port Sudan has been operated by the Sea Ports Corporation (SPC), a state owned company, since 1974. It comprises terminals and facilities for general cargo, including bulk, containers, and petroleum products. General cargo is handled in the North Port which has facilities also for bulk shipments, roll-on roll off, and vehicle carriers. It can also handle a limited number of containers. There are warehouses adjacent to the berths as well as grain silos. There is also the Green port which is used for general cargo and bulk. It has equipment to discharge grain directly into trucks. The South Port is the main container terminal in Sudan. SPC also operates a yard for empty containers located some 2 km from the main container terminal. An oil terminal was opened in 2004 and is used for exports of petroleum products.
Port Sudan has almost halved the dwell time to 15 days since the last DTIS. Port Sudan has significantly reduced the dwell time from 28 days recorded in the AICD which was based on a survey in May 2007 to 15 days in March 2014 (based on interviews with users), exceeded only by Douala in Cameroon. The ports of East Africa, Mombasa and Dar es Salaam have managed to reduce their cargo dwell time by taking various measures including increasing storage charges, using off-dock container yards and adopting several measures to expedite clearance of cargo. The high dwell time in Port Sudan reported by the earlier DTIS was explained in part by port operational procedures and container management. Although there have been significant reductions in dwell time 15 days remains high and results from: firstly, under the port operational procedure delivery orders are only released after the outturn for a vessel is provided. When the discharge process takes several days, this can lead to delays to the beginning of the customs and other government agency clearance process of the cargo as the delivery order is one of the documents that are required. Secondly, container management in the yard is not well organized which leads to difficulties in locating containers for physical examination or removal from the port. Some logistics services providers have ended up engaging runners to locate containers for these purposes.
The SPC is committed to both expanding capacity and improving operational efficiency and have recently brought in a private company to manage Port Sudan. They plan to increase the use of information technology systems through either a port community system or single window system so that the various service providers can share documents electronically and as efficiently as possible. It is also critical to improve overall terminal management practices. A significant development related to this was the signing in late 2013 of an agreement between SPC and ICTSI of the Philippines for the latter to manage the port and improve its operational efficiency. It is still too soon to assess the impact of this initiative.

156
Figure 44: Cargo Dwell Time in Port Sudan Compared to other Ports, 2014
The DTIS Update focuses on the Port Sector management and operations with emphasis on Port Sudan as main gateway for Sudanese foreign trade (mainly imports) and on Swakin in respect of livestock export trade. Further, the DTIS Report 2008 [matrix of actions] was compared with the current situation in order to update the recommendations. The Ministry of Transport, Roads and Bridges is the line ministry in charge of the port sector which is being managed and administrated by the Sea Port Corporation [SPC] provided with a large degree of autonomy including financial management. Commercial operations are provided by both private operators and the SPC. All marine operations (services related to ships’ approach and berthing operations) are provided by SPC without any private sector participation. Cargo handling operations are being provided as follows: General Cargo: On board stevedoring performed by private companies and shore handling covered by SPC; Dry Bulk Cargo: Active operation 100 percent performed by private companies who own also the main equipment (cantilevers, un-loaders, etc.); Liquid Bulk Cargo: the terminals are under supervision of SPC whereby the manifold operations are being assured by cargo owners. Livestock operations (in Swakin) are performed by private operators under supervision of SPC. Containerized Cargo: In October 2013 SPC signed a management contract with Manila (Philippines) based container terminal operator ICTSI The agreement includes both container terminals in Port Sudan (old and new one). Services are being provided in the name and for account of SPC who is in charge of billing and financial management. The DTIS 2008 recommendations targeted reducing the bottlenecks at Port Sudan. Following the inauguration of the new container terminal in 2012, waiting times have been almost eliminated. In 2013 SPC signed a three year management contract with ICTSI for the handling of containerized cargo at both terminals. The proposed concession of port management has not taken place. However, in respect of the containerized cargo handling the present management contract may be extended or replaced by a concession through a competitive bidding process –this will be decided toward the expiration of the present management contract.
0 5 10 15 20
Tanjung Priok
Thailand
Port Klang
Hong Kong
Singapore
Durban
Mombasa
Douala
Port Sudan
Cargo Dwell Time (days)

157
The availability of storage space largely obviates the need to increase storage fees as an incentive to reduce dwell time. Contrary to the recommendation expressed in 2008, the effect of such increase should be reviewed prior to proceeding. Increasing storage fees as an incentive to reduce storage periods is frequently proposed option to accelerate the cargo clearance and evacuation process in order to free storage capacity. Generally this is a sound approach, however, in the case of Port Sudan ample storage space is available and there is currently no need to increase the costs for merchants with the often observed risk of abandon of cargo because of high additional costs. Overall, the team learnt that tariffs and storage fees have not been increased since four years. Improving efficiency at Port Sudan should be the preferred strategy. The earlier DTIS recommended facilitating the establishment of ICDs to simplify and accelerate the cargo clearance and evacuation processes. This has already taken place and remains an option for assisting in improving internal distribution networks, however, it should be considered complementary (and not as a substitute) to the necessity of improving efficiency at Port Sudan. Improving efficiency at the Port is a first best option as this minimizes cargo handling. It is important to recognize that establishing additional ICDs will incur further costs and liabilities when cargo is moved by third parties away from the entry point (Port Sudan). Virtually all cargo operations are handled by private operators appointed in most cases by the merchants, and the major service provider for third parties is the containerized cargo operator. Since the inauguration of the south terminal, earlier sporadic congestion has been overcome. Landing process time is small relative to time since departure from cargo origin. The duration of availability of consignments while cargo still on board should not be considered as critical as the landing process duration is very small relative to the period of time since departure from cargo origin. Most of the cargo originates in Far East and is trans-shipped at either the Port of Salalah (Oman) or Jeddah (Saudi Arabia). Port Sudan has significantly improved crane and discharge productivity. The discharging/loading process performance is shown below Table 30. There has been a significant improvement in productivity since the AICD. Indeed crane productivity at Port Sudan compares well the values are in the range of modern container terminals with similar aged infrastructure. Table 30: Container operations key indicators
Crane productivity [ship to shore] 22 moves per crane hour
Average Container moves per call 650 containers load + discharge
Berth Occupancy [in %] < 50%
Source: Author’s own compilation, based on data obtained in February 2014.
As a consequence of the irregular timing of arriving vessels, the facilities experience periods of time without activities while at other times, the terminals reach almost full capacity. Since inauguration of the new container terminal (south), waiting times of ships due to berth occupancy does not occur. However, the high rate of equipment failures (availability of around 70 percent only) reduces operational efficiency. The horizontal movement of containers from alongside ship to the first import or discharging stacking area follows the discharging cycle of the ship to shore gantry cranes. Once containers have been stored into the stacking yard and

158
vessels’ discharging operations have been completed (closure), the storage time commences, as well as the potential container demurrage time. The standard free storage time amounts to 14 days, thereafter 7 Euros/TEU/day apply. Shipping lines concede different periods of free demurrage/detention time. Approximately 50 percent of landed containers are released within the free period of storage, 25 percent are being released about 1 month after landing and 25 percent are being released within 1 and 2 months after landing. The periods of storage prior clearing goods lead to an average dwell time of a container of 25 days within the port premises (under custody of SPC). This is a relatively high number but as a simple it average it needs to interpreted cautiously as presently there are more than 1,000 TEU in an so called abandoned status (under customs custody and ready for auction as the maximum storage time is 60 days, thereafter goods are being transferred to an outside depot for auction). The Costs of Port passage of a container through all the operational cycles of the port facilities is not high when compared to other ports in Africa. The total cost consists of: Handling charges [invoiced by SPC] and Handling fees [charged by shipping agencies]. To these basic costs, merchants incur additional charges which according to the counterpart the team spoke to, were not always considered to be justified. Some of the additional costs could be avoided by not incurring in demurrage/detention and additional storage time. Procedural obstacles attributed to the banking sector were mentioned as an important factor. It appears that half of all cargo is cleared and released during the free times while the other half incurs additional storage and demurrage/detention charges. More information is required on the 50 percent that incurs demurrage/detention charges. An objective assessment of SPCs operations and port management would assist in providing a benchmark assessment for a discussion on future role and strategic targets. Recent increases of stevedores’ remuneration (by 70 percent) will in the absence of corresponding productivity increases contribute towards augmenting cargo handling costs. Further reviewing the rules and regulations against international best practice and strengthening professional capacity are important.
159
List of References Behnke Roy (2012),The Economics of Pastoral Livestock Production and its Contribution to the Wider
Economy of Sudan, Working Paper, Feinstein International Center, Tufts University. Blind, K., & Mangelsdorf, A. (2012), The Trade Impact of ISO 9000 Certifications and International in
Accreditation, Paper presented at the EURAS Proceedings 2012, 17th EURAS Cooperation Annual Standardization Conference.
Dirani OH, Jabbar MA, Babiker IB (2009), Constraints in the market chains for export of Sudanese sheep
and sheep meat to the Middle East, Research Report 16, Department of Agricultural Economics, University of Khartoum and the International Livestock Research Institute, Nairobi.
FAO (2006), Fertilizer Use by Crop in the Sudan, Rome. IFAD (2010), Seed Development Project: Project Final Design Report: Main Report and Annexes, Rome. Keyser John C. (2013), Opening up the Markets for Seed Trade in Africa, Africa Trade Practice Working
Paper Series, Number 2, World Bank, D.C. Nathan Associates (2007), Calculating Tariff Equivalents for Time in Trade, USAID. Nour, Samia Satti Osman Mohammed (2011), ‘Assessment of Industrial Performance and the
Relationship between Skill, Technology and Input-Output Indicators in Sudan,’ United Nations University, MERIT, Working Paper 2011-030.
Government of Sudan (2012), Sudan’s Memorandum on Foreign Trade Regime (MFTR), labeled Draft
Addendum. IMF (2013), Sudan: Tax Reform Strategy for Revenue Mobilization, Washington, D.C. IMF (2014), Sudan: Staff Report for the 2013 Article IV Consultation, SM/13/255, Washington, D.C. SENIS Project (2009), Assessing Sudan’s Export Diversification Potential in Agricultural Products, Dr. Ali
Abdel Aziz Salih, Khartoum. SENIS Project (2010), Review of Export Import Environment: Capacity in TBT and SPS, Maxwell Stamp,
London. UNIDO (2013), Industrial Modernization Programme of the Republic of Sudan, UNIDO, Vienna, Austria. Waithaka Michael et al (2011), Impacts of an improved seed policy environment in Eastern and Central
Africa, ASARECA. World Bank (2008), Revitalizing Sudan’s Non-Oil Exports: A Diagnostic Trade Integration Study prepared
for the Integrated Framework Program, World Bank, Washington, D.C. World Bank (2009), Sudan: Toward Sustainable and Broad-Based Growth, Report No. 52514-SD, World
Bank: Washington, D.C. World Bank (2013a) Tourism in Africa: Harnessing Tourism for Growth and Improved Livelihoods, World
Bank: Washington, D.C. World Bank (2013b) Transforming Tourism Opportunities in Uzbekistan: A Rapid Assessment, World
Bank: Washington, D.C.

160
Internet Web Sites with hyperlinks ASTM - ASTM International, formerly known as the American Society for Testing and Materials (ASTM) –
www.stm.org BSi – British Standards Institute – www.bsigroup.com CEN / CENELEC – European Committee for Standardization (CEN), the European Committee for
Electrotechnical Standardization (CENELEC) – www.cencenelc.eu http://www.codexalimentarius.net/fileadmin/user_upload/codexalimentarius/CODEX50/Food_Safety_Sud
an.pdf DIN – German Standards Body – Deutsches Institut fur Normung – www.din.de Doing Business http://www.doingbusiness.org/reports/global-reports/doing-business-2014 http://www.iaf.nu//articles/IAF_MLA/14 IEC – International Electro technical Commission – www.IEC.ch https://www.ilac.org/documents/Bro_english/ILAC_MRA_English.pdf ISO – International Organization for Standardization – www.iso.org ISO/IEC (2004) Guide 2Standardization and related activities -- General vocabulary ISO/IEC 17000:2004Conformity assessment -- Vocabulary and general principles ISO/IEC 17025:2005 General requirements for the competence of testing and calibration laboratories. http://www.transparency.org/cpi2013/results http://www.wto.org/english/docs_e/legal_e/17-tbt_e.htm WTO TBT agreement: http://www.wto.org/english/docs_e/legal_e/17-tbt.pdf http://www.iso.org/iso/standards_development/processes_and_procedures/iso_iec_directives_and_iso_s
upplement.htm ISO.org (2010) Financing NSBs – ISBN 978-92-67-10534-5 www.Sudan safri.net accessed 26 January
2014