sudan: inward and outward fdi - dhaman.netdhaman.net/wp-content/uploads/2016/02/sudan.pdf · sudan:...
TRANSCRIPT
Sudan: Inward and Outward FDI
38.4 Population (million)
1,861,484 Area (Km2)
853 Coastline (Km)
Oil and small reserves of
iron ore, chrome ore,
copper, zinc, Natural resources
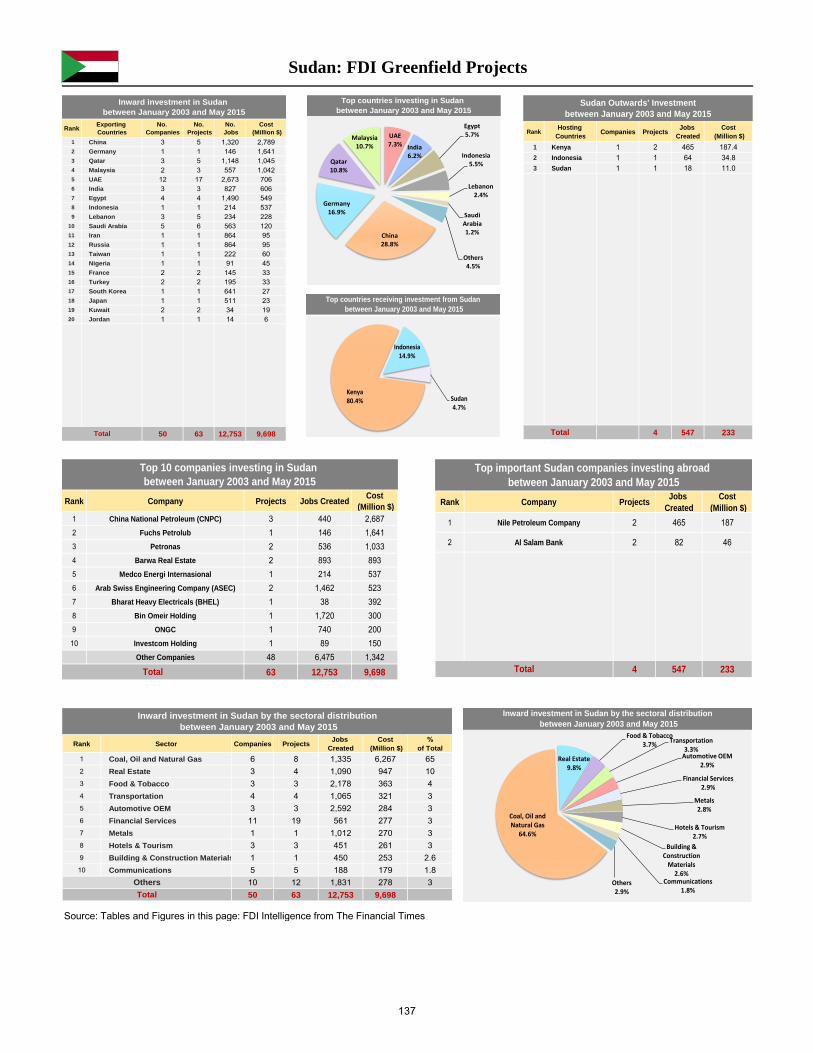
I – Inward Investments In 2014, Sudan succeeded in attracting FDIs worth 1277 million dollars according to UNCTAD estimations, which represent 2.9% of the Arab total for the same year. FDI balances incoming to Sudan amounted to some 22.7 billion dollars by the end of 2014, which represent 2.9% of the Arab total for the same period. As for Sudan's activity in terms of new FDIs (greenfield), the FDI Markets database published by the Financial Times for the period from January 2003 to May 2015 shows the following: • 63 FDI projects are being implemented in Sudan by 50 Arab and foreign companies. It is estimated that the total investment cost of these projects, which employ roughly 12.8 thousand workers is about $ 9.7 billion. • China, Germany, Qatar, Malaysia, India, Egypt, Indonesia, Lebanon and KSA respectively were on the list of the most important countries investing in Sudan, in terms of investment cost of the projects. The share of China, Germany and Qatar accounted for around 57% of the total. • Arab and foreign investments incoming to Sudan are concentrated in the oil and gas sector with a percentage of 64.5%, while 9.8% are in the real estate sector and 3.7% in the food and tobacco sector. • The Chinese National Petroleum Company (CNPC) came on top of the list of the 10 most important companies investing in Sudan where it implements 3 projects with an investment cost estimated at 2.7 billion dollars. II – Outward Investments UNCTAD did not detect any outward investment flows from Sudan in 2014. UNCTAD did not detect any outward investment balances from Sudan in 2014 either. As for Sudan's investment activity abroad according to the FDI Markets database for the period from January 2003 to May 2015, it was as follows: • The number of Sudanese FDI projects abroad amounted to 4 projects that are being implemented by two Sudanese companies. Estimations reveal that the overall investment cost of those projects, which employ some 547 workers, is close to 233 million dollars. • Sudanese direct investments abroad were restricted to three countries: Kenya, with a percentage exceeding 80% of the total investment cost of the projects, followed by Indonesia and Algeria. • Nile Petroleum Company came on top of list of the most important Sudanese companies investing abroad, as it is implementing two projects with an investment cost estimated at 187 million dollars approximately.
136
Sudan: FDI Greenfield Projects
Source: Tables and Figures in this page: FDI Intelligence from The Financial Times
RankExporting Countries
No. Companies
No. Projects
No. Jobs
Cost (Million $)
1 China 3 5 1,320 2,7892 Germany 1 1 146 1,6413 Qatar 3 5 1,148 1,0454 Malaysia 2 3 557 1,0425 UAE 12 17 2,673 7066 India 3 3 827 6067 Egypt 4 4 1,490 5498 Indonesia 1 1 214 5379 Lebanon 3 5 234 228
10 Saudi Arabia 5 6 563 12011 Iran 1 1 864 9512 Russia 1 1 864 9513 Taiwan 1 1 222 6014 Nigeria 1 1 91 4515 France 2 2 145 3316 Turkey 2 2 195 3317 South Korea 1 1 641 2718 Japan 1 1 511 2319 Kuwait 2 2 34 1920 Jordan 1 1 14 6
50 63 12,753 9,698
Inward investment in Sudan between January 2003 and May 2015
Total
RankHosting
CountriesCompanies Projects
Jobs Created
Cost (Million $)
1 Kenya 1 2 465 187.42 Indonesia 1 1 64 34.83 Sudan 1 1 18 11.0
4 547 233
Sudan Outwards' Investmentbetween January 2003 and May 2015
Total
Rank Company Projects Jobs CreatedCost
(Million $)1 China National Petroleum (CNPC) 3 440 2,6872 Fuchs Petrolub 1 146 1,6413 Petronas 2 536 1,0334 Barwa Real Estate 2 893 8935 Medco Energi Internasional 1 214 5376 Arab Swiss Engineering Company (ASEC) 2 1,462 5237 Bharat Heavy Electricals (BHEL) 1 38 3928 Bin Omeir Holding 1 1,720 3009 ONGC 1 740 20010 Investcom Holding 1 89 150
Other Companies 48 6,475 1,342
63 12,753 9,698Total
Top 10 companies investing in Sudan between January 2003 and May 2015
Rank Company ProjectsJobs
CreatedCost
(Million $)
1 Nile Petroleum Company 2 465 187
2 Al Salam Bank 2 82 46
4 547 233
Top important Sudan companies investing abroad between January 2003 and May 2015
Total
Rank Sector Companies ProjectsJobs
CreatedCost
(Million $)%
of Total
1 Coal, Oil and Natural Gas 6 8 1,335 6,267 652 Real Estate 3 4 1,090 947 103 Food & Tobacco 3 3 2,178 363 44 Transportation 4 4 1,065 321 35 Automotive OEM 3 3 2,592 284 36 Financial Services 11 19 561 277 37 Metals 1 1 1,012 270 38 Hotels & Tourism 3 3 451 261 39 Building & Construction Materials 1 1 450 253 2.610 Communications 5 5 188 179 1.8
10 12 1,831 278 350 63 12,753 9,698 Total
Inward investment in Sudan by the sectoral distribution between January 2003 and May 2015
Others
Inward investment in Sudan by the sectoral distribution between January 2003 and May 2015
Coal, Oil and Natural Gas
64.6%
Real Estate9.8%
Food & Tobacco3.7%
Transportation3.3%
Automotive OEM2.9%
Financial Services2.9%
Metals2.8%
Hotels & Tourism2.7%
Building & Construction
Materials2.6%
Communications1.8%
Others2.9%
Top countries investing in Sudan between January 2003 and May 2015
China28.8%
Germany16.9%
Qatar10.8%
Malaysia10.7%
UAE7.3% India
6.2%
Egypt5.7%
Indonesia5.5%
Lebanon2.4%
Saudi Arabia1.2%
Others4.5%
Top countries receiving investment from Sudan between January 2003 and May 2015
Kenya80.4%
Indonesia14.9%
Sudan4.7%
137
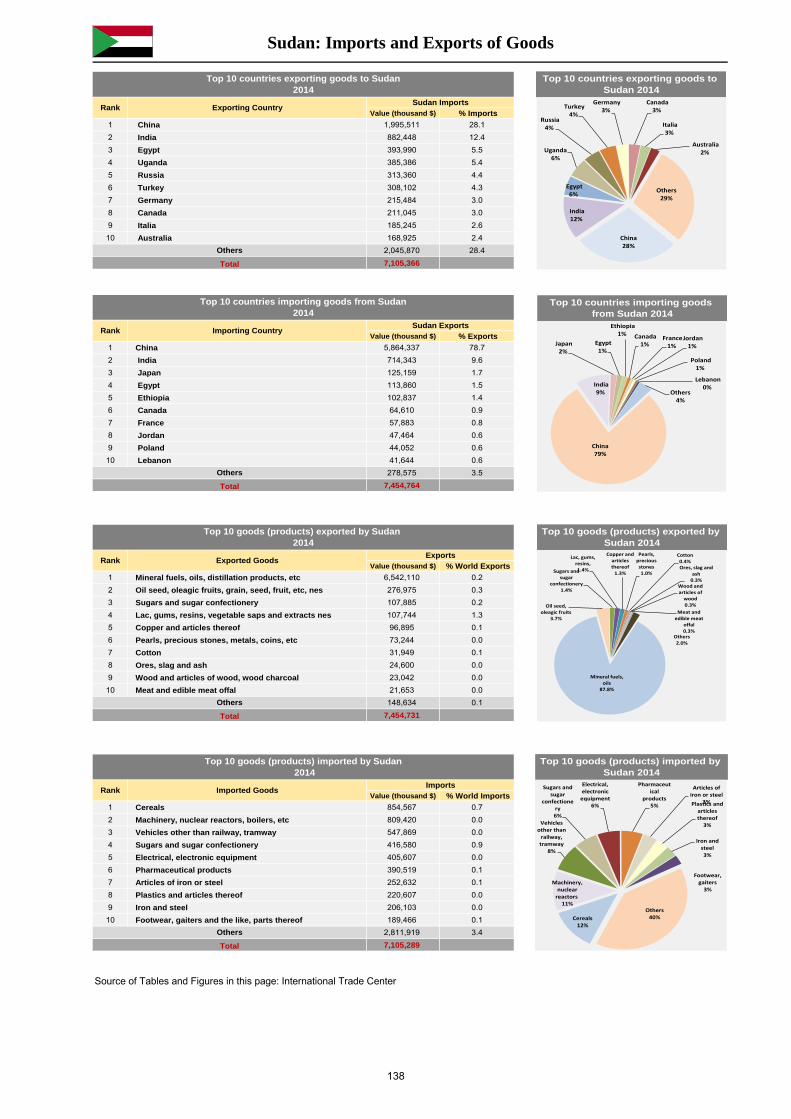
Source of Tables and Figures in this page: International Trade Center
Sudan: Imports and Exports of Goods
Top 10 countries exporting goods to Sudan 2014
China28%
India12%
Egypt6%
Uganda6%
Russia4%
Turkey4%
Germany3%
Canada3%
Italia3%
Australia2%
Others29%
Top 10 countries importing goods from Sudan 2014
China79%
India9%
Japan2%
Egypt1%
Ethiopia1% Canada
1%France
1%Jordan
1%
Poland1%
Lebanon0%
Others4%
Top 10 goods (products) exported by Sudan 2014
Mineral fuels, oils
87.8%
Oil seed, oleagic fruits
3.7%
Sugars and sugar
confectionery1.4%
Lac, gums, resins,1.4%
Copper and articles thereof
1.3%
Pearls, precious stones1.0%
Cotton0.4%Ores, slag and
ash0.3%
Wood and articles of
wood0.3%
Meat and edible meat
offal0.3%
Others2.0%
Top 10 goods (products) imported by Sudan 2014
Cereals12%
Machinery, nuclear
reactors 11%
Vehicles other than
railway, tramway
8%
Sugars and sugar
confectionery6%
Electrical, electronic
equipment6%
Pharmaceutical
products5%
Articles of iron or steel
3%Plastics and articles thereof
3%
Iron and steel3%
Footwear, gaiters
3%
Others40%
Value (thousand $) % Imports1 China 1,995,511 28.12 India 882,448 12.43 Egypt 393,990 5.54 Uganda 385,386 5.45 Russia 313,360 4.46 Turkey 308,102 4.37 Germany 215,484 3.08 Canada 211,045 3.09 Italia 185,245 2.6
10 Australia 168,925 2.42,045,870 28.47,105,366
Others
Total
Rank Exporting CountrySudan Imports
Top 10 countries exporting goods to Sudan2014
Value (thousand $) % Exports1 China 5,864,337 78.72 India 714,343 9.63 Japan 125,159 1.74 Egypt 113,860 1.55 Ethiopia 102,837 1.46 Canada 64,610 0.97 France 57,883 0.88 Jordan 47,464 0.69 Poland 44,052 0.6
10 Lebanon 41,644 0.6278,575 3.5
7,454,764Total
Top 10 countries importing goods from Sudan2014
Rank Importing CountrySudan Exports
Others
Value (thousand $) % World Exports1 Mineral fuels, oils, distillation products, etc 6,542,110 0.22 Oil seed, oleagic fruits, grain, seed, fruit, etc, nes 276,975 0.33 Sugars and sugar confectionery 107,885 0.24 Lac, gums, resins, vegetable saps and extracts nes 107,744 1.35 Copper and articles thereof 96,895 0.16 Pearls, precious stones, metals, coins, etc 73,244 0.07 Cotton 31,949 0.18 Ores, slag and ash 24,600 0.09 Wood and articles of wood, wood charcoal 23,042 0.0
10 Meat and edible meat offal 21,653 0.0148,634 0.1
7,454,731Total
Top 10 goods (products) exported by Sudan 2014
Rank Exported GoodsExports
Others
Value (thousand $) % World Imports1 Cereals 854,567 0.72 Machinery, nuclear reactors, boilers, etc 809,420 0.03 Vehicles other than railway, tramway 547,869 0.04 Sugars and sugar confectionery 416,580 0.95 Electrical, electronic equipment 405,607 0.06 Pharmaceutical products 390,519 0.17 Articles of iron or steel 252,632 0.18 Plastics and articles thereof 220,607 0.09 Iron and steel 206,103 0.0
10 Footwear, gaiters and the like, parts thereof 189,466 0.12,811,919 3.47,105,289Total
Top 10 goods (products) imported by Sudan 2014
Rank Imported GoodsImports
Others
138
Capital: Khartoum 2013 2014Currency: Sudanese pound (SDG) Exchange rate (LCU per USD): 4.757 5.737
Basic Information: UnitUSD billion
%
USD
%
%
USD billion
%
USD billion
USD billion
USD billion
Month
%
Million people
%
Foreign direct investment (FDI) UnitFDI Flow
Inward USD millionOutward USD million
FDI StockInward USD millionOutward USD million
Source: UNCTAD
Technological Environment and Differentiation
- - - -
- - - -
17,520 19,728 21,416 22,693
2011 2012 2013 2014
1,734 2,311 1,688 1,277
36.2 37.3 38.4 39.614.8 13.6 13.3 13.0
1.8 2.2 2.6 3.067.5 62.9 61.9 63.8
10.7 9.3 8.5 9.11.6 1.7 1.9 2.3
-8.6 -5.2 -4.2 -3.96.4 6.7 6.2 7.0
13.1 12.7 12.3 12.6-5.8 -3.8 -3.2 -3.0
1,979.5 1,982.7 1,931.036.5 36.9 19.0 10.5
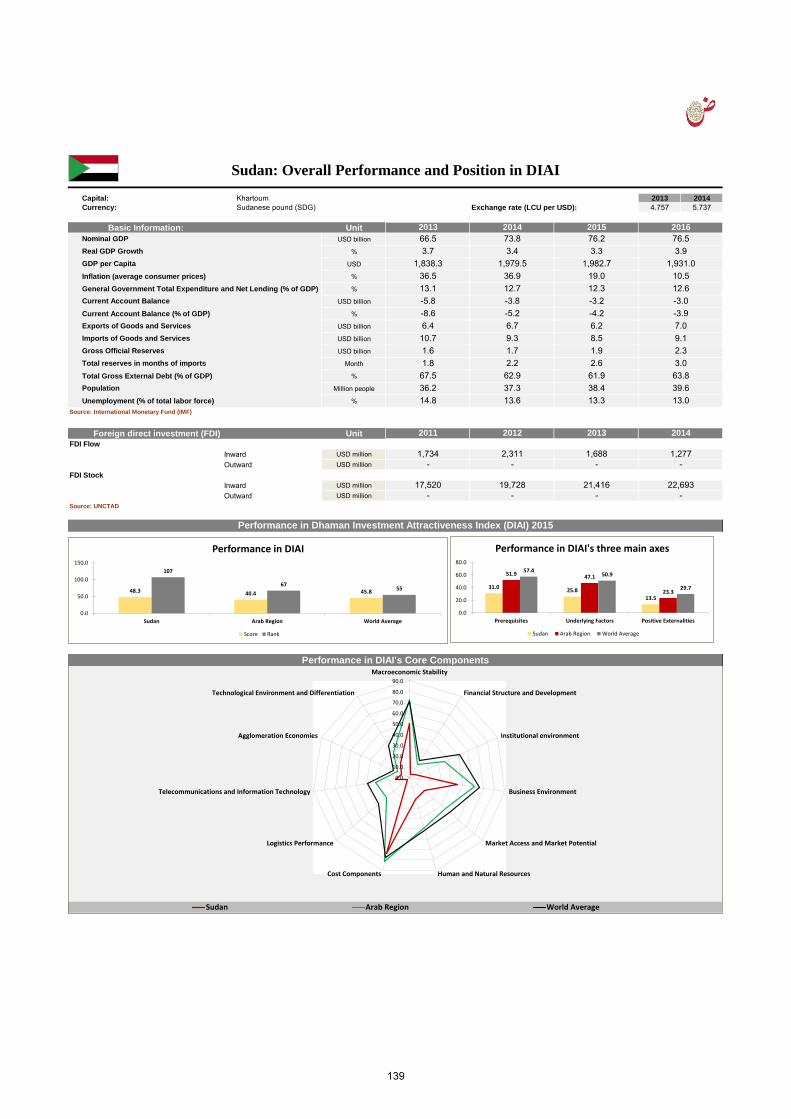
Sudan: Overall Performance and Position in DIAI
Performance in Dhaman Investment Attractiveness Index (DIAI) 2015
Performance in DIAI's Core Components
2013 2014 2015 201666.5 73.8 76.2 76.53.7 3.4 3.3 3.9
1,838.3
Nominal GDP
Real GDP Growth
GDP per Capita
Inflation (average consumer prices)
General Government Total Expenditure and Net Lending (% of GDP)
Current Account Balance
Current Account Balance (% of GDP)
Exports of Goods and Services
Imports of Goods and Services
Gross Official Reserves
Total reserves in months of imports
Total Gross External Debt (% of GDP)
Population
Unemployment (% of total labor force)Source: International Monetary Fund (IMF)
31.0 25.8
13.5
51.9 47.1
23.3
57.4 50.9
29.7
0.0
20.0
40.0
60.0
80.0
Prerequisites Underlying Factors Positive Externalities
Performance in DIAI's three main axes
Sudan Arab Region World Average
0.0
10.0
20.0
30.0
40.0
50.0
60.0
70.0
80.0
90.0
Macroeconomic Stability
Financial Structure and Development
Institutional environment
Business Environment
Market Access and Market Potential
Human and Natural ResourcesCost Components
Logistics Performance
Telecommunications and Information Technology
Agglomeration Economies
Technological Environment and Differentiation
Sudan Arab Region World Average
48.3 40.4 45.8
107
67 55
0.0
50.0
100.0
150.0
Sudan Arab Region World Average
Performance in DIAI
Score Rank
139