sudden stops and liability dollarization: evidence from ...fm · 2 sudden stops and liability...
TRANSCRIPT

1
Sudden Stops and Liability Dollarization:
Evidence from Asia's Financial Intermediaries
Timothy K. Chue and David Cook*
February, 2004
*Timothy K. Chue is from the Department of Economics, School of Business & Management, Hong Kong University of Science & Technology, Clear Water Bay, Kowloon, Hong Kong. E-mail: [email protected]. Tel: (852)-2358-7601. Fax: (852)-2358-2084. David Cook is from the Department of Economics, School of Business & Management, Hong Kong University of Science & Technology, Clear Water Bay, Kowloon, Hong Kong. E-mail: [email protected]. Tel: (852)-2358-7614. Fax: (852)-2358-2084. We thank Bob McCauley for helpful comments, and the Research Grants Council of the Hong Kong Special Administrative Region, China, for research support.

2
Sudden Stops and Liability Dollarization:
Evidence from Asia's Financial Intermediaries
Abstract: Before the currency crisis of 1997-1998, East Asian financial intermediaries borrowed heavily in international markets. During the crisis, the intermediaries’ stock market value declined sharply, and a sizable fraction of the institutions were closed or nationalized. We find that 1) the stocks of intermediaries with large international debt exposure performed poorly during the crisis; 2) more short-term international debt outstanding was associated with a higher probability of bankruptcy; 3) among those intermediaries that survived, more long-term international debt was associated with a lower equity return; and 4) higher international debt, especially short-term international debt, was associated with a more severe contraction in the assets and liabilities of the intermediaries. This evidence supports the “sudden stop” and “liability dollarization” theories of emerging market financial crises. It indicates that both the sudden withdrawal of funds by international creditors and the foreign currency nature of international debt damage the financial system, and exacerbate the decline in the financing of investment. Keywords: Sudden Stops, Liability Dollarization, Financial Intermediaries, Asian Financial Crisis. JEL Classification: F32, F34, G15, G20

3
Introduction
Recent episodes of financial crises have stimulated a large body of research on capital
markets in developing economies. Two branches of this literature examine the role of international
capital markets as a propagation channel for financial crises. On the one hand, theories of “sudden
stops” emphasize the volatility of foreign lending to emerging markets (see Calvo 1998). A sudden
outflow of capital from a small economy requires structural adjustment that can result in a decline
in output.1 On the other hand, theories of “liability dollarization” emphasize the foreign currency
denomination of international debt. Virtually all external debt in emerging markets, in East Asia or
otherwise, is denominated in foreign currencies (see Eichengreen and Hausmann 1999). Following
an exchange rate devaluation, foreign currency debt becomes more expensive to repay. This effect
can jeopardize corporate balance sheets and lead to bankruptcies.2
Our goal in this study is to examine the empirical evidence for these theories. We use firm-
level data to estimate the cross-sectional determinants of the performance of financial
intermediaries in five East Asian economies (Indonesia, Korea, Malaysia, Taiwan, and Thailand)
during the Asian financial crisis, paying special attention to the role of international debt. Because
firm-level accounting data on foreign currency liabilities are scarce, and accounting standards and
reporting requirements differ across countries, we use a data source that allows us to construct
measures of outstanding international debt based on published, primary-market data on foreign
market bonds, Eurobonds, and syndicated bank loans.
Because this data contains the issue and maturity dates of the international debt, we can
distinguish the effects of a “sudden stop” in lending from those of the “liability dollarization”
channel. In particular, we split the international debt of all firms into two parts: 1) short-term debt
that came due during the crisis; and 2) long-term debt that was issued before, but came due after the
crisis. Firms that have high exposure to short-term international debt should be more sensitive to
sudden stops. At the same time, firms with unhedged foreign currency debt should be exposed to an
exchange rate depreciation through the liability dollarization channel, even if that debt were long-
term in nature. We find evidence in support of both effects: short-term international debt was
strongly associated with the probability that financial intermediaries would be closed or
1 A number of authors, including Calvo and Mendoza (2000), Calvo and Reinhart (1999), Christiano, Gust, and Roldos (2002), Cook and Devereux (2001), and Mendoza (2001), explore the real effects of sudden stops in lending. 2 The impact of foreign currency debt on financial crisis and monetary policy has been extensively studied by Aghion, Bannerjee, and Bacchetta (2000, 2001), Allen and Gale (2000), Bris and Koskinen (2002), Burnside, Eichenbaum, and Rebelo (2001), Caballero and Krishnamurthy (2003), Céspedes, Chang, and Velasco (2000), Choi and Cook (2002), Cook (2000), Devereux and Lane (2000), and Jeanne and Wyplosz (2003), among others.

4
nationalized; and of those intermediaries that survived the crisis, long-term international debt was
significantly associated with poor financial performance. Moreover, intermediaries with short-term
international debt significantly cut their assets and loans during the crisis.
The finding that international debt (whether short or long term) matters for the performance
of financial intermediaries following an exchange rate depreciation is not a priori obvious, for these
firms can potentially hedge their foreign exchange exposures in financial markets, or offset them
through cash flows that come from foreign-currency-denominated assets. Indeed, Krueger and Yoo
(2002) and Dooley and Shin (2000) argue that the Korean banking system did not face any currency
mismatch as a result of their foreign currency borrowings, and Ize and Levy-Yeyati (2003) argue
that bank-level liability dollarization is consistent with optimal risk management in a number of
emerging markets. Glick and Hutchison (1999) find that banking crises are likely to precede
currency crises, but currency crises do not lead to banking crises. Arteta (2003) also finds that
countries that have larger mismatches between foreign currency deposits and domestic currency
assets are not more likely to experience severe banking or currency crises. Kho and Stulz (2000)
study the currency exposure of the banking sector in five East Asian countries during the Asian
financial crisis. They find that currency exposures had a negative impact on the sector’s stock
returns only in Indonesia and the Philippines.
Papers that study the effect of foreign currency debt on the performance of emerging
market firms during crises have concentrated on non-financial firms. Some work contradicts the
liability dollarization hypothesis. Bleakley and Cowan (2002) find that in the 1990s, although their
book net worth declined, Latin American non-financials with high levels of foreign debt had
relatively high investment and profits during depreciations. They argue that export firms that
benefit from an exchange rate depreciation are also more likely to have foreign currency debt.
Luengnaruemitchai (2003) finds that East Asian non-financials with high levels of foreign currency
debt also had relatively high levels of investment during the Asian financial crisis. Other work has
more ambiguous results. Galindo, Panizza, and Schiantarelli (2003) survey a series of papers that
examine the impact of foreign currency debt on the investment of Latin American firms. Most of
the studies in the survey find that the impact is negative. Echeverry et al. (2003) find that
Columbian firms with high foreign currency debt have low profits during recessions, although
foreign currency debt is not associated with investment. Allayannis, Brown, and Klapper (2003)
find that hedged foreign currency debt was associated with worse financial performance during the
East Asian crisis than were domestic currency debt or unhedged foreign currency debt. Harvey and
Roper (1999) argue that the adverse balance sheet effects of firms’ foreign currency debt
exacerbated the Asian financial crisis. Aguiar (2002) finds that Mexican intermediaries with a large
share of their short-term debt denominated in foreign currencies had relatively low levels of
investment in years following the peso depreciation of 1994. Claessens, Djankov and Xu (2000)

5
and Claessens, Klingebiel, and Laeven (2001) show that East Asian firms with high shares of short-
term debt had low profitability during the Asian financial crisis, and Forbes (2002) finds that highly
leveraged non-financial firms do poorly following large depreciations. Bris, Koskinen, and Pons
(2002) examine recent episodes of financial crises, and show that after a crisis has occurred, Asian
firms’ profitability declines and leverage increases further, but European and Latin American firms
display clearer signs of recovery.
We focus on financial firms, as theories of financial crises with sudden stops and liability
dollarization emphasize the role played by these institutions. Before a crisis, financial
intermediaries borrow internationally in foreign currencies to make risky domestic loans, exposing
themselves to the liquidity risk of “sudden stops” in international capital flows, and the exchange
rate risk due to “liability dollarization”. Bank credit is an important source of finance in emerging
markets, so the impact of the crisis on banks is important for the real economy. Moreover, currency
crises can have significantly different implications for financial intermediaries than for other firms.
Financial intermediaries typically have very high leverage and are particularly susceptible to market
imperfections caused by asymmetric information. At the same time, financial firms may not have
substantial export businesses that can directly benefit from an exchange rate devaluation. On the
other hand, financial institutions may have greater access than non-financial corporations to
derivatives that hedge risk, although Burnside, Eichenbaum, and Rebelo (2001) argue that East
Asian financial intermediaries ignore these opportunities.
Testing the determinants of stock market performance in a population of firms with a high
percentage of bankruptcies presents a number of estimation issues. In principle, intermediaries with
a complete loss of equity value could be treated as corner solution outcomes. However, we find
strong evidence that the firm-level characteristics that determine the probability of bankruptcy
affect the financial performance of surviving companies in a different manner. Thus, we estimate
the determinants of the probability of failure independently from the determinants of the surviving
intermediaries’ performance. Specifically, we estimate the determinants of the probability of failure
with a Probit specification, and the determinants of the stock market performance of surviving
intermediaries with linear models corrected for selection (see Heckman 1979). We find that short-
term international debt is associated with the likelihood that a financial institution failed (i.e., be
closed or nationalized with a total loss for investors) during the crisis, and long-term international
debt is correlated with the stock market performance of the institutions that survived. International
debt is also negatively associated with the growth rate of an intermediary’s assets during the crisis.
This finding reflects the reduction in the availability of financing to domestic firms. Other aspects
of a financial institution’s balance sheet such as a low asset size, a high leverage, and a high share
of risky assets such as loans and securities are also associated with poor crisis period performance.

6
The rest of the paper is organized as follows. Section II discusses the data we use in this
study, and provides various summary statistics. Section III estimates several statistical models of
firm performance during the Asian financial crisis. We use stock returns as well as various balance
sheet variables as measures of financial performance. We pay special attention to the role of
international debt, and its short- and long-term components. Section IV concludes.
II Data
A. Aggregate Data
1. Foreign Currency Debt
Information on new issues of debt in international financial markets is reported by the IFR
Platinum database (from Thomson Financial). This data includes the face value, issue dates, and
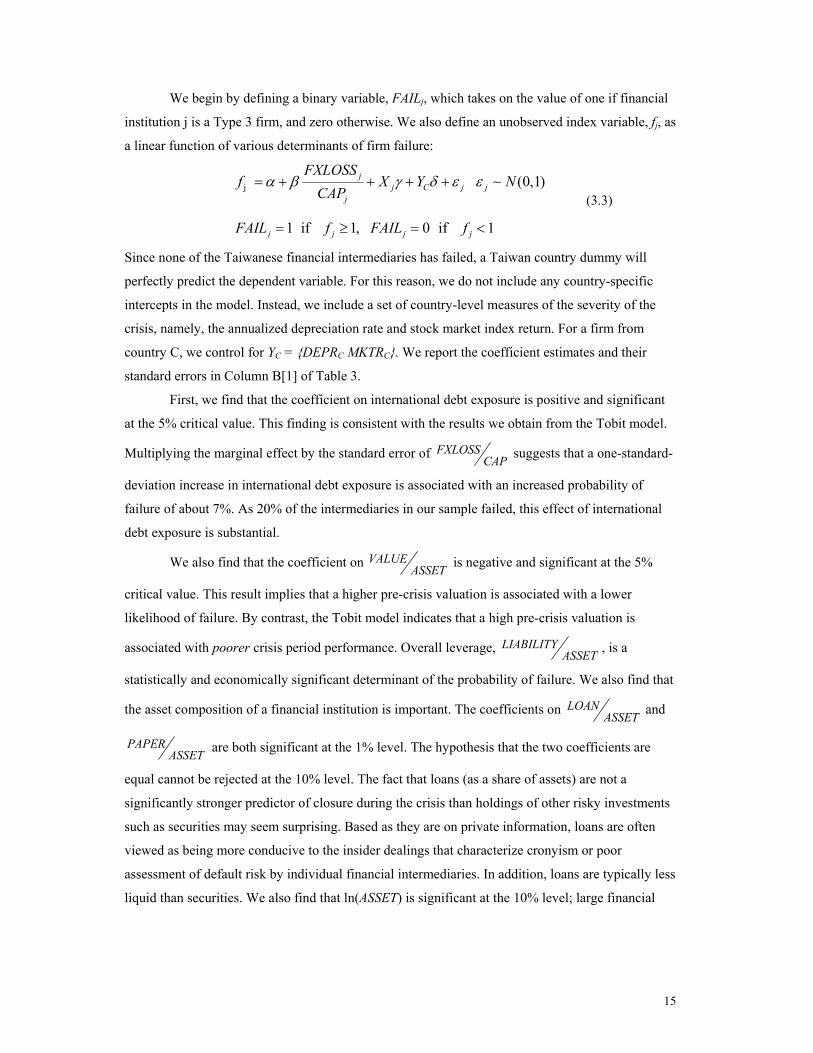
maturity dates of foreign market bonds, Eurobonds, and syndicated bank loans. Figure 1 shows the
total foreign currency debt issued in international markets by financial corporations in Indonesia,
Korea, Malaysia, Taiwan, and Thailand for each year between 1990 and 1999. In all countries but
Taiwan, there is a surge in international debt issued by financial intermediaries in the years
preceding the crisis. In the cases of Korea and Thailand, the lending boom peaks in 1995. In the
cases of Indonesia and Malaysia, capital flows to financial institutions increase until 1997. The
flows of international lending to the financial sectors of these four countries in 1997 is above the
level in 1994, and contracts suddenly in 1998. In Taiwan, by contrast, the amount of international
debt continues to increase until 1998.
2. Financial Markets
After June 1997, we observe exchange rate depreciations and stock market declines in all
five countries. We report two country-level measures of this financial crisis in Table 1, Panel A.
Each is drawn from Standard & Poor’s Emerging Market Data Base.
1) MKTR: The annualized net returns (with dividends reinvested) on the S&P IFCG Index
between July 1, 1997 and December 31, 1998, measured in local currency.
2) DEPR: The annualized net growth rate in the spot exchange rate with the US dollar
between July 1, 1997 and December 31, 1998.
Indonesia suffers the largest, while Taiwan the mildest, exchange rate depreciation. The
extent of depreciation of the Korean Won, the Malaysian Ringgit, and the Thai Baht are
intermediate cases and are similar in scale. Malaysia experiences the sharpest decline in its stock
market (measured in local currency), whereas the decline in the Taiwan stock market is the mildest.
B. Firm-Level Data

7
We extract data from the Pacific Capital Markets (PACAP) database for 303 corporations
in the financial sectors of Indonesia, Korea, Malaysia, Taiwan, and Thailand. We only include
companies for which stock prices are available in June 1997, and balance sheet data is available
from 1996, the financial year prior to the crisis.3 Among the 303 firms, PACAP has continuously
reported monthly stock returns for 205 of them between July 1997 and December 1998, the period
we define as the crisis period. We refer to these 205 intermediaries as Type 1 intermediaries. There
are 36 Type 2 intermediaries that cease to trade for some time during the crisis, but resume trading
by December 1998 or some time afterwards. Thus, the crisis-period stock returns for Type 2
intermediaries cannot be calculated due to missing data. Another 62 intermediaries (which we refer
to as Type 3 intermediaries) cease trading during the crisis, and are identified through a variety of
media sources as being closed or nationalized by the authorities.
1. Measure of Financial Performance
We classify stock market performance in two ways.
3) RETURN: the net, annualized local currency returns for Type 1 intermediaries. We
compound monthly returns (with dividends reinvested) over the 18 months between July
1997 and December 1998. For Type 2 intermediaries, this variable is coded as missing.
We code the net return of Type 3 intermediaries (which are closed or nationalized) as
equal to –1, indicating a total loss in value.
4) FAIL: a dummy variable coded as 1 for Type 3 intermediaries, and coded as 0 for Type 1
and Type 2 intermediaries.
We calculate the growth rate of a number of balance sheet items (also obtained from
PACAP), including book equity, assets, and total liabilities, as additional measures of firm
performance during the crisis. The growth rate of the book value of equity is a natural counterpart
to the growth rate of the market value of equity as measured by the stock market return. The asset
growth of financial intermediaries reflects the availability of credit for domestic firms, and liability
growth shows the ability of financial intermediaries to attract funds.
5) EQUITY GROWTH: the net annualized local currency growth rate of net worth between the
end of year 1996 and the end of year 1998 balance sheets.
6) ASSET GROWTH: the net annualized local currency growth rate of total assets between
the end of year 1996 and the end of year 1998 balance sheets.
7) LIABILITY GROWTH: the net annualized local currency growth rate of total liabilities
between the end of year 1996 and the end of year 1998 balance sheets. 3 We select firms that PACAP associates with financial industries. The actual terminology differs across countries, but we categorize the following as financial industries: “Banks”, “Banking”, “Banking and

8
Due to the crisis, many of the intermediaries’ balance sheets are unavailable at year end
1998. We show the average growth rate for the surviving intermediaries in Table 1, Panel C. The
average growth rate of book value over the crisis is approximately -4%. The decline in stock
markets is much steeper than the decline in the book value of net worth. The market assessment of
the value of assets may fall faster during a crisis than the accounting value of assets. After many
years of rapid growth, both the assets and liabilities of Asia’s financial intermediaries come to a
sudden stop during the financial crisis. The average growth rate of assets is essentially zero, while
the average annualized growth rate of liabilities is less than 1%.
2. Balance Sheet Entries
To normalize foreign exchange losses, we use variables drawn from the end of financial
year 1996 balance sheets reported in PACAP. Each variable is converted into US dollars using the
exchange rate at the onset of the crisis in June, 1997.
8) EQUITY: the US dollar value of net worth in 1996.
9) ASSET: the US dollar value of total assets in 1996.
10) LIABILITY: the US dollar value of total liabilities in 1996.
There is substantial variation in the size of the intermediaries in our sample. The smallest
intermediary (an Indonesian insurance company) has ASSET equal to US$10 million. The largest is
Maybank, which has ASSET of almost US$70 billion. The average intermediary has assets of
approximately US$4.5 billion, liabilities of US$4.2 billion, and accounting net worth of US$0.3
billion.
We also obtain the total value of stocks outstanding for each firm from PACAP.
11) CAP: the US dollar value of the market capitalization of common stocks in June 1997.
We then construct a measure of financial value as the sum of book liabilities plus market
capitalization.
12) VALUE: the sum of LIABILITY and CAP.
PACAP divides the assets of financial institutions into five categories: i) Loans; ii)
Investments; iii) Cash; iv) Other Assets; and v) Tangible Assets. We construct two variables that
measure the structure of assets.
13) LOAN: the US dollar value of loans in the financial year end of 1996.
14) PAPER: the US dollar value of securities in the financial year end of 1996.
We construct ratios of some of the above variables as controls for the risk faced by banks besides
international debt exposure. We report the means and standard deviations of these ratios in Table 1,
Panel B. The average ratio of liability to assets is approximately 0.8; financial institutions are
Insurance”, “Insurance”, “Finance”, “Finance and Securities”, “Securities”, “Other Financial Services”, “Merchant Banks”, and “Mutual Funds”.

9
highly leveraged as a matter of course. Loans and securities are among the riskier assets held by
financial institutions. The share of assets in this form may help determine bank risk. The average
intermediary has about 50% of their assets in loans and 25% in securities. We also calculate a
measure of the market valuation of firms relative to their accounting value of assets,
VALUEASSET . We find that East Asia’s financial intermediaries have an average market value
that is 110% of the book value of their assets, and the variance among firms is large.
An additional source of equity risk we consider is liquidity risk. We construct a measure of
turnover to control for stock market liquidity.
15) TURNOVER: the average monthly value of stocks traded (over the period 1993:1–1997:06)
relative to stock market capitalization.
We find that the average turnover across companies is equal to eight percent.
C. International Debt Exposure
We use the debt listed in the IFR Platinum database to calculate the pre-crisis international
debt position of each firm. We define the following variables, which are all measured in US dollars.
16) IDEBT: the sum of the face value of the foreign currency debt issued before July 1997, and
with a maturity date after June 1997.
17) IDEBT98: the sum of the face value of the foreign currency debt issued before July 1997,
and with a maturity date between July 1997 and December 1998.
18) IDEBTLT: the difference between IDEBT and IDEBT98.
We measure international debt exposure as the direct losses due to the increase in the domestic
currency cost of repaying the face value of foreign currency debt, where the increase is a result of
the crisis-period exchange rate depreciation.
19) FXLOSS: the product of IDEBT and DEPR, the annualized net depreciation rate of the
domestic currency (with respect to the US dollar) over the period June 1997 to December
1998.
20) FXLOSS98: the product of IDEBT98 and DEPR.
21) FXLOSSLT: the product of IDEBTLT and DEPR.
Multiplying IDEBT by the net depreciation of the exchange rate is equivalent to calculating
the difference between the domestic currency cost of repaying the foreign debt at the end-of-period
exchange rate and the cost of repayment at the beginning-of-period exchange rate, and then
converting this quantity back into US dollars at the initial exchange rate. We annualize for
consistency with our measures of financial performance, namely, annualized stock returns and
annualized growth rates of various balance sheet entries. We convert these measures of foreign
exchange losses back into US dollars using the beginning-of-period (June 1997) exchange rates, for

10
we will normalize these variables by balance sheet items that are converted into US dollars using
exchange rates on the same date.
D. Sector Data
We are interested in examining more closely the distribution of international debt exposure
among East Asian firms. We classify these financial intermediaries into four sectors: Banking,
Insurance, Securities, and Other. In each country but Taiwan, PACAP directly classifies
intermediaries that belong to the Banking or Insurance sector. For Taiwan, we classify financial
intermediaries that have the word “bank” or “insurance” in their name into the respective Banking
or Insurance sector. Of the remaining financial institutions, we classify them in the Securities sector
if 50% or more of their assets are classified by PACAP as investments in securities. Other is the
residual category, and includes finance companies and leasing intermediaries. In our sample, there
are 87 intermediaries in the Banking sector, 57 in the Insurance sector, 44 in the Securities sector,
and 115 in the Other sector.
Descriptive statistics by country and by sector are reported in Table 2. Approximately 40%
of the financial intermediaries in our sample have issued some debt in international markets.
However, there are considerable variations across sectors and countries. Only about 10% of the
intermediaries in Malaysia and Taiwan have positive levels of IDEBT. The figure is 40% in Korea,
and nearly 60% in both Indonesia and Thailand. Two-thirds of the intermediaries classified as
banks have positive international debt, but none in the insurance industry has any. One-quarter of
the intermediaries in the Securities sector, and half of the intermediaries in the Other category have
positive international debt.
For those intermediaries that have outstanding international debt as of the beginning of the
crisis, roughly 40% of the debt is short term (i.e., comes due before the end of the crisis), as the
average ratio of IDEBT98 to IDEBT for firms with positive international debt is .4. Thai and
Indonesian intermediaries have the highest shares of short-term international debt, at 54% and 41%
respectively.
In terms of dollar values, the Banking intermediaries, especially those in Korea and
Thailand, have the highest international debt levels. The average East Asian bank has IDEBT equal
to US$300 million while the average Korean and Thai bank has IDEBT that exceeds US$600
million. Banks in the remaining three countries have much smaller international debt levels. The
level of international debt for Securities intermediaries is considerably lower, averaging US$21
million.
In Table 2, we report FXLOSSCAP , the foreign exchange losses relative to pre-crisis stock
market capitalization. The increase in the cost of international debt repayment is large; the
annualized rise in the domestic currency price of repaying foreign currency debt is nearly 26% of

11
the market capitalization of the average intermediary. The largest average direct loss measured by
the ratio of IDEBT to CAP is in Thailand. Indonesia suffers the largest exchange rate depreciation,
which magnifies the size of foreign exchange losses. In Malaysia and Taiwan, foreign exchange
losses from international debt exposure are very small. Across sectors, foreign exchange losses are
most severe in the Other sector, followed by the Banking and Securities sectors. Korean merchant
banks and Thai finance companies (most of which are in the Other sector) have heavy debt to
international financial markets relative to their capitalization. In Indonesia, international debt
exposure is most severe in the Securities sector.
For the Type 1 intermediaries (i.e., those intermediaries for which PACAP has
uninterrupted records of monthly stock returns over the crisis period), the average annualized local
currency returns (RETURN) ranges from -8% in Korea to -69% in Indonesia. Of course, returns
measured in US dollars are significantly lower. By necessity, we omit the companies that go out of
business (the Type 3 intermediaries), and the companies whose stocks cease trading for a
considerable period during the crisis (the Type 2 intermediaries). Among the Type 1
intermediaries, the variation in returns is considerable. The minimum return is -95%, but some
intermediaries experience positive net returns of 400%. The cross-sectional standard deviation of
the returns in Korea and Thailand is especially large. In particular, those Korean and Thai
intermediaries in the Securities sector that did not fail actually had relatively high returns over the
crisis.
Table 2 also shows the breakdown by country and sector of intermediaries that failed.
Twenty percent of the overall sample of intermediaries is classified as being closed or nationalized.
However, none of the 25 financial intermediaries in Taiwan, and only two of the 52 intermediaries
in Malaysia fall into this category. By contrast, fully 40% of Thai financial intermediaries are
classified as failed. In both Korea and Indonesia, this figure is approximately 20%. Examining
across sectors, we find that only two out of 57 insurance intermediaries failed during the crisis. It is
the intermediaries in the Other category that exhibits the highest frequency of failure. This pattern
is most pronounced in Thailand, where 60% of the intermediaries in the Other category failed.
Korean merchant banks and Korean intermediaries in the Securities category also had a high
frequency of failure. The rates of failure in Indonesia’s Banking, Securities, and Other sectors are
also high.
III Statistical Models of Crisis Performance
In this section, we examine the effects of international borrowing on the performance of
financial intermediaries during the Asian financial crisis.

12
A. Tobit Models of Stock Returns
First, we study the relationship between an intermediary’s foreign exchange losses on
international debt and its crisis-period stock market return. Stock market returns are a useful
measure of financial performance, as they should incorporate both the net worth effects that arise
from the higher cost of repaying foreign currency debt, as well as any potential positive effects that
an exchange rate depreciation may have on the domestic currency value of foreign income or
assets. From Table 2, we see that the average FXLOSS
CAP is 26%, while the average RETURN is -
27%. In other words, for an average firm in our sample, its foreign exchange losses due to
international debt are comparable in size with its losses in equity value, where both losses are
measured relative to the initial equity value of the firm. This observation suggests that the foreign
exchange losses due to liability dollarization are promising candidates to quantitatively explain the
negative crisis-period stock market returns of these firms.
For the moment, we ignore the Type 2 intermediaries (whose crisis-period returns are
missing), and estimate the effect of foreign exchange losses on the performance of the remaining
267 intermediaries. We use the following Tobit specification, where jr is a latent variable, and αC
is a country-specific intercept.
if 1, 1 if 1.
jj C j
j
j j j j j
FXLOSSr
CAP
RETURN r r RETURN r
α β ε= + +
= > − = − ≤ −
(3.1)
We can think of the left-hand side variable as the change in the domestic currency value of equity
divided by the initial value of equity, and the right-hand side variable as the change in the domestic
currency cost of debt repayment, also normalized by the initial value of equity.4 Thus, we can
interpret β as the drop in equity value associated with each dollar of foreign exchange losses as a
result of the higher cost of international debt repayment.
We report the estimate of 0.55β = − in Table 3, Column A[1]. This estimate is interesting
along two dimensions. First, the coefficient is significant at the 1% critical value, indicating that
international debt was strongly associated with poor financial performance during the crisis.
Second, the coefficient is significantly less than 1 in absolute value, so each additional dollar
needed for debt repayment is associated with a less than one-for-one decrease in a firm’s stock
market value. One explanation for this finding is that some of the foreign exchange risk from
4 Note that even though both FXLOSS and CAP are measured in US dollars (converted from local currencies using the June 1997 exchange rates), the ratio, FXLOSS/CAP, is not affected by this choice of the currency of denomination.

13
international borrowing may have been hedged, either naturally (through holdings of foreign
currency assets) or artificially (through financial derivatives). Another possibility is that it is the
healthier financial intermediaries, which can perform better relative to other firms, that have better
access to international debt before the crisis.
Bongini, Claessens, and Ferri (2001) and Bongini, Ferri, and Kang (2000) find that several
traditional risk factors are important determinants of the crisis-period performance of East Asia’s
financial intermediaries. To control for the effects of these factors, we incorporate them in the Tobit
specification.
if 1, 1 if 1
jj C j j
j
j j j j j
FXLOSSr X
CAP
RETURN r r RETURN r
α β γ ε= + + +
= > − = − ≤ −
(3.2)
The vector of control variables, Xj , includes overall leverage, LIABILITY
ASSET , so that
we can distinguish the effects of international debt from other debt; financial value relative to book
value, VALUEASSET , in order to control for pre-crisis expectations; the share of assets that is
loans, LOANASSET , and the share of assets that is securities, PAPER
ASSET , to control for the
varying riskiness of assets; ln(ASSET) to control for the ability of large financial institutions to
diversify risk and mobilize public support; and TURNOVER to measure any liquidity effects in
financial markets. We report estimates of γ and β in Table 3, Column A[2]. The coefficient on
FXLOSSCAP is statistically significant at the 1% critical value even after controlling for these risk
factors.
We find that the coefficient on LIABILITYASSET is negative and significant at the 1%
critical value, so that high overall leverage is negatively associated with crisis-period performance.
The coefficient on LOANASSET is negative and significant at the 5% level, while the coefficient
on PAPERASSET is insignificantly different than zero. Perhaps due to their less transparent and
illiquid nature, the effect of loans on firm performance differs from that of securities. The
coefficient on pre-crisis financial valuation, VALUEASSET , is negative and statistically significant
at the 5% level. One explanation for this finding is that the negative macroeconomic outlook
brought about by the crisis may affect the valuation of growth stocks most severely. Alternatively,
if the crisis was associated with the collapse of a stock market bubble, the most overvalued
intermediaries would fall the farthest. The coefficient on TURNOVER is negative and significant at

14
the 10% critical value. Equities that were very liquid in the pre-crisis period had lower returns
during the crisis. On the other hand, the coefficient on ln(ASSET) is not significant.
The impact of international debt on crisis performance may operate through the “liability
dollarization” channel, the “sudden stop” channel, or both. To differentiate the two channels we
split FXLOSSCAP into a short-term component,
98FXLOSSCAP , and a long-term component,
LTFXLOSSCAP . Firms with short-term international debt that needs to be rolled over should be
exposed to the risk of a sudden stop. On the other hand, the market value of a firm with unhedged
foreign currency debt (i.e., “dollarized” liabilities) should be exposed to exchange rate
depreciations, even if the principal on that debt is not due for some time. In Column A[3], we report
the estimated coefficients of a Tobit model in which we replace FXLOSSCAP by
98FXLOSSCAP
and LTFXLOSS
CAP .
We find that the coefficients on 98FXLOSS
CAP and LTFXLOSS
CAP are significant at the
5% and 10% critical value respectively. By allowing the coefficients on 98FXLOSS
CAP and
LTFXLOSSCAP to differ from one another, there is little impact on the estimates of the other
coefficients. The coefficients on short-term and long-term debt are approximately equal, and similar
in size to the estimate from the regression reported in Column A[2], in which these two coefficients
are restricted to be equal. The fact that long-term international debt has an equally negative impact
on returns as does short-term international debt argues against the idea that the crisis was driven
solely by the sudden refusal of international capital markets to roll over existing short-term debt.
The Tobit model strengthens inference by assuming that those determinants that cause
observed stock returns to be low among surviving financial institutions are the same ones that
increase the probability that an institutions will fail. We can test the validity of this assumption by
the Fin-Schmidt (1984) likelihood ratio test. Specifically, we test the hypothesis that the
coefficients of the index function that determines the probability of failure are the same as the
coefficients of the linear model that explains the stock returns of the surviving intermediaries. We
reject this hypothesis with a p-value of less than .001. This strong rejection suggests that it is more
appropriate to conduct inference on the probability of failure and the stock returns of surviving
intermediaries separately.
To address this concern, we first examine a Probit model for the probability that a financial
institution was closed or nationalized (i.e., that it was a Type 3 firm).
B. Probit Models of Failure
15
We begin by defining a binary variable, FAILj, which takes on the value of one if financial
institution j is a Type 3 firm, and zero otherwise. We also define an unobserved index variable, fj, as
a linear function of various determinants of firm failure:
j (0,1)
1 if 1, 0 if 1
jj C j j
j
j j j j
FXLOSSf X Y N
CAP
FAIL f FAIL f
α β γ δ ε ε= + + + +
= ≥ = <
∼ (3.3)
Since none of the Taiwanese financial intermediaries has failed, a Taiwan country dummy will
perfectly predict the dependent variable. For this reason, we do not include any country-specific
intercepts in the model. Instead, we include a set of country-level measures of the severity of the
crisis, namely, the annualized depreciation rate and stock market index return. For a firm from
country C, we control for YC = {DEPRC MKTRC}. We report the coefficient estimates and their
standard errors in Column B[1] of Table 3.
First, we find that the coefficient on international debt exposure is positive and significant
at the 5% critical value. This finding is consistent with the results we obtain from the Tobit model.
Multiplying the marginal effect by the standard error of FXLOSSCAP suggests that a one-standard-
deviation increase in international debt exposure is associated with an increased probability of
failure of about 7%. As 20% of the intermediaries in our sample failed, this effect of international
debt exposure is substantial.
We also find that the coefficient on VALUEASSET is negative and significant at the 5%
critical value. This result implies that a higher pre-crisis valuation is associated with a lower
likelihood of failure. By contrast, the Tobit model indicates that a high pre-crisis valuation is
associated with poorer crisis period performance. Overall leverage, LIABILITYASSET , is a
statistically and economically significant determinant of the probability of failure. We also find that
the asset composition of a financial institution is important. The coefficients on LOANASSET and
PAPERASSET are both significant at the 1% level. The hypothesis that the two coefficients are
equal cannot be rejected at the 10% level. The fact that loans (as a share of assets) are not a
significantly stronger predictor of closure during the crisis than holdings of other risky investments
such as securities may seem surprising. Based as they are on private information, loans are often
viewed as being more conducive to the insider dealings that characterize cronyism or poor
assessment of default risk by individual financial intermediaries. In addition, loans are typically less
liquid than securities. We also find that ln(ASSET) is significant at the 10% level; large financial

16
intermediaries are less likely to close during the crisis. At the aggregate level, neither the
depreciation rates nor the market-level stock returns are significant.
We then estimate a Probit model that splits international debt exposure into short- and long-
term components, but is otherwise identical to model (3.3). We report the estimation results in
Column B[2]. In this model, the coefficient on 98FXLOSS
CAP is positive and significant at the 5%
level, but the coefficient on LTFXLOSS
CAP is insignificant. Thus, we find that short-term
international debt helps explain firm failure, but its long-term counterpart does not. Note that this
finding is in contrast with the results we obtain from the Tobit model, which suggests that short-
and long-term international debt has similar impact on firm performance. The different conclusion
we obtain here reinforces the results of the Fin-Schmidt test that we need to consider the
determinants of firm failure separately from the determinants of surviving firms’ stock returns.
C. Selection-Corrected Models of Surviving Firms’ Stock Returns
We now turn to the performance of those intermediaries for which we can observe returns
throughout the crisis. Of the 303 intermediaries in our sample, there are 205 (the Type 1
intermediaries) that fall into this category. We estimate a linear function of stock returns corrected
for selection using a Probit selection equation.
j
jj C j j
j
js s s sj C j
j
FXLOSSRETURN X
CAP
FXLOSSselect X Y
CAP
α β γ ε
α β γ δ ω
= + + +
= + + + + (3.4)
Firm j is a Type 1 intermediary (i.e., 1jRETURN > − ) if selectj is greater than 1. Using a
likelihood ratio test, we can reject the hypothesis that the two error terms in model (3.4) are
uncorrelated at the 1% level. This result suggests that it is important to control for selection.
We report the maximum likelihood estimates and standard errors of the coefficients in
model (3.4) in Table 3, Column C[1]. We include the country-level macroeconomic indicators, YC =
{DEPRC MKTRC}, rather than country-specific intercepts in the selection equation, again because
none of the Taiwanese intermediaries has failed. Though conceptually different, the selection
equation here and the Probit equation reported in Column B[1] have similar implications.
Generally, the variables that are significant in the Probit model in Column B[1] are also significant
in the selection equation here (though naturally, the coefficients are of opposite signs). A few
differences are noteworthy. First, in the selection equation, logged asset size is significant at the 1%
critical value. Since the coefficient on the same variable is only significant at the 10% level in the
Probit equation, the significance we obtain here suggests that small financial intermediaries are
very likely to be Type 2 intermediaries, whose returns are unobservable for some period of time
17
during the crisis. Similarly, the coefficient on exchange rate depreciation is significant at the 1%
level here, but insignificant in the Probit equation. This difference suggests that the degree of
exchange rate depreciation is an important factor in determining if a firm is a Type 2 intermediary.
We also find that VALUEASSET and PAPER
ASSET are no longer significant in the selection
equation.
In the return equation of specification (3.4), the coefficients on FXLOSSCAP and
LIABILITYASSET are significant at the 1%, and the coefficient on VALUE
ASSET is significant at
the 5% level (see Column C[1]). Comparing the results here with those from Column B for the
Probit model, we see that even though VALUEASSET is negatively associated with the performance
of intermediaries that did not fail, it is positively associated with the probability of avoiding failure.
In Column C[2], we report estimates from a model that includes 98FXLOSS
CAP and
LTFXLOSSCAP instead of FXLOSS
CAP . For the selection equation, the coefficient on
98FXLOSSCAP is negative and significant at the 5% level, but the coefficient on
LTFXLOSSCAP is
insignificant. Thus, consistent with the results from the Probit equation, we find that short-term
international debt is significantly associated with firm failures (and interruptions in the report of
stock returns). For the return equation, by contrast, the coefficient on LTFXLOSS
CAP is negative
and significant at the 5% level, but the coefficient on 98FXLOSS
CAP is insignificant. Thus, even
though the long-term international debt is not subject to “sudden stops”, it still has a negative
impact on firm performance. This finding is consistent with the hypothesis that foreign-currency
liabilities affect firm value negatively in the event of an exchange rate depreciation (the “liability
dollarization” channel). Short-term international debt is relatively less important for firms that
survived the crisis. For the entire sample of 303 firms, foreign exchange losses from short-term
international debt are approximately 14% of initial equity; for the Type 1 firms, this number drops
to less than 6%. This observation may be the reason why we are unable to find a significant
relationship between short-term debt and crisis-period returns for these firms.
D. Balance Sheet Variables as Measures of Financial Performance
Instead of focusing on stock returns, this section uses a number of balance sheet variables
to measure financial performance, and examines if an intermediary’s international debt exposure
affects the growth rates of these variables over the crisis. Specifically, we use selection-corrected
models to examine the relationship between the growth rate (from financial year end 1996 to

18
financial year end 1998) of a balance sheet entry (BSE), and an intermediary’s foreign exchange
losses normalized by the 1996 level of the same BSE. All balance sheet entries are measured in US
dollars.
jj j j
j
FXLOSSBSE GROWTH X
BSEα β γ ε= + + + (3.5)
Again, there is a natural interpretation for the coefficient on FXLOSS when we normalize it by the
initial level of the dependent growth rate variable. Specifically, the coefficient β represents the
dollar change in the balance sheet entry associated with each extra dollar needed for international
debt repayment that occurs because of the currency depreciation. It is important to correct for
selection, as a significant fraction of the firms (including all Indonesian firms) in our sample do not
report their 1998 balance sheets in PACAP. As before, the selection equation takes a Probit form,
and includes the same dependent variables as the selection equation in model (3.4). To conserve
space, we do not report results from the selection equations.
The three balance sheet items we examine are the book value of equity, assets, and
liabilities. The book value of equity is a natural alternative to stock returns as a measure of financial
performance. Table 4, Column D[1] reports the maximum likelihood estimates of the coefficients
when we use this variable as the balance sheet entry. We find that the coefficient on foreign
exchange losses is significant at the 5% level. Note that the effect of international debt on the book
value is larger than its effect on the market value of equity (see the return equation on Table 3,
Column C[1]). Even at the 10% critical value, PAPERASSET is the only significant control
variable. We split FXLOSSEQUITY into a short-term debt and a long-term debt component. From
Column D[2], we see that the coefficients on the two components are insignificant, but are similar
in size to the coefficient on FXLOSSEQUITY in Column D[1].
The assets of financial intermediaries are of special interest, as they represent, to a
substantial extent, credit issued to the domestic economy. In Table 4, Column E[1] we report
selection-corrected estimates when the balance sheet entry is total assets. The coefficient on
FXLOSSASSET is significant at the 1% critical value. Moreover, the coefficient is above six (in
absolute value), indicating that each dollar in foreign exchange loss is associated with a decline in
assets of over six dollars. Because financial intermediaries are highly leveraged and each dollar of
capital backs up multiple assets, capital losses may result in a more-than-one-for-one contraction in
banks assets. Although the average foreign exchange loss due to international debt is smaller than
2% of assets, this multiplier process implies that these losses can be associated with declines in
assets that are much more substantial. Once again, we split the losses due to foreign exchange rate

19
exposure into 98FXLOSS
ASSET andLTFXLOSS
ASSET . We find that the effect of short-term
international debt exposure is much stronger than that of long-term exposure. From Column E[2],
we see that the multiplier on the short-term variable is above 20 (in absolute value) and is
significant at the 1% critical value.
Next, we use total liabilities as the balance sheet entry. We find that foreign exchange
losses due to international debt exposure are associated with contractions in liabilities, with a
multiplier of above 5 (see Column F[1]). We also find that short-term international debt exposure is
associated with a large and significant contraction in liabilities, while long-term international debt
exposure has a positive but insignificant relationship with the growth in liabilities (see Column
F[2]). An exchange rate depreciation has countervailing effects on the liabilities of intermediaries
with international debt. The depreciation increases the domestic currency value of foreign-
currency-denominated liabilities. Yet, the damage to the intermediaries’ balance sheets will lead
them to reduce their optimal level of leverage.
Turning our attention to the control variables, we find that both the assets and liabilities of
intermediaries with large asset bases and high financial valuations relative to book value shrank by
significantly less during the crisis. Intermediaries with high loan-to-asset ratios shrank by
significantly more. The hypothesis that the residuals from the BSE GROWTH equation and the
selection equation are uncorrelated is not rejected when the balance sheet entry is book equity, but
is strongly rejected (at the 1% critical value) when it is either assets or liabilities.
E. Pre-Crisis International Debt
Another question of interest is what causes international debt exposure to be so high in East
Asia prior to the crisis. A measure of financial intermediaries’ willingness or ability to borrow
internationally is the ratio of international debt to total liabilities. We find that the average share of
international debt to liabilities is relatively small; the average financial intermediary has
international debt of less than 4% of liabilities. We regress IDEBTLIABILITY on country dummies
and firm-specific variables, using a Tobit specification with a lower bound of zero on international
debt. The results in Table 4, Column G show that intermediaries with high leverage rely relatively
heavily on international debt. At the same time, large intermediaries seem better able (or more
willing) to access international debt markets; the coefficient on ln(ASSET) is significant at the 1%
level. Interestingly, intermediaries with high levels of loans as a share of assets have relatively low
levels of IDEBTLIABILITY . East Asia’s financial intermediaries may face a relatively weak
demand for foreign currency loans. As a result, financial intermediaries that try to avoid currency
mismatches between their assets and liabilities may have been reluctant to borrow in foreign
currencies to finance domestic currency loans.

20
Finally, we re-estimate the Tobit specification of stock returns reported in Table 3, Column
A[2], adding the ratio IDEBTLIABILITY as a proxy for those characteristics that cause an
intermediary to borrow heavily in international debt markets. The results in Table 4, Column H
show that even after we control these characteristics, foreign exchange losses are still associated
with negative returns. In fact, the coefficient on FXLOSSCAP becomes even larger after these
characteristics are controlled for.
IV Conclusion
We can summarize our findings as follows. First, foreign exchange losses stemming from
international debt exposure were strongly associated with negative stock returns during the Asian
financial crisis, even after controlling for other risk factors. Second, each dollar of foreign exchange
losses was associated with losses in equity value that are substantially less than one dollar. Third,
short-term international debt was associated with the probability of bankruptcy, and long-term
international debt was associated with the negative returns of the firms that survived. Fourth,
international-debt-induced foreign exchange losses were associated with contractions in the assets
of financial intermediaries, and the magnitude of the contractions was a large multiple of the size of
the foreign exchange losses. Finally, such contractions in assets were most closely associated with
short-term international debt exposure.
Our results stress the importance of examining, both jointly and separately, the impact of
firm-level variables on the probability of failure during financial crises, and on the performance of
companies that survive. Variables often affect the likelihood of bankruptcy in different ways than
they affect the returns of surviving firms. For example, we find that intermediaries with high
market-to-book values prior to the Asian crisis were less likely to go bankrupt, but had significantly
lower returns if they survived.
The issuance of short-term international debt by East Asian intermediaries in the mid-1990s
is strongly associated with the wave of bankruptcies observed in the region, and with the sharp
slowdown in intermediation that occurred during the crisis. This observation alone cannot prove
that the crisis was caused by an exogenous stop in capital flows into East Asia from international
markets. It does indicate, however, that the effects of the crisis were exacerbated by short-term
borrowing. We also interpret the strong association between long-term international debt and the
negative stock returns of non-bankrupted intermediaries to indicate that some properties of
international debt beyond its short-term volatile nature affect its issuers in negative ways. One
obvious property of international debt in this regard is the fact that it is issued in foreign currencies,

21
and can adversely affect firm value following an exchange rate depreciation. Mendoza (2001)
offers a theoretical model in which foreign currency debt exacerbates the effects of international
financial panics.

22
References Aghion, P., P. Bacchetta and A. Banerjee, 2000, “A Simple Model of Monetary Policy and Currency Crises,” European Economic Review 44, 728-38. Aghion, P., P. Bacchetta and A. Banerjee, 2001, “Currency Crises and Monetary Policy in an Economy with Credit Constraints,” European Economic Review 45, 1121-50. Aguiar, M., 2002, “Investment, Devaluation, and Foreign Currency Exposure: The Case of Mexico,” Mimeo. University of Chicago. Allayannis, G., G.W. Brown and L.F. Klapper, 2003, “Capital Structure and Financial Risk: Evidence from Foreign Debt Use in East Asia,” Journal of Finance 58, 2667-2709. Allen, F. and D. Gale, 2000, “Optimal Currency Crises,” Carnegie-Rochester Conference Series on Public Policy 53, 177-230. Arteta, C.Ó., 2003, “Are Financially Dollarized Countries More Prone to Costly Crises?” Board of Governors of the Federal Reserve System International Finance Discussion Papers No. 763. Bleakley, H. and K. Cowan, 2002, “Corporate Dollar Debt and Devaluations: Much Ado About Nothing?” Mimeo. MIT. Bongini, P., S. Claessens, and G. Ferri, 2001, “The Political Economy of Distress in East Asian Financial Institutions,” Journal of Financial Services Research 19, 5-25. Bongini, P., G. Ferri, and T.S. Kang, 2000, “Financial Intermediary Distress in the Republic of Korea: Small is Beautiful,” World Bank Working Paper. Bris, A. and Y. Koskinen, 2002, “Corporate Leverage and Currency Crises,” Journal of Financial Economics 63, 275-310. Bris, A., Y. Koskinen, and V. Pons, 2002, “Corporate Financial Policies and Performance Around Currency Crises,” Journal of Business, forthcoming. Burnside, A.C., M. Eichenbaum, and S. Rebelo, 2001, “Hedging and Financial Fragility in Fixed Exchange Rate Regimes,” European Economic Review 45, 1151-93. Caballero, R. J. and A. Krishnamurthy, 2003, “Excessive Dollar Debt: Financial Development and Underinsurance,” Journal of Finance 58, 867-893. Calvo, G.A., 1998, “Capital Flows and Capital-Market Crises: The Simple Economics of Sudden Stops,” Journal of Applied Economics 1, 35-54. Calvo, G.A. and E.G. Mendoza, 2000, “Rational Contagion and the Globalization of Securities Markets,” Journal of International Economics 51, 79-113. Calvo, G.A. and C. Reinhart, 1999, “When Capital Flows Come to a Sudden Stop: Consequences and Policy Options,” Mimeo. University of Maryland. Céspedes, L.F., R. Chang, and A. Velasco, 2000, "Balance Sheets and Exchange Rate Policy," NBER Working Paper No. 7840.

23
Choi, W.G. and D. Cook, 2002, “Liability Dollarization and the Bank Balance Sheet Channel,” Journal of International Economics, forthcoming. Christiano, L.J., C. Gust, and J. Roldos, 2002, “Monetary Policy in a Financial Crisis,” NBER Working Paper No. 9005. Claessens, S., S. Djankov, and L.C. Xu, 2000, “East Asian Corporations, Before and During the Recent Financial Crisis,” World Bank Research Observer 15, 23–46. Claessens, S., D. Klingebiel, and L. Laeven, 2001, “Financial Restructuring in Banking and Corporate Sector Crises: What Policies to Pursue?” NBER Working Paper No. 8386. Cook, D., 2000, “Liability Dollarization and Stability: Monetary Policy and Foreign Currency Debt," Mimeo. Hong Kong University of Science and Technology. Cook, D. and M.B. Devereux, 2001, “Macroeconomic Effects of International Financial Panics.” Mimeo. Hong Kong University of Science and Technology. Devereux, M.B. and P. Lane, 2000, “Exchange Rate Flexibility and Monetary Policy Choices for Emerging Market Economies,” Hong Kong Institute for Monetary Research Working Paper. Dooley, M.P. and I. Shin, 2000, “Private Inflows When Crises are Anticipated: A Case Study of Korea,” NBER Working Paper No. 7992. Echeverry, J.C., L. Fergusson, R. Steiner, and C. Aguilar, 2003, “Dollar Debt in Colombian Firms: Are Sinners Punished During Devaluations?” Emerging Markets Review 4, 417-449. Eichengreen, B. and R. Hausmann, 1999, “Exchange Rates and Financial Fragility,” NBER Working Paper No. 7418. Fin, T. and P. Schmidt, 1984, “A Test of the Tobit Specification Against an Alternative Suggested by Cragg,” Review of Economics and Statistics 66, 174-177. Forbes, K.J., 2002, “How Do Large Depreciations Affect Firm Performance?” IMF Staff Papers 49, 214-38. Galindo, A., U. Panizza, and F. Schiantarelli, 2003, “Debt Composition and Balance Sheet Effects of Currency Depreciation: A Summary of the Micro Evidence” Emerging Markets Review 4, 330-339. Glick, R. and M. Hutchison, 1999, “Banking and Currency Crises: How Common are the Twins?” Mimeo. Federal Reserve Bank of San Francisco. Harvey, C. and A. Roper, 1999, “The Asian Bet,” in A. Harwood, R. Litan, and M. Pomerleano eds. The Crisis in Emerging Financial Markets, Brookings Institution Press, Washington DC. Heckman, J.J., 1979, “Sample Selection Bias as a Specification Error,” Econometrica 47, 153–161. Ize, A. and E. Levy-Yeyati, 2003, “Financial Dollarization,” Journal of International Economics 59, 323–347.

24
Jeanne, O. and C. Wyplosz, 2003, “The International Lender of Last Resort: How Large is Large Enough?”, in M.P. Dooley and J.A. Frankel eds. Managing Currency Crises in Emerging Markets, University of Chicago Press, Chicago. Kho, B.C. and R.M. Stulz, 2000, “Banks, the IMF, and the Asian Crisis.” Pacific Basin Finance Journal 8, 177–216. Krueger, A. and J. Yoo, 2002, “Chaebol Capitalism and the Currency-Financial Crisis in Korea” in S. Edwards and J.A. Frankel, eds. Preventing Currency Crises in Emerging Markets, University of Chicago Press, Chicago. Luengnaruemitchai, P., 2003, “The Asian Crisis and the Mystery of the Missing Balance Sheet Effect,” Mimeo. UC-Berkeley. Mendoza, E.G., 2001, “Credit, Prices, and Crashes: Business Cycles with a Sudden Stop,” NBER Working Paper No. 8338.

25
Figure 1. Financial Debt Flows to Asia’s Financial Intermediaries The figure shows, at the country level, annual time series of the face value of new foreign-currency debt issued in international markets by Asia’s financial intermediaries.
0
2000
4000
6000
8000
10000
90 91 92 93 94 95 96 97 98 99
Milli
ons
US
Dol
lars
Indonesia
0
4000
8000
12000
16000
20000
24000
28000
32000
36000
90 91 92 93 94 95 96 97 98 99
Milli
ons
US
Dol
lars
Korea
0
1000
2000
3000
4000
90 91 92 93 94 95 96 97 98 99
Milli
ons
US
Dol
lars
Malaysia
0
400
800
1200
1600
2000
90 91 92 93 94 95 96 97 98 99
Taiwan
Milli
ons
US
Dol
lars
0
2000
4000
6000
8000
10000
12000
90 91 92 93 94 95 96 97 98 99
Thailand
Milli
ons
US
Dol
llars
Foreign Debt Flows to Financial Institutions

26
Table 1. Aggregate Descriptive Statistics Panel A reports the country-level, annualized depreciation rate relative to the US dollar (DEPR), and the annualized return on the stock market index (MKTR). Panel B reports sample means and standard deviations for some control variables from firms’ 1996 balance sheets. It includes leverage (the ratio of liabilities to assets, LIABILITY/ASSET), market valuation (the ratio of the sum of market capitalization plus liabilities to book assets, VALUE/ASSET), and the riskiness of assets (the ratio of loans to assets, LOAN/ASSET and securities to assets, PAPER/ASSET), and stock market turnover (TURNOVER). Panel C reports the US dollar value of market capitalization (CAP), and three balance sheet entries (BSEs), i.e., the book value of equity, assets, and liabilities, on the 1996 balance sheets and their subsequent annualized growth rates over 1997 and 1998. We also report the size of foreign exchange losses due to total, short-term, and long-term international debt relative to each of the BSEs. Panel A Panel B
COUNTRY VARIABLES
CONTROLS DEPR MKTR Mean
(S D)
Indonesia 1.51 -0.313 LIABILITY
ASSET0.803 (.20)
Korea 0.236 -0.101 VALUE
ASSET 1.101 (.43)
Malaysia 0.335 -0.369 LOAN
ASSET 0.489 (.28)
Taiwan 0.101 -0.211 PAPER
ASSET 0.278 (.24)
Thailand 0.268 -0.275 TURNOVER 0.083
(.08) Panel C Balance Sheet Entry (BSE)
Growth Rate
Level (in US$ millions)
FXLOSSBSE
98FXLOSS
BSE
LTFXLOSSBSE
Mean (S D))
CAP -0.116 (.64)
US$215.08 (822.31)
0.26 (.62)
0.205 (.67)
0.180 (.44)
EQUITY -0.037 (.44)
US$352.03 (514.73)
0.150 (.47)
0.061 (.17)
0.089 (.35)
ASSET 0.000 (.31)
US$4,531.47 (8906.26)
0.017 (.06)
0.006 (.02)
0.010 (.05)
LIABILITY 0.009 (.35)
US$4,181.19 (8447.03)
0.020 (.08)
0.007 (.02)
0.013 (.07)

27
Table 2. Sector-Level Descriptive Statistics This table shows sample means for stock returns and outstanding international debt broken down by country and sector. The variables are the number of intermediaries in each country and sector (N), the percentage of intermediaries that have positive levels of international debt, the average percentage of debt that came due during the crisis period for those firms which had positive international debt ( 98IDEBT
IDEBT), the average amount (in
millions of US dollars) of outstanding international debt (IDEBT), the foreign exchange losses relative to pre-crisis market capitalization ( FXLOSS
CAP), the annualized return over the period July, 1997 to December, 1998
(RETURN), and the percentage of intermediaries that failed during the crisis (FAIL).
Averages:
N % with IDEBT>0
98IDEBTIDEBT
IDEBT (US$ Million.)
FXLOSSCAP
RETURN FAIL
Indonesia 37 57% 41% $44 0.37 -0.69 20% Banking 22 77% 43% $52 0.43 -0.69 16% Insurance 8 0% . $0 0.00 -0.61 4% Securities 5 60% 15% $67 0.77 -0.73 23% Other 2 50% 86% $73 0.09 -0.61 31% Korea 103 43% 23% $207 0.16 -0.08 17% Banking 23 83% 19% $665 0.20 -0.35 9% Insurance 12 0% . $0 0.00 -0.25 0% Securities 33 18% 32% $14 0.05 0.32 30% Other 35 54% 25% $158 0.30 -0.15 14% Malaysia 52 13% 22% $25 0.00 -0.47 4% Banking 15 40% 9% $80 0.01 -0.45 0% Insurance 9 0% . $0 0.00 -0.39 0% Securities 1 0% . $0 0.00 -0.49 0% Other 27 4% 100% $3 0.00 -0.51 7% Taiwan 25 8% 0% $17 0.00 -0.33 0% Banking 13 15% 0% $32 0.00 -0.37 0% Insurance 7 0% . $0 0.00 -0.29 0% Securities 2 0% . $0 0.00 -0.30 0% Other 3 0% . $0 0.00 -0.27 0% Thailand 86 59% 54% $ 162 0.55 -0.08 40% Banking 14 100% 42% $625 0.32 -0.35 36% Insurance 21 0% . $0 0.00 -0.05 0% Securities 3 67% 100% $36 0.11 0.15 0% Other 48 73% 57% $105 0.89 0.03 60% Total 303 41% 39% $127 0.26 -0.27 20% Banking 87 67% 30% $308 0.22 -0.45 16% Insurance 57 0% . $0 0.00 -0.25 4% Securities 44 25% 40% $21 0.13 0.01 23% Other 115 49% 47% $94 0.46 -0.25 31%

28
Table 3. Financial Performance: Part I This table reports the coefficient estimates and standard errors from three specifications: a) a Tobit model of stock returns, R, treating failed intermediaries as a corner outcome, R = -1; b) a Probit model of the probability that a financial intermediary would fail; and c) a selection-corrected model of the stock returns of surviving intermediaries. Each regression includes either foreign exchange losses relative to market capitalization ( FXLOSS
CAP), or the foreign exchange losses due to short-term
and long-term debt ( 98FXLOSSCAP
and LTFXLOSSCAP
). Additional control variables include liabilities to assets
( LIABILITYASSET
), financial value relative to assets (VALUEASSET
), loans to assets ( LOANASSET
), securities to assets
( PAPERASSET
), (logged) asset size (ln(ASSET)), and average monthly value of stocks traded relative to market cap
(TURNOVER). Significant coefficients at the 1%, 5%, and 10% levels are marked with ♠, ♥, and ♦ respectively.
Model [A] Tobit [B] Probit [C] Selection Corrected Dependent Variable
RETURN FAIL Select RETURN Select RETURN
[1] [2] [3] [1] [2] [1] [2]
FXLOSS
CAP
-0.554♠ (0.114)
-0.336♠ (.107)
0.338♥ (.162)
-0.539♠ (.190)
-0.296♠ (.110)
98FXLOSS
CAP
-0.316♥(.159)
0.806♥ (.341) -0.751♥
(.360) -0.084 (.180)
LTFXLOSS
CAP
-0.361♦(.186)
-0.177 (.336)
-0.384 (.350)
-0.355♥ (.170)
LIABILITY
ASSET
-1.416♠ (.281)
-1.413♠ (.281)
2.144♥ (.925)
2.193♥ (.926)
-1.438♠ (.480)
-1.396♠ (.260)
-1.726♠ (.510)
-1.319♠ (.250)
VALUE
ASSET
-0.265♠ (.101)
-0.264♠ (.101)
-1.613♥ (.759)
-1.509♥ (.758)
-0.225 (.160)
-0.229♥ (.090)
-0.090 (.280)
-0.250♠ (.090)
LOAN
ASSET
-0.552♥ (.225)
-0.558♥ (.228)
3.163♠ (.817)
3.038♠ (.822)
-0.979♠ (.370)
-0.465♥ (.220)
-1.089♥ (.480)
-0.390 (.200)
PAPER
ASSET
-0.142 (.261)
-0.143 (.261)
2.322♠ (.890)
2.245♥ (.893)
0.198 (.490)
-0.104 (.240)
-0.122 (.520)
-0.004 (.230)
ln(ASSET) 0.049
(.033) 0.049 (.033)
-0.132♦ (.082)
-0.135♦ (.082)
0.263♠ (.050)
0.091♠ (.030)
0.302♠ (.060)
0.076♠ (.030)
TURNOVER -1.010♦
(.605) -1.015♦ (.605)
0.281 (1.586)
0.072 (1.615)
0.881 (1.670)
-0.891 (.600)
0.382 (1.420)
-0.806 (.570)
MKTR 1.512
(1.574) 1.795
(1.591) -0.763
(1.140) -1.024 (1.190)
DEPR
0.190 (.167)
0.229 (.168)
-0.351♠ (.120) -0.333♥
(.130)
N 267 267 267 303 303 303 205/303 303 205/303

29
Table 4. Financial Performance: Part II Columns [D]–[F] report selection-corrected coefficient estimates and standard errors from models of the growth rates of three balance sheet entries (BSEs); the BSEs are book value of EQUITY, ASSETS, and LIABILITIES. The control variables include foreign exchange losses relative to market capitalization
( FXLOSSCAP
), or the foreign exchange losses due to short-term and long-term debt (98FXLOSS
CAP and
LTFXLOSSCAP
). Additional control variables
include liabilities to assets ( LIABILITYASSET
), financial value relative to assets (VALUEASSET
), loans to assets ( LOANASSET
), securities to assets
( PAPERASSET
), (logged) asset size (ln(ASSET)), and average monthly value of stocks traded relative to market cap (TURNOVER). Column [G] reports a
Tobit regression of the determinants of the share of an intermediary’s liabilities that is international debt ( IDEBTLIABILITY
). Column [H] reports a Tobit model
of returns similar to Table 3, Column A[2], but also controls for IDEBTLIABILITY
. Significant coefficients at the 1%, 5%, and 10% level are marked with ♠, ♥,
and ♦
respectively. Annualized Growth Rate of Balance Sheet Entry 1996-1998: Tobit Dependent Variable [D] EQUITY [E] ASSET [F] LIABILITY
[G] IDEBT
LIABILITY
[H]RETURN
[1] [2] [1] [2] [1] [2]
FXLOSSBSE -0.576♥
(.290) -6.384♠ (2.300)
-5.268♠ (1.750)
-0.490♠ (.160)
98FXLOSSBSE -0.523
(.870) -21.544♠
(4.030) -18.072♠
(3.440) LTFXLOSS
BSE -0.544 (.440)
-1.682 (2.850)
0.311 (2.410)
LIABILITYASSET
0.247 (.240)
0.267 (.240)
-0.169 (.160)
-0.191 (.170)
-0.235 (.170)
-0.249 (.170)
0.396♠ (.099)
-1.445♠ (.280)
VALUEASSET
0.174 (.120)
0.176 (.120)
0.292♠ (.070)
0.378♠ (.080)
0.445♠ (.080)
0.483♠ (.080)
-0.263♠ (.100)
LOANASSET
0.040 (.200)
0.062 (.200)
-0.530♠ (.160)
-0.640♠ (.130)
-0.508♠ (.140)
-0.527♠ (.140)
-0.198♠ (.062)
-0.501♥ (.230)
PAPERASSET
0.429♦ (.230)
0.438♦ (.230)
-0.130 (.170)
-0.077 (.170)
-0.184 (.170)
-0.035 (.180)
0.066 (.064)
-0.171 (.260)
ln( )ASSET 0.005 (.030)
0.003 (.030)
0.073♠ (.020)
0.105♠ (.020)
0.081♠ (.020)
0.108♠ (.020)
0.041♠ (.009)
0.048 (.030)
TURNOVER -0.713 (.470)
-0.713 (.480)
-0.042 (.330)
0.329 (.350)
-0.024 (.360)
0.376 (.380)
-0.015 (.171)
-1.012♦ (.610)
IDEBTLIABILITY
1.018
(.700) N 181/266 181/266 195/266 195/266 194/266 194/266 303 267