suds design criteria for catchment flood protection are ... · pdf file29th march 2017 suds...
TRANSCRIPT
29th March 2017
SuDS design criteria for catchment flood protection
Are current criteria appropriate?
Richard Kellagher
© HR Wallingford 2016
SuDS
29th March 2017
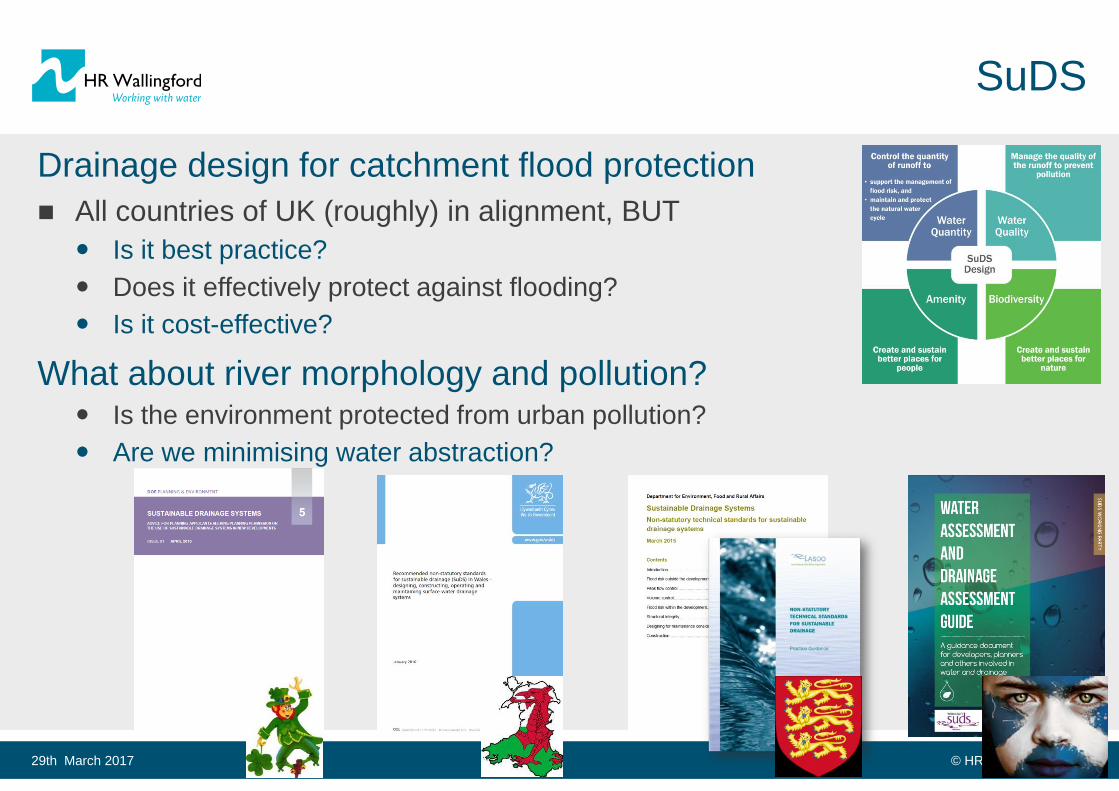
Drainage design for catchment flood protection
All countries of UK (roughly) in alignment, BUT
Is it best practice?
Does it effectively protect against flooding?
Is it cost-effective?
What about river morphology and pollution? Is the environment protected from urban pollution?
Are we minimising water abstraction?
© HR Wallingford 2016
Current practice
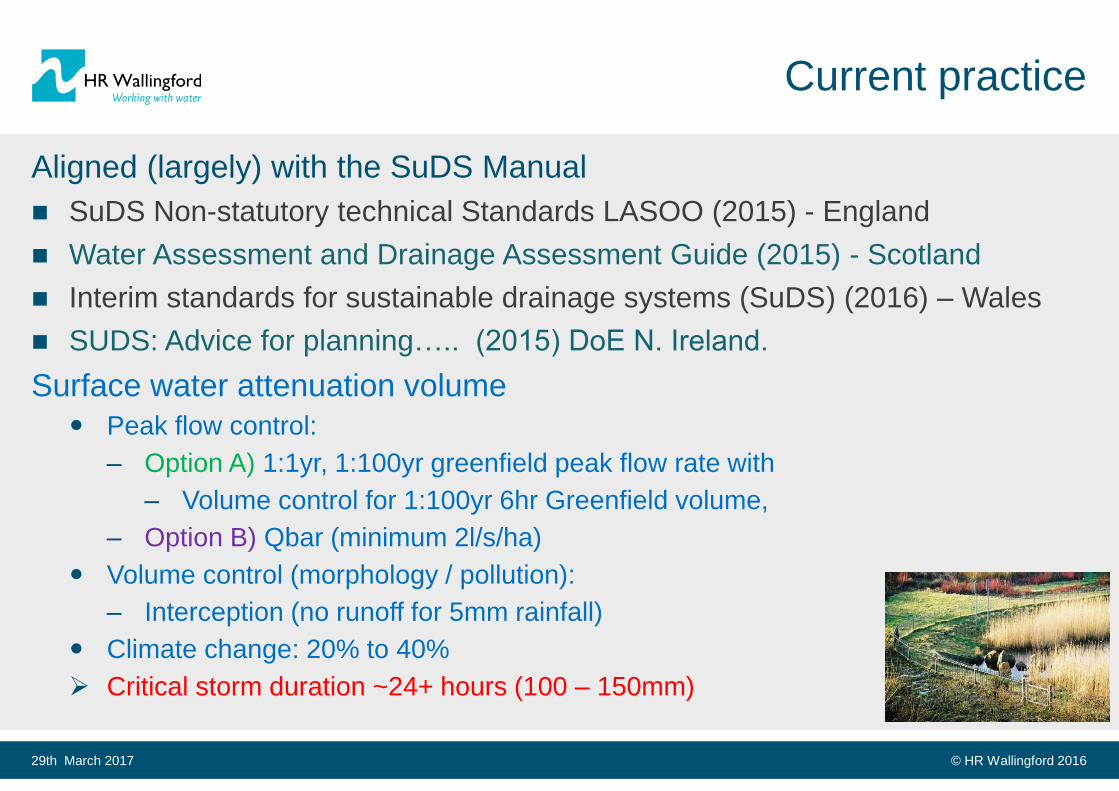
Aligned (largely) with the SuDS Manual
SuDS Non-statutory technical Standards LASOO (2015) - England
Water Assessment and Drainage Assessment Guide (2015) - Scotland
Interim standards for sustainable drainage systems (SuDS) (2016) – Wales
SUDS: Advice for planning….. (2015) DoE N. Ireland.
Surface water attenuation volume
Peak flow control:
– Option A) 1:1yr, 1:100yr greenfield peak flow rate with
– Volume control for 1:100yr 6hr Greenfield volume,
– Option B) Qbar (minimum 2l/s/ha)
Volume control (morphology / pollution):
– Interception (no runoff for 5mm rainfall)
Climate change: 20% to 40%
Critical storm duration ~24+ hours (100 – 150mm)
29th March 2017
© HR Wallingford 2016
Cost overview
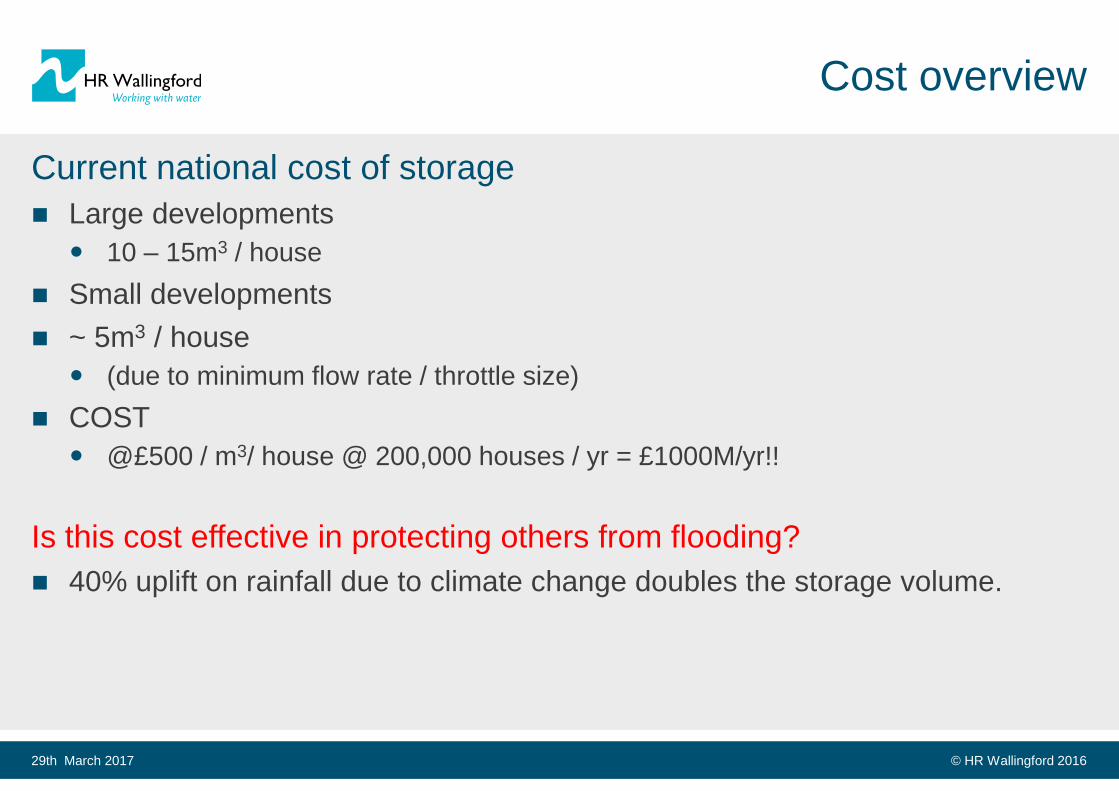
Current national cost of storage
Large developments
10 – 15m3 / house
Small developments
~ 5m3 / house
(due to minimum flow rate / throttle size)
COST
@£500 / m3/ house @ 200,000 houses / yr = £1000M/yr!!
Is this cost effective in protecting others from flooding?
40% uplift on rainfall due to climate change doubles the storage volume.
29th March 2017
© HR Wallingford 2016
So what’s wrong?
But if we are all agreed as to what we should do, why rock the boat?
Are there inconsistencies in current design practice?
What are the opportunities for improvement to this procedure?
What obstacles are in the way of change?
Our challenge is to exist in harmony with the natural environment by:
Minimise eco-system impact
Minimise resource consumption
But we must also focus on:
Effective flood risk mitigation
At minimum cost
29th March 2017
© HR Wallingford 2016
Greenfield runoff measurements
FSR / FEH / ReFH
River-based analysis
ReFH2 current research
Plot scale and urbanised catchments
Limited details available
ADAS 345 (MAFF 5) / Prudhoe and Young (LR565) and others
Field drainage / Small catchments
Event duration based on site Gradient, Soil and Area
Rodda & Hawkins
Testing greenfield runoff estimation techniques using high resolution field
observations
Journal of flood risk management (2012)
29th March 2017
3 Approved methods
for planning
© HR Wallingford 2016
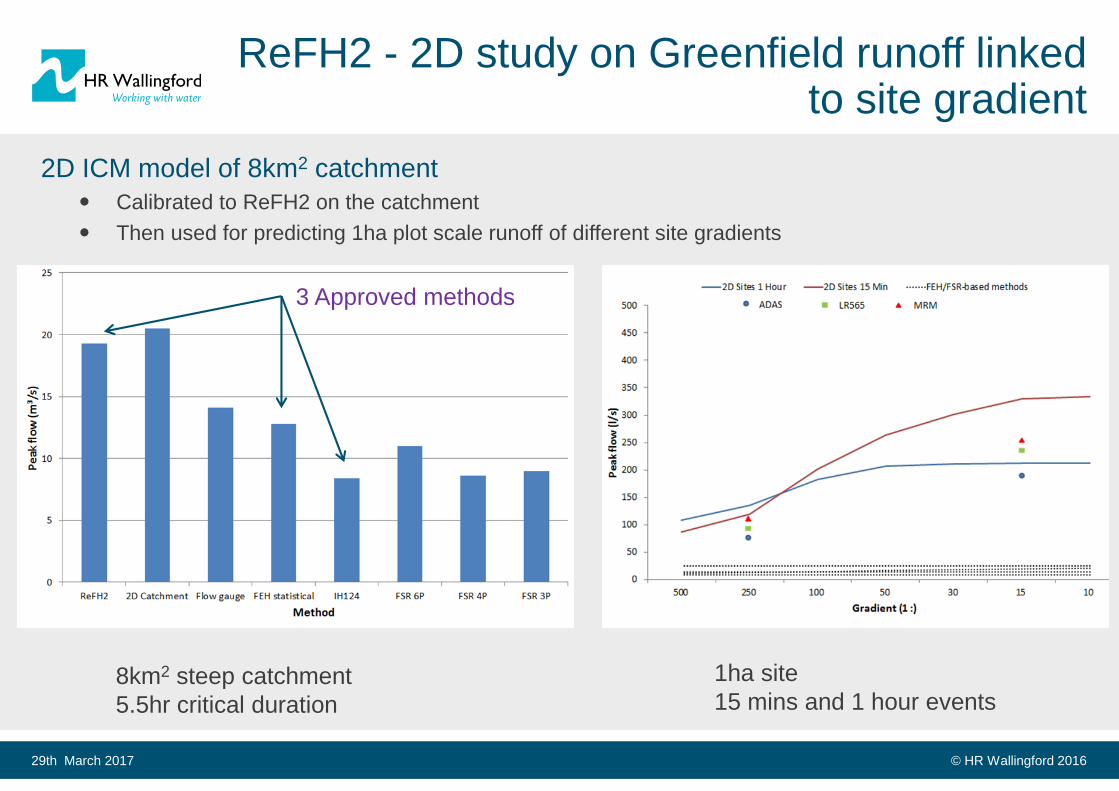
ReFH2 - 2D study on Greenfield runoff linked to site gradient
29th March 2017
8km2 steep catchment
5.5hr critical duration
1ha site
15 mins and 1 hour events
2D ICM model of 8km2 catchment
Calibrated to ReFH2 on the catchment
Then used for predicting 1ha plot scale runoff of different site gradients
3 Approved methods
© HR Wallingford 2016
Rodda & Hawkins
Rowden drainage experiment
Fourteen 1 ha plots monitored 9/2006 – 12/2008
5 – 10% gradient
Clayey catchment
IH124 predicted 1:100 yr peak flow of 18.9l/s
– exceeded by 6 of the largest 10 peak flow events
ADAS 345 predicted 1:100 yr peak flow of 69.2l/s
– exceeded by 2 of the largest 10 peak flow events
Conclusion
Greenfield runoff rates used for planning are all (probably) wrong
HOWEVER - using a much faster greenfield runoff rate is not necessarily
appropriate for protecting downstream areas.
29th March 2017
© HR Wallingford 2016
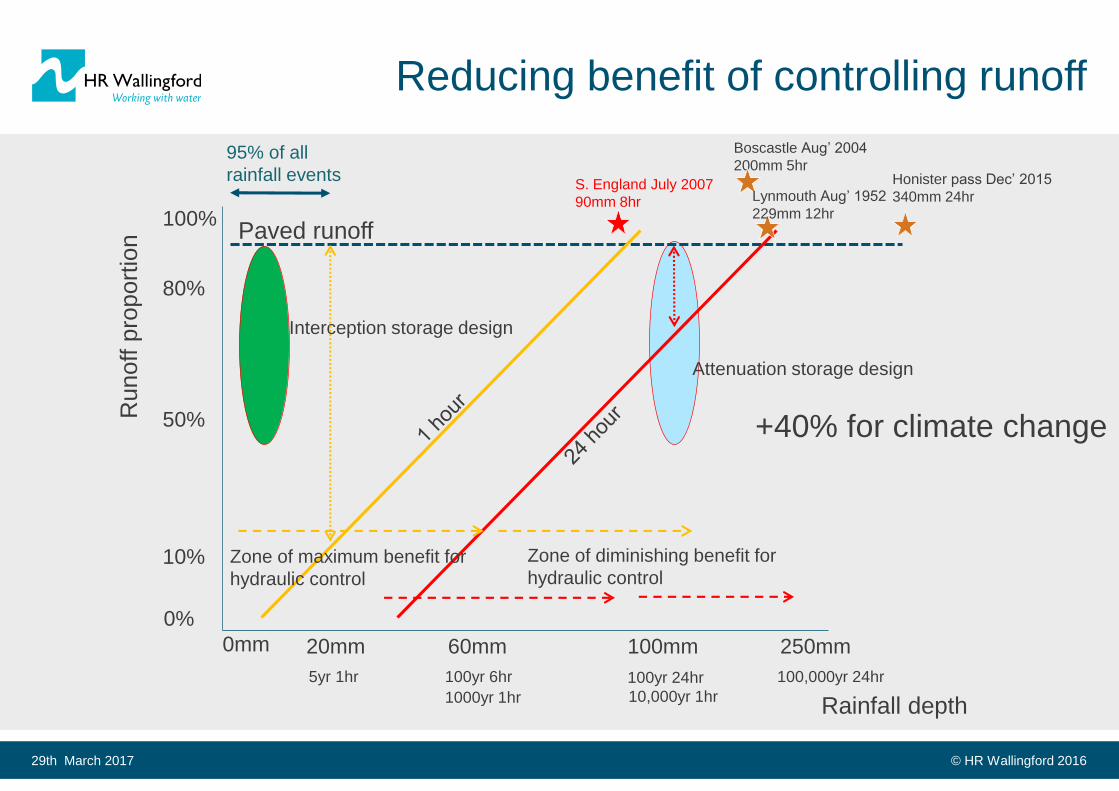
Reducing benefit of controlling runoff
29th March 2017
Runoff p
roport
ion
100%
10%
0%
50%
Rainfall depth
100mm 250mm20mm0mm 60mm
100yr 6hr5yr 1hr 100yr 24hr 100,000yr 24hr
Paved runoff
80%
10,000yr 1hr1000yr 1hr
Attenuation storage design
Interception storage design
Zone of diminishing benefit for
hydraulic controlZone of maximum benefit for
hydraulic control
+40% for climate change
Honister pass Dec’ 2015
340mm 24hr
Boscastle Aug’ 2004
200mm 5hr
Lynmouth Aug’ 1952
229mm 12hr
S. England July 2007
90mm 8hr
95% of all
rainfall events
© HR Wallingford 2016
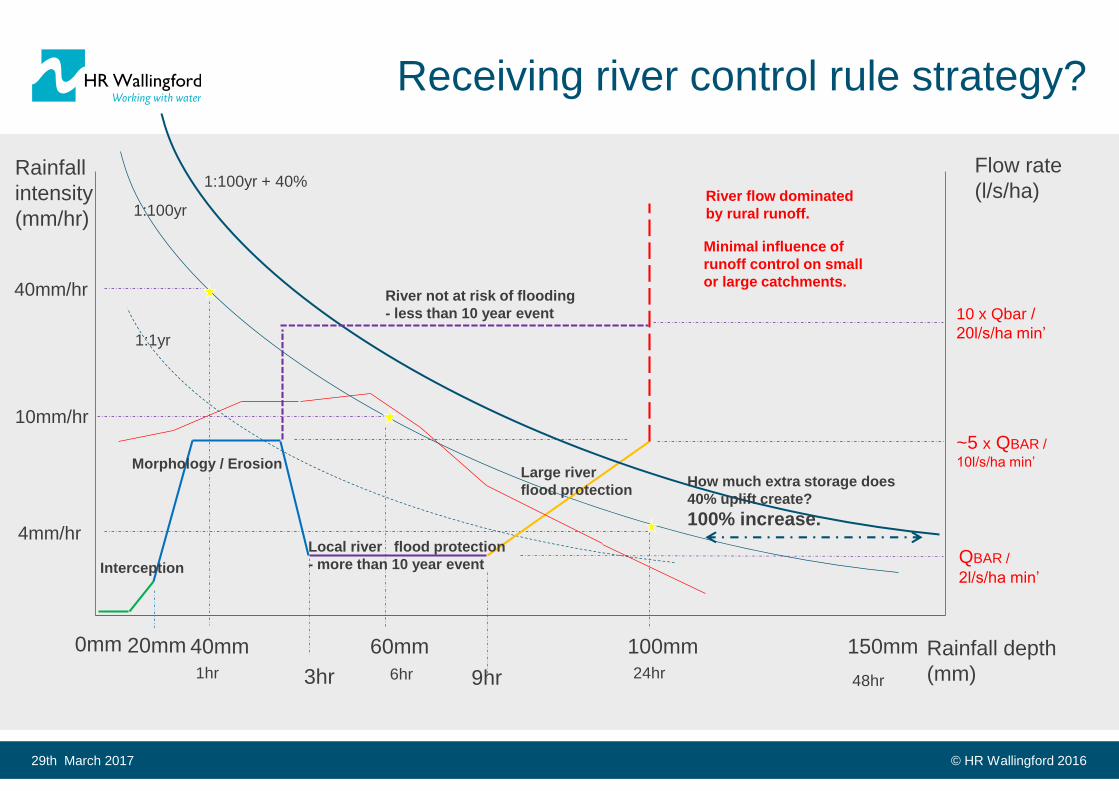
Receiving river control rule strategy?
29th March 2017
Rainfall
intensity
(mm/hr)
Flow rate
(l/s/ha)
Rainfall depth
(mm)
100mm 150mm40mm0mm 60mm
10mm/hr
4mm/hr
6hr 24hr
1:100yr
1:1yr
3hr 48hr9hr
1:100yr + 40%
QBAR /
2l/s/ha min’
~5 x QBAR /
10l/s/ha min’
10 x Qbar /
20l/s/ha min’
Interception
Morphology / Erosion
Local river flood protection
- more than 10 year event
Large river
flood protection
River flow dominated
by rural runoff.
Minimal influence of
runoff control on small
or large catchments.
How much extra storage does
40% uplift create?
100% increase.
River not at risk of flooding
- less than 10 year event
40mm/hr
1hr
20mm
© HR Wallingford 2016
Weaknesses of current approach
There are three “approved” methods for setting limiting discharge rates
FSR, FEH and ReFH2
Discharges are not focused at catchment specific requirements.
Perhaps 90% of developments will be discharging to small streams / rivers
No account is taken of diminishing proportion of additional runoff for extreme
long duration events and catchments in flood from rural runoff
There is little interest (yet) in applying volumetric rules on runoff
Flooding
Morphology
Pollution prevention
Technology has yet to be used to obtain efficiencies in reducing storage
volumes.
29th March 2017

© HR Wallingford 2016
Questions?
29th March 2017