suffolk’s harvest mice in focus - suffolkwildlifetrust.org · the overall aim of this project is...
TRANSCRIPT
Report to: PTES and The Chadacre Trust
Martha Meek
Suffolk Wildlife Trust
2009-2011
Suffolk’s Harvest
Mice in Focus
Credit: Terry Longley seeing.org.uk

1 Suffolk‟s Harvest Mice in Focus
Suffolk Wildlife Trust 2011
Report to PTES.
4081 pellets were analysed from 226 sites
35% of the sites contained harvest mouse remains
Harvest mice were found to make up 1.5% of the barn owl’s
prey
Field visits found harvest mice nests at 85% of all sites where
they had been reported in owl pellets from that locality
Harvest mouse nests were also found at 74% of sites where
they had not been found in owl pellets from that area
Nests were found in a range of habitats including arable field
margins, rough grassland, riversides and other wetland sites
Of the ten different habitat types where nests were found, six
were associated with water/wetland
It was notable that harvest mice were found to be nesting in
wild bird/game cover crops, particularly those containing
millet
Connectivity in the landscape has more influence than habitat
type on the number of nests being found, with very well
connected sites having the highest number of nests per site
Well connected sites are often associated with estuaries, fens
and grazing marshes, where there is extensive areas of suitable
habitat
Harvest mice are widespread in Suffolk, only completely absent
in very intensively farmed landscapes with no tall grass
margins
Barn owls were only reliable in detecting harvest mice where
the pellet sample size was 40 or more
If good harvest mouse habitat can be identified, nest searching
is the preferable option for a surveyor
A predictive model for finding harvest mice nests has been
developed based on the findings of this study
2 Suffolk‟s Harvest Mice in Focus
Suffolk Wildlife Trust 2011
Report to PTES.
Introduction Pg. 3
The history of the harvest mouse in Britain
Past studies on harvest mice in East Anglia
Pellets as evidence of harvest mice
Project Aims
Methodology ` Pg. 6 Pellet collection
Pellet analysis
Site selection
Site visits
Data collection & analysis
Results Pg. 14 Results from pellet analysis
Results from site visits
Wild bird and game cover crops as harvest mouse habitat
Discussion Pg. 27 Using barn owls to find harvest mice
Searching for harvest mice nests
The harvest mouse and waterside habitat
The harvest mouse in a farmed landscape
Habitat connectivity is critical
Adapting to a modern farmed landscape
Managing habitat for harvest mice
Conclusion Pg. 36 The future for harvest mice in Suffolk
Conservation of the harvest mouse:
using what has been learnt for the future
Project limitations and variables
References Pg. 39
Appendix Pg. 41 Other project outcomes
Full data sets for figures 15-18
Acknowledgements
Pellet collection sheet
Pellet recording sheet
Nest search form
Map sample
Newsletters
General factsheet
Farmland factsheet
(no page numbers for items in italics)

3 Suffolk‟s Harvest Mice in Focus
Suffolk Wildlife Trust 2011
Report to PTES.
The history of the harvest mouse in Britain The harvest mouse Micromys minutus has always been associated with lowland arable
landscapes, commonly portrayed sitting on an ear of wheat. This image is so common
yet evidence now suggests it is far from true, with the harvest mouse more likely to be
found in a reedbed than a field of wheat.
The species was first described by the naturalist
Gilbert White in Hampshire in 1767, “From the
colour, shape, size and manner of nesting, I
make no doubt but that the species is
nondescript. They are much smaller and more
slender and have more of the squirrel or
dormouse colour. They never enter into houses;
are carried into ricks and barns with the
sheaves; abound in harvest, and build their nests
amidst the straws of the corn above the ground,
and sometimes in thistles.” (White, 1767).
Harvest Mice with nest in wheat as illustrated in 1900s Credit: George Abbey, 1909
The abundance of harvest mice at harvest time, as described by White, did not appear
to change until the 1950s. Many articles were written in the 1950s about harvest mice
overwintering in large numbers in straw stacks both in Hampshire and Oxford
(Southwick, 1956; Rowe, 1958; Rowe & Taylor, 1964). Anecdotal evidence from
Suffolk farmers who were working in the fields in the 1950s also suggest that it was
common to see harvest mice both in the field at harvest and in stacks at threshing
time.
It was not until the widespread introduction of the combine harvester in the
late 1950s, that major changes at harvest time were seen. Whole fields began to be
cleared in a matter of hours leaving no refuge for small mammals and straw stacks as
winter refuges were lost. The harvest mouse was no longer commonly seen at harvest
or threshing time and many believed it to be disappearing from our countryside. This
perceived decline and lack of surveying continued until 1973 when the Mammal
Society commissioned a detailed survey into the status and distribution of the harvest
mouse. Over 1000 individual records, mainly of breeding nests, were gathered. These
records were concentrated along the east coast, south of Yorkshire and across the
southern counties and the south coast, being more sparsely distributed in the west

4 Suffolk‟s Harvest Mice in Focus
Suffolk Wildlife Trust 2011
Report to PTES.
country. Records were very sparse in Wales and limited to a few scattered records in
Scotland. They were considered to be a common species in all of East and South
Britain (Harris, 1979).
This survey was repeated in 1996-97 to assess for changes in range, 300 of the
same 800 sites were visited but only 30% were found to contain harvest mouse nests
(Battersby, 2005). This evidence led to the harvest mouse being classified a
Biodiversity Action Plan Species due to the apparent 70% decline. A survey by
WildCRU at Oxford University also found a steep decline from 2004 to 2007 in
numbers of harvest mice in a lowland arable landscape in the Thames valley (Riorden
et al, 2007). Past studies suggest however, that harvest mice have cyclical populations
which could explain an apparent decline associated with studies conducted over a
shorter time interval (Trout, 1978; Harris, 1979).
Past studies on harvest mice in East Anglia In contrast to national studies, those carried out in East Anglia do not appear to find
an extreme decline in harvest mouse numbers. A short study in Suffolk in 1978 found
the harvest mouse to be widespread, present in all 10km squares within Suffolk and
furthermore, in three of those squares they were found to be common (Naunton,
1979). A national study on barn owl pellets, looking at changes in diet between 1974
and 1997 found that overall and in Eastern England harvest mice as a prey item
increased over this time period (Love et al, 2000).
Studies carried out by Perrow & Jordan and Perrow & Jowitt from 1992-2003
concentrated mainly on wetlands in East Anglia where they found the harvest mouse
to be abundant. They suggested that wetlands may be providing a stronghold for
harvest mice in East Anglia whilst local extinctions may have occurred in arable
farmland where habitat has been lost to intensification (Perrow & Jordan, 1992.
Perrow & Jowitt, 1993; 1995; 2003).
Recent informal studies in Essex and Bedfordshire have also found the harvest
mouse to be widespread in suitable habitat, especially roadside verges in Essex and
reed canary grass in Bedfordshire (Dobson; Woolnough; personal communication).
From 1980 to 2008 records of harvest mice in Suffolk were widespread (figure
1) but this was over a very long time period.

5 Suffolk‟s Harvest Mice in Focus
Suffolk Wildlife Trust 2011
Report to PTES.
Figure 1: Historic records of harvest mice and nests in Suffolk
(∆- years 2000 to 2008, О- years 1980 to 1999)
This map shows all historic records of harvest mice and nests as collected
by the Suffolk Biological Records Centre from 1980 to 2008
Pellets as evidence of harvest mice The success of the Suffolk Community Barn Owl Project combined with the lack of
knowledge on harvest mice in Suffolk gave the perfect opportunity to study harvest
mice using barn owl pellets. Barn owls in Suffolk have steadily been increasing in
numbers and spreading to new parts of Suffolk. This range expansion has been helped
by the erection of over 1000 new nest boxes combined with the creation of new rough
grassland hunting ground, much being arable field margins.
As barn owls produce pellets they provide the perfect way to study small
mammal communities as the remains of mammal skulls and jaws within them can be
easily identified. This expansion in the barn owls range provided the perfect
opportunity to collect pellets from across Suffolk and analyse them for the presence of
harvest mice. Past work on owl pellets has shown that barn owls do prey on harvest
mice regularly, being found in pellets from approximately 50% of sites from eastern
counties (Glue, 1975). Overall they tend to make up less than 1% of the barn owls
diet, showing that the barn owl does not have a big impact on harvest mouse
populations (Glue, 1975). They are also a good species to use in mammal studies as
barn owls are habitual and frequent the same roost sites for many years making
collection of the pellets an easy task (Glue, 1970).
Project Aims The overall aim of this project is to find out if barn owl pellets are an effective way to
study harvest mice. This will be backed up by extensive field studies to search for
nests. The nest searches will also enable a detailed study of the harvest mouse in the
county of Suffolk to be carried out, including distribution and habitat preferences.
The practical outcome of the project is to provide a conservation monitoring tool and
information on effective habitat management for the harvest mouse which can then be
used in other parts of the UK.

6 Suffolk‟s Harvest Mice in Focus
Suffolk Wildlife Trust 2011
Report to PTES.
Pellet collection Pellets were collected by volunteers monitoring barn owl boxes and nesting sites
across Suffolk over the summers of 2009 and 2010. Collection was begun in 2009 as
this was known to be a year with low field vole numbers. This small mammal is the
barn owls preferred prey and they exhibit cyclical changes in population sizes. It was
thought that a lack of field voles may force the barn owls to prey on a wider range of
species, making harvest mice more likely prey items.
As most monitoring visits take place in June, most of the pellets for the project
were collected in June although some were collected later and some sites re-visited in
autumn. Fresh pellets were collected wherever possible, but in some cases older
pellets of unknown age were collected. Twenty or more pellets were collected from
each site but in some cases the sample was smaller. For each site details were
recorded including the date of collection, six figure grid reference, male or female owl
roost, age of pellets, site name, habitat description and site of roost (see appendix for
pellet collection sheet).
Pellet analysis Pellets were analysed by trained volunteers (a total of 72 current barn owl monitors
and 52 new volunteers trained at 5 training days) and all the species were recorded by
presence of skulls and jawbones (see appendix for pellet recording sheet). Once a
sample was finished the skulls and jaws were bagged and labelled and returned for
verification to ensure nothing was missed or incorrectly identified. To ensure
volunteers were not leaving anything in the pellet debris, a number of random samples
were checked and nothing was found. In feeding experiments with captive barn owls,
skulls and jawbones have been found to be very effective at calculating the correct
numbers and species of prey items (Buckley & Goldsmith, 1975).
Pellet analysis training day

7 Suffolk‟s Harvest Mice in Focus
Suffolk Wildlife Trust 2011
Report to PTES.
Site selection Sites were split into two categories, those where samples of owl pellets had harvest
mouse remains (76 sites) and those where harvest mouse remains were absent (147
sites). Site visits were undertaken on 95 sites. Of these 49 were positive for harvest
mice in owl pellets and 46 were negative for harvest mice in owl pellets. This
represents approximately 50% of fieldwork in each category, in order to test the
theory that barn owls can be used as a tool to locate harvest mice on the ground.
The sites were selected to represent a good geographical spread across
Suffolk. This method did have its limitations as barn owls are concentrated to the east
side of Suffolk with a marked lack of breeding sites across the west of the county.
There are also more concentrated populations of barn owls to the north of the county
along the Waveney valley (figure 2). This gives the project a geographical bias to
these parts of the county.
Figure 2: Barn owl boxes in Suffolk
Over 1000 barn owl boxes have been erected in Suffolk, all in areas containing habitat
suitable for breeding barn owls. Approximately 10% of the boxes are used by
breeding barn owls.

8 Suffolk‟s Harvest Mice in Focus
Suffolk Wildlife Trust 2011
Report to PTES.
Site visits All sites were visited across a two year period from October through to March when
harvest mouse nests are at their easiest to find. The boundaries of the land visited
were defined by the land ownership and varied in size from gardens to large arable
businesses. Once on site, the areas to search were chosen based on their suitability for
harvest mice. Suitable habitat included grassland left to grow long for approximately
three years including field margins, wet areas of any kind with long vegetation present
and wild bird/game cover plots. On sites where more than one habitat was present
each suitable habitat type was searched. The time searching each area within a site
was recorded along with the time taken to find each nest. All areas searched were
marked on a map and a grid reference taken for each nest found. The search time was
often limited by the size of the habitat block but where it was not, searching time was
for approximately 30 minutes. Details were recorded for each nest including the plant
species it was found in and the height above ground (see appendix for nest search
form and map sample).
Nest searching in long grasses Harvest mouse nest
Data collection & analysis To interpret the field data all sites visited for nest searches were allocated an overall
site habitat type plus a connectivity score. This enabled the differences in numbers of
harvest mice nests at different sites to be looked at in relation to the surrounding
habitats and landscape. Each individual nest was then allocated a habitat type within
the site to look at specific nesting preferences within the wider landscape.
The classifications used are below, including definitions and photographic
illustrations:

9 Suffolk‟s Harvest Mice in Focus
Suffolk Wildlife Trust 2011
Report to PTES.
Overall site habitat type: defined as the site where the search took place and the
immediate surroundings as seen.
1. Arable with or without associated field
margins
2. Arable with significant amounts of dry
grassland that are not field margins
3. Arable with associated river valley
4. Lowland wetland – grazing marsh,
fenland and estuary

10 Suffolk‟s Harvest Mice in Focus
Suffolk Wildlife Trust 2011
Report to PTES.
Connectivity score (refers to approximately 1km radius of site):
1. ‘Very well connected’ includes:
Sites near lowland rivers with
associated habitat
Estuarine sites with associated
habitat
Extensive fenland/grazing
marsh/rough grassland
Farms with very well
connected, tall margins
throughout
11 Suffolk‟s Harvest Mice in Focus
Suffolk Wildlife Trust 2011
Report to PTES.
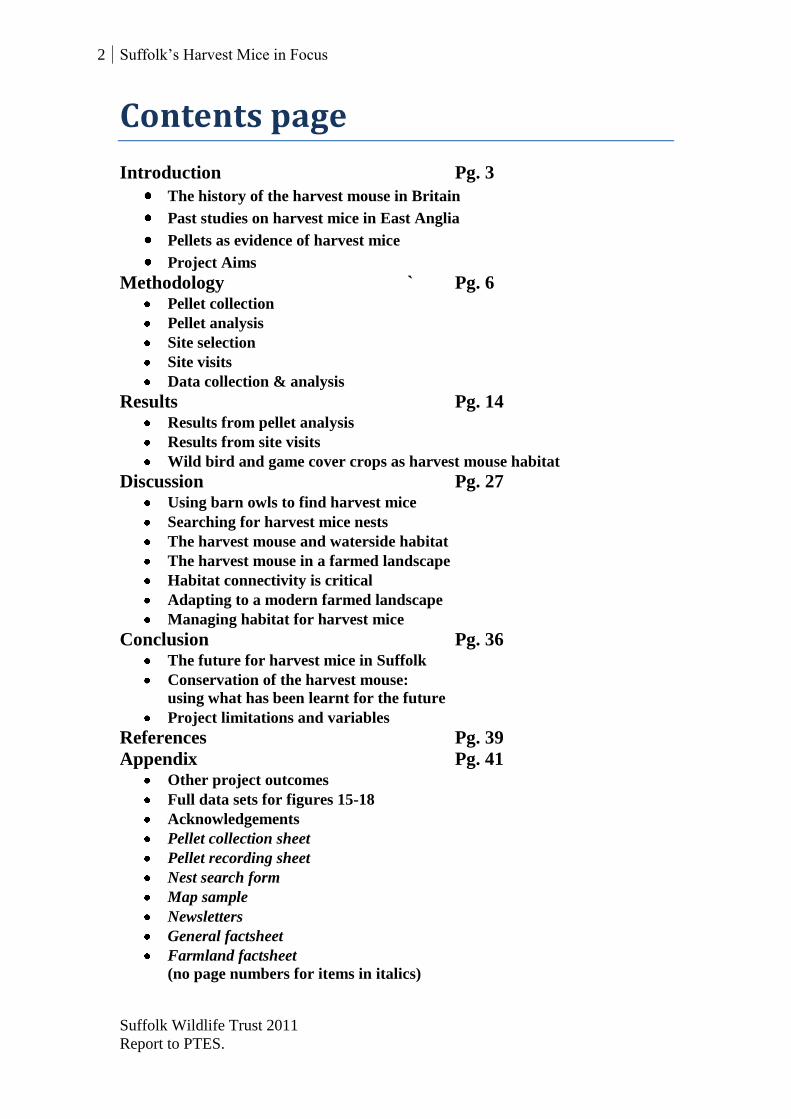
2. ‘Some connectivity’ includes:
Sites near rivers where
associated habitat is patchy or
not present (normally closer
to rivers source)
Arable sites with some tall
margins
3. ‘Very poorly connected’ includes:
Arable sites with no tall
margins and no suitable
habitat within sight or
connected in any way by
suitable habitat
Suitable habitat refers to long grass where it is uncut for 2-3+ years or habitat
associated with water e.g. reedbeds, ditch vegetation such as reed canary grass etc. It
does not include hedges where surrounding vegetation is very short.

12 Suffolk‟s Harvest Mice in Focus
Suffolk Wildlife Trust 2011
Report to PTES.
Habitat types for individual nests:
1. Arable field margin/corner/ditch
(dry or seasonal)
2. Wild bird/game cover crop
3. Rough grassland (where not bordering
arable)
4. Tree plantation (where grass is created
by plantation)
5. Grazing marsh and grazed dykes

13 Suffolk‟s Harvest Mice in Focus
Suffolk Wildlife Trust 2011
Report to PTES.
6. Rivers edge and permanent wet ditch
including ungrazed dykes
7. Fen
8. Reed bed – Phragmites dominated
(wet and dry)
9. Pond edge
10. Estuarine edge

14 Suffolk‟s Harvest Mice in Focus
Suffolk Wildlife Trust 2011
Report to PTES.
4
5
6
7
8
9
0
6 7 8 9 0 1 2 3 4 5
Pellet records
negativepositive
Results from pellet analysis
The overall numbers of sites from which pellets were collected was 226.
76 of these sites had pellets collected with harvest mouse remains present and 147
sites had no evidence of harvest mice in the pellets.
In total 4007 pellets were analysed from 226 different sites
36% of these sites had evidence of harvest mice in the pellets
The number of pellets containing harvest mice was 183
The total number of prey items was 16,481
266 of the total prey items were harvest mice
The overall percentage of harvest mice as prey items was 1.4%
The overall percentage of harvest mice in large samples (20 pellets
or more) was 1.5%
The average number of prey items per pellet was 4.1
Figure 3: All sites where pellets were collected (red are sites where pellets were
positive for harvest mice and blue were negative)
Figure 3 shows all the sites where pellets were collected and the main rivers and
tributaries. The percentage of pellet collection sites on the map associated with rivers

15 Suffolk‟s Harvest Mice in Focus
Suffolk Wildlife Trust 2011
Report to PTES.
is 75% where pellets were positive for harvest mice and 71% where they were
negative. The areas pellets were collected from were biased by the collectors some of
whom visited more sites than others. The Waveney Valley in the northeast is the area
where most pellets were collected, although it is also the area with the highest
concentration of breeding barn owls. The west of Suffolk does not support many barn
owls so few records came from that area. The east coast was unfortunately under-
represented due to poor pellet collection rates.
Table 1: Frequency of Occurence of Harvest Mouse Remains in Pellet Samples -
overview and comparison of this study with others
Study Location Number of
Pellets
Sampled
Number
of Sites
Average no.
pellets
analysed
per site
Harvest
Mice
(number)
% Harvest
Mice as Prey
Items
Proportion of
Sites/Diets
where HM
found
Glue, 1975 Eastern
England
ca. 2338 25 93 92 1.1 56%
Buckley &
Goldsmith,
1975
East Norfolk 5357 25 214 (14-
1271)
519 3.2
(range= 0.1-
6.6)
88%
Love et al,
2000
National,
1974 data
6353 143 44 143 1.4 Data not
available
ibid National,
1997 data
13,562 81 167 1146 2.3 “
ibid Eastern
England,
1974 data
923 8 115 10 0.3 “
ibid Eastern
England,
1997 data
8364 32 261 909 2.9 “
SWT,
2008/11
Suffolk
(large
samples
only)
2987 99 30 173 1.5 53%
ibid Suffolk
(all data)
4007 226 18 266 1.4 36%
Table 1 gives an overview of owl pellet studies, comparing harvest mice in barn owl
pellets from 1975 to the current study. Most studies were carried out in East Anglia
although some national data is included. There are large variations in the total
numbers of pellets sampled, the number of sites they were collected from and the
average number of pellets analysed per site. The data does not show large variations
according to the location and the year. What it does show is that the probability of
finding harvest mice remains in pellets increases with the number of sites and the
number of pellets analysed per site.

16 Suffolk‟s Harvest Mice in Focus
Suffolk Wildlife Trust 2011
Report to PTES.
Comparison of numbers of species found in owl pellets
Figure 4: Numbers of species found in all owl pellets
The numbers of species
shows the field vole to be
the most important prey
item both in numbers and
as prey units (see below).
Other species most
commonly preyed upon in
descending order are the
common shrew (26%),
wood mouse (12%),
pygmy shrew (8%) and
bank vole (6%). The
harvest mouse makes up
only 2% of prey items.
Figure 5: Numbers of species in all owl pellets as prey units
(calculated by average weight of species as taken from Yalden, 2003)
When comparing prey
units, some of the
larger species such as
rat and water vole
become more valuable
as prey to the barn owl
and species such as
the pygmy shrew less
important due to its
small size. The
harvest mouse as a
prey unit also drops to
1% due to its small
size.

17 Suffolk‟s Harvest Mice in Focus
Suffolk Wildlife Trust 2011
Report to PTES.
Harvest mice relating to small mammal species diversity
Figure 6: Number of species recovered in samples of 20 pellets from sites with
and without harvest mice present (red-samples with no harvest mice in pellets,
blue-samples with harvest mice in pellets)
This histogram does show two populations and suggests that the where harvest mice
are present small mammal species diversity may be higher. A 2 tailed t-test run on the
data is significant but only to a very low p-value (1.72).
Minimum owl pellet sample size
What is the minimum pellet sample size needed to find harvest mice?
The following figures are best estimates based on all the data:
19-20 pellets would find 50% of all sites with harvest mice
35-40 pellets would find 85% of all sites with harvest mice
The figures are based on mean and median numbers of harvest mice per numbers of
pellets of different sample sizes. Confidence limits are based on the assumption that
the variation in numbers of harvest mice across sites has a normal distribution.
Predictions are based on harvest mice being present at 79% of all sites as found
during site visits.

18 Suffolk‟s Harvest Mice in Focus
Suffolk Wildlife Trust 2011
Report to PTES.
Results from site visits
Site visits were carried out from October through until March in the years 2009-11 to
sites where owl pellets had been collected. The aim was to search for evidence of
harvest mice on the ground by finding the distinctive woven nests. In total 95
different sites were visited, 49 to sites where the pellets collected had been positive
for harvest mouse remains and 46 to sites where the pellets were negative for harvest
mice. Nests were found at 86% of „positive‟ sites and 72% of „negative‟ sites.
Figure 7: Map of Suffolk showing all 95 site visits carried out - red are visits to
‘positive’ sites and blue visits to ‘negative’ sites
The sites chosen were based on their geography, although limited by distribution of
barn owl boxes which are fewer in the West. The aim was to ensure a good
representation of both positive and negative sites across the county of Suffolk.

19 Suffolk‟s Harvest Mice in Focus
Suffolk Wildlife Trust 2011
Report to PTES.
Figure 8: All harvest mouse records (plotted as 1km2)
Figure 8 shows all records for the project from Spring 2009-Spring 2011 plus all the
main rivers and tributaries. The records include all breeding nests and non-breeding
nests recorded from site visits. They also include some verified records of live mice
and dead mice as sent in by members of the public. Records from owl pellets are not
included as they can be from a wider area of up to 2km radius, or more in winter,
from the pellet collection site. For all the records on the map 73% are associated with
the main rivers and tributaries.

20 Suffolk‟s Harvest Mice in Focus
Suffolk Wildlife Trust 2011
Report to PTES.
Overall percentage of sites where harvest mouse nests were found
Figure 9: Percentage of ‘positive’ pellet sites visited where nests were found
Figure 10: Percentage of ‘negative’ pellet sites visited where nests were found
Harvest mouse nests were found at 86% of all sites where the pellets collected were
positive for harvest mouse remains and 72% where the pellets were „negative‟. The
percentage of sites where nests were found was 14% higher at sites where the pellets
collected were „positive‟.

21 Suffolk‟s Harvest Mice in Focus
Suffolk Wildlife Trust 2011
Report to PTES.
Nests related to pellets and search time
Figure 11: Number of harvest mice recovered in samples of 20
or more pellets vs. nests found at 45 sites
The majority of samples of pellets (range 20-126 pellets) contain the remains of
between one and five harvest mice and the majority of sites have less then ten nests.
The calculated correlation coefficient is 0.163 which means only 3% of the two
variables are in common with each other giving no significant relationship between
the number of harvest mice in pellets and the number of nests found. There is still no
statistically significant relationship even when all outliers and samples with under 40
pellets are removed (correlation coefficient 0.317 = 10% of the two variables are in
common).
Figure 12: Number of nests vs. time to find first nest in 74 areas at 46 sites
At the majority of sites it took less than ten minutes to find the first nest and in all
sites apart from one, less then 10 nests were found, with most sites having less than
five nests. The correlation coefficient is low, -0.154 (2% in common) giving no
statistically significant relationship between search time and numbers of nests found.

22 Suffolk‟s Harvest Mice in Focus
Suffolk Wildlife Trust 2011
Report to PTES.
Nests found by habitat type Figure 13: Number of nests found in each habitat type
The overall numbers of nests found was highest in arable field margin/corner/ditch,
wild bird/game cover, rough grassland and rivers edge/wet ditch. The lowest numbers
were found in fen, followed by estuarine edge and pond edge.
Figure 14: Ratio of nests found in each habitat type to the number
of sites where each habitat occurred
Figure 14 corrects for the numbers of nests in relation to how many sites were
searched containing each habitat type, this then shows which habitats are most likely
to contain nests. Wild bird/game cover has the highest numbers of nests, an average of
4.5 per site. Tree plantations also have significantly higher numbers of nests at 2.8 per
site whilst all other habitats have an average of only 1-2 nests per site.

23 Suffolk‟s Harvest Mice in Focus
Suffolk Wildlife Trust 2011
Report to PTES.
Number of harvest mouse nests related to habitat classification
Figure 15: Percentage of sites where nests were found for different site habitat
classifications
Nests were found at 65% of habitats classified as arable (1) and arable with grass (2).
This figure rose to 85% for arable with river valley (3) and 100% for lowland wetland
habitats (4).
Figure 16: Nest per site ratio for the different site habitat classifications
Once nest numbers had been corrected for the number of sites the habitat containing
most nests per site was lowland wetland with 5.25 nests (4). This dropped to 3.75
nests for arable (1), 3.0 nests for arable with river (3) and 2.75 nests for arable with
grass (2).
1: Arable
2: Arable with grass
3: Arable with river valley
4: Lowland wetland: grazing
marsh, fenland and
estuary
24 Suffolk‟s Harvest Mice in Focus
Suffolk Wildlife Trust 2011
Report to PTES.
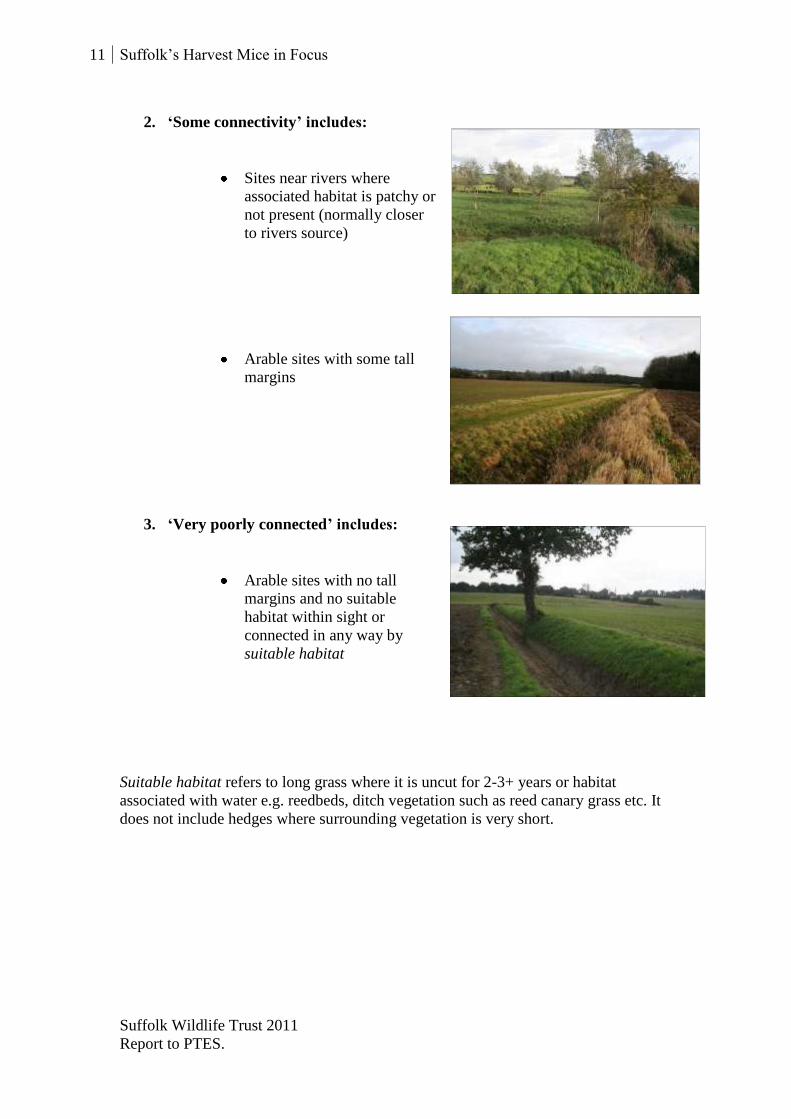
Number of harvest mouse nests related to site connectivity
Figure 17: percentage of sites where nests were found for different connectivity
scores
Nests were found at 100% of very well connected sites (1), 85% of sites with some
connectivity (2) and only 40% of sites that were very poorly connected (3).
Figure 18: Nest per site ratio for the sites with different connectivity scores
Very well connected sites (1) had the highest numbers of nests per site at 5.25, sites
with some connectivity (2) had 2.5 nests per site and very poorly connected sites (3)
had 1.75 nests per site.
(see appendix for full data sets from figures 15 to 18)
1: Very well connected
2: Some connectivity
3: Very poorly connected

25 Suffolk‟s Harvest Mice in Focus
Suffolk Wildlife Trust 2011
Report to PTES.
Number of nests and connectivity
The numbers of nests in arable margins and rough grassland were found to be
related to connectivity: (here connectivity refers to the quality of the habitat as there
were no other habitat types present e.g. river valleys, to create corridors for
movement). In very poorly connected habitats a mean average of one nest was found
in arable/grass habitat (based on four sites). In better connected habitats the mean
average number of nests in arable/grass rose to 2.75 (based on 24 sites) and in very
well connected arable/grass habitats this mean average increased to 8.25 nests (based
on four sites). Median scores respectively were 1, 3 & 5.5 nests.
The numbers of nests in poorly connected habitat were found to increase where a
good food source was present: At the eight sites where harvest mouse nests were
found in isolated patches of habitat ranging from 1200m2 to 13950m
2, there was a
marked difference in number of nests depending on habitat type. In the margins and
rough grass habitats an average of one nest was found across four sites. In the areas
with a good food source present including wild bird/game cover crops and a soft fruit
plantation an average of 6.25 nests was found across four sites.
Wild bird and game cover crops as harvest mouse habitat
Wild bird and game cover crops have been found to support good numbers of harvest
mice where they contain the right mixture of plant species. Below is a summary of
what was found:
In total 15 areas of wild bird/game cover crop were searched
Nine out of the 15 wild bird/game cover crops searched contained harvest
mouse nests
Four sites had harvest mouse nests only in the wild bird/game cover crop
Four of the wild bird/game cover crops that did not contain harvest mouse
nests contained only maize
Two of the wild bird/game cover crops that did not contain harvest mouse
nests were mixed plant species including millet but had been stunted by dry
weather and were very short
One site that had 15 harvest mouse nests in a crop of reed millet and white
millet was very poorly connected and had only a small area of rough grass
adjacent where no nests were found
Eight of the nine wild bird/game cover crops with harvest mouse nests
contained millet of some variety although the crops with most nests had at
least two varieties of millet
Other plant species that were found supporting harvest mouse nests and
presumably providing a food source were quinoa and triticale
Sunflower and kale were also present in wild bird/game cover crops but were
not seen to support harvest mouse nests
Most wild bird/game cover crops used maize as a supporting plant species

26 Suffolk‟s Harvest Mice in Focus
Suffolk Wildlife Trust 2011
Report to PTES.
Figure 19: The average number of nests in different plant species as found in the
15 plots of wild bird/game cover crops
Plots containing more than one variety of millet (reed, white and red) contained
significantly more nests than plots containing only one variety of millet. Plots with a
mix of other species had low numbers of nests and those with only maize had no
nests.
Nest in game cover crop of reed Close up of nest in a millet spray in
millet and white millet a wild bird and game cover crop

27 Suffolk‟s Harvest Mice in Focus
Suffolk Wildlife Trust 2011
Report to PTES.
Using barn owls to find harvest mice Barn owls have been used as a tool for studying small mammal populations
for in many studies, significant for both looking at the diet of the barn owl and the
mammals themselves. Past studies have looked at harvest mice as barn owl prey and
found them in 50% of diets from southern and eastern counties (Glue, 1975), but have
not attempted to back this up with field visits to look at the effectiveness of barn owls
as monitors of small mammal populations.
The aim of this study was to follow up the pellet analysis with site visits to
search for harvest mouse nests, using the results to look for a relationship between the
two and the overall effectiveness of the method for surveying the harvest mouse. No
trapping was carried out, only nest searches, so it has been assumed throughout the
study that there is a positive relationship between the number of nests found and the
number of mice.
Other studies have found both that there is no relationship between population
and numbers of nests (Riorden et al, 2009) and that there is a very good relationship
(Kuroe et al, 2011). This contrast is most likely due to the very low numbers of mice
trapped in Riordens study which can make results difficult to interpret.
In order to test the theory that barn owls are a good tool for finding harvest
mice, half the sites visited were where pellets had been negative for harvest mice and
half were positive. The theory was not proved as nests were found at 72% of negative
sites and 86% of positive sites (figures 9 & 10). The fact that visits to positive sites
yielded 14% more sites with harvest mouse nests does show that in some cases the
barn owls were effective as monitors of harvest mice. Visits to sites where barn owls
were present but there was no suitable habitat for harvest mice are evidence of this.
This site is managed for barn owls to encourage field voles but the
grass is not long enough to support breeding harvest mice which
were not present here or in the owl pellets collected

28 Suffolk‟s Harvest Mice in Focus
Suffolk Wildlife Trust 2011
Report to PTES.
Overall in Suffolk barn owls and harvest mice were found to have very similar
habitats. Although the specific habitat requirements are different the landscapes used
by both species are very similar. Small mammal diversity was also found to be higher
in pellet samples where harvest mice were present (figure 6) showing that the harvest
mouse may be a good indicator species for the health of the habitat and its capacity to
support other species.
As stated on page 17 the minimum pellet sample size in order to be confident
in finding 50% of all sites is 19-20, rising to 35-40 to be confident in finding 85% of
all sites. This means that the method could be used with much more confidence if the
sample size could be increased to 40+ for all sites. This does raise questions of the
practical application as the time taken to analyse the pellets would increase and in
many cases it would be very hard to collect that number of pellets from one site.
As the average pellet sample size was only 18 in this study (see table 1),
knowing that 35-40 pellets would find 85% of sites, the proportion of sites positive
for harvest mice remains in pellets would have risen if the average sample size was
larger.
Searching for harvest mouse nests Although nest searching may be thought of a very time consuming process, in
reality a good surveyor can assess habitats very quickly and only search those areas
that are likely to contain nests. The nests are very distinctive and are rarely confused
with other small mammal nests so little training is needed in recognition.
In this study ground nests were not recorded as field voles commonly build
these type of nests, although other studies have found that harvest mice do build
ground nests in winter (Ishiwaka et al, 2010) and also when disturbed as second
breeding nests (Trout, 1978). One other type of nest which was not recorded but was
found on a few occasions was a tubular shelter often incorporating leaves and always
found about 1m off the ground.
Ground nest – unrecorded in this project Tubular shelter nest – unknown species
It was thought that there may be a relationship between the time taken to find
the first nest and the overall number of nests found. Figure 12 disproves this theory,
meaning no assumptions can be made on total numbers of nests even if the first nest is
found within a short time. The number of harvest mouse skulls and jaws in the pellets
was also found to have no relationship with the number of nests found on the ground
(figure 11). This means that numbers of skulls in pellets cannot be used to assess the

29 Suffolk‟s Harvest Mice in Focus
Suffolk Wildlife Trust 2011
Report to PTES.
size of harvest mice populations. Both these factors make site visits to carry out nest
searches invaluable in assessing harvest mouse populations.
Nest searches are best carried out from October through until March. Any
searches before October will probably result in the disturbance of breeding mice,
although it is likely that mice will be breeding until December if the weather is mild.
In this study current breeding nests with live young and adult females were seen until
November.
Nest searches in reed beds and on river banks should be carried out before
January as any later than that they will probably have been knocked from the reeds by
bad weather or the vegetation may have been flattened by winter floods. Nest searches
in grasses can continue until the vegetation starts to grow in April and obscure them
from sight. Nests in dry grasses can persist for over a year as demonstrated by a nest
monitored from autumn 2009 to autumn 2010 when it was still easily recognised as a
harvest mouse nest. Knowing this it should also be taken into account that the
previous years nests may be found alongside the current years nests in dry grassland.
Harvest mouse nest in dry grassland approximately
one year after it was first found in October
Although site visits are very valuable owl pellets should not be ruled out as a
method for finding harvest mice. In this study half of the sites were pinpointed using
owl pellets and the other half the simple presence of barn owls, which would be a
good starting point for finding harvest mice in itself as they often share the same
habitats. Certainly in a landscape where harvest mice populations were very scattered
barn owl pellets may be a very useful tool in finding them.
The harvest mouse and waterside habitats The harvest mouse was found to be widely distributed across the county of
Suffolk, with nests overall at 79% of all the 95 sites searched. The records are widely
distributed across Suffolk with no area having an obvious lack of records (figure 8).
73% of the sites are closely associated with rivers (within 1km), even if the
actual habitat they were found in was not riparian. This figure is the same for barn
owls based on the pellets collected, suggesting that both species are more likely to be
found near a river valley.
River valleys are often considered as marginal farming ground as they can be
hard to drain so therefore very waterlogged and can also be steeply sloped making

30 Suffolk‟s Harvest Mice in Focus
Suffolk Wildlife Trust 2011
Report to PTES.
access by modern machinery difficult. For this reason they are often grazed and are
sometimes managed for nature conservation creating wildlife habitats and corridors
for movement in the process. There is also a legal obligation by farmers to avoid
spaying any chemicals close to a water course (including smaller streams and
tributaries) which can then lead to an increase in the diversity of plant and
invertebrate species.
The habitat classification with the greatest likelihood of finding high numbers
of harvest mice nests was lowland wetland (figures 15 & 16). Lowland wetlands
including fens, grazing marshes and estuaries are more extensive habitats than many
river corridors, which are ideal for movement but may not contain enough good
habitat for harvest mice to successfully breed.
Of the ten habitat types that nests were found in, six are associated with water.
Of these habitats the likelihood of finding nests is highest in fens, reed beds and
estuarine edges (figure 14). These are the habitats most likely to contain extensive
amounts of suitable vegetation for nest building. Grazing marshes where cattle have
access to all areas including the ditches support less breeding harvest mice as they
often contain little suitable habitat.
This grazing marsh has unfenced ditches and high grazing pressure
from cattle, meaning that the ditch vegetation is kept short and therefore
unsuitable for breeding harvest mice

31 Suffolk‟s Harvest Mice in Focus
Suffolk Wildlife Trust 2011
Report to PTES.
Pond edges, river edges and wet ditches support less harvest mice overall (figure 14)
as they can be isolated and are not always part of a well connected landscape. This is
varied though as river edges in this study sometimes provided a narrow corridor only
suitable for movement and sometimes very extensive habitat for breeding.
Here the deep set river had a
narrow strip of rough
grassland along its banks,
ideal for movement and
dispersal to new areas by the
harvest mouse. It also
supported a very small
breeding population,
constrained by regular cutting
and flooding. The
surrounding farmland had a
network of tall margins but
they were cut too regularly
for breeding harvest mice.
This river which had a
shallower channel provided
very extensive habitat because
of the way it was managed-
here primarily for pheasant
shooting but also for wildlife.
Wetland vegetation gave way
naturally to rough grassland
and the area supported a very
good population of breeding
harvest mice. In contrast to
the above site the surrounding
farmland was very intensively
managed with no tall grass
margins.
The higher numbers of nests found in wetland habitats, many of which have remained
unchanged for centuries, suggests that harvest mice in lowland arable landscapes have
always had stable „core‟ populations in wetland habitats. Perrow & Jowitt 1995, came
to the same conclusion after carrying out detailed studies on harvest mice in the
Norfolk Broads. These wetland populations may have prevented the loss of the
species from many areas of Suffolk as agriculture intensified over the last century.
32 Suffolk‟s Harvest Mice in Focus
Suffolk Wildlife Trust 2011
Report to PTES.
The harvest mouse in a farmed landscape The two habitat types which support the smallest numbers of harvest mice are
the arable field margins and rough grassland (figures 13 & 14). These are both
common habitats but are very varied in quality, easily lost due to cutting and often
isolated within farms.
The normal margin/rough grass cutting regime for farms within
Environmental Stewardship is a three year rotation, although a two year rotation is
also widely used. Three years growth is the minimum to support a good population of
harvest mice, as only in a few isolated cases were nests found in grasses that had been
uncut for two years. As cutting is often carried out in autumn or early winter in the
third year of growth, these rough grassland habitats are being removed as they
become suitable, often whilst the mice are still breeding. As cutting is rotational the
mice will always have somewhere to retreat to but will be unable to build up large
populations.
It is probable that due to chemical use in the crops that insect numbers are
depleted as a food source in most arable field margin habitats. Grass seeds may also
be low as a food supply in grass margins, especially if they are are cut before winter
when they are needed to sustain overwintering populations of harvest mice, which
have very high mortality over winter and early spring (Perrow & Jowitt, 1995; Haberl
& Krystufek, 2003). This lack of winter food and loss of suitable breeding habitat at a
critical point explains the persistence of only small populations of harvest mice in
rough grassland and field margins.
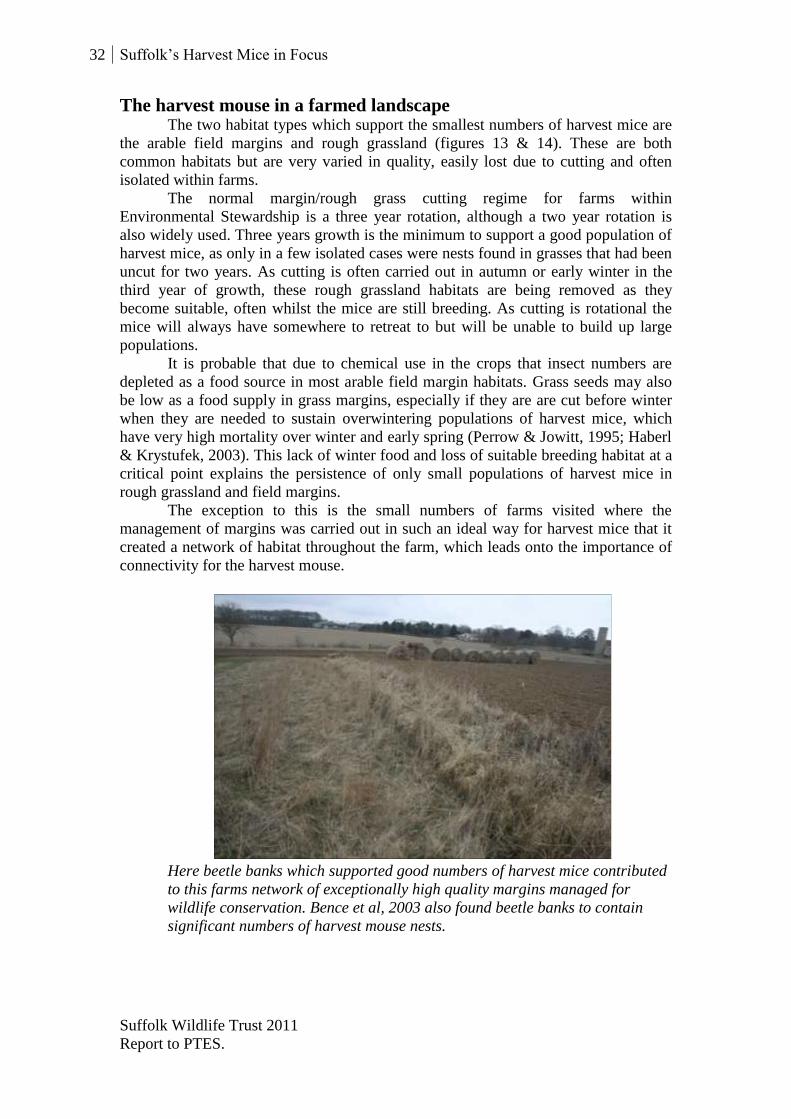
The exception to this is the small numbers of farms visited where the
management of margins was carried out in such an ideal way for harvest mice that it
created a network of habitat throughout the farm, which leads onto the importance of
connectivity for the harvest mouse.
Here beetle banks which supported good numbers of harvest mice contributed
to this farms network of exceptionally high quality margins managed for
wildlife conservation. Bence et al, 2003 also found beetle banks to contain
significant numbers of harvest mouse nests.

33 Suffolk‟s Harvest Mice in Focus
Suffolk Wildlife Trust 2011
Report to PTES.
Habitat connectivity is critical Connectivity of habitat is one of the most important factors for the persistence
of good populations of breeding harvest mice. The management of margins to
increase connectivity within a farm was found to increase the size of harvest mouse
populations from an average of one nest on poorly connected farms to eight nests on
very well connected farms (see page 25). This demonstrates that not only is the
quality of the habitat important but also that increased capacity for movement within
sites increases numbers of harvest mice.
Connectivity has more effect overall than habitat type on nest numbers, as the
number of nests and chance of finding a nest rises steeply with good connectivity and
falls rapidly as connectivity decreases (figures 17 & 18). This shows how important it
is to reduce fragmentation of habitat which is considered to be one of the major
threats to biodiversity. A specific example in this study was a standard arable field
margin where a significantly higher than usual number of nests was found. The
habitat in the margin was not of a higher quality than usual but was well connected to
the Deben estuary by a stream containing reedbeds and fringed by rough grass. This
had allowed the mice to migrate from the fringes of the estuary to the field margin.
The margin in this picture contained a very high number of harvest mouse
nests as it was well connected to the Deben Estuary where harvest mice were
breeding successfully in the associated salt marsh and rough grassland.
An aerial view of the Deben Estuary showing the location of the margin in the
picture above (Image Credit Google Earth, 2010).

34 Suffolk‟s Harvest Mice in Focus
Suffolk Wildlife Trust 2011
Report to PTES.
A study carried out in Japan by Kuroe et al, 2011, also found that the size of
harvest mouse populations is determined by the connectivity of the habitat as well as
the quality. It proved that the loss of adjacent habitat lowers population size even if
the monitored habitat itself did not change.
With the introduction of Environmental Stewardship many farms have
reinstated long field margins which have allowed harvest mice to migrate from core
riparian populations into the wider arable landscape. It may be the case that harvest
mice did undergo a dramatic decline in Suffolk since the 1970s and that in recent
years the population has recovered as arable landscapes have become more habitable,
although this cannot be proven.
Harvest mice are known to be rapid colonisers of new habitat as shown by
their preference for newly planted woodlands. After wild bird/game cover, tree
plantations were the second most likely habitat type in which to find harvest mice
nests (figure 14). A study by Moore et al, 2003, also showed that harvest mice are the
most frequently trapped small mammal species in new farm woodland, using the long
grasses for nesting.
Harvest mice are mobile creatures and although they do not range more than
about 15-20m when foraging (Harris, 1979) they are capable of travelling easily over
50m through suitable corridors into new habitats (Perrow & Jowitt, 1995), although
this distance may decrease if the corridor through which they are moving is not of
good quality (Kuroe et al, 2011).
The timing of migrating young is not known but September and October
coincides with the movement of mice into winter habitat as studied in Finland,
brought about by the onset of the first frosts and halted once cold weather sets in
(Harris, 1979).
Adapting to a modern farmed landscape Harvest mice are very adaptable species and are generalists in that they are not
dependent upon any particular plant species. The most important feature of the
vegetation for harvest mice breeding success is the structure. In this study cocksfoot
grass, common reed, reed canary grass, reed sweet grass and other upright grasses
including false oat grass were the most commonly used plants for nest building. These
species are all capable of forming dense cover with a supporting stem structure, both
supporting the nest and protecting it from predation and bad weather. The other thing
these plants have in common is a wide leaf blade, ideal for splitting and weaving into
the nest. The position of the nest varies with the plant species, nests are found low to
the ground in dry grasses and over 1m off the ground in reeds and other reed like
plants.
Another plant which has the correct structure for nest building, plus a good
food source is millet, planted in recent years as part of wild bird and game cover plots.
Wild bird/game cover is the most likely habitat type in which to find high numbers of
nests (figure 14). Millet can be planted very densely and has a very supportive
structure with wide leaf blades, similar to reed canary grass which is a common native
plant in which to find harvest mouse nests. In the wild bird/game cover crops, the
likelihood of finding high numbers of nests increased with the presence of more than
one type of millet in the crops. The plot which contained the highest number of nests
was a game cover plot for pheasant shooting containing both reed millet and white
millet. It was a very poorly connected site with only a small area of rough grassland
adjacent and all field margins and hedges were cut very short.

35 Suffolk‟s Harvest Mice in Focus
Suffolk Wildlife Trust 2011
Report to PTES.
This game cover crop supported high numbers of breeding harvest mice within a
very intensively farmed arable landscape
It is possible that the mice had persisted in the rough grassland in low numbers
allowing them to migrate to the cover plot and build up in numbers over the summer,
or it is also possible that they had migrated to the area from a population elsewhere.
As the plot would not have been sown until May or reached full height until mid–
summer and the original number of colonisers was likely to be low, then the
population must have grown rapidly. Food supplies from cover plots, which are not
ploughed until spring, will also increase winter survival rates in harvest mice,
increasing breeding success in summer.
In this study millet was just as likely to be planted as part of a game cover plot
as a wild bird cover plot, showing that management for shooting as well as farmland
bird conservation can have very beneficial impacts on harvest mice populations.
Managing habitat for harvest mice As a generalist species harvest mice do not require specialist or complicated habitat
management. In general if a good network of habitats, in the form of tall grasses and
wetland vegetation can be provided year round and if harvest mice have some way of
reaching this habitat, they will probably begin to breed there. The breeding success
can then be raised by providing good winter cover and good sources of food, the most
obvious source of this being a wild bird/game cover crop including at least two
varieties of millet. Obviously management is dependent upon the habitat and this
detailed information can be found in the factsheets included in the appendix.
36 Suffolk‟s Harvest Mice in Focus
Suffolk Wildlife Trust 2011
Report to PTES.
The future for harvest mice in Suffolk
Harvest mice are widespread in Suffolk, only completely absent when searched for in
very intensively farmed landscapes with no tall grass margins. They have been found
in isolated grass habitats in low numbers and in isolated wild bird and game cover
crops in high numbers. Where habitat is both of good quality and well connected then
they are almost certain to be present. Only at some sites were the nests not found
where the habitat was good, these were all in very badly connected landscapes
showing the importance of connectivity.
Although harvest mice are widespread they are not always common, in many
cases only one or two nests were found suggesting that populations are able to persist
only at low numbers where conditions are not ideal. In this study over ten nests at one
site was seen as exceptionally good numbers but in the 1950s in Britain and in other
countries such as Russia, finding 100s of nests or live animals in straw stacks was not
uncommon (Trout, 1978). As surveys were not carried out until the 1970s it will never
be known how drastically numbers have dropped but it is probable that it is significant
due to drastic changes in our farmed landscape.
Although numbers may not be as high as they once were the future for harvest
mice in Suffolk looks to be secure. They are found on every major river in Suffolk
and appear to be moving easily out into surrounding farmland as habitat becomes
available. This network of lowland rivers will secure the future of harvest mice even
if farming practices in some areas make the landscape inhospitable and with the
increase of the use of wild bird and game cover crops harvest mice breeding and
overwintering success will increase.
Conservation of the harvest mouse:
Using what has been learnt for the future This study has demonstrated that the harvest mouse can be found using barn owl
pellets but that the presence of barn owls is enough without the pellets to initiate a
nest search in the area. If pellets are used then the minimum number to be sure of
finding 85% of sites with harvest mice is 40 pellets. This is a high number and very
time consuming to analyse, with each pellet taking up to an hour for new volunteers.
Where this method may be very useful is if harvest mouse populations are suspected
to be very scattered in small clusters and difficult to find on the ground.
A good starting point for any harvest mouse nest survey would be to identify
areas of good habitat and then visit with a good nest surveyor who would normally be
able to find a nest within approximately 10 minutes in good habitat. The likelihood of
finding harvest mice nests in the different habitat types is illustrated below as a
predictive model. If all the features in any one box can be seen at a site than the
likelihood of finding harvest mice nests is very high.

37 Suffolk‟s Harvest Mice in Focus
Suffolk Wildlife Trust 2011
Report to PTES.
Harvest Mouse Habitat Predictive Model
The area is associated with water
River edge, wet ditch, pond edge,
estuary, fen, grazing marsh with
fenced ditches
It has some connection to other suitable habitat
Vegetation has at least one year‟s growth
and is at least 1m high (if fallen in bad weather
Look for original standing height)
There are dense stands of vegetation present
Plant species present include common reed,
reed canary grass, reed sweet grass
The area is not associated with water
Rough grass is present: may be a rough meadow,
arable field margin or corner, dry ditch, road verge
It has good connection to other suitable habitat
The rough grass has at least 3 years growth
There are dense tussocks of vegetation present
Plant species include cocksfoot grass or other dense
tussock forming species
No rough grass present
A crop of wild bird or game cover mix is present
Contains one or more varieties of densely planted
millet and is over 1m high
VERY HIGH LIKELIHOOD OF
FINDING HARVEST MOUSE NESTS
No
No
Yes

38 Suffolk‟s Harvest Mice in Focus
Suffolk Wildlife Trust 2011
Report to PTES.
Managing habitat for harvest mice has been shown to be beneficial to many other
species, including other small mammals and priority farmland bird species. These
include the barn owl using rough grassland for hunting and other birds using wild bird
mixes such as the tree sparrow. The harvest mouse is also a good measure of
connectivity within the landscape, especially where it relies on arable field margins
and rough grassland. For these reasons practical habitat management for harvest mice,
as outlined in the factsheets, is a good starting point for conservation of many other
farmland species.
Project limitations and variables
As with all ecological studies there are limitations and variables that ideally if the
study was repeated would be taken into account.
o Nest searching was carried out during the months of October through until
April which can affect results as nests have often fallen from habitats such as
reedbeds during winter storms but can persist in dry grass for over a year.
Therefore wetland habitats should be visited in autumn.
o Weather conditions such as ice and snow can make nest searching very
difficult and unproductive. Flooding and storms can destroy nests in any
habitat making results hard to interpret. This is difficult to overcome in any
study as weather is unpredictable.
o The pellet sample size was often too small to be effective in finding harvest
mice, in many cases under ten pellets were collected when ideally 40 would be
the sample size.
o Some parts of Suffolk had more barn owl monitors collecting owl pellets than
others, a good spread of sites should be ensured.
o Some barn owls were not monitored or in some cases no pellets were collected
or they were not passed onto the project.
o Most barn owl pellets are regurgitated at daytime roosts which can be in a
different place than the nest site and sometimes hard to find.
o Barn owls catch different numbers of harvest mice during the year. Less are
typically taken in the summer as the vegetation is denser and hard for the barn
owl to hunt in – unfortunately this is when most of the pellets were collected
for this study. Ideally pellets would be collected in autumn as harvest mice are
preyed upon in higher numbers then after crops have been cut and numbers are
at their highest after the breeding season.
o A method for distinguishing field vole and harvest mouse ground nests should
be found so as not to exclude valid nest results.

39 Suffolk‟s Harvest Mice in Focus
Suffolk Wildlife Trust 2011
Report to PTES.
Abbey, G. 1909. The Balance Of Nature And Modern Conditions of Cultivation.
George Routledge & Sons, Limited
Bence, S.L., Stander, K., Griffiths, M. 2003. Habitat characteristics of harvest mouse
nests on arable farmland. Agriculture, Ecosystems and Environment. Vol.99, 179-186
Battersby, J. (Ed) & Tracking Mammals Partnership. 2005. UK Mammals: Species
Status and Population Trends. First Report by the Tracking Mammals Partnership.
JNCC/Tracking Mammals Partnership, Peterborough.
Buckley, J. & Goldsmith, J.G. 1975. The prey of the Barn owl (Tyto alba alba) in east
Norfolk. Mammal Review. Vol.5, No.1, 13-16
Glue, D.E. 1970. Avian predator pellet analysis and the mammalogist. Mammal
Review. Vol.1, No.3, 53-62
Glue, D.E. 1975. Harvest mice as Barn owl prey in the British Isles. Mammal
Review. Vol.5, No.1, 9-12
Haberl, W. & Krystufek, B. 2003. Spatial distribution and population density of the
harvest mouse Micromys minutus in a habitat mosaic at Lake Neusiedl, Austria.
Mammalia. Vol.67, Issue 3, 355-366
Harris, S. 1979. History, distribution, status and habitat requirements of the Harvest
mouse in Britain. Mammal Review, Vol.9, No. 4, 159-171
Harris, S. 1979. Secret life of the Harvest Mouse. Hamlyn Publishing Group Ltd
Ishiwaks, R., Kinoshita, Y., Satou, H., Kakihara, H., Masuda, Y. 2010. Overwintering
in nests on the ground in the harvest mouse. Landscape Ecology Engineering. Vol.6,
335-342
Kuroe, M., Yamaguchi, N., Kadoya, T., Miyashita, T. 2011. Matrix heterogeneity
affects population size of the harvest mice: Bayesian estimation of matrix resistance
and model validation. Oikos. Vol. 120, 271-279
Love, R.A., Webbon, C., Glue, D.E., Harris, S. 2000. Changes in the food of British
Barn Owls (Tyto alba) between 1974 and 1997. Mammal Review. Vol.30, No.2, 107-
129
Moore, N.P., Askew, N., Bishop, J.D. 2003. Small mammals in new farm woodlands.
Mammal Review, Vol.33. No.1, 101-104
Naunton, C.R. 1979. The Harvest Mouse in Suffolk in 1978. Suffolk Natural History:
The transactions of the Suffolk Naturalists‟ Society. Vol.18, 86-87

40 Suffolk‟s Harvest Mice in Focus
Suffolk Wildlife Trust 2011
Report to PTES.
Perrow, M.R. & Jordan, M.J.R. 1992. The Influence of Agricultural Land Use upon
Populations of Harvest Mouse. Report to TERF, Hoescht UK.
Perrow, M.R. & Jowitt, A.J.D. 1993. Desperately seeking water shrew and harvest
mouse in broadland. Suffolk Natural History: The transactions of the Suffolk
Naturalists‟ Society. Vol.29, 6-11
Perrow, M.R. & Jowitt, A.J.D. 1995. What future for the harvest mouse? British
Wildlife. Vol.6, 356-365
Perrow, M.R. & Jowitt, A.J.D. 2003. Wetlands as an important habitat for small
mammals. British Wildlife. Vol.14, 171-179
Riorden, P, Lloyd, A & Macdonald, D. 2007. The status of the harvest mouse in a
lowland arable landscape. Report by WildCRU, Oxford University
Rowe, F.P. 1958. Some observations on harvest mice from corn ricks of a Hampshire
Farm. Proceedings of the Zoological Society of London, Vol.131, 320-323
Rowe, F.P. & Taylor, E.J. 1964. The numbers of harvest mice in corn ricks.
Proceedings of the Zoological Society of London, Vol.142, 181-185
Southwick, C. 1956. The abundance and distribution of harvest mice in corn ricks
near Oxford. Proceedings of the Zoological Society of London. Vol.126, Issue 3, 449-
452
Trout, R.C. 1978. A review of studies on populations of wild harvest mice. Mammal
Review. Vol.8, No.4, 143-158
Trout, R.C. 1978. A review of studies on captive Harvest mice (Micromys minutus
(Pallas)). Mammal review. Vol.8, No.4, 159-175
White, G. 1767. The Natural History of Selborne. Penguin Books
Yalden, D.W. 2003. The Analysis of Owl Pellets, 3rd
edition. The Mammal Society

41 Suffolk‟s Harvest Mice in Focus
Suffolk Wildlife Trust 2011
Report to PTES.
Other Project Outcomes
Volunteers: As part of the project volunteers were trained to analyse barn owl pellets.
Many of these volunteers were new to the Trust and volunteered for the first time
during the course of the project. Five pellet analysis training days were held, with a
total of 72 current barn owl monitors and 52 new volunteers trained. Three new
volunteers took part in longer term volunteering with the project doing data entry and
working on map info. One volunteer also spent time doing nest searches and came out
on field visits.
Engaging children: In partnership with Suffolk Wildlife Trusts Education Team,
activities for children included the following:
Owl pellet analysis at the Suffolk Show – May 2009
Owl pellet analysis at education centres using project resources and training for
staff and volunteers – ongoing
Owl pellet analysis with Framlingham Badgers (St John Ambulance junior group)
– November 2009
Article written for Wildlife Watch national magazine plus an RSWT video on the
project – Winter 2009/10
Owl pellet analysis at two school events supported by the project – Spring 2010
Owl pellet analysis at Schools Farms Fair – April 2011
Courses for the public: Two courses for adults ran during the project. The first was
held as part of SWTs Wildlearning Programme in September 2009 the second was a
PTES course held in October 2010.
Contact with landowners and site visits: In total 95 visits were carried out to a variety
of sites across Suffolk. Most were to landowners who had already been involved with
the Suffolk Community Barn Owl Project. At the time of the visit all landowners were
sent a harvest mouse factsheet, a newsletter, a copy of the analysed pellet sheet and a
letter to thank them for their time. When the project was completed all were sent the
new general and farmland management options factsheets plus a final newsletter
containing a summary of the project.
Newsletters & Factsheets: Four newsletters were produced during the projects
lifetime and distributed to pellet analysis volunteers, owl box monitors and
landowners. A new updated general factsheet and a farmland management option
factsheet were produced for future use by SWT (Copies of newsletters and factsheets
are included with the report).
Publicity: Written articles in Suffolk Wildlife Trust Magazine, East Anglian Daily
Times Newspaper, The Times Newspaper, BBC Wildlife Magazine, Country Living
Magazine, Wildlife Watch Magazine. Radio interviews BBC Radio Four Farming
Today and BBC Radio Suffolk.

42 Suffolk‟s Harvest Mice in Focus
Suffolk Wildlife Trust 2011
Report to PTES.
Full data sets for figures 15-18:
Number of nests at all sites related to connectivity and site habitat type Connectivity
Score column
1- arable 2- arable
with grass
3-
arable
with
river
valley
4- lowland
wetland:
grazing
marsh,
fenland &
estuary
Average
number of
nests
1 – very well
connected
8/2
(total no. nests/ no. sites)
4 - average no. nests
22/2
11
42/9
4.6
66/13
5.1
(138/26)
5.3
2 – some
connectivity
16/7
2.3
50/17
2.9
23/11
2.1
0 (89/35)
2.5
3 – very poorly
connected
19/5
3.8
9/10
0.9
1/1
1
0 (29/16)
1.8
Average number
of nests
(51/14)
3.6
(81/29)
2.8
(66/21)
3.1
(66/13)
5.1
Presence/absence of nests at all sites related to connectivity and site habitat type Connectivity
Score column
1- arable 2- arable
with grass
3-
arable
with
river
valley
4- lowland
wetland:
grazing
marsh,
fenland &
estuary
Percentage
of total sites
with nests
present
1 – very well
connected
2/2
(No. of sites where nest
present/total no. sites)
2/2 9/9 13/13
100%
2 – some
connectivity
6/7 15/17 10/11 0
88%
3 – very poorly
connected
2/5 4/10 1/1 0
44%
Percentage of total
sites with nests
present
71%
72%
95%
100%
Acknowledgements Thanks goes to the Peoples Trust for Endangered Species and the Chadacre trust who
funded the project. Simone Bullion for advice on all aspects of the project. John
Dobson and Richard Woolnough for information on the harvest mouse in Essex and
Bedfordshire. Celia Miller for statistical help and creation of figures. Jan Cawston for
the many hours of expertise verifying owl pellet results. Also to the many landowners
who allowed access onto their land and volunteers who helped in many ways with the
project.
Where images are not credited they are taken by Martha Meek or Simone Bullion