sugar intake final project s14029 food standards agency (scotland) march 2008 christine sheehy,1...
TRANSCRIPT

Survey of sugar intake among children in ScotlandSummary report

Blank
Survey of sugar intake amongchildren in Scotland
Summary report
Research Project S14029Food Standards Agency (Scotland)
March 2008
Christine Sheehy,1 Geraldine McNeill,2,3 Lindsey Masson,4
Leone Craig,2,3 Jennie Macdiarmid,2,3 Bridget Holmes,5 Michael Nelson.5
1 Scottish Centre for Social Research2 The Department of Environmental and Occupational Medicine, University of Aberdeen
3 The Rowett Research Institute, Aberdeen 4 The Department of Public Health, University of Aberdeen
5 The Nutritional Sciences Division, King’s College London

Correspondence relating to this report should be directed to:
Dr Gillian PurdonFood Standards Agency ScotlandSt Magnus House6th Floor, 25 Guild StreetAberdeen AB11 6NJTel (01224) 285116Email: [email protected]
Christine SheehyScottish Centre for Social Research 73 Lothian RoadEdinburgh EH3 9AWTel: (0131) 228 2167 Email: [email protected]
Dr Geraldine McNeillDepartment of Environmental & Occupational MedicineLiberty Safe Work Research CentreForesterhill Road Aberdeen AB25 2ZPTel: (01224) 558188 Email: [email protected]
The full report can be downloaded from the FSA website: www.food.gov.uk/scotland
Survey of sugar intake among children in Scotland - Summary report

ContentsIntroduction 2
Aims of the survey 4
Main survey methods 5
Results 7
Conclusions 13
Recommendations 15
References 16
Appendix 17
Survey of sugar intake among children in Scotland - Summary report
1
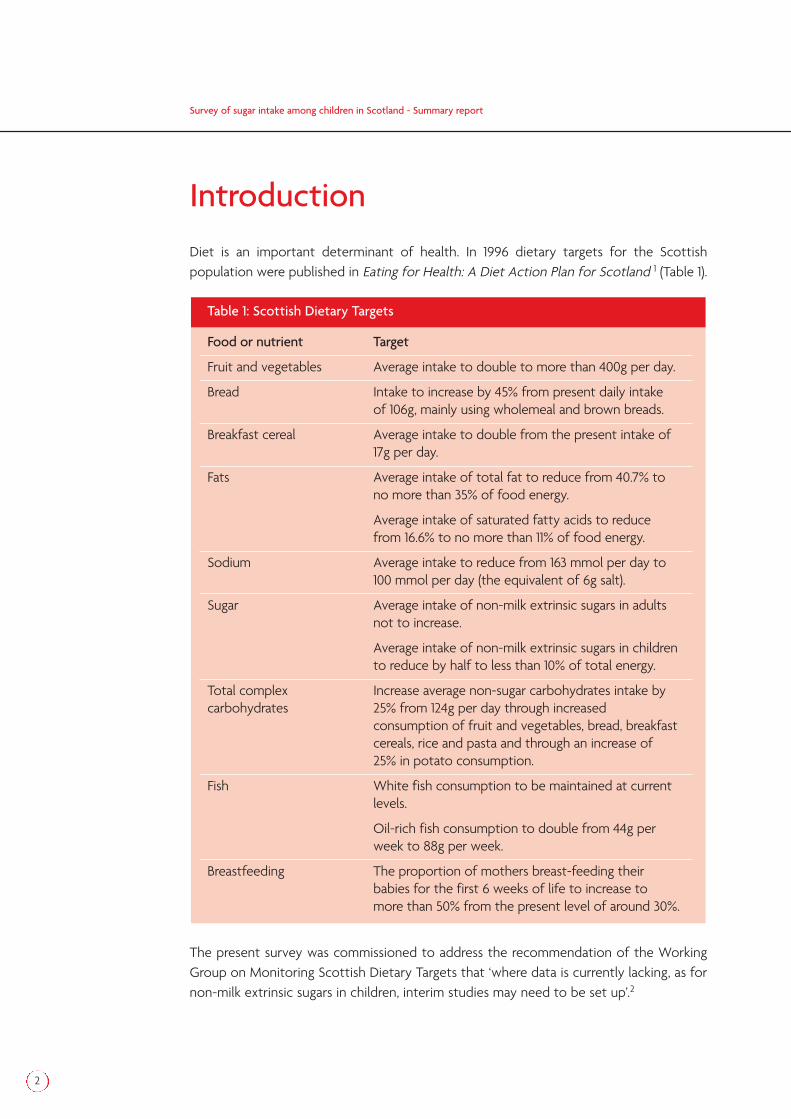
IntroductionDiet is an important determinant of health. In 1996 dietary targets for the Scottishpopulation were published in Eating for Health: A Diet Action Plan for Scotland 1 (Table 1).
The present survey was commissioned to address the recommendation of the WorkingGroup on Monitoring Scottish Dietary Targets that ‘where data is currently lacking, as fornon-milk extrinsic sugars in children, interim studies may need to be set up’.2
Food or nutrient Target
Fruit and vegetables Average intake to double to more than 400g per day.
Bread Intake to increase by 45% from present daily intake of 106g, mainly using wholemeal and brown breads.
Breakfast cereal Average intake to double from the present intake of 17g per day.
Fats Average intake of total fat to reduce from 40.7% to no more than 35% of food energy.
Average intake of saturated fatty acids to reduce from 16.6% to no more than 11% of food energy.
Sodium Average intake to reduce from 163 mmol per day to 100 mmol per day (the equivalent of 6g salt).
Sugar Average intake of non-milk extrinsic sugars in adults not to increase.
Average intake of non-milk extrinsic sugars in children to reduce by half to less than 10% of total energy.
Total complex Increase average non-sugar carbohydrates intake bycarbohydrates 25% from 124g per day through increased
consumption of fruit and vegetables, bread, breakfast cereals, rice and pasta and through an increase of 25% in potato consumption.
Fish White fish consumption to be maintained at current levels.
Oil-rich fish consumption to double from 44g per week to 88g per week.
Breastfeeding The proportion of mothers breast-feeding their babies for the first 6 weeks of life to increase to more than 50% from the present level of around 30%.
Table 1: Scottish Dietary Targets
Survey of sugar intake among children in Scotland - Summary report
2

Survey of sugar intake among children in Scotland - Summary report
3
The focus of the present survey was the intake of sugars and sugar-containing foods bychildren in Scotland. However because total energy intake was measured it was possibleto determine the intake of other macronutrients in particular intake of total fat andsaturated fatty acids and relate these to Scottish Dietary Targets.
Sugars in this report have been defined according to The Department of Health report onDietary Sugars and Human Disease 3 proposed classification:
Intrinsic sugars: sugars forming an integral part of certain unprocessed foodstuffs,i.e. enclosed in the cell, the most important being whole fruits and vegetables
Extrinsic sugars, which are not located within the cellular structure of a food can befurther divided into:
– Milk sugars, occurring naturally in milk and milk products
– Non-milk extrinsic sugars, which includes fruit juices, honey, and ‘added sugars’ which comprise both recipe sugars and table sugars.
Total sugars have been be divided into intrinsic and milk sugars (IMS) and non-milkextrinsic sugars (NMES). Information on the NMES and IMS content of foods was obtainedfrom the NDNS nutrient databank4.

Aims of the surveyThe ‘Survey of sugar intake among children in Scotland’ was commissioned by the FoodStandards Agency Scotland (FSAS) in 2005 to provide robust information on the diet ofchildren in Scotland. The survey was carried out by a consortium of four organisations: theScottish Centre for Social Research, the University of Aberdeen, the Rowett ResearchInstitute and King’s College London. Fieldwork for the survey was conducted betweenMay and September 2006.
The principal aim of the survey was to estimate intake of NMES and other macronutrientsand foods in a nationally representative sample of children in Scotland aged 3-16 years.
Additional objectives were:
To compare the intake of NMES and other macronutrients and micronutrientsbetween sub-groups divided by age, sex, deprivation category and rural-urbanresidence
To estimate the prevalence of overweight and obesity in all children and in sub-groups divided by age, sex, deprivation category and rural-urban residence
To investigate associations between energy, NMES and fat intake and overweightand obesity in all children and in sub-groups divided by age and sex
To determine the levels of physical activity in all children and in sub-groups dividedby age, sex, deprivation category and rural-urban residence
To assess associations between physical activity and inactivity and overweight andobesity in all children and in sub-groups divided by age and sex
To assess dental health in all children and in sub-groups divided by age, sex,deprivation category and rural-urban residence
To assess associations between NMES intake and dental health in all children and insub-groups divided by age and sex
Survey of sugar intake among children in Scotland - Summary report
4

Main survey methodsUsing the Department of Work and Pensions Child Benefit records, a named sample of2800 children aged between 3 and 16 years on 1st May 2006 was drawn from 80 postcodesectors across Scotland. One child per household was selected. After exclusions and aninitial opt out period, a Food Frequency Questionnaire (FFQ) was sent to the remaining2,498 children in the sample. Two versions of the FFQ were used: one for children aged 3-11 years in which the instructions were addressed to the parent or guardian, and one foryoung people aged 12 or above which included alcoholic drinks, in which the instructionswere addressed to the young person.
The FFQ was collected by an interviewer when they called to conduct an interview. Thechild’s height and weight were also measured and information on household compositionand socio-demographic data was collected. Socio-economic status was based on theScottish Index of Multiple Deprivation (SIMD) derived from postcode. The FFQ wascompared with a 4 day non-weighed diet diary in 153 children and a single 24-hour multiplepass recall in 350 children (see Appendix).
Face to face interviews were conducted with 1,700 respondents and 1,512 FFQs werereturned giving a combined response rate for these two items of 66%. Response rates forcombined FFQ and interview were highest amongst those in the 8-11 year age group forboth sexes (71% for both). Figure 1 shows the response to the FFQ and interview.
Of the 1,512 FFQs returned, 51 were rejected as incomplete and a further 70 were excludedas having very high or very low values of energy intake, leaving 1,391 questionnaires for themain analyses.
Results for all analyses using the interview and FFQ data were weighted to allow forselection and non-response bias within the initial sample so that the estimates generatedfrom the responding sample more closely reflect the population of all children in Scotlandaged 3-16 years. In addition, all variables which were significantly skewed were transformedto achieve a normal distribution. This was necessary to allow statistical testing ofassociations between diet and demographic and health variables.
Survey of sugar intake among children in Scotland - Summary report
5

Figure 1: Response to FFQ and interview
Survey of sugar intake among children in Scotland - Summary report
6
Invited to take part in surveyn = 2498
Inteviews conductedn = 1700
FFQ returned andinterview conducted
n = 1491
Interview not conductedn = 652
FFQ returned(no interview)
n = 21
FFQ not returnedn = 209
FFQ not returnedn = 631
Opted outn = 146
No of FFQs sent out andcases to field for interviews
n = 2352
Results
Dietary assessment
Intake of energy and sugars
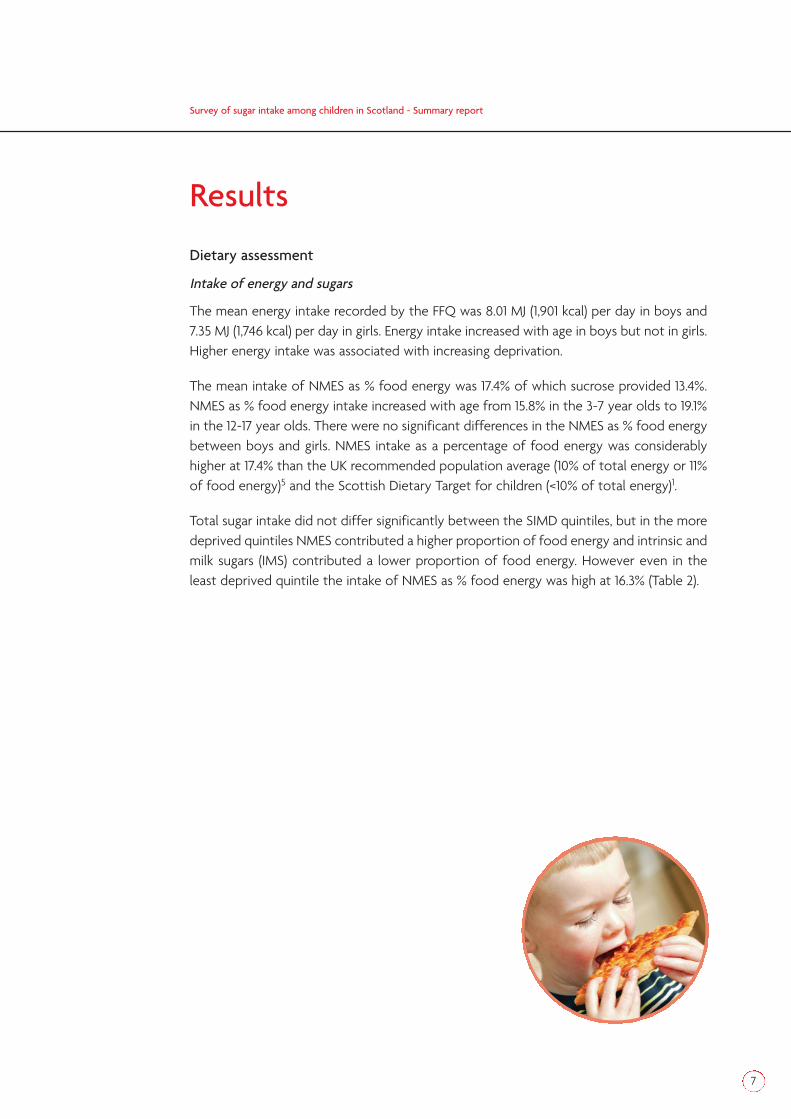
The mean energy intake recorded by the FFQ was 8.01 MJ (1,901 kcal) per day in boys and7.35 MJ (1,746 kcal) per day in girls. Energy intake increased with age in boys but not in girls.Higher energy intake was associated with increasing deprivation.
The mean intake of NMES as % food energy was 17.4% of which sucrose provided 13.4%.NMES as % food energy intake increased with age from 15.8% in the 3-7 year olds to 19.1%in the 12-17 year olds. There were no significant differences in the NMES as % food energybetween boys and girls. NMES intake as a percentage of food energy was considerablyhigher at 17.4% than the UK recommended population average (10% of total energy or 11%of food energy)5 and the Scottish Dietary Target for children (<10% of total energy)1.
Total sugar intake did not differ significantly between the SIMD quintiles, but in the moredeprived quintiles NMES contributed a higher proportion of food energy and intrinsic andmilk sugars (IMS) contributed a lower proportion of food energy. However even in theleast deprived quintile the intake of NMES as % food energy was high at 16.3% (Table 2).
Survey of sugar intake among children in Scotland - Summary report
7

* Least deprived, ** Most deprived
Intake of food groups and supplements
Over 95% of children reported consuming: pasta, rice and pizza; bread (excludingwholemeal); biscuits, cakes and pastries; milk and cream; yoghurt and fromage frais; meatand meat dishes; processed meat; vegetables; chips; crisps and savoury snacks; fruit;confectionery and soups and sauces at least once a month: 59% of children reportedconsuming wholemeal bread and 39% oily fish and dishes at least once a month. Youngerchildren were more likely to consume wholemeal bread, unsweetened breakfast cereals,yoghurt and fromage frais, ice-cream, fats and oils and white fish, shell fish and fish dishes.Older children were more likely to consume chips, fried and roast potatoes and potatoproducts, nuts and seeds, non-diet soft drinks and beverages.
Those living in less deprived areas (as defined by quintile of SIMD) were more likely toconsume wholemeal bread, cheese, oily fish and fish dishes and fruit juice and less likelyto consume diet soft drinks than those living in more deprived areas.
23% of children were taking a dietary supplement, withhigher proportions in younger than older children and inboys than girls. Multivitamins (12%) and cod liver oil (9%)were the most common types of supplements taken.
P value for P value forScottish Index of Multiple Deprivation Quintile overall linear
association association
Ist* 2nd 3rd 4th 5th**
Energy 7.51 7.49 7.44 8.05 7.98 0.018 0.002
Total 28.7 29.0 28.8 29.3 28.9 0.703 0.517sugars
NMES 16.3 17.4 16.8 18.1 18.4 0.003 0.001
IMS 11.4 10.6 11.0 10.2 9.5 <0.001 <0.001
Table 2: Mean energy intake (MJ) and total sugar, NMES and IMS intake (all as % food energy) by SIMD
Survey of sugar intake among children in Scotland - Summary report
8
Contribution of food groups to intake of energy and sugars
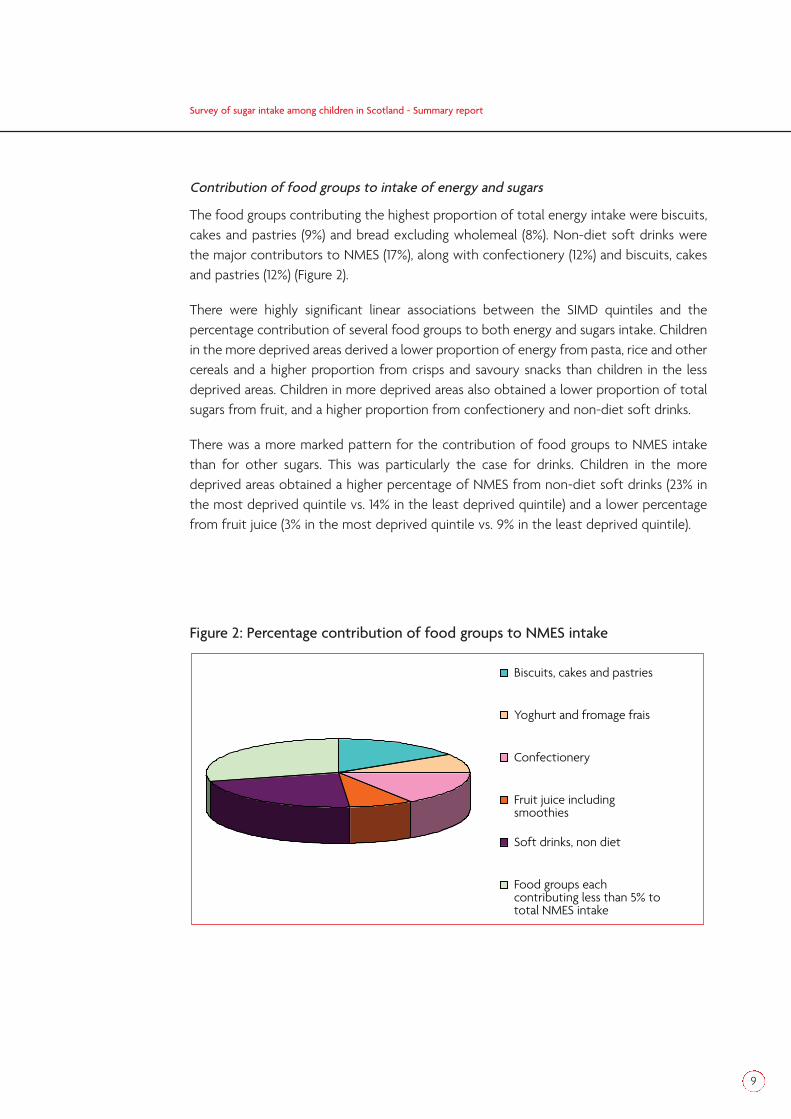
The food groups contributing the highest proportion of total energy intake were biscuits,cakes and pastries (9%) and bread excluding wholemeal (8%). Non-diet soft drinks werethe major contributors to NMES (17%), along with confectionery (12%) and biscuits, cakesand pastries (12%) (Figure 2).
There were highly significant linear associations between the SIMD quintiles and thepercentage contribution of several food groups to both energy and sugars intake. Childrenin the more deprived areas derived a lower proportion of energy from pasta, rice and othercereals and a higher proportion from crisps and savoury snacks than children in the lessdeprived areas. Children in more deprived areas also obtained a lower proportion of totalsugars from fruit, and a higher proportion from confectionery and non-diet soft drinks.
There was a more marked pattern for the contribution of food groups to NMES intakethan for other sugars. This was particularly the case for drinks. Children in the moredeprived areas obtained a higher percentage of NMES from non-diet soft drinks (23% inthe most deprived quintile vs. 14% in the least deprived quintile) and a lower percentagefrom fruit juice (3% in the most deprived quintile vs. 9% in the least deprived quintile).
Figure 2: Percentage contribution of food groups to NMES intake
Biscuits, cakes and pastries
Yoghurt and fromage frais
Confectionery
Fruit juice includingsmoothies
Soft drinks, non diet
Food groups eachcontributing less than 5% tototal NMES intake
Survey of sugar intake among children in Scotland - Summary report
9

Intake of fat and saturated fatty acids
The overall intake of total fat and saturated fatty acids as % food energy were 32.9% and13.8% respectively. There were no significant differences between boys and girls in theintake of total fat or saturated fatty acids as % food energy. The intake of total fat wasnot significantly different between the age groups but the intake of saturated fatty acidsas % food energy was significantly higher in the 3-7 year olds. There was no significantassociation between total fat or saturated fatty acids as % food energy and SIMD.
There were significant differences and a linear association between deprivation and thecontribution of processed meats, crisps and savoury snacks to the intake of total fat andsaturated fatty acids. The intake of these food groups increased with increasingdeprivation.
The mean intake of total fat as % food energy (32.9%) was lower than the UKrecommended population average (35%) and the Scottish Dietary Target (≤35%) in all ageand sex groups. The mean intake of saturated fatty acids (13.8%) was above therecommended level of 11% food energy in all age and sex groups.
Comparison of NMES and total fat and saturated fatty acids as % food energy withother UK-wide diet surveys in children
The results for NMES were slightly higher than values reported in other UK-wide dietarysurveys, but the results for total fat and saturated fatty acids were a little lower thanvalues reported in the same surveys (Table 3).
% food energy Present Scottish LIDNS6 NDNS7
survey 2004 (age 2-18y) 1997 (age 4-18y)2006 (age 3-16y)
NMES
Boys 17.4 17.1 16.7
Girls 17.4 16.5 16.4
Total fat
Boys 32.9 36.1 35.4
Girls 33.0 35.7 35.9
Saturated fatty acids
Boys 13.9 14.2 14.2
Girls 13.7 14.0 14.3
Table 3: Comparison with other UK-wide diet surveys in children
Survey of sugar intake among children in Scotland - Summary report
10

Survey of sugar intake among children in Scotland - Summary report
11
Overweight and Obesity
Overall the prevalence of overweight and obesity, using UK reference data8 was 14% and17% respectively which was similar to that reported in the 2003 Scottish Health Survey(SHS)9. There were no significant differences between the sexes in the prevalence ofoverweight and obesity overall, 13% of boys and 15% of girls were overweight and 16% ofboys and 18% of girls were obese.
There was no evidence of a linear association between BMI and deprivation. Children inthe least deprived (1st) quintile had the lowest mean BMI (17.9 kg/m2) while those in the2nd quintile had the highest (18.6 kg/m2).
There was an overall association but no linear association between prevalence of thecombined category of overweight including obese and SIMD. The highest proportion ofchildren in the overweight including obese category appeared in the middle (3rd) quintile,(33% boys and 38% for girls). The lowest proportion of children in this category was in theleast deprived (1st) quintile (25% for both sexes).
There was little evidence for differences in the intake of foods or nutrients between thechildren who were neither overweight nor obese and the overweight or obese children.However, it is recognised that cross-sectional analysis may be affected by dietary restraintin the overweight and obese groups or by differential reporting bias between overweightand obese and non-overweight or obese children, and that these effects could obscurerelationships between diet and weight gain.
Physical Activity
Children’s physical activity levels were categorised as:
High: active for 60 minutes on 7 days in the last week.
Medium: active for 30-59 minutes on 7 days in the last week.
Low: active at a lower level or not active at all.
Any activity during school lessons was not included in these estimates.
Overall, 86% of children reached the ‘high’ activity level – the current recommended levelfor children, though it should be noted that fieldwork for this survey was conducted overthe summer months including the school summer holidays when activity levels may havebeen higher than at other times of year.
More boys reached the high level of physical activity than girls (89% vs. 83%). A further 5%of boys and 9% of girls reached the medium activity level. There was a decline in activitylevels in the 12-17 year age group in both sexes but the decline was greater for girls than boys.
There was no clear pattern in the relationship between those meeting the physical activityrecommendations and deprivation.
Time spent at a screen
Boys spent an average of 2.2 hours a day and girls 2.0 hours a day sitting in front of ascreen (TV, computer or video game). The time spent in front of a screen increased linearlywith age group for both sexes, 14% of both boys and girls, aged 12-17 years, spending onaverage 4 hours a day in front of a screen compared to 5% of boys and 4% of girls in theyoungest age group (aged 3-7 years).
Physical Activity and BMI
To examine the levels of physical activity by BMI, children were classified into one of twoBMI groups; neither overweight nor obese or overweight including obese.
A higher proportion of children in the neither overweight nor obese category reached therecommended level compared with those in the overweight including obese category (88%vs. 81%). The differences were not significant for the oldest age group (12-17 year olds).
For all children and for boys alone there was a significant association between BMIcategory and time spent sitting in front of a screen. A higher proportion of children in theoverweight including obese category reported spending more than 3 hours in front of ascreen than those in the neither overweight nor obese category (25% vs. 20%). For boysthe proportions were 28% vs. 21%.
Dental Health
Over half (56%) of all children had received treatment for decay (either fillings or teethtaken out), and the likelihood of having received treatment for decay increased with age.The proportion of children receiving treatment for decay rose from 26% among 3-7 yearolds to 74% among 12-17 year olds.
Treatment for decay was associated with increasing deprivation in both sexes. Boys in themost deprived quintile were twice as likely to have had treatment for decay as boys in theleast deprived quintile (71% vs. 35% respectively). For girls the difference between thehighest and lowest quintiles was not as great (65% vs. 43%).
Association between diet and dental disease
NMES intake was significantly higher in children who had received treatment for decay(mean 18.5% food energy) than in children who had not (mean 16.1% food energy). Thisdifference was significant in boys and in girls, and was more evident in older children thanin younger children. There was no association between total sugars intake and treatmentfor decay. Children who had received treatment for decay had significantly higher intakesof biscuits, cakes and pastries, confectionery, crisps and savoury snacks, and non-diet softdrinks than children who had never received treatment for decay.
Survey of sugar intake among children in Scotland - Summary report
12

Survey of sugar intake among children in Scotland - Summary report
13
Conclusions The study provides clear evidence that the intake of NMES was considerably higher thanthe Scottish Dietary Target of <10% of total energy in all children and in all sub-groups. Theintake of NMES was particularly high in older children and those living in more deprivedareas, mainly due to high consumption of non-diet soft drinks, confectionery, biscuits,cakes and pastries. The mean NMES intake was significantly higher in children who hadbeen treated for dental decay suggesting that the high intake of NMES is likely to becontributing to dental disease. There was little evidence from this study that differencesin the intake of foods or nutrients between children was associated with overweight orobesity, possibly due to underreporting or dietary restraint in the overweight and obesegroups. However, as obesity results from an imbalance between energy intake andexpenditure, reducing intake of energy by reducing NMES intake could make a positivecontribution to prevention of overweight and obesity as well as bringing the diet more inline with dietary recommendations.
Implications for further research
Use of the Child Benefit records as the sampling frame should be considered in anyfuture study monitoring children’s diets in Scotland.
This survey provides a sound baseline for future studies of NMES and fat intake ofchildren in Scotland, which could be used for monitoring the impact of Scottishpolicy initiatives aimed at improving children’s diet.
The FFQ as used in this study proved to be a cost effective and robust method formeasuring intake of NMES, total fat and saturated fatty acids as percentage foodenergy.
The results provide baseline data which could be developed as a longitudinal studyof diet and health. This could present more useful information on the relationshipbetween diet and the development of overweight and obesity. A longitudinalstudy of the present survey population could also investigate whether low physicalactivity precedes or succeeds weight gain.
To investigate whether the energy intake of overweight or obese children is under-reported to a greater extent than neither overweight nor obese children anobjective estimate of energy intake would be required e.g. using doubly labelledwater to measure habitual energy expenditure.
The possibility of an association between physical activity (or inactivity) and intakeof energy, NMES, total fat and saturated fatty acids could be explored. However,more detailed information on the type, intensity and duration of activities wouldbe beneficial.

The fact that there was no association between total sugars intake and treatmentfor tooth decay but there was a clear association with NMES intake suggests thatthis component of foods contributes to the risk of dental decay and also suggeststhat the FSA’s current sugars classification is useful in identifying the componentsof the diet which adversely affect dental health.
Implications for health improvement
The main finding of the present survey was that the intake of NMES as % foodenergy was much higher than recommended in the whole population and in all sub-groups. The foods contributing to NMES varied significantly with socio-economicstatus, therefore in order to reduce the levels of NMES intake different approachesmay be needed in different sectors of the population.
Scottish policy initiatives such as ‘Hungry for Success’10 which focus on improvingthe provision of food in schools should have beneficial effects on NMES intakewithin schools but wider initiatives may be needed to reduce the intake of foodshigh in NMES outside schools to reach the recommended level of intake.
The results of the present survey highlights the magnitude of dietary changerequired to reach the dietary targets for NMES, total fat and saturated fatty acidsin Scotland. To meet current Scottish dietary targets the intake of NMES (g/d)would have to decrease by 40% and the intake of saturated fatty acids (g/d) by 20%.To achieve these targets and significantly improve the diets of children in Scotland,intakes of non-diet soft drinks, biscuits, cakes and pastries and confectionery needto be severely restricted and most of the energy provided by these foods replacedby encouraging the consumption of foods rich in complex carbohydrate such asbread, potatoes, rice, and pasta.
Overall, a major change in children’s dietary habits is required to a) reduceconsumption of sugary drinks and snacks, b) improve the balance of mealcomposition to include less saturated fatty acids and sugar and more complexcarbohydrates. To support parents and children to achieve this change a wide rangeof initiatives addressing food marketing and catering practices, nutrition knowledgeand the cooking skills of parents and children are essential.
Survey of sugar intake among children in Scotland - Summary report
14

Consideration should be given to repeating this survey at regular intervals toprovide data on ongoing progress made towards Scottish Dietary Targets for NMESand saturated fatty acid intake. Such a survey would also serve to evaluate theimpact of policy initiatives directed at improving children’s diet.
Measures need to be taken to reduce the high intake of the main sources of NMESidentified in this survey, namely non-diet soft drinks, biscuits, cakes and pastries andconfectionery.
Research is needed to develop interventions to reduce intake of NMES andsaturated fatty acids in children’s diets to reach the Scottish Dietary Targets. Inaddition, measures need to be taken to ensure that a reduction in NMES andsaturated fatty acids is accompanied by an increase in foods rich in complexcarbohydrate to provide a healthy, balanced diet.
Recommendations
Survey of sugar intake among children in Scotland - Summary report
15

References
1 The Scottish Office Department of Health. Eating for Health: A Diet Action Planfor Scotland. Edinburgh, 1996.
2 Report of the Working Group on Monitoring Scottish Dietary Targets. Aberdeen,Food Standards Agency Scotland, 2004.
3 Department of Health, Committee on Medical Aspects of Food Policy. DietarySugars and Human Disease: Report of panel on dietary sugars. London, HMSO, 1989.
4 National Diet and Nutrition Survey: adults aged 19 to 64 years: Technical Report:Appendix H, London, The Stationery Office, 2004.
5 Department of Health. Dietary Reference Values for Food Energy and Nutrients forthe United Kingdom. Report on Health and Social Subjects No. 41. London, HMSO,1991. http://statistics.defra.gov.uk/esg/publications/efs
6 Nelson M, Erens B, Bates B, Church S, Boshier T (eds). Low Income Diet andNutrition Survey. London, TSO (The Stationery Office), 2007.
7 Gregory J, Lowe S, Bates CJ, Prentice A, Jackson LV, Smithers G, Wenlock R, FarronM. National Diet and Nutrition Survey: young people aged 4 to 18 years. London,The Stationery Office, 2000.
8 Cole TJ, Freeman JV, Reece MA. Body Mass Index reference curves for the UK, 1990.Archives of Disease in Childhood 1995;73:25-9.
9 Bromley C, Sproston K, Shelton N (Eds) The Scottish Health Survey 2003 (Vol 3).Edinburgh, The Stationary Office, 2005.
10 Hungry for Success: A Whole School Approach to School Meals in Scotland 2003.http://www.scotland.gov.uk/Publications/2003/02/16273/17566
Survey of sugar intake among children in Scotland - Summary report
16

Appendix
Comparison of methods of dietary assessment
The methodology for assessing intake in dietary surveys needs to be carefully chosen to befit for purpose according to the population group and the nutrients of interest. For thepresent study, Food Frequency Questionnaires (FFQ) were considered to be the mostappropriate method due to the ability to estimate intake over several months and the cost-efficiency for a large-scale survey.
To evaluate the FFQ method compared with 24-hour multiple pass recall and diet diaries,two randomly selected sub-samples were drawn from the whole sample. One sub-samplewas asked to complete a four day diet diary, the other, drawn from only 40 of the postcodesectors, was asked to complete a single 24-hour recall.
A total of 186 diaries (60%) were completed and returned and 424 24-hour recalls (99%)were completed.
Nutrient intakes as recorded by the FFQ and either the diet diary or 24-hour recall werecompared for 153 and 350 children respectively. Energy intake from the FFQ was 10.5%higher that that from the diet diary and 5.5% higher than that for the 24-hour recall. Thedifference in energy intake between the FFQ and diet diary was greater in children aged3-11 years (14.6%; p<0.001) than those aged 12-17 years (5.6%; p>0.05).
In the diet diary sub-group the intake of NMES (% food energy) as recorded by the FFQ(16.0%) was not significantly different from that recorded by the diet diary (14.9%). In the 24-hour recall sub-group the intake of NMES (% food energy) as recorded by the FFQ was alsovery similar by the FFQ (17.4%) and the 24-hour recall (16.6%) though this difference wasstatistically significant. There was no significant difference in intake of total fat or saturatedfatty acids as % food energy between the FFQ and either the diet diary or the 24-hourrecall. Absolute intakes of iron, calcium and all macronutrients apart from protein were allsignificantly higher as recorded in the FFQ than in the diet diaries or the 24-hour recall.
It was concluded that the FFQ provided reliable estimates of NMES, total fat andsaturated fatty acids as % food energy. Intakes of other nutrients from the FFQ should notbe compared with absolute values such as recommendations, though may be of value inassessing differences in intake between sub-groups of the population.
Survey of sugar intake among children in Scotland - Summary report
17

Survey of sugar intake among children in Scotland - Summary report
18

Blank

For more information and advice about food,visit the Food Standards Agency’s websites:
eatwell.gov.uk
food.gov.uk
salt.gov.uk
Food Standards Agency publicationsTo order further copies of this or other publications producedby the Agency, contact Food Standards Agency Publications:
tel 0845 606 0667minicom 0845 606 0678fax 020 8867 3225email [email protected]
Published by the Food Standards Agency March 2008Designed by Celeritas UK Limited Print by Oakfield Press .5k
© Crown copyright 2008
Printed in England on paper comprising a minimum of 75% recycled fibre FSA/0308
When you have finshed withthis publication please recycle it