sugars and dental caries - amazon web servicesasn-cdn-remembers.s3.amazonaws.com/dbf4abc1e... ·...
TRANSCRIPT

Sugars and dental caries: evidence for setting a recommended
threshold
Paula Moynihan Professor of Nutrition and Oral Health
Director, Centre for Oral Health Research
1
WHO Collaborating Centre for Nutrition & Oral Health
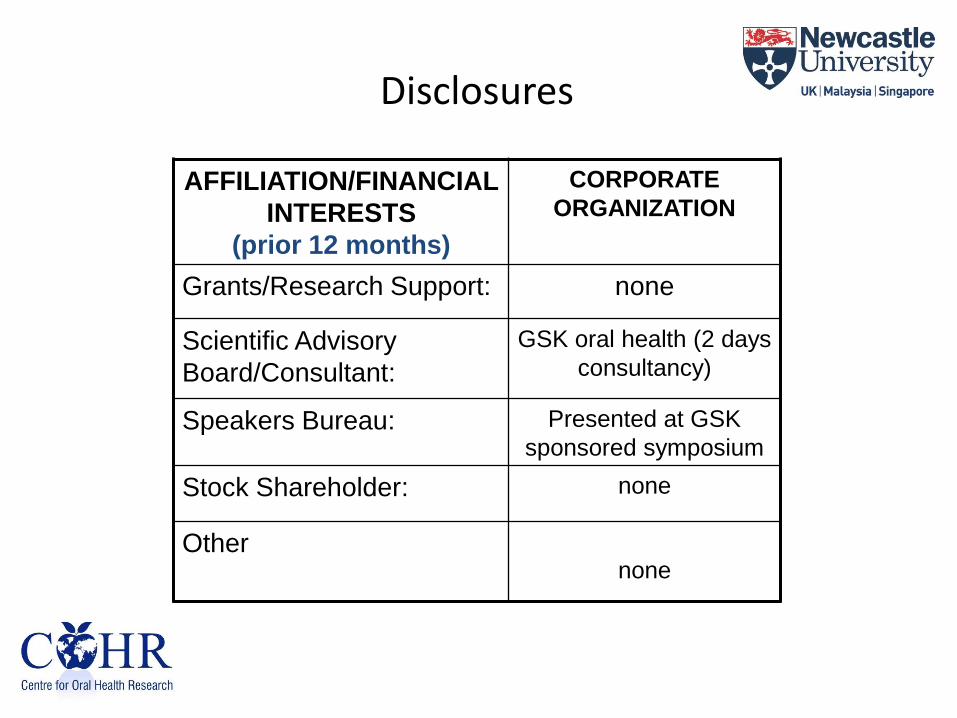
Disclosures
AFFILIATION/FINANCIAL
INTERESTS
(prior 12 months)
CORPORATE
ORGANIZATION
Grants/Research Support: none
Scientific Advisory
Board/Consultant:
GSK oral health (2 days
consultancy)
Speakers Bureau: Presented at GSK
sponsored symposium
Stock Shareholder: none
Other
none

Impact of dental caries • Dental caries is the world’s most
prevalent chronic disease
• Dental caries has a negative impact on quality of life: – pain and anxiety – time lost from work and school – eventual tooth loss
• The direct costs of treating dental
disease costs between 6 and 10% of health care budgets in industrialised countries
• Prevention is more cost effective
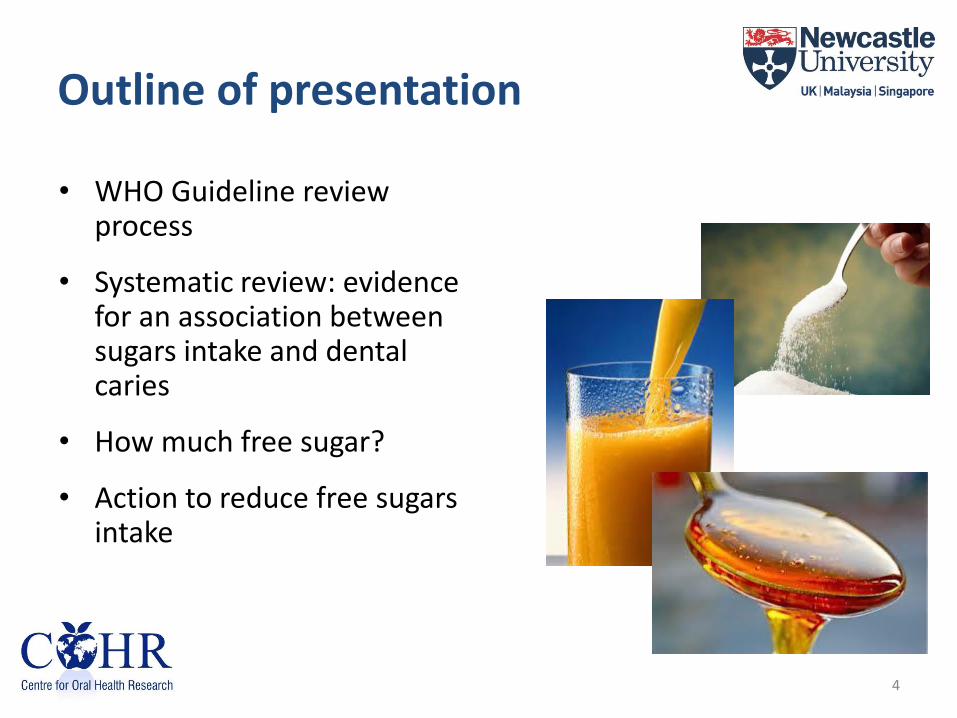
Outline of presentation
• WHO Guideline review process
• Systematic review: evidence for an association between sugars intake and dental caries
• How much free sugar?
• Action to reduce free sugars intake
4

Dentine
Enamel
Dental caries: lifelong risk
5.9
5.4
pH
Plaque bacteria (e.g. mutans streptococci) metabolize dietary sugars to acid Acid demineralizes tooth enamel hydroxyapetite (calcium phosphate crystals) Saliva is alkali (bicarbonate) and neutralizes plaque acids and aids re-mineralization

Dietary Sugars
Mono and di saccharides glucose, galactose, fructose sucrose, maltose, lactose Added sugars all added mono-and di-saccharides. Sometimes includes honey and
syrups e.g. maple syrup, agave nectar Natural sugars Sugars physically located in the cellular structure of grains, fruits
and vegetables plus those naturally present in milk and milk products
Free sugars (WHO, 2014) All sugars added by manufacturer, cook or consumer plus the sugars naturally present in honey and syrups, fruit juices and concentrates

WHO Draft Guideline
Recommendations • WHO recommends reduced intake of free sugars throughout the life-
course (strong recommendation).
• In both adults and children, WHO recommends that intake of free sugars not exceed 10% of total energy (strong recommendation).
• WHO suggests further reduction to below 5% of total energy (conditional recommendation).
Remarks • For countries with low free sugars intake, levels should not be increased
• The recommendation to further limit free sugars intake to less than 5% of total energy is further based on the recognition that dental caries tracks from childhood to adulthood; in order to minimize lifelong risk of dental caries, the consumption of free sugars should be as low as possible
7

Sugars intake US and UK
• NHANES USA (Drewnowski and Rehm 2014):
– 20-50 years 14.4% energy from added sugar
– 51+ years 11.6% energy from added sugars
• UK National Diet and Nutrition Survey (Public Health England) non-milk extrinsic (FREE) sugars – 4-10 years 14.7%
– 11-16 years 15.6%
– 19-64 years 12.5%
– 65+ 11.5%
8
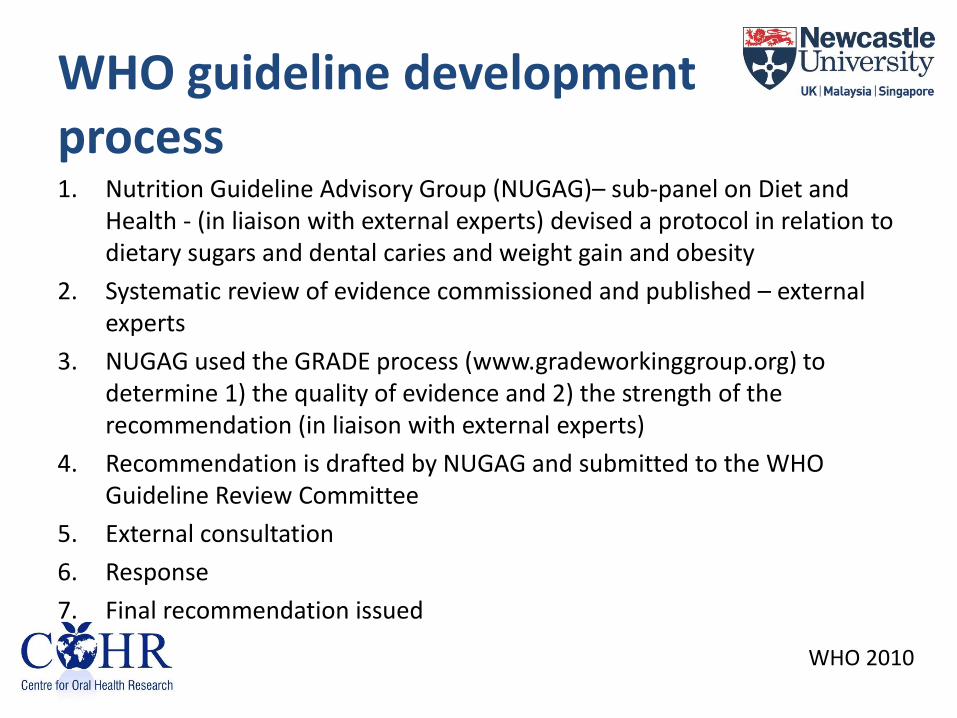
WHO guideline development process 1. Nutrition Guideline Advisory Group (NUGAG)– sub-panel on Diet and
Health - (in liaison with external experts) devised a protocol in relation to dietary sugars and dental caries and weight gain and obesity
2. Systematic review of evidence commissioned and published – external experts
3. NUGAG used the GRADE process (www.gradeworkinggroup.org) to determine 1) the quality of evidence and 2) the strength of the recommendation (in liaison with external experts)
4. Recommendation is drafted by NUGAG and submitted to the WHO Guideline Review Committee
5. External consultation
6. Response
7. Final recommendation issued
WHO 2010

Update of WHO sugars guidelines Systematic review
• What is the effect of a reduction/increase in the amount of sugars intake on dental caries?
• Will limiting sugars intake to <10% energy intake prevent dental caries?
• Will limiting sugars intake to <5% energy intake prevent dental caries?
Moynihan & Kelly 2014 J Dent Res
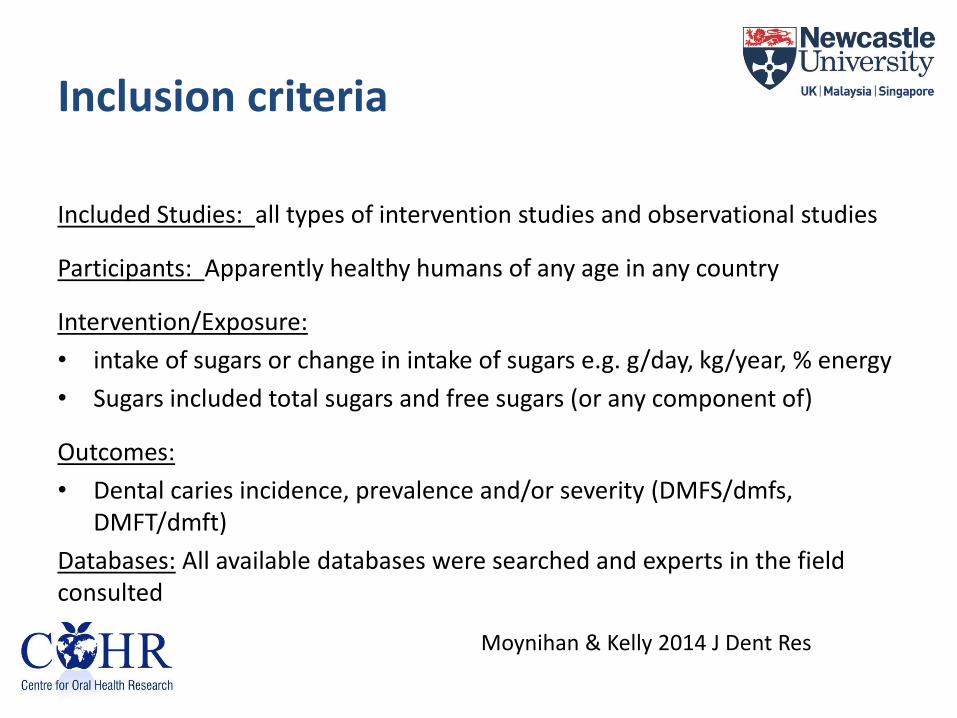
Inclusion criteria
Included Studies: all types of intervention studies and observational studies
Participants: Apparently healthy humans of any age in any country
Intervention/Exposure:
• intake of sugars or change in intake of sugars e.g. g/day, kg/year, % energy
• Sugars included total sugars and free sugars (or any component of)
Outcomes:
• Dental caries incidence, prevalence and/or severity (DMFS/dmfs, DMFT/dmft)
Databases: All available databases were searched and experts in the field consulted
Moynihan & Kelly 2014 J Dent Res
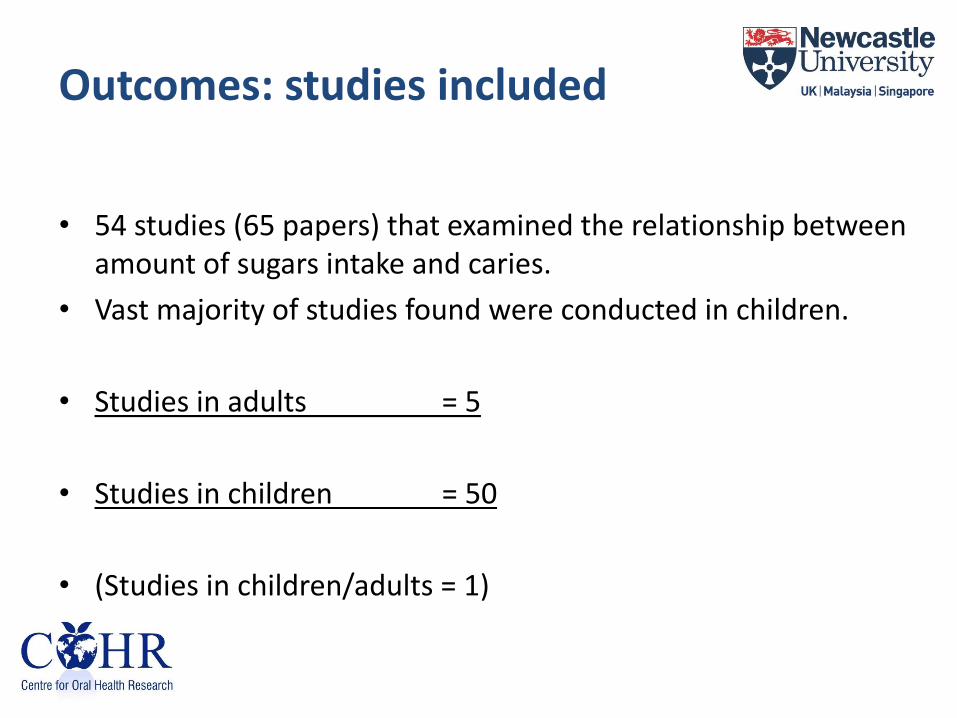
Outcomes: studies included
• 54 studies (65 papers) that examined the relationship between amount of sugars intake and caries.
• Vast majority of studies found were conducted in children.
• Studies in adults = 5
• Studies in children = 50
• (Studies in children/adults = 1)

Studies of Adults Summary of exposure/outcome relationship
Study type First author Year Country n +/0/-
Non-randomised Interventions
Scheinen 1975 Finland 125 +
Gustaffson 1954 Sweden 663 +
Longitudinal (cohort) None
Population Fisher/ Holloway
1968/ 1963
UK 219 +/+/+/+/+ (5 age groups)
Cross-sectional Newburn 1980 USA and Switzerland
31 +
Papas 1995 USA 141 +

Studies of children Summary of exposure/outcome relationship
Study type First author Year Country n +/0/-
Longitudinal (cohort)
Battelino 1997 Argentina 820 +
Rodrigues 1999/2000 Brazil 510 +
MacKeown 2000 S.Africa 259 0
Karjaleinen 2001 Finland 135 +
Stecksen- Blicks
1986 Sweden 88 97
+/+ (2 age gps)
Ruottinen 2004 Finland 66 +
Rugg-Gunn 1984/1987 England 405 +
Burt, Spuznar 1988/1994/ 1995
USA 499 +
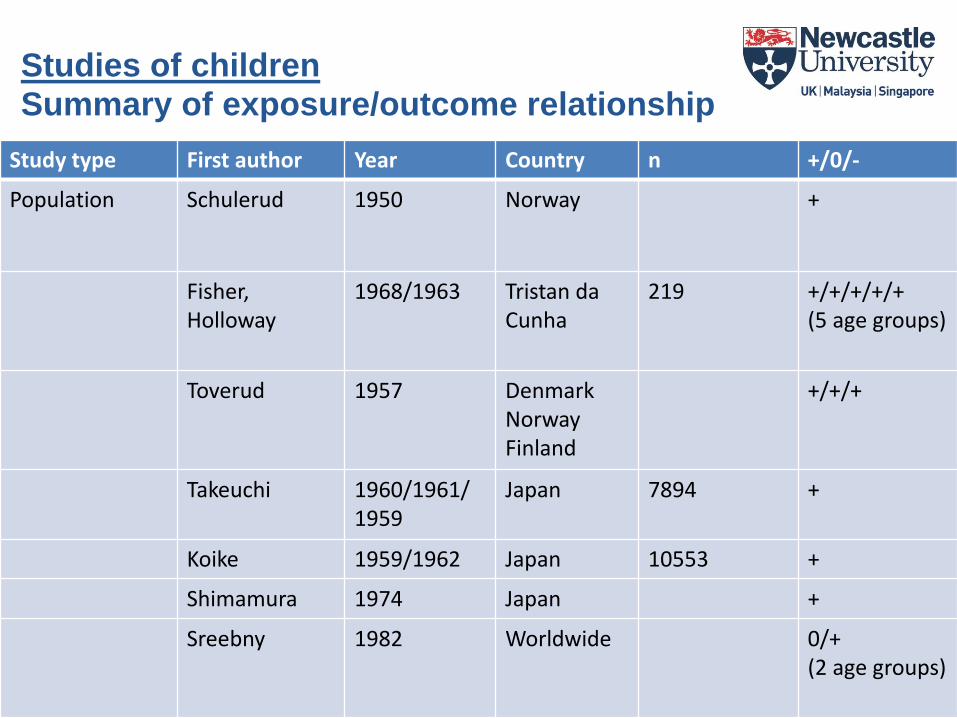
Studies of children
Summary of exposure/outcome relationship
Study type First author Year Country n +/0/-
Population Schulerud 1950 Norway +
Fisher, Holloway
1968/1963 Tristan da Cunha
219 +/+/+/+/+ (5 age groups)
Toverud 1957 Denmark Norway Finland
+/+/+
Takeuchi 1960/1961/ 1959
Japan 7894 +
Koike 1959/1962 Japan 10553 +
Shimamura 1974 Japan +
Sreebny 1982 Worldwide 0/+ (2 age groups)

Studies of children
Summary of exposure/outcome relationship
Study type First author Year Country n +/0/-
Population Kunzel 1982/1983 Germany >200,000 +/+ (ages)
Birkhed 1989 Sweden +/+ (ages)
Downer 1999 UK +/+ (ages)
Jamel 2004 Iraq +/+/+ (ages)
Buttner 1971 Worldwide +
Marthaler 1990 Worldwide +
Sivaneswaran 1993 Australia +
Woodward 1994 Worldwide +
Miyazaki 1996 Japan +
Ruxton 1999 Worldwide 0
Diehnelt 2001 Worldwide +
Downer 2008 Europe -
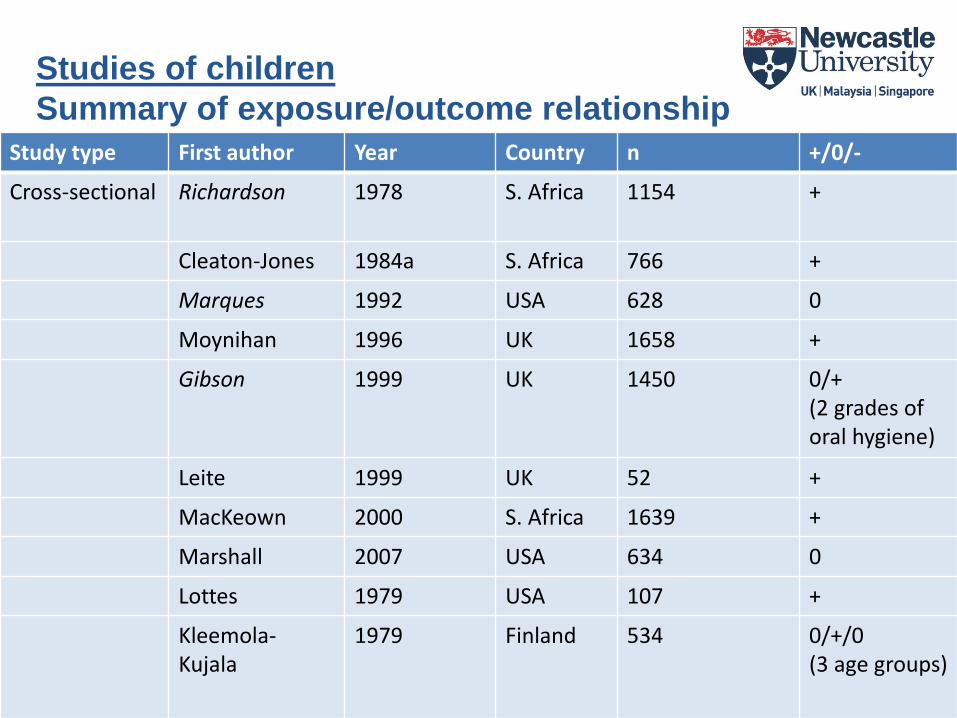
Studies of children
Summary of exposure/outcome relationship Study type First author Year Country n +/0/-
Cross-sectional Richardson 1978 S. Africa 1154 +
Cleaton-Jones 1984a S. Africa 766 +
Marques 1992 USA 628 0
Moynihan 1996 UK 1658 +
Gibson 1999 UK 1450 0/+ (2 grades of oral hygiene)
Leite 1999 UK 52 +
MacKeown 2000 S. Africa 1639 +
Marshall 2007 USA 634 0
Lottes 1979 USA 107 +
Kleemola-Kujala
1979 Finland 534 0/+/0 (3 age groups)

Studies of children
Summary of exposure/outcome relationship Study type First author Year Country n +/0/-
Cross-sectional Cleaton-Jones 1984 S. Africa 715 0
Akyuz 1996 Turkey 120 +
Yabao 2005 Phillipines 1200 +
Martinsson 1972 Sweden 307 +/- (boys/girls)
Retief 1975 S.Africa 750 +
Walker 1981 S. Africa 2642 +
Steyn 1987 S. Africa 843 +/0
Larsson 1992/1997 Sweden 199 0
Beighton 1996 England 405 0
Arnadottir 1998 Iceland 150 +
MacIntyre 2006 S. Africa 50/50 +/+ (2 age gps)
Masson 2010 Scotland 2800 +
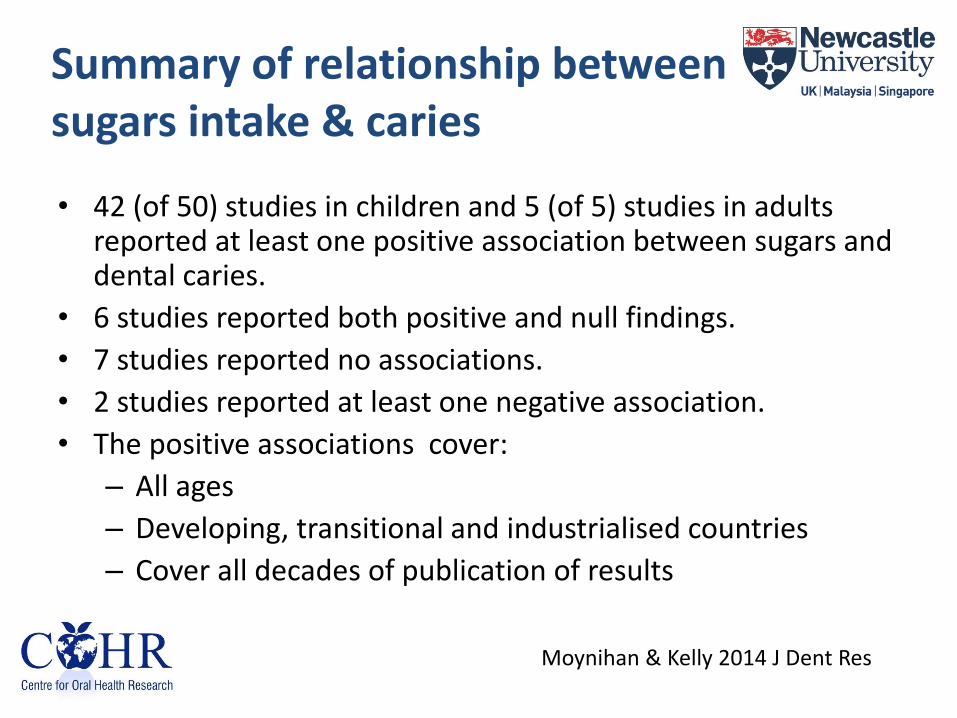
Summary of relationship between sugars intake & caries
• 42 (of 50) studies in children and 5 (of 5) studies in adults reported at least one positive association between sugars and dental caries.
• 6 studies reported both positive and null findings.
• 7 studies reported no associations.
• 2 studies reported at least one negative association.
• The positive associations cover:
– All ages
– Developing, transitional and industrialised countries
– Cover all decades of publication of results
Moynihan & Kelly 2014 J Dent Res
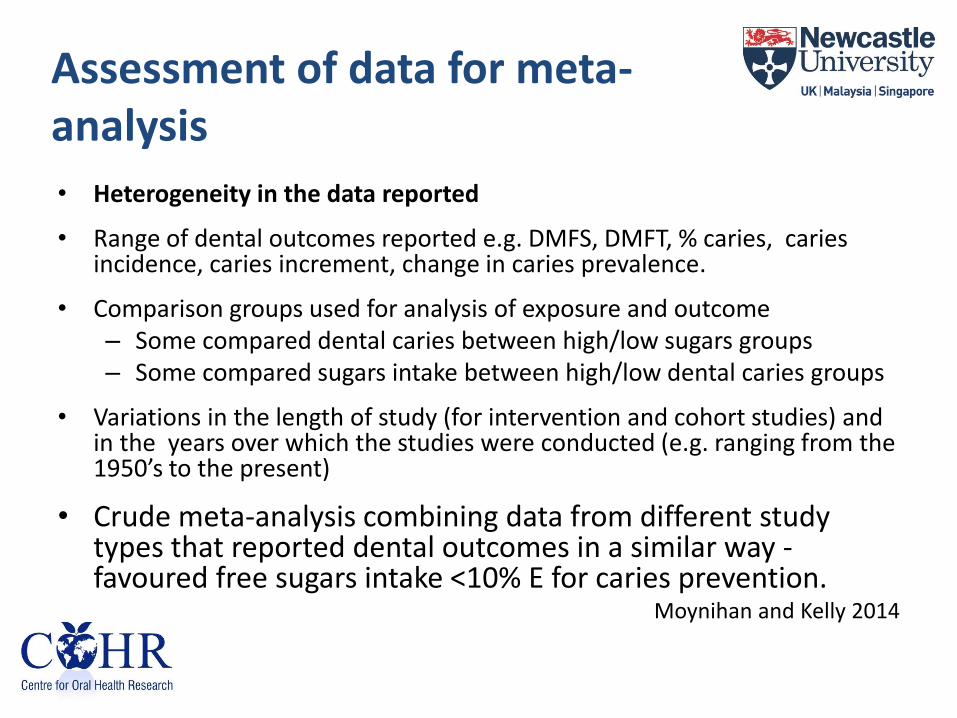
Assessment of data for meta-analysis
• Heterogeneity in the data reported
• Range of dental outcomes reported e.g. DMFS, DMFT, % caries, caries incidence, caries increment, change in caries prevalence.
• Comparison groups used for analysis of exposure and outcome – Some compared dental caries between high/low sugars groups – Some compared sugars intake between high/low dental caries groups
• Variations in the length of study (for intervention and cohort studies) and in the years over which the studies were conducted (e.g. ranging from the 1950’s to the present)
• Crude meta-analysis combining data from different study types that reported dental outcomes in a similar way - favoured free sugars intake <10% E for caries prevention.
Moynihan and Kelly 2014
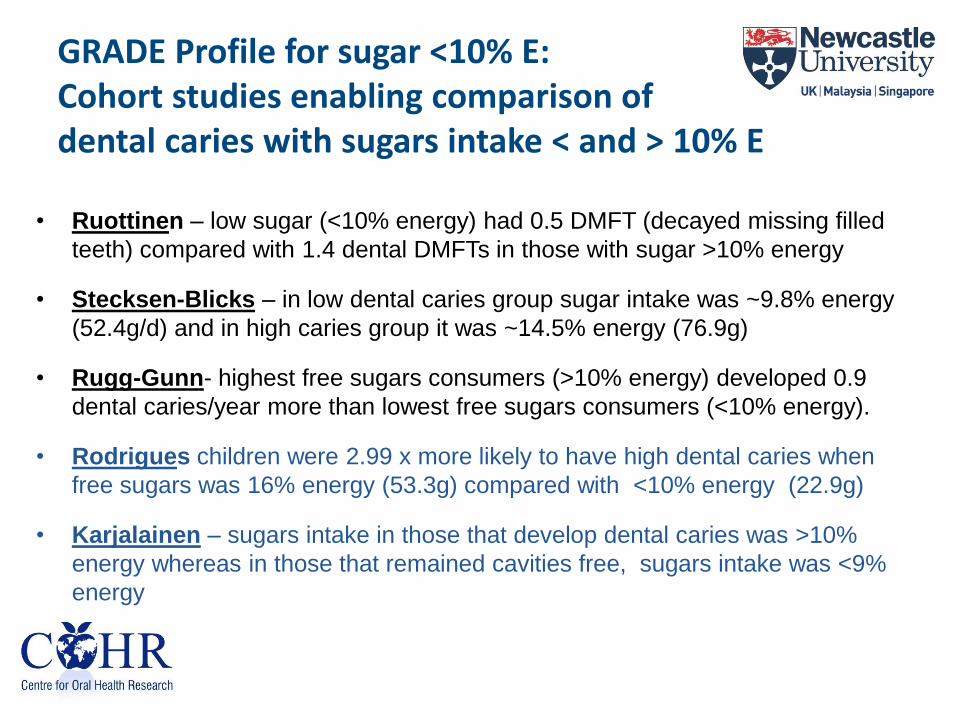
GRADE Profile for sugar <10% E: Cohort studies enabling comparison of dental caries with sugars intake < and > 10% E
• Ruottinen – low sugar (<10% energy) had 0.5 DMFT (decayed missing filled
teeth) compared with 1.4 dental DMFTs in those with sugar >10% energy
• Stecksen-Blicks – in low dental caries group sugar intake was ~9.8% energy
(52.4g/d) and in high caries group it was ~14.5% energy (76.9g)
• Rugg-Gunn- highest free sugars consumers (>10% energy) developed 0.9
dental caries/year more than lowest free sugars consumers (<10% energy).
• Rodrigues children were 2.99 x more likely to have high dental caries when
free sugars was 16% energy (53.3g) compared with <10% energy (22.9g)
• Karjalainen – sugars intake in those that develop dental caries was >10%
energy whereas in those that remained cavities free, sugars intake was <9%
energy

Dental caries is still occurring in children when free sugars intake is ≤10% energy Study Dental caries levels in group consuming
<10% energy as free sugars Dentition Country
Rodrigues Children developed 1 cavity in one year primary Brazil
Karjalainen no cavities developed primary Finland
Ruottinen Children had 0.5 cavities Permanent Finland
Rugg-Gunn Children developed 3.2 DMFS in 2 years Permanent England
Stecksen-Blicks
Children developed 0-2 cavities in 1 year Permanent Sweden
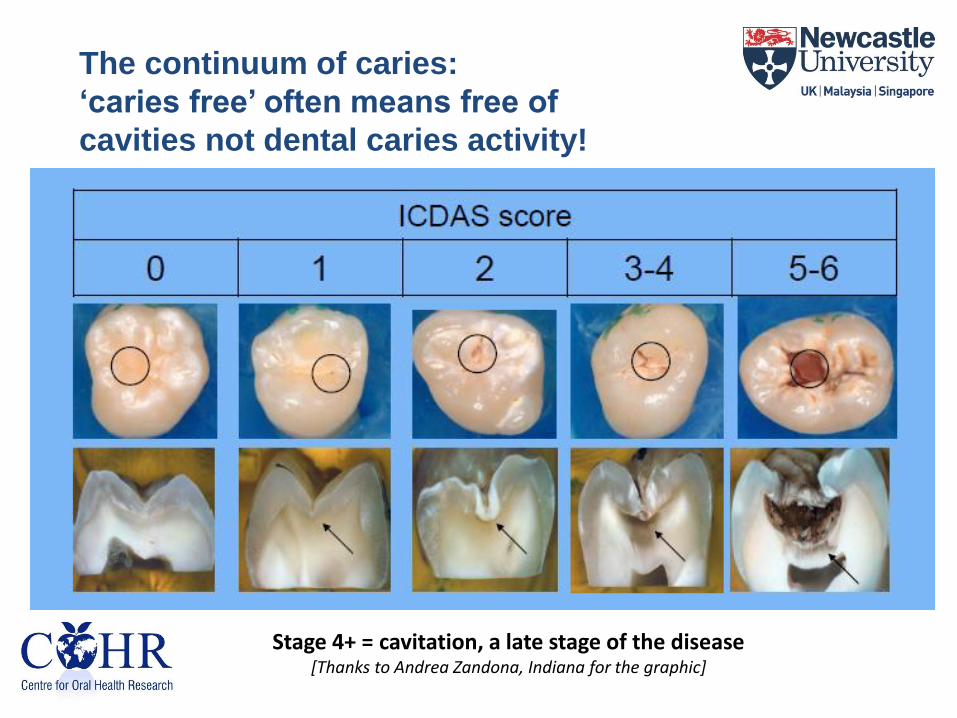
The continuum of caries:
‘caries free’ often means free of
cavities not dental caries activity!
Stage 4+ = cavitation, a late stage of the disease [Thanks to Andrea Zandona, Indiana for the graphic]
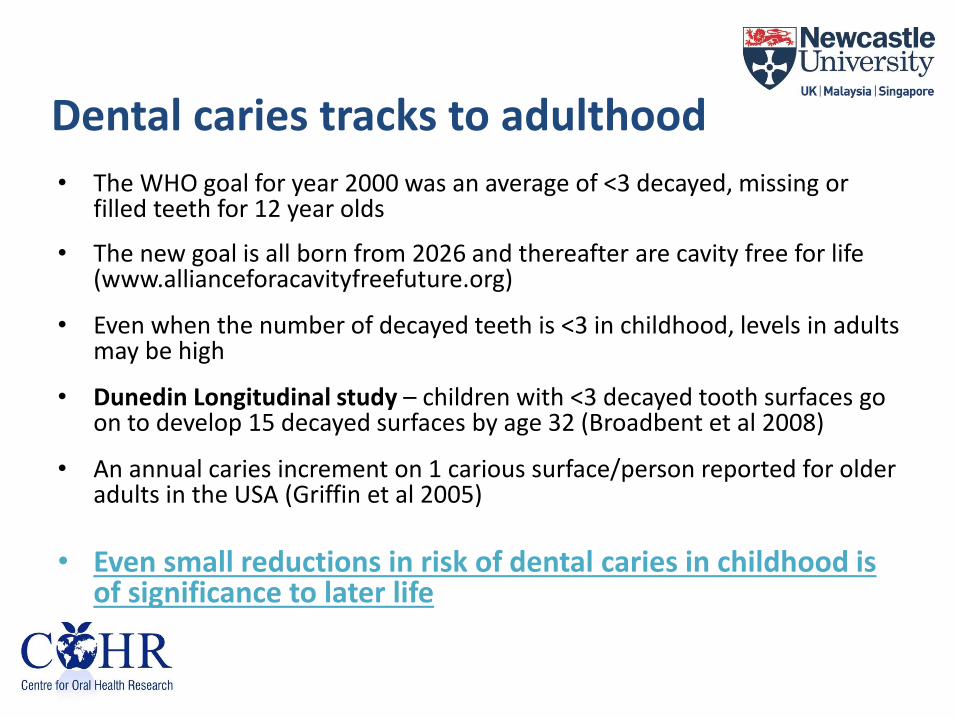
Dental caries tracks to adulthood
• The WHO goal for year 2000 was an average of <3 decayed, missing or filled teeth for 12 year olds
• The new goal is all born from 2026 and thereafter are cavity free for life (www.allianceforacavityfreefuture.org)
• Even when the number of decayed teeth is <3 in childhood, levels in adults may be high
• Dunedin Longitudinal study – children with <3 decayed tooth surfaces go on to develop 15 decayed surfaces by age 32 (Broadbent et al 2008)
• An annual caries increment on 1 carious surface/person reported for older adults in the USA (Griffin et al 2005)
• Even small reductions in risk of dental caries in childhood is of significance to later life

What is the effect on dental caries of restricting sugars intake to <10kg/person/year (5%)? • The strongest study design available for the GRADE profile was
national ecological studies • 3 national ecological studies enabled comparison of dental caries
when annual per capita sugars intake was <10kg (~5% E) with when it was >10kg but < 18.25 kg (~10% E)
• All showed lower levels of dental caries/lower dental caries progression when per capita sugar was ≤ 10kg / year compared with >10kg but <18.25 kg / year
• All studied showed strong correlations between sugars intakes from 0.2-15kg per year (r= +0.7- +0.8)
• The GRADE profile classified this ecological evidence as very low quality
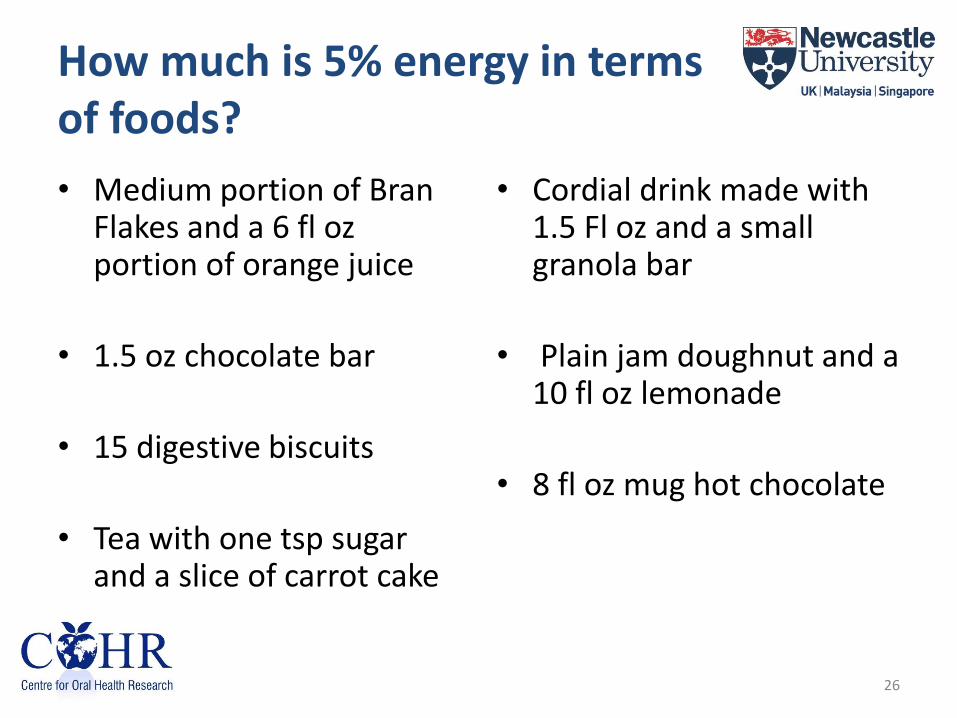
How much is 5% energy in terms of foods?
• Medium portion of Bran Flakes and a 6 fl oz portion of orange juice
• 1.5 oz chocolate bar
• 15 digestive biscuits
• Tea with one tsp sugar and a slice of carrot cake
• Cordial drink made with 1.5 Fl oz and a small granola bar
• Plain jam doughnut and a 10 fl oz lemonade
• 8 fl oz mug hot chocolate
26

Action required to reduce free sugars intake
• Produce less
• Market less
• Sell less
• Consume less
• Clear policy and consistent messages – Population, schools, workplace
• Education of public
• Education of health professionals
• Improved nutritional labelling of foods for ADDED sugars content
• Taxing high sugar foods ?
• Reformulation of food products
27
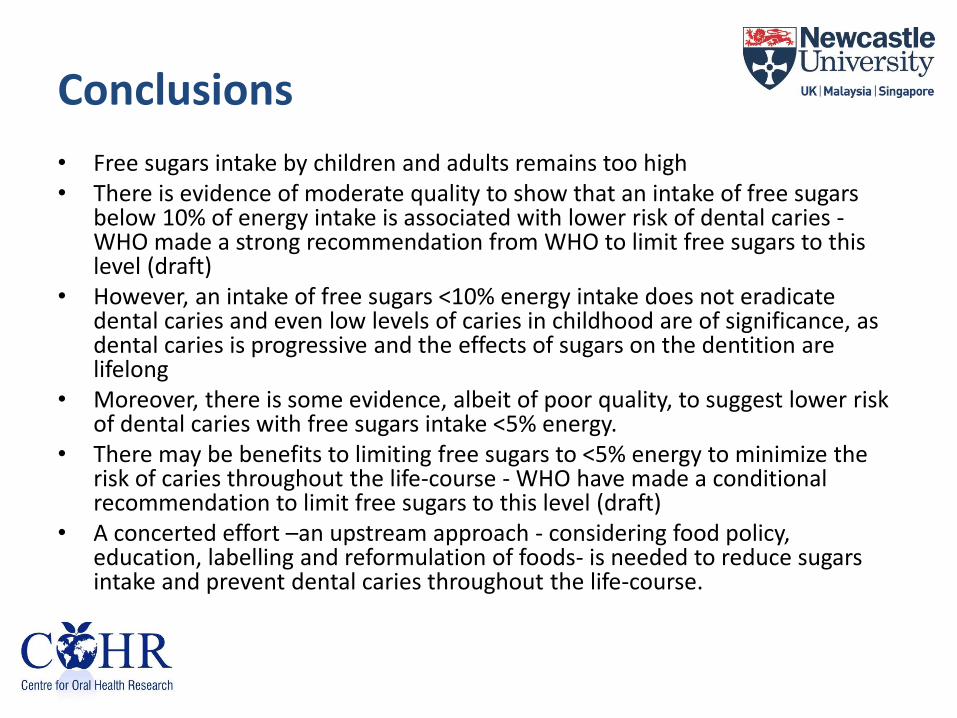
Conclusions
• Free sugars intake by children and adults remains too high • There is evidence of moderate quality to show that an intake of free sugars
below 10% of energy intake is associated with lower risk of dental caries - WHO made a strong recommendation from WHO to limit free sugars to this level (draft)
• However, an intake of free sugars <10% energy intake does not eradicate dental caries and even low levels of caries in childhood are of significance, as dental caries is progressive and the effects of sugars on the dentition are lifelong
• Moreover, there is some evidence, albeit of poor quality, to suggest lower risk of dental caries with free sugars intake <5% energy.
• There may be benefits to limiting free sugars to <5% energy to minimize the risk of caries throughout the life-course - WHO have made a conditional recommendation to limit free sugars to this level (draft)
• A concerted effort –an upstream approach - considering food policy, education, labelling and reformulation of foods- is needed to reduce sugars intake and prevent dental caries throughout the life-course.

Thank you
29