suggested citation: schoen, r. c., lavenia, m., bauduin, c ... · word problems factor for fall...
TRANSCRIPT
The research and development reported here were supported by the Institute of Education Sciences,
U.S. Department of Education, through Award No. R305A120781 to Florida State University. The
opinions expressed are those of the authors and do not represent views of the Institute or the U.S.
Department of Education.
Suggested citation: Schoen, R. C., LaVenia, M., Bauduin, C., & Farina, K. (2016). Elementary mathematics
student assessment: Measuring the performance of grade 1 and 2 students in counting, word problems, and computation in fall 2014 (Research Report No. 2016-04). Tallahassee, FL: Learning Systems Institute, Florida State University. DOI: 10.17125/fsu.1508174887.
Copyright 2016, Florida State University. All rights reserved. Requests for permission to use these
materials should be directed to Robert Schoen, [email protected], FSU Learning Systems Institute,
4600 University Center C, Tallahassee, FL, 32306.
Elementary Mathematics Student Assessment (EMSA)
Measuring the Performance of Grade 1 and 2 Students in Counting, Word Problems, and
Computation in Fall 2014
Research Report No. 2016-04
Robert C. Schoen
Mark LaVenia
Charity Bauduin
Kristy Farina
December 2016
Florida Center for Research in Science, Technology, Engineering, and Mathematics (FCR-STEM)
Learning Systems Institute
Florida State University
Tallahassee, FL 32306
(850) 644-2570
Measuring the Performance of Grade 1 and 2 Students in Counting, Word Problems, and Computation in Fall 2014
Acknowledgements P a g e | iv
Acknowledgements
A great many people were involved with the development, field-testing, data entry, data analysis, and
reporting. Here we name some of the key players and briefly describe their roles, starting with the
report coauthors.
Robert Schoen designed the test and managed the overall process of test development, external review,
editing and proofing, scoring, and interpreting the results. Mark LaVenia performed the data analysis for
the factor analytic models, reliability estimates, and regression models. Charity Bauduin managed the
report-writing process. Kristy Farina managed the data entry, verification, and management process and
assisted with preparation of descriptive statistics for the present report.
We would like to acknowledge the reviewers of early drafts of the EMSA tests and express our gratitude
for their contributions of expertise. These reviewers include Thomas Carpenter, Victoria Jacobs, and Ian
Whitacre.
Amanda Tazaz managed the distribution and collection of tests and consent forms for students. Anne
Thistle provided valuable assistance with editing the manuscript. Casey Yu provided valuable assistance
with laying out the style and format of the final version of the report.
We are especially grateful to the Institute of Education Sciences at the U.S. Department of Education for
their support and to the students, parents, principals, district leaders, and teachers who agreed to
participate in the study and contribute to advancing knowledge in mathematics education. Without
them, this work is not possible.
Measuring the Performance of Grade 1 and 2 Students in Counting, Word Problems, and Computation in Fall 2014
P a g e | v
Table of Contents
Acknowledgements ...................................................................................................................................... iv
Executive Summary ....................................................................................................................................... 1
Purpose ...................................................................................................................................................... 1
Content ...................................................................................................................................................... 1
Sample and Setting .................................................................................................................................... 1
Scoring ....................................................................................................................................................... 2
Reliability ................................................................................................................................................... 2
Predictive Validity ...................................................................................................................................... 2
Summary .................................................................................................................................................... 3
1. Introduction and Overview ........................................................................................................................ 4
1.1. Test Overview ..................................................................................................................................... 4
1.1.1. Section 1: Counting ...................................................................................................................... 5
1.1.2. Section 2: Word Problems ........................................................................................................... 5
1.1.3. Section 3: Computation ............................................................................................................... 6
1.2. Administration of Test ........................................................................................................................ 7
1.3. Description of the Sample .................................................................................................................. 7
2. Test Development ...................................................................................................................................... 9
2.1. Content ............................................................................................................................................... 9
2.2. Test Specifications .............................................................................................................................. 9
2.3. Item Development ............................................................................................................................ 10
2.4. Test Design and Assembly ................................................................................................................ 11
2.5. Test Production and Administration................................................................................................. 11
3. Data Entry and Analysis Procedures ........................................................................................................ 13
3.1. Data Entry and Verification Procedures ........................................................................................... 13
3.2. Data Analysis ..................................................................................................................................... 14
4. Results ...................................................................................................................................................... 17
4.1. Three-factor Test Blueprint .............................................................................................................. 17
4.2. Item Screening .................................................................................................................................. 17
4.2.1. Grade 1 Item Screening ............................................................................................................. 18
Measuring the Performance of Grade 1 and 2 Students in Counting, Word Problems, and Computation in Fall 2014
P a g e | vi
4.2.2. Grade 2 Item Screening ............................................................................................................. 20
4.3. Correlated Trait Model Evaluation ................................................................................................... 21
4.3.1. Grade 1 Correlated Trait Model Evaluation .............................................................................. 21
4.3.2. Grade 2 Correlated Trait Model Evaluation .............................................................................. 23
4.4. Higher-Order Model Evaluation ....................................................................................................... 25
4.4.1. Grade 1 Higher-order Model Evaluation ................................................................................... 25
4.4.2. Grade 2 Higher-order Model Evaluation ................................................................................... 27
4.5. Scale Reliability Evaluation ............................................................................................................... 29
4.5.1. Grade 1 Scale Reliabilities .......................................................................................................... 29
4.5.2. Grade 2 Scale Reliabilities .......................................................................................................... 32
4.6. Predictive Validity Evaluation ........................................................................................................... 34
5. Discussion and Conclusions ..................................................................................................................... 35
5.1. Validation .......................................................................................................................................... 35
5.1.1. Substantive Validation ............................................................................................................... 35
5.1.2. Structural Validation .................................................................................................................. 35
5.1.3. External Validation..................................................................................................................... 36
5.2. Summary and Conclusions ................................................................................................................ 36
References ................................................................................................................................................... 37
Measuring the Performance of Grade 1 and 2 Students in Counting, Word Problems, and Computation in Fall 2014
P a g e | vii
List of Appendices
Appendix AねFirst Grade Test...................................................................................................................... 39
Appendix BねSecond Grade Test ................................................................................................................. 52
Appendix CねFirst Grade Administration Guide .......................................................................................... 66
Appendix DねSecond Grade Administration Guide ..................................................................................... 79
Appendix EねDistributions of Number of Items Answered Correctly Within Each Factor ......................... 93
Appendix FねMost Common Incorrect Response for Each Item ................................................................. 96
Measuring the Performance of Grade 1 and 2 Students in Counting, Word Problems, and Computation in Fall 2014
P a g e | viii
List of Tables
Table 1. Number of Items That Remained on the Fall 2014 Tests After Screening and Respecification ...... 4
Table 2. Items in the Counting Section .......................................................................................................... 5
Table 3. Summary of Items Used in the Word Problems Section ................................................................. 6
Table 4. Items in the Computation Section ................................................................................................... 6
Table 5. Student Sample Demographics ........................................................................................................ 8
Table 6. Number of Items That Remained on the Fall 2014 Tests After Screening and Respecification .... 17
Table 7. Grade 1 Test Item Descriptions, Percentage Correct, and Unidimensional IRT Parameters ........ 18
Table 8. Grade 2 Test Item Descriptions, Descriptive Statistics, and Unidimensional IRT Parameters ...... 20
Table 9. Grade 1 Standardized Factor Loadings for Initial and Revised Correlated Trait Model ................ 22
Table 10. Grade 1 Factor Correlations (and Standard Errors) for the Revised Correlated Trait Model...... 23
Table 11. Grade 2 Standardized Factor Loadings for Initial and Revised Correlated Trait Model .............. 24
Table 12. Grade 2 Factor Correlations for the Revised Correlated Trait Model ......................................... 25
Table 13. Standardized Factor Loadings and Factor Residual Variances for the Grade 1 Higher-Order
Measurement Model ................................................................................................................................... 26
Table 14. Standardized Factor Loadings and Factor Residual Variances for the Grade 2 Higher-Order
Measurement Model ................................................................................................................................... 28
Table 15. Grade 1 Scale Reliability Estimates .............................................................................................. 30
Table 16. Grade 2 Scale Reliability Estimates .............................................................................................. 32
Table 17. Results for Single Linear Regressions of Standard Scores on the Iowa Test of Basic Skills (ITBS)
Math Problems and Math Computation Tests on the Math Factor Scores for the Grade 1 and Grade 2
Control Group .............................................................................................................................................. 34
Table 18. Proportion of Grade 1 Student Responses by Item ..................................................................... 96
Table 19. Proportion of Grade 2 Responses by Item ................................................................................... 96
Measuring the Performance of Grade 1 and 2 Students in Counting, Word Problems, and Computation in Fall 2014
P a g e | ix
List of Figures
Figure 1. Example of an image used in place of a page number. .................................................................. 9
Figure 2. Grade 1 test 2-pl UIRT difficulty vs. discrimination scatterplot. .................................................. 19
Figure 3. Grade 2 test 2-pl UIRT difficulty vs. discrimination scatterplot. .................................................. 21
Figure 4. Grade 1 revised model に correlated trait model diagram with standardized parameter
estimates. Factor g1cntf14 is the grade 1 Counting factor for fall 2014. Factor g1wpf14 is the grade 1
Word Problems factor for fall 2014. Factor g1cmpf14 is the grade 1 Computation factor for fall 2014. .. 23
Figure 5. Grade 2 revised model に correlated trait model diagram with standardized parameter
estimates. Factor g2cntf14 is the grade 2 Counting factor for fall 2014. Factor g2wpf14 is the grade 2
Word Problems factor for fall 2014. Factor g2cmpf14 is the grade 2 Computation factor for fall 2014. .. 25
Figure 6. Grade 1 final model に higher-order factor diagram with standardized parameter estimates. ... 27
Figure 7. Grade 2 final model に higher-order factor diagram with standardized parameter estimates. ... 29
Figure 8. Grade 1 2-pl UIRT total information curve and participant descriptives for the reduced set of
items modeled as a single factor. ................................................................................................................ 31
Figure 9. Distribution of the number of items individual students in the grade 1 sample answered
correctly on the reduced set of items. ........................................................................................................ 31
Figure 10. Grade 2 2-pl UIRT total information curve and participant descriptives for the reduced set of
items modeled as a single factor. ................................................................................................................ 33
Figure 11. Distribution of the number of items individual students in the grade 2 sample answered
correctly on the complete reduced set of items. ........................................................................................ 33
Figure 12. Distribution of the number of items individual students in the grade 1 sample answered
correctly within the Counting factor. .......................................................................................................... 93
Figure 13. Distribution of the number of items individual students in the grade 1 sample answered
correctly within the Word Problems factor. ................................................................................................ 93
Figure 14. Distribution of the number of items individual students in the grade 1 sample answered
correctly within the Computation factor. .................................................................................................... 94
Figure 15. Distribution of the number of items individual students in the grade 2 sample answered
correctly within the Counting factor. .......................................................................................................... 94
Figure 16. Distribution of the number of items individual students in the grade 2 sample answered
correctly within the Word Problems factor. ................................................................................................ 95
Figure 17. Distribution of the number of items individual students in the grade 2 sample answered
correctly within the Computation factor. .................................................................................................... 95
Measuring the Performance of Grade 1 and 2 Students in Counting, Word Problems, and Computation in Fall 2014
P a g e | x
List of Equations
Equation 1. Composite reliability for the second-order Math Factor (1) .............................................. 15
Equation 2. Reliability along range of person abilities (2) ........................................................................... 15
Equation 3. Grade 1 higher-order Math factor composite reliability estimate (3) ..................................... 29
Equation 4. Grade 2 higher-order Math factor composite reliability estimate (4) ..................................... 32
Measuring the Performance of Grade 1 and 2 Students in Counting, Word Problems, and Computation in Fall 2014
P a g e | xi
List of Abbreviations
CCSS-M ............................................................................... Common Core State Standards for Mathematics
CDU ................................................................................................................. Compare Difference Unknown
CFI ................................................................................................................................ Comparative Fit Index
CGI ................................................................................................................... Cognitively Guided Instruction
CQU ................................................................................................................... Compare Quantity Unknown
DNS ............................................................................................................................................ Did Not Solve
EMSA ..................................................................................... Elementary Mathematics Student Assessment
IRT ................................................................................................................................ Item Response Theory
ITBS ............................................................................................................................ Iowa Test of Basic Skills
JCU ............................................................................................................................... Join Change Unknown
JRU ................................................................................................................................. Join Result Unknown
MD .............................................................................................................................. Measurement Division
MG ............................................................................................................................ Multiplication Grouping
MPAC ............................................................................................ Mathematics Performance and Cognition
PD ..........................................................................................................................................Partitive Division
PPU ................................................................................................................ Part-Part-Whole Part Unknown
RMSEA ......................................................................................... Root Mean Square Error of Approximation
SRU ......................................................................................................................... Separate Result Unknown
TIC ............................................................................................................................. Total Information Curve
TLI ...................................................................................................................................... Tucker-Lewis Index
UI ...............................................................................................................................................Unclear Intent
UIRT ................................................................................................... Unidimensional Item Response Theory
Measuring the Performance of Grade 1 and 2 Students in Counting, Word Problems, and Computation in Fall 2014
Executive Summary P a g e | 1
Executive Summary
The subject of this report is a pair of written, group-administered tests designed to measure the
performance of grade 1 and grade 2 students at the beginning of the school year in the domain of
number and operations. These tests build on previous versions field-tested in fall 2013 (Schoen, LaVenia,
Bauduin, & Farina, 2016). Because the tests are designed to be a measure of student achievement in
elementary mathematics, we call them the Elementary Mathematics Student Assessment (EMSA) tests.
Purpose
The EMSA tests were SWゲキェミWS デラ ゲWヴ┗W ;ゲ ; Iラ┗;ヴキ;デW aラヴ ゲデ┌SWミデゲげ H;ゲWノキミW ヮWヴaラヴマ;ミIW キミ ゲデ;デキゲデキI;ノ models estimating the impact of a teacher professional-development program on student achievement
in mathematics.
This report is written for researchers and evaluators who may be interested in using the tests in the
future or who wish to know about the psychometric properties of the tests.
Content
The contents of the EMSA tests are designed to align with core content in the operations and algebraic
thinking and the number and base ten domains in the Common Core State Standards for Mathematics at
grades 1 and 2, respectively (NGACBP & CCSSO, 2010). In a few instances, the content of the tests
extends beyond the CCSS-M for the given grade level. These exceptions include multiplication-grouping
problems in grade 2. The purpose of the focus on more advanced problems is to increase the ability of
the test to discriminate among a wide range of levels of knowledge and understanding in the area of
number and operations. Moreover, some ambiguity remains about whether place value is about
grouping by tens, and items on the tests reflect this ambiguity.
The final versions of the tests were the result of extensive development, feedback, and revisions from a
variety of experts. The expert review verified the alignment of the content with the content of the
Common Core State Standards for Mathematics at grades 1 and 2.
Because of the paper-and-pencil format of the tests and the range in reading ability of the test takers,
careful consideration was given to placement of the problems on each page and assisting students with
identification of the correct page of the test during administration. Teachers administered the tests to
their own students with the assistance of an administration guide and script (provided in Appendices C
and D).
Sample and Setting
The 2014 EMSA tests were administered with 3,080 participating grade 1 and grade 2 students in 22
schools located in two public school districts in Florida during fall 2014. The school districts were
implementing a curriculum based on the Mathematics Florida Standards, which are very similar to the
Common Core State Standards for Mathematics (CCSS-M; NGACBP & CCSSO, 2010).
Test Specifications and Administration
The fall 2014 EMSA test has three main sections corresponding to counting and the number sequence,
word problems, and computation. The test forms include 22 items at grade 1 and 23 items at grade 2.
Measuring the Performance of Grade 1 and 2 Students in Counting, Word Problems, and Computation in Fall 2014
Executive Summary P a g e | 2
Sixteen of the items at each grade level are presented in a constructed-response format. Six items are
presented in a selected-response format on the grade 1 test and seven items on the grade 2 test.
On the basis of an iterative process of data modeling and item diagnostics, some of the items on the test
forms were not used in the final scale. The final grade 1 scale uses data from 19 items. The final grade 2
scale uses data from 20 items. The two forms were not designed to be directly comparable.
Teachers administered the tests to their own students with the assistance of an administration guide
and script (provided in Appendices C and D). Because of the paper-pencil format of the tests and the
range in reading ability of the test takers, careful consideration was given to placement of the problems
on each page and assisting students with identification of the correct page of the test during
administration.
Scoring
The data were fit to both a correlated-traits and a second-order factor-analysis model. To generate
overall test scores, we first regressed three first-order factors (i.e., Counting, Word Problems,
Computation) onto a single second-order factor (i.e., Math). The second-order Math factor score is
intended to serve as the overall achievement score on the test. Goodness-of-fit statistics varied but
generally indicated that the specified measurement models provided a reasonable fit to the data. The
grade 1 model root mean square error of approximation (RMSEA) statistic indicated mediocre fit and the
comparative fit index (CFI) and Tucker-Lewis index (TLI) ゲデ;デキゲデキIゲ キミSキI;デWS ヴW;ゲラミ;HノW aキデぎ ‐2(149) =
1715.379, p < .001; RMSEA = .081, 90% Confidence Interval (CI) [.078, .085]; CFI = .916; and TLI = .904.
The grade 2 model RMSEA, CFI, ;ミS TLI ゲデ;デキゲデキIゲ キミSキI;デWS IノラゲW aキデぎ ‐2(167) = 532.780, p < .001; RMSEA =
.038, 90% CI [.035, .042]; CFI = .968; and TLI = .964.
Reliability
The reliabilities of the test scales were determined by means of a composite reliability estimate for the
Math a;Iデラヴ ;ミS ラヴSキミ;ノ aラヴマゲ ラa CヴラミH;Iエげゲ ü for the three subscales. The grade 1 math composite
reliability was .88. The grade 2 math composite reliability was .91. Grade 1 ü estimates for the three
subscales all met or exceeded the conventional target value of .8 (range .80 to .92). Grade 2 ü estimates
for the three subscales all exceeded the conventional target value of .8 (range .84 to .85). Diagnostic and
ゲ┌ヮヮノWマWミデ;ヴ┞ ;ミ;ノ┞ゲWゲ ラa ゲI;ノW ヴWノキ;Hキノキデ┞が キミIノ┌Sキミェ ラヴSキミ;ノ aラヴマゲ ラa RW┗WノノWげゲ é ;ミS MIDラミ;ノSげゲ \h
coefficients and IRT information-based reliability estimates, are provided in Chapter 4 of the full report.
Predictive Validity
Evidence for the predictive validity of the EMSA tests was examined by regression of the standard scores
for the level 7 and level 8 Iowa Test of Basic Skills (ITBS; Dunbar et al., 2008) tests on the EMSA Math
factor scores for grades 1 and 2, respectively. Regression results suggested that the EMSA Math score
was a moderate to strong predictor of ゲデ┌SWミデゲげ scores on the ITBS Math Problems test, where an
R2Adjusted of .45 was found for grade 1 and an R2
Adjusted of .55 was found for grade 2. The EMSA Math
scores provided more modest predictive power with the ITBS Math Computation test, where an R2Adjusted
of .28 was found for grade 1 and an R2Adjusted of .36 was found for grade 2. All of these relations were
statistically significant at p < .001. The regression analyses suggest the EMSA tests to be an appropriate
covariate in analyses that use the ITBS tests as outcomes, where the results suggest the test is
particularly well suited in analyses with the ITBS Math Problems test.
Measuring the Performance of Grade 1 and 2 Students in Counting, Word Problems, and Computation in Fall 2014
Executive Summary P a g e | 3
Summary
We report on the initial validation efforts examining the substantive, structural, and external validity
(Flake, Pek, & Hehman, 2017) for the fall 2014 EMSA tests. The fall 2014 EMSA tests were designed to be
a measure of student achievement in grades 1 and 2 for use as a student pretest covariate in the study
of the effects of a mathematics-teacher professional-development program in mathematics. EMSA test
items were constructed and reviewed by mathematicians and mathematics education experts and
measure student achievement in the domain of operations and algebraic thinking as well as number and
base ten. The development process, model fit, and scale-reliability estimates meet the basic standards
for educational measurement. Test scores are moderately correlated with the scores of policy-relevant,
standardized tests used to measure student achievement in grades 1 and 2. The EMSA tests appear to
be sufficiently well suited for their intended use as a test covariate for the evaluation of educational
interventions involving grade 1 and grade 2 students.
Measuring the Performance of Grade 1 and 2 Students in Counting, Word Problems, and Computation in Fall 2014
Introduction and Overview P a g e | 4
1. Introduction and Overview
The fall 2014 EMSA tests were designed to measure student mathematics performance at the beginning
of grade 1 and grade 2. The items focus on tasks involving counting, solving word problems, and
computational problems. The tests were based on a previous version of these tests (Schoen, LaVenia,
Bauduin, & Farina, 2016).
The test-development process involved multiple iterations of item and test blueprint development,
review of items and the test blueprint by experts in mathematics and mathematics education, and
extensive revisions and proofreading of the items, sequence, and formatting. Experts provided feedback
on the accuracy of the mathematics content, clarity of questions, number choices in the selected-
response items, overall length of the test, and predictions about how students could potentially
misinterpret the items in ways that might obscure their ability to measure student knowledge and
ability. Experts also reviewed the items on both tests to determine the extent of the alignment of the
items with the domains of counting and algebraic thinking in the CCSS-M (NGACBP & CCSSO, 2010).
The EMSA tests were designed to be administered in a whole-group setting in a paper-pencil format.
The sデ┌SWミデゲげ Iノ;ゲゲヴララマ デeachers were asked to administer the tests during the first two weeks of the
school year. The teachers were given an administration guide explaining how to administer the tests and
a script to use while administering them. Questions were read aloud to students, and students either
filled in a box with the correct number for open-ended items or shaded bubbles to indicate their
responses to multiple-choice items. Teachers were encouraged to allow students to use manipulatives in
accordance with their typical classroom practice.
The immediate purpose of the tests was for use as a student pretest covariate in a randomized
controlled trial evaluating the impact of a teacher professional-development program on student
achievement in the domains of number, operations, and algebraic thinking. In the state and school
districts where the efficacy trial took place, no uniform measure of student mathematics achievement
was used with kindergarten, grade 1, or grade 2 students. A measure of student achievement in
mathematics was desired for the purposes of investigating baseline equivalence of participating schools
and as a student-level covariate in statistical models estimating the impact of the program on student
achievement.
1.1. Test Overview
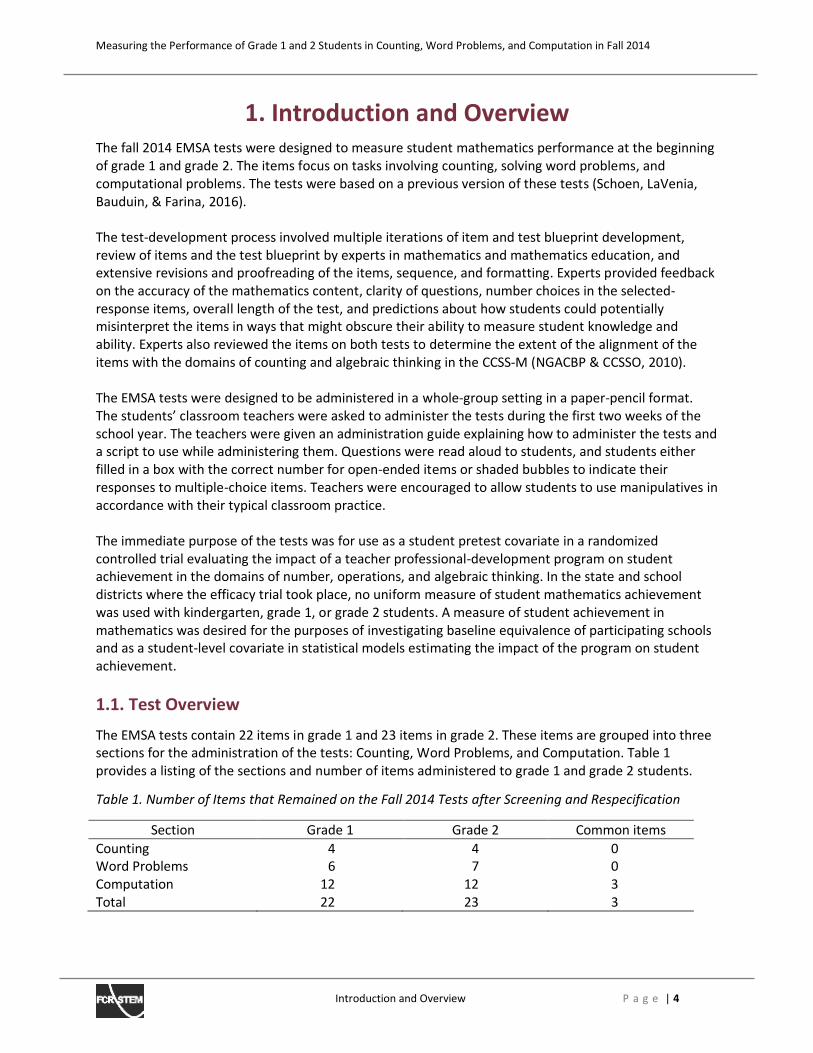
The EMSA tests contain 22 items in grade 1 and 23 items in grade 2. These items are grouped into three
sections for the administration of the tests: Counting, Word Problems, and Computation. Table 1
provides a listing of the sections and number of items administered to grade 1 and grade 2 students.
Table 1. Number of Items that Remained on the Fall 2014 Tests after Screening and Respecification
Section Grade 1 Grade 2 Common items
Counting 4 4 0
Word Problems 6 7 0
Computation 12 12 3
Total 22 23 3
Measuring the Performance of Grade 1 and 2 Students in Counting, Word Problems, and Computation in Fall 2014
Introduction and Overview P a g e | 5
Although the two tests contain the same three sections and approximately the same number of items,
they are not designed to be vertically scaled. Only three of the items on the two tests are identical, and
all three of those are in the Computation section. When individual items on the grade 1 and grade 2
tests are similar (but not identical), the questions on the grade 2 test involve higher numbers in an
attempt to increase the difficulty proportionally with age and to elicit information about how these
older students make sense of operations on multidigit whole numbers.
1.1.1. Section 1: Counting
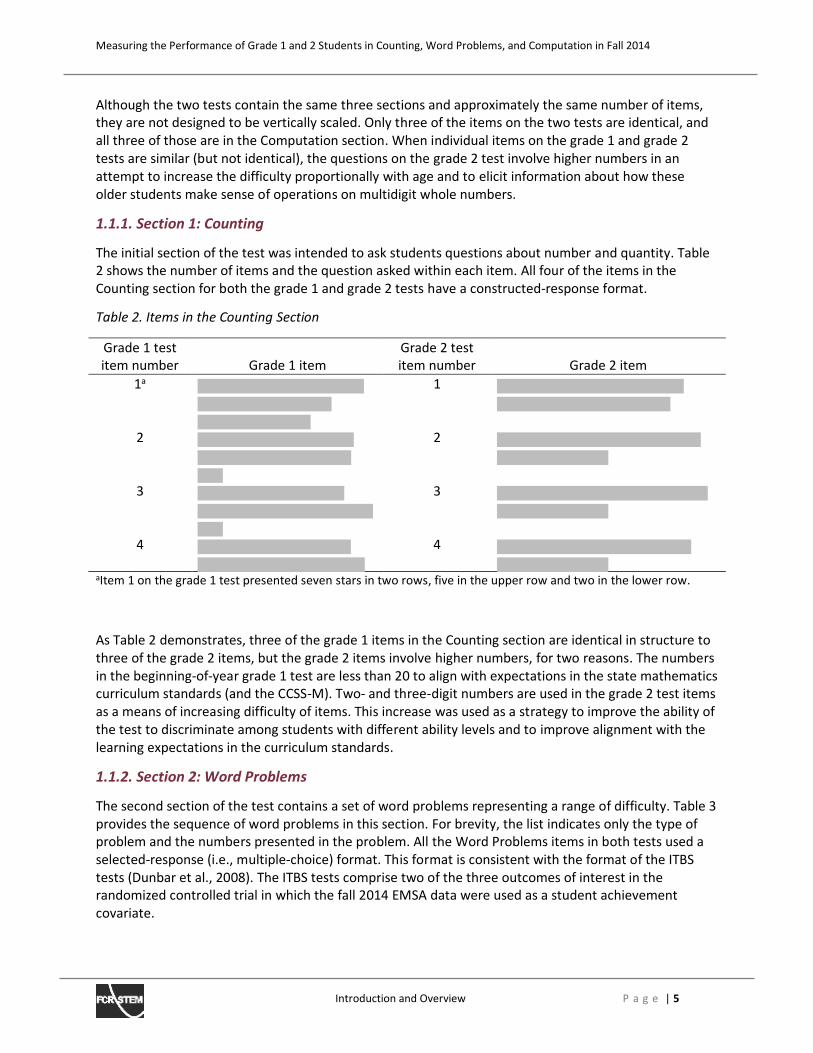
The initial section of the test was intended to ask students questions about number and quantity. Table
2 shows the number of items and the question asked within each item. All four of the items in the
Counting section for both the grade 1 and grade 2 tests have a constructed-response format.
Table 2. Items in the Counting Section
Grade 1 test
item number Grade 1 item
Grade 2 test
item number Grade 2 item
1a
1
2
2
3
3
4
4
aItem 1 on the grade 1 test presented seven stars in two rows, five in the upper row and two in the lower row.
As Table 2 demonstrates, three of the grade 1 items in the Counting section are identical in structure to
three of the grade 2 items, but the grade 2 items involve higher numbers, for two reasons. The numbers
in the beginning-of-year grade 1 test are less than 20 to align with expectations in the state mathematics
curriculum standards (and the CCSS-M). Two- and three-digit numbers are used in the grade 2 test items
as a means of increasing difficulty of items. This increase was used as a strategy to improve the ability of
the test to discriminate among students with different ability levels and to improve alignment with the
learning expectations in the curriculum standards.
1.1.2. Section 2: Word Problems
The second section of the test contains a set of word problems representing a range of difficulty. Table 3
provides the sequence of word problems in this section. For brevity, the list indicates only the type of
problem and the numbers presented in the problem. All the Word Problems items in both tests used a
selected-response (i.e., multiple-choice) format. This format is consistent with the format of the ITBS
tests (Dunbar et al., 2008). The ITBS tests comprise two of the three outcomes of interest in the
randomized controlled trial in which the fall 2014 EMSA data were used as a student achievement
covariate.
Measuring the Performance of Grade 1 and 2 Students in Counting, Word Problems, and Computation in Fall 2014
Introduction and Overview P a g e | 6
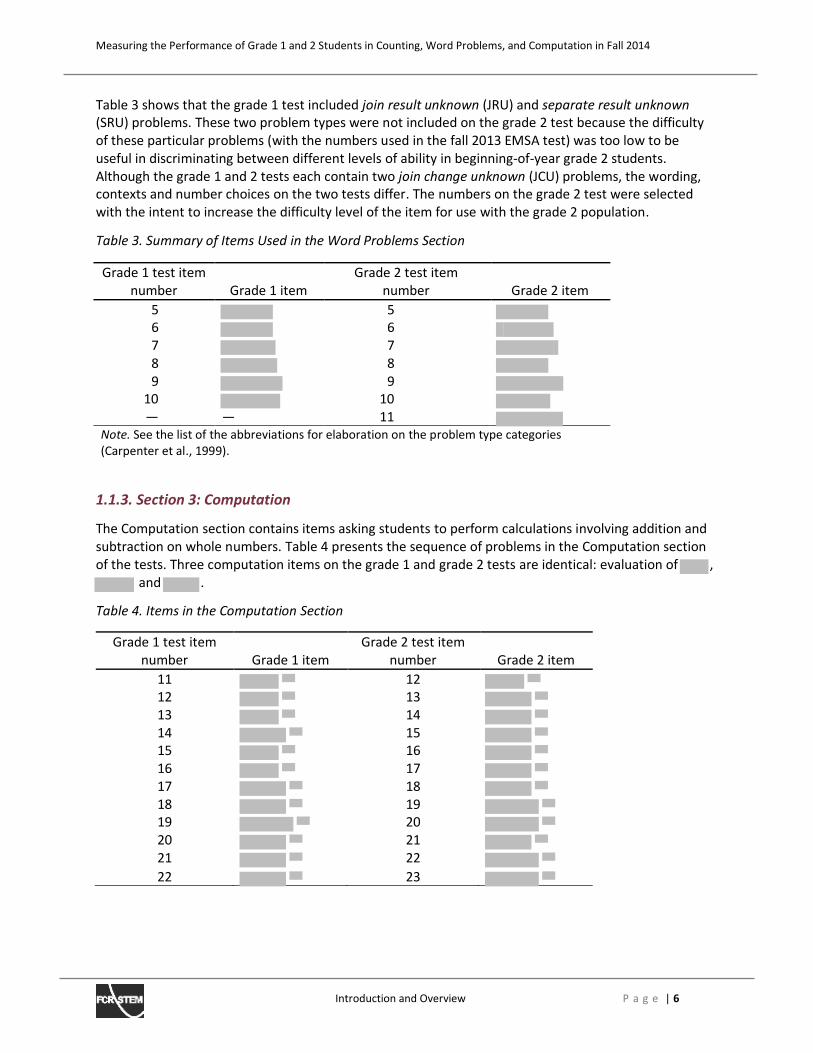
Table 3 shows that the grade 1 test included join result unknown (JRU) and separate result unknown
(SRU) problems. These two problem types were not included on the grade 2 test because the difficulty
of these particular problems (with the numbers used in the fall 2013 EMSA test) was too low to be
useful in discriminating between different levels of ability in beginning-of-year grade 2 students.
Although the grade 1 and 2 tests each contain two join change unknown (JCU) problems, the wording,
contexts and number choices on the two tests differ. The numbers on the grade 2 test were selected
with the intent to increase the difficulty level of the item for use with the grade 2 population.
Table 3. Summary of Items Used in the Word Problems Section
1.1.3. Section 3: Computation
The Computation section contains items asking students to perform calculations involving addition and
subtraction on whole numbers. Table 4 presents the sequence of problems in the Computation section
of the tests. Three computation items on the grade 1 and grade 2 tests are identical: evaluation of ,
and .
Table 4. Items in the Computation Section
Grade 1 test item
number Grade 1 item
Grade 2 test item
number Grade 2 item
11 12
12 13
13 14
14 15
15 16
16 17
17 18
18 19
19 20
20 21
21 22
22 23
Grade 1 test item
number Grade 1 item
Grade 2 test item
number Grade 2 item
5 5
6 6
7 7
8 8
9 9
10 10
ね ね 11
Note. See the list of the abbreviations for elaboration on the problem type categories
(Carpenter et al., 1999).
Measuring the Performance of Grade 1 and 2 Students in Counting, Word Problems, and Computation in Fall 2014
Introduction and Overview P a g e | 7
1.2. Administration of Test
Tests were delivered to schools by project staff during the week of preplanning (i.e., the week before
students return to school for the year). Teachers were given detailed instructions on how to administer
the tests. The tests were accompanied by a document for teachersねprovided here in Appendices C and
Dねcontaining detailed test-administration instructions, including a script to use while administering the
tests.
TW;IエWヴゲ ┘WヴW ;ゲニWS デラ ┘ヴキデW デエW ゲデ┌SWミデゲげ ミ;マWゲ ラミ デエW aヴラミデ Iラ┗Wヴs of the tests to increase legibility
and accuracy in data entry. Teachers were also instructed to permit students to use manipulable
materials if that was common practice in their classrooms. For the first two sections of the test, teachers
were instructed to read the problems aloud to studentsねin their entiretyねto reduce the effect of
reading ;Hキノキデ┞ ラミ ゲデ┌SWミデゲげ マ;デエWマ;デキIゲ ヮWヴaラヴマ;ミIWく Reading problems aloud to students is consistent
with the administration procedures for the ITBS and the Mathematics Performance and Cognition
(MPAC) interview, the two outcome measures used for the randomized controlled trial. As necessary,
teachers were encouraged to provide appropriate testing accommodations for students in accordance
with their individual educational plans. Teachers were instructed to insert completed tests into an
opaque, sealed envelope and deliver the envelopes to the front office for project personnel to pick up
during a window of time outlined in the administration instructions.
We acknowledge that teacher administration presents the potential for breaches in security. These were
not high-stakes tests, so strict security was not a high priority. In this case, teachers and schools were
trusted to administer the tests in accordance with the instructions.
1.3. Description of the Sample
The student sample included 3,080 students (1,595 grade 1 and 1,485 grade 2) with consent to
participate. The student sample comes from the classrooms of participating grade 1 and 2 teachers
representing 22 schools in two diverse public school districts (7 schools in one district; 15 in the other) in
Florida. Grade 1 and 2 teachers in these schools elected to participate in a large-scale, cluster-
randomized controlled trial evaluating the efficacy of a teacher professional-development program in
mathematics. Half of the schools in the sample were assigned at random to the treatment condition; the
other half to the control condition. Our sampling procedure attempted to measure all grade 1 and grade
ヲ ゲデ┌SWミデゲ キミ ヮ;ヴデキIキヮ;デキミェ デW;IエWヴゲげ Iノ;ゲゲヴララマゲく Other than the requirement for parental consent in
order for data on students to be collected, no exclusion criteria were applied that would have limited
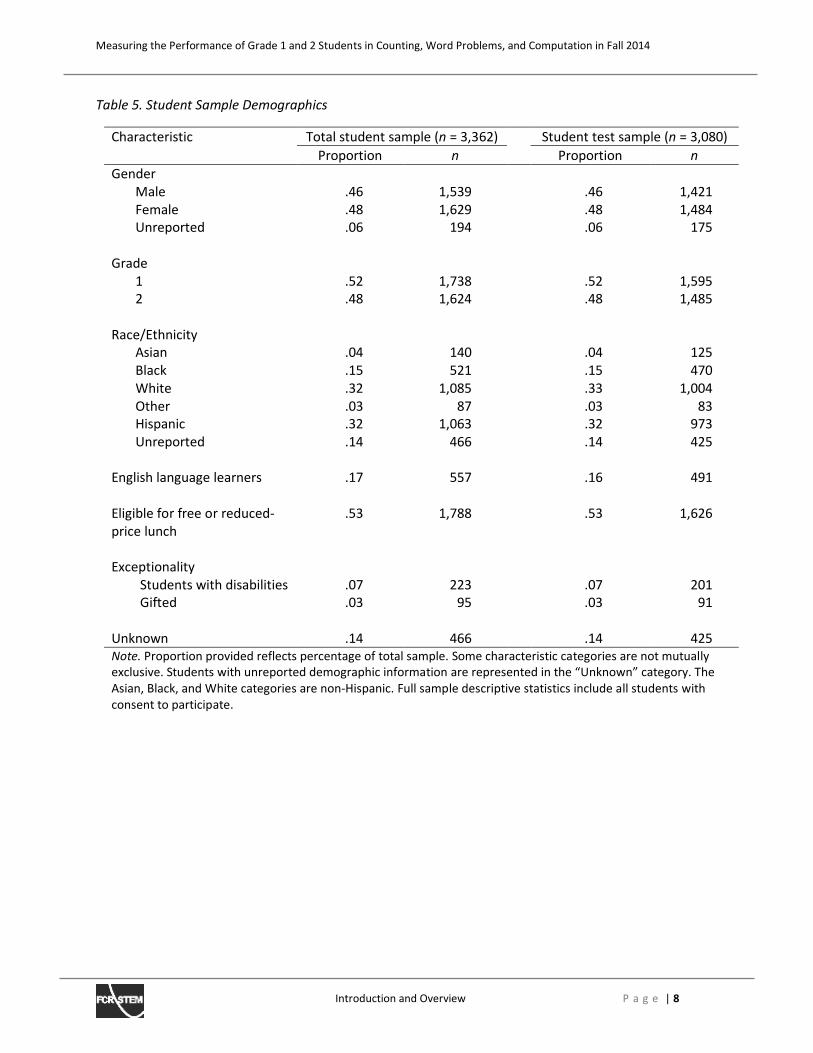
the sample by student characteristic. Table 5 relays the student demographics for the total participating
student sample as of fall 2014 and the subsample of students for whom fall 2014 measurement with the
EMSA was conducted.
Measuring the Performance of Grade 1 and 2 Students in Counting, Word Problems, and Computation in Fall 2014
Introduction and Overview P a g e | 8
Table 5. Student Sample Demographics
Characteristic Total student sample (n = 3,362) Student test sample (n = 3,080)
Proportion n Proportion n
Gender
Male .46 1,539 .46 1,421
Female .48 1,629 .48 1,484
Unreported .06 194 .06 175
Grade
1 .52 1,738 .52 1,595
2 .48 1,624 .48 1,485
Race/Ethnicity
Asian .04 140 .04 125
Black .15 521 .15 470
White .32 1,085 .33 1,004
Other .03 87 .03 83
Hispanic .32 1,063 .32 973
Unreported .14 466 .14 425
English language learners .17 557 .16 491
Eligible for free or reduced-
price lunch
.53 1,788 .53 1,626
Exceptionality
Students with disabilities .07 223 .07 201
Gifted .03 95 .03 91
Unknown .14 466 .14 425
Note. Proportion provided reflects percentage of total sample. Some characteristic categories are not mutually
W┝Iノ┌ゲキ┗Wく “デ┌SWミデゲ ┘キデエ ┌ミヴWヮラヴデWS SWマラェヴ;ヮエキI キミaラヴマ;デキラミ ;ヴW ヴWヮヴWゲWミデWS キミ デエW さUミニミラ┘ミざ I;デWェラヴ┞く TエW Asian, Black, and White categories are non-Hispanic. Full sample descriptive statistics include all students with
consent to participate.
Measuring the Performance of Grade 1 and 2 Students in Counting, Word Problems, and Computation in Fall 2014
Test Development P a g e | 9
2. Test Development
2.1. Content
The content standards at grades 1 and 2 in the CCSS-M (NGACPB & CCSSO, 2010) were used to provide
guidelines for content specifications. Overall, the focus of the test is on number and operations, but it
includes some items designed to favor students who have a solid grasp of place-value concepts. The
numbers used on the test are limited to positive integers (i.e., Counting numbers) between 1 and 100,
with one exception. In the Counting section, the beginning-of-year grade 2 students were asked
. That decision was informed by results of the fall 2013 version of the test
and was designed to increase the level of difficulty of the grade 2 test. Computation items presented
symbolically involve applying the addition or the subtraction operation with exactly two positive
integers. Problems involving subtraction result in a difference with a positive, integer value. Word
problems involve additive situations as well as grouping situations that could be solved by
multiplication, division, addition, counting strategies, or direct place-value understanding (Carpenter et
al., 1999).
2.2. Test Specifications
Test design involved finding an optimum point at the intersection of three potentially competing goals:
(1) sample a range of difficulty of problems and cognitive demand to reflect the focus of the teacher
professional-development program goals and the learning goals outlined in grades 1 and 2 in the CCSS-
M, (2) serve as a reasonably strong student-level test covariate to explain some of the variance in the
ITBS and MPAC interview data, and (3) minimize the test-taking burden on teachers and students.
The Counting and Word Problems sections of the test include only one item per page to minimize
student distraction and confusion. Rather than using Arabic numerals as page numbers or to enumerate
items, we used a child-friendly image to identify each page. We used graphics in order to be as
considerate as possible to the test taker (who may not read Arabic numerals fluently). Figure 1 provides
one example of these graphics.
Figure 1. One of the images used in place of a page number.
Beginning-of-year grade 1 students, in particular, may not recall all of their numerals, and numbered
pages could cause confusion and anxiety. The large and easily distinguished image is also useful for the
test administrator to use as a way to verify from across the room that students have turned to the
correct page. Moreover, the ITBS test forms use a similar tactic, so this test serves as practice for that
type of format.
Response types include selected-response (i.e., multiple-choice) and constructed-response items. All of
the constructed-response items are short answer; none of them requires extended or elaborated
responses. Sample items with examples of responses are provided on the first page of the test for the
Measuring the Performance of Grade 1 and 2 Students in Counting, Word Problems, and Computation in Fall 2014
Test Development P a g e | 10
administrator to demonstrate how students are expected to respond (e.g., completely shade the
bubble, write a numeral in a rectangular area designated for the response).
Selected-response options are ordered from least to greatest and from left to right. Bubbles are
centered beneath each response option, and responses are centered horizontally across the page. Test
items were reviewed internally for bias and sensitivity in an effort to neutralize any need for vocabulary
development with students. Whenever possible, word problems are written to avoid the use of
keywords (i.e., altogether, in all, left).
Although the tests designed for the two grade levels have the same three sections (i.e., Counting, Word
Problems, Computation), the tests are not designed to be vertically scaled or equated. The grade 2 test
was designed to be more difficult than the grade 1 test.
2.3. Item Development
The items were written by the first author of the present report. Schoen holds postsecondary degrees in
atmospheric science, mathematics, and mathematics education. He has extensive experience
developing assessment items and scales designed to measure student cognition and achievement in
early elementary mathematics as well as teacher knowledge and beliefs. The items were reviewed by
other individuals with expertise in elementary education, assessment, and mathematics.
The development process for the tests consisted of several phases. These phases included:
1. Analysis of the goals of the mathematics professional-development program we were
evaluating: Cognitively Guided Instruction (CGI).
2. Review of the learning goals delineated in the CCSS-M grades 1 and 2.
3. Review of literature and related measures in the domain of number and operations at grades 1
and 2.
4. Creation of a draft test blueprint.
5. Review of item and scale performance from the 2013 version of the test; review of student
responses for those items used on the 2013 tests.
6. Development of a first written draft of the grade 1 and grade 2 test items.
7. Internal review of drafted tests by members of the research team as well as review by several
members of the project advisory board.
8. Revision of drafts based upon feedback.
Because the tests were used in the evaluation of a program related to CGI, an extensive body of
literature related to CGI was reviewed carefully (cf. Carpenter et al., 1989, 1999; Fennema et al., 1996;
Jacobs et al., 2007). The CGI program is focused on number (including place value), operations, and
algebraic thinking. As part of a strategy to avoid overalignment with the intervention, we also completed
a review of the learning goals set forth in the CCSS-M (NGACBP & CCSSO, 2010). The topics at the
intersection of the program goals and the expectations outline in the CCSS-M provided the starting place
for defining the content of the test.
Once the blueprint was developed, a draft set of items was written and reviewed internally by the
research team, which consists of experts in mathematics, mathematics education, educational
psychology related to student thinking in mathematics, and educational measurement. After this
internal review, the draft set of items and testing format were revised and sent to advisory board
members Thomas Carpenter, Victoria Jacobs, and Ian Whitacre for review and feedback. Dr. Carpenter
Measuring the Performance of Grade 1 and 2 Students in Counting, Word Problems, and Computation in Fall 2014
Test Development P a g e | 11
provided extensive feedback based on his experience assessing students, and the items were heavily
revised on the basis of his recommendations. Revised versions of the items were then internally
reviewed by members of the test development research team.
One major advantage in the development of the fall 2014 tests was the data from the fall 2013 tests
(Schoen, LaVenia, Bauduin, & Farina, 2016). Those tests and the spring 2014 MPAC interview data
(Schoen, LaVenia, Champagne, & Farina, 2016) provided useful insight to enable us to refine the
;ノキェミマWミデ ラa SキaaキI┌ノデ┞ ラa キデWマゲ ┘キデエ ゲデ┌SWミデゲげ ;HキノキデキWゲ ;デ ゲデ;ヴデ ラa ェヴ;SW ヱ ラヴ ヲ.
Approximately half of the items from the fall 2013 tests were used again on the fall 2014 tests. More
items were carried forward on the grade 1 test than on the grade 2 test. Two primary reasons for not
carrying forward items from fall 2013 to fall 2014 test were model fit and difficulty level. Items with very
high or low difficulty or low factor loadings from the 2013 tests were dropped from the 2014 version.
Items replaced or added to the grade 2 test were designed to increase the overall difficulty of the grade
2 test over that of the fall 2013 version.
2.4. Test Design and Assembly
The student tests consist of three sections: Counting, Word Problems, and Computation. The Counting
section consists of four キデWマゲ ;キマWS ;デ マW;ゲ┌ヴキミェ ゲデ┌SWミデゲげ ┌ミSWヴゲデ;ミSキミェ キミ デエW Sラマ;キミ ラa Iラ┌ミデキミェ and cardinality. All of the Counting items use a constructed-response format, in which the students are
expected to write each answer as a numeral in a designated box. The Word Problems section includes
six items in grade 1 and seven items in grade 2, all of which use a selected-response format and offer
five response options for each item. The response options are always numerals and are ordered from
least to greatest, from left to right. The students are directed to fill in the circles below their answer
choices. The Computation section consists of 12 items presented as open equations. Each problem is
presented as a single equation involving either the addition or the subtraction operator and exactly two
numerals. Each is presented in the standard (i.e., a + b = c, a に b = c) form (Stigler et al., 1986; Schoen et
al., in review) with an open box providing a place for the student to write the numeral representing the
sum or difference.
In the Counting and Word Problems sections, only one problem is displayed per page so that students
will not record their answers in the wrong places or be overwhelmed by too much text on the page.
Computation items are presented with multiple items split across two pages. In an effort to avoid
confusion, as well as to match the format of the ITBS outcome measure, a line is placed after each
Computation item on the page. The grammar used in word problems was reviewed by those with
experience in teaching emergent bilingual students. The font used in the final version of the test is large
(18-point) to increase legibility. Copies of the grade 1 and grade 2 tests are presented in Appendices A
and B, respectively.
2.5. Test Production and Administration
The tests, administration guides, and consent forms were printed at the university and distributed to the
participating schools. Tests were printed single-sided on 20-pound, white paper in the 18-point Calibri
font.
Administration guides were designed and created for teachers to use while administering the tests. They
provide an overview of the tests, describe the administration process and directions, explain how to
submit completed tests, and provide a full script to be read verbatim during administration of the test.
In addition, the administration guides include a student information sheet on the last page. Teachers
Measuring the Performance of Grade 1 and 2 Students in Counting, Word Problems, and Computation in Fall 2014
Test Development P a g e | 12
completed this sheet to provide student and class information (e.g., student names, student ID
numbers, testing accommodations provided) and returned it with the completed student tests. The
administration guide was repeatedly reviewed, edited, and proofread by research project staff before it
the final version was produced. The final forms of the test administration guides for grades 1 and 2 are
presented in Appendices C and D, respectively.
Participating teachers were provided with a test packet containing:
• Testing administration guide (for the corresponding grade level)
• Class set of student tests
• Parental consent forms
• Student information sheet
These materials were distributed to the teachers participating in the study through the main office
personnel or principal-appointed designee. Test materials were distributed to the main offices at school
sites on August 4に8, 2014. Teachers were instructed to administer the tests during the first two weeks of
school.
Test administrators (which were usually the participating teachers) were directed to read each math
problem aloud to students in accordance with the administration script. In addition, they were asked to
provide and allow students to use manipulatives, like counters or linking cubes, during the test. If
students generally had testing accommodations due to IEP, ELL or 504 plans, then the teacher was asked
to provide any and all required accommodations for those individual students and to document the
accommodation on the student information sheet. The test is not timed, so test administrators were
instructed to allow students adequate time to answer all of the questions.
Upon conclusion of administration, teachers were instructed to submit all testing materials (i.e., test
administration guide, student test booklets, student information sheet, student booklist form, and
parental consent forms) to their principals or designees. Teachers were asked to return only completed
test booklets completed by those students with corresponding signed parental consent on the parental
consent form. The principal or designee placed the testing materials in the main office at the front desk
for pickup. Members of the project team picked up test materials during the last two weeks of
September 2014.
Teachers who presented extenuating circumstances to the research team and did not administer the
test during the administration window or missed the materials pickup date were handled on a case-by-
case basis with respect to when to administer the test and arrangement of a materials pickup date. Very
few instances of these special cases arose.
Measuring the Performance of Grade 1 and 2 Students in Counting, Word Problems, and Computation in Fall 2014
Data Entry and Analysis Procedures P a g e | 13
3. Data Entry and Analysis Procedures
3.1. Data Entry and Verification Procedures
Research ;ゲゲキゲデ;ミデゲ デ┞ヮWS ゲデ┌SWミデ ヴWゲヮラミゲWゲ キミデラ IミaラP;デエ aラヴマゲ エラゲデWS ラミ デエW ヮヴラテWIデげゲ ゲWI┌ヴW SharePoint site page. All response fields were restricted to allow only whole numbers and accepted
codes for missing items. The response fields for selected-response items were further restricted to allow
only the integers presented as possible responses. Two codes were used for items missing a response:
UI indicated unclear intent, and DNS indicated did not solve. The code DNS indicated that the student
made no apparent effort to provide a response to the item. Research assistants were asked to interpret
Hラデエ デエW ゲデ┌SWミデげゲ エ;ミS┘ヴキデキミェ ;ミS デエW ゲデ┌SWミデげゲ キミデWミデが ┘キデエ デエW ェラ;ノ ラa WミデWヴキミェ デエW ゲデ┌SWミデげゲ intended response exactly as it was written. Because this test was administered to grade 1 students at
the beginning of the school year, many student responses displayed immature handwriting that took
careful consideration. As a result, regular meetings of the data-entry personnel were held to discussねand come to consensus onねhow to record unusual student responses. In most cases, the discussion was
over which numerals the student wrote, although occasionally discussion was needed to determine
which of the several numerals written by the student was intended as the answer.
The code UI ┘;ゲ ┌ゲWS ┘エWミ デエW IラママキデデWW Iラ┌ノS ミラデ IラマW デラ ;ミ ;ェヴWWマWミデ ;Hラ┌デ デエW ゲデ┌SWミデげゲ キミデWミSWS ヴWゲヮラミゲW ラヴ ┘エWミ デエW ゲデ┌SWミデげゲ ヴWゲヮラミゲW ┘;ゲ デララ a;ヴ aヴラマ ゲデ;ミS;ヴS ミ┌マWヴキI ヴWヮヴWゲWミデ;デキラミゲ to be interpreted. Common examples of responses that required interpretation and discussion are listed
below, with a description of the decision that was made.
• TエW ;ミゲ┘Wヴ ┘;ゲ さΑざ and デエW ゲデ┌SWミデ ┘ヴラデW さヰΑざ ラミ デエW ;ミゲ┘Wヴ ノキミWく Correct responses preceded
by a zero were interpreted as correct. In this example, the exact student response would be
entered as written.
• TエW ;ミゲ┘Wヴ ┘;ゲ さンざ ;ミS デエW ゲデ┌SWミデ ┘ヴラデW ; H;Iニ┘;ヴS デエヴWWく Backward numerals were
interpreted as though they were written correctly. No indication was made during data entry to
signal that a numeral was written backward. This decision only applies to individual digits, and
did not override the decision for reversals of multi-digit numbers.
• TエW ;ミゲ┘Wヴ ┘;ゲ さヱンざが H┌デ デエW ゲデ┌SWミデ ┘ヴラデW さンヱざ ラミ デエW ;ミゲ┘Wヴ ノキミWく Numeric reversals were
entered as written, and interpreted as incorrect. Committee members agreed that although
ゲデ┌SWミデゲ ┘エラ ヴWゲヮラミSWS ┘キデエ さンヱざ マ;┞ エ;┗W キミデWミSWS デラ ┘ヴキデW さヱンがざ デエW evidence was
insufficient to support that claim.
• TエW ;ミゲ┘Wヴ ┘;ゲ さヱヵざ ;ミS ;デ ノW;ゲデ one of the digits could have been interpreted as another
numeral. Some numerals proved more difficult to determine. The most common numerals that
could be confused were 7s and serifed 1s and backward 2s and 5s. When researchers were
presented with immature handwriting for numerals with similar shapes, other handwriting
ゲ;マヮノWゲ aラ┌ミS ┘キデエキミ デエW ;ゲゲWゲゲマWミデ ┘WヴW ┌ゲWS ;ゲ ; ェ┌キSW デラ SWデWヴマキミW デエW ゲデ┌SWミデげゲ キミデWミデく
To verify accuracy of data entry, a sample of 10% of the tests was randomly selected for second entry by
personnel at FSU who did not participate in the original data entry or adjudication process. The two sets
of entries were compared for agreement on scored (i.e., correct, incorrect) responses for each item and
were found to have a 99.5% overall agreement.
Measuring the Performance of Grade 1 and 2 Students in Counting, Word Problems, and Computation in Fall 2014
Data Entry and Analysis Procedures P a g e | 14
3.2. Data Analysis
All analyses were performed with Mplus version 7.11 (Muthén & Muthén, 1998-2012), with the
W┝IWヮデキラミ ラa デエW Wゲデキマ;デキラミ ラa CヴラミH;Iエげゲ üが RW┗WノノWげゲ éが ;ミS MIDラミ;ノSげゲ \h reliability coefficients,
which were performed in R 3.1.2 (R Development Core Team, 2014) with the psych package (Revelle,
2016) ü, splithalf, \h, and polychoric functions.
Our investigation was conducted in five steps. We aimed (1) to screen out items that demonstrated
outlier parameter estimates when fit to a unidimensional framework, (2) to evaluate item performance
when structured in accordance with the three-factor blueprint and drop items that demonstrate low
salience with their respective factor, (3) to respecify the structure of the model from one of correlated
factors to one of a single second-order factor and three first-order factors, (4) to estimate reliabilities for
the test overall and for each subscale, and (5) to estimate the predictive validity of the test for each
grade level.
The first step was to screen the initial set of items within a 2-parameter logistic (2-pl), unidimensional,
item response theory (UIRT) framework. Discrimination and difficulty parameters were inspected. An
item was flagged for scrutiny if (a) its discrimination estimate was less than .4 or greater than 3 or (b)
the absolute value of its difficulty estimate was greater than 3. These cut points were not strictly
enforced. For example, items with low discrimination that appeared to fill a void along the difficulty
continuum received special consideration for being retained.
The second step was to fit the screened data to a correlated-trait item-factor analysis (confirmatory
factor analysis with ordered categorical indicators) model that paralleled a 3-factor model structure
specified by the principal investigator in consultation with item reviewers.
We used the model chi-ゲケ┌;ヴW ふ‐2), RMSEA, CFI, and TLI to evaluate overall model fit. Following
guidelines in the structural-equation modeling literature (Browne & Cudeck, 1992; MacCallum, Browne,
& Sugawara, 1996), we interpreted RMSEA values of .05, .08, and .10, as thresholds of close, reasonable,
and mediocre model fit, respectively, and interpreted values > .10 to indicate poor model fit. Drawing
from findings and observations noted in the literature (Bentler & Bonett, 1980; Hu & Bentler, 1999), we
interpreted CFI and TLI values of .95 and .90 as thresholds of close and reasonable fit, respectively, and
interpreted values < .90 to indicate poor model fit. We note that little is known about the behavior of
these indices when based on models fit to categorical data (Nye & Drasgow, 2011), which adds to the
chorus of cautions associated with using universal cutoff values to determine model adequacy (e.g.,
Chen, Curran, Bollen, Kirby, & Paxton, 2008; Marsh, Hau, & Wen, 2004). Because fit indices were not
used within any of the decision rules, a cautious application of these threshold interpretations bears on
the evaluation of the final models but has no bearing on the process employed in specifying the models.
Confirmatory factor-analysis models with standardized factor loadings > .7 in absolute value are optimal,
as they ensure that at least 50% of the variance in responses is explained by the specified latent trait. In
practice, however, this criterion is often difficult to attain while maintaining the content
representativeness intended for many scales. Researchers working with applied measurement (e.g.,
Reise, Horan, & Blanchard, 2011) have used standardized factor loadings as low as .5 in absolute value
as a threshold for item salience. In accordance with this practice, we aimed to retain only items in the
final model that had standardized factor-loading estimates > .5 and unstandardized factor-loading p-
values < .05.
The third step was to respecify the reduced set of items with a higher-order factor structure, in which
the three first-order factors were regressed onto a single second-order factor. The purpose of
Measuring the Performance of Grade 1 and 2 Students in Counting, Word Problems, and Computation in Fall 2014
Data Entry and Analysis Procedures P a g e | 15
respecifying the factor structure as a higher-order model was to select a more parsimonious factor
structure that provided the pragmatic benefit and utility of having a single underlying factor (and
composite score).
The fourth step was to inspect the scale reliabilities, which we did by calculating the composite reliability
for the higher-order total M;デエ a;Iデラヴ ;ミS Wゲデキマ;デキミェ ラヴSキミ;ノ aラヴマゲ ラa CヴラミH;Iエげゲ üが RW┗WノノWげゲ éが ;ミS MIDラミ;ノSげゲ \h for the subscales. As a supplementary analysis, we also estimated the reliability for the
total Math scale, except modeled as a single factor on which the reduced set of items loaded directly. To
evaluate reliability coefficients, we applied the conventional values of .7 and .8 as the minimum and
target values for scale reliability, respectively (Nunnally & Bernstein, 1994; Streiner, 2003).
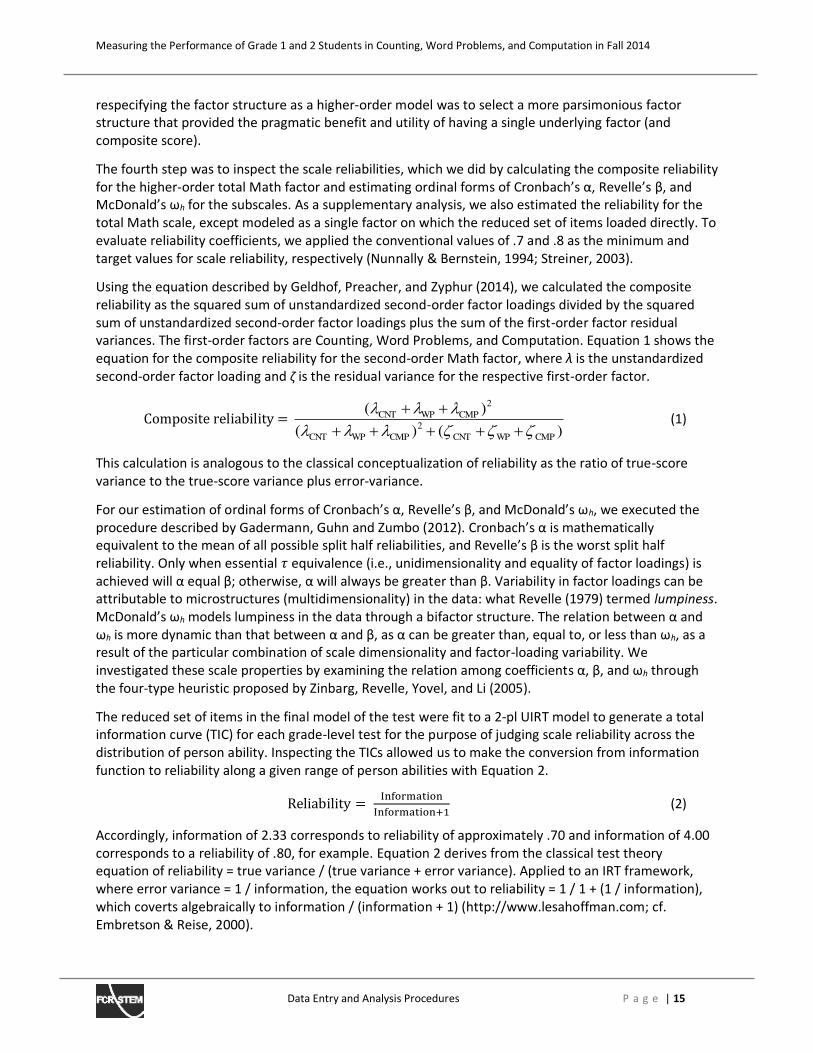
Using the equation described by Geldhof, Preacher, and Zyphur (2014), we calculated the composite
reliability as the squared sum of unstandardized second-order factor loadings divided by the squared
sum of unstandardized second-order factor loadings plus the sum of the first-order factor residual
variances. The first-order factors are Counting, Word Problems, and Computation. Equation 1 shows the
equation for the composite reliability for the second-order Math factor, where ゜ is the unstandardized
second-order factor loading and 、 is the residual variance for the respective first-order factor.
Composite reliability = (1)
This calculation is analogous to the classical conceptualization of reliability as the ratio of true-score
variance to the true-score variance plus error-variance.
Fラヴ ラ┌ヴ Wゲデキマ;デキラミ ラa ラヴSキミ;ノ aラヴマゲ ラa CヴラミH;Iエげゲ üが RW┗WノノWげゲ éが ;ミS MIDラミ;ノSげゲ \h, we executed the
ヮヴラIWS┌ヴW SWゲIヴキHWS H┞ G;SWヴマ;ミミが G┌エミ ;ミS )┌マHラ ふヲヰヱヲぶく CヴラミH;Iエげゲ ü キゲ マ;デエWマ;デキI;ノノ┞ equivalent to the mean of all possible split half reliabilities, ;ミS RW┗WノノWげゲ é キゲ デエW ┘ラヴゲデ ゲヮノキデ エ;ノa reliability. Only when essential 酵 equivalence (i.e., unidimensionality and equality of factor loadings) is
;IエキW┗WS ┘キノノ ü Wケ┌;ノ éき ラデエWヴ┘キゲWが ü ┘キノノ ;ノ┘;┞ゲ HW ェヴW;デWヴ デエ;ミ éく V;ヴキ;Hキノキデy in factor loadings can be
attributable to microstructures (multidimensionality) in the data: what Revelle (1979) termed lumpiness.
MIDラミ;ノSげゲ \h マラSWノゲ ノ┌マヮキミWゲゲ キミ デエW S;デ; デエヴラ┌ェエ ; Hキa;Iデラヴ ゲデヴ┌Iデ┌ヴWく TエW ヴWノ;デキラミ HWデ┘WWミ ü ;ミS \h is more dynamic than デエ;デ HWデ┘WWミ ü ;ミS éが ;ゲ ü I;ミ HW ェヴW;デWヴ デエ;ミが Wケ┌;ノ デラが ラヴ ノWゲゲ デエ;ミ \h, as a
result of the particular combination of scale dimensionality and factor-loading variability. We
investigated these scale properties by examining the relation among coefficientゲ üが éが ;ミS \h through
the four-type heuristic proposed by Zinbarg, Revelle, Yovel, and Li (2005).
The reduced set of items in the final model of the test were fit to a 2-pl UIRT model to generate a total
information curve (TIC) for each grade-level test for the purpose of judging scale reliability across the
distribution of person ability. Inspecting the TICs allowed us to make the conversion from information
function to reliability along a given range of person abilities with Equation 2.
Reliability 噺 瀧樽脱誰嘆鱈叩担辿誰樽瀧樽脱誰嘆鱈叩担辿誰樽袋怠 (2)
Accordingly, information of 2.33 corresponds to reliability of approximately .70 and information of 4.00
corresponds to a reliability of .80, for example. Equation 2 derives from the classical test theory
equation of reliability = true variance / (true variance + error variance). Applied to an IRT framework,
where error variance = 1 / information, the equation works out to reliability = 1 / 1 + (1 / information),
which coverts algebraically to information / (information + 1) (http://www.lesahoffman.com; cf.
Embretson & Reise, 2000).
)()(
)(2
2
CMPWPCNTCMPWPCNT
CMPWPCNT
Measuring the Performance of Grade 1 and 2 Students in Counting, Word Problems, and Computation in Fall 2014
Data Entry and Analysis Procedures P a g e | 16
The reliability estimates directly relevant to the scales as described and presented as the final models in
this research report are the composite reliabilities for the higher-ラヴSWヴ M;デエ a;Iデラヴ ;ミS デエW üが éが ;ミS \h
ヴWノキ;Hキノキデ┞ IラWaaキIキWミデゲ aラヴ デエW ゲ┌HゲI;ノWゲく Tエ;デ キゲが デエW üが éが ;ミS \h reliability coefficients and the 2-pl UIRT
information-based reliability estimates for the total Math scale apply to structures and modeling
approaches different from that of the higher-order structure described in this research report. These
supplementary analyses of reliability for the total Math scale were conducted as part of our endeavor to
obtain a broad understanding of how the items from the final model worked together and are presented
principally with the purpose of thoroughness and transparency in reporting.
TエW aキaデエが ;ミS aキミ;ノが ゲデWヮ ラa ラ┌ヴ キミ┗Wゲデキェ;デキラミ ラa デエW デWゲデゲげ ヮゲ┞IエラマWデヴキI ヮヴラヮWヴデキWゲ ┘;ゲ デラ キミゲヮWIデ aラヴ evidence of predictive validity for the scales. All analyses of predictive validity involved first saving the
factor scores from the final higher-order factor model for the grade 1 and grade 2 tests; then, as
manifest variables, the factor scores were merged into a file containing scores for the ITBS Math
Problems test and ITBS Math Computation test (Dunbar et al., 2008). We investigated evidence of
predictive validity by regressing the ITBS デWゲデゲげ ゲデ;ミS;ヴS ゲIラヴWゲ ラミデラ デエW ェヴ;SW 1 and grade 2 デWゲデゲげ factor scores. Standardized é) coefficients, corresponding p-values, and adjusted R-squared (R2
Adjusted)
coefficients of determination are reported, and an R2Adjusted > .4 is interpreted to indicate that a
substantial proportion of variance in the target outcome was explained by the test score. The ITBS tests
were administered to the sample in spring 2015. For the predictive validity analyses, the sample was
restricted to the control group students only.
Measuring the Performance of Grade 1 and 2 Students in Counting, Word Problems, and Computation in Fall 2014
Results P a g e | 17
4. Results
The following sections describe the process of item screening, evaluation, and model respecification
that was used to determine the final set of items. Before we report on the detailed results of those
analyses, we provide a blueprint for the final tests in section 4.1 that shows the number of items
corresponding to the three lower-order factors in the final scale for the tests. After providing the
blueprint, we proceed chronologically through the steps of screening, model specification, and
evaluation.
4.1. Three-factor Test Blueprint
Table 1 in section 1.1 provided an overview of the original items offered to students on the 2014 EMSA.
The grade 1 test initially included 22 items and the grade 2 test 23 items. Some of the items were
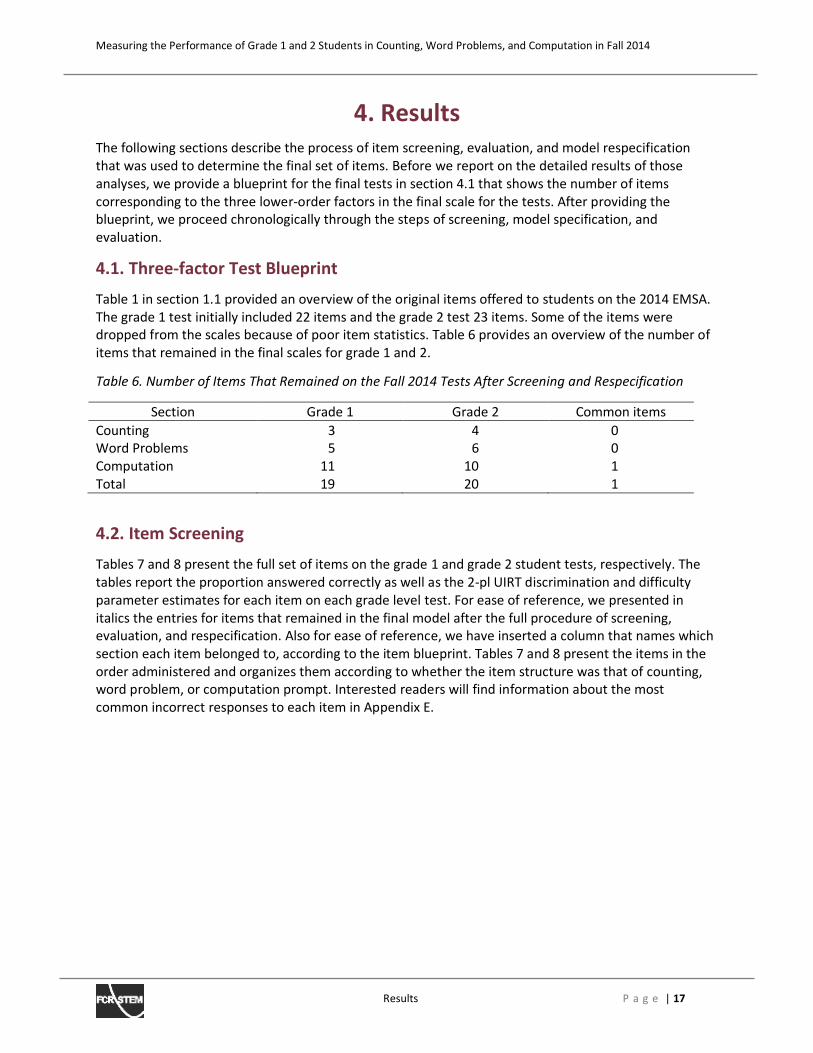
dropped from the scales because of poor item statistics. Table 6 provides an overview of the number of
items that remained in the final scales for grade 1 and 2.
Table 6. Number of Items That Remained on the Fall 2014 Tests After Screening and Respecification
Section Grade 1 Grade 2 Common items
Counting 3 4 0
Word Problems 5 6 0
Computation 11 10 1
Total 19 20 1
4.2. Item Screening
Tables 7 and 8 present the full set of items on the grade 1 and grade 2 student tests, respectively. The
tables report the proportion answered correctly as well as the 2-pl UIRT discrimination and difficulty
parameter estimates for each item on each grade level test. For ease of reference, we presented in
italics the entries for items that remained in the final model after the full procedure of screening,
evaluation, and respecification. Also for ease of reference, we have inserted a column that names which
section each item belonged to, according to the item blueprint. Tables 7 and 8 present the items in the
order administered and organizes them according to whether the item structure was that of counting,
word problem, or computation prompt. Interested readers will find information about the most
common incorrect responses to each item in Appendix E.
Measuring the Performance of Grade 1 and 2 Students in Counting, Word Problems, and Computation in Fall 2014
Results P a g e | 18
4.2.1. Grade 1 Item Screening
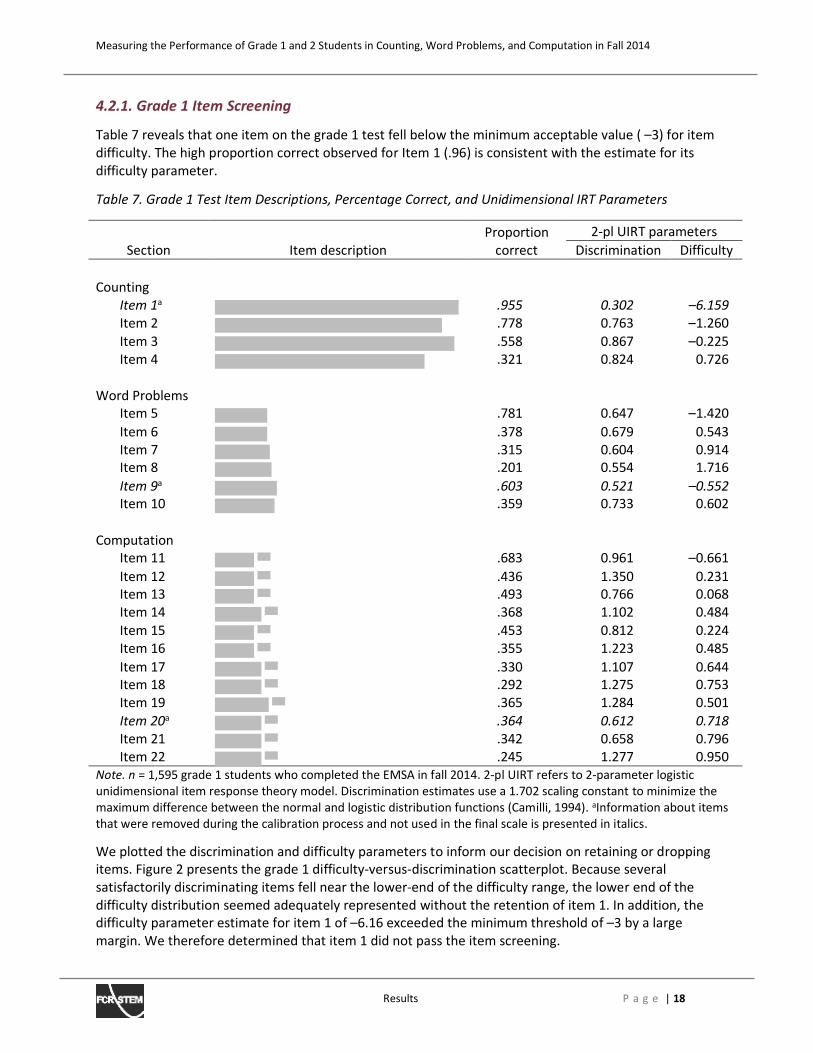
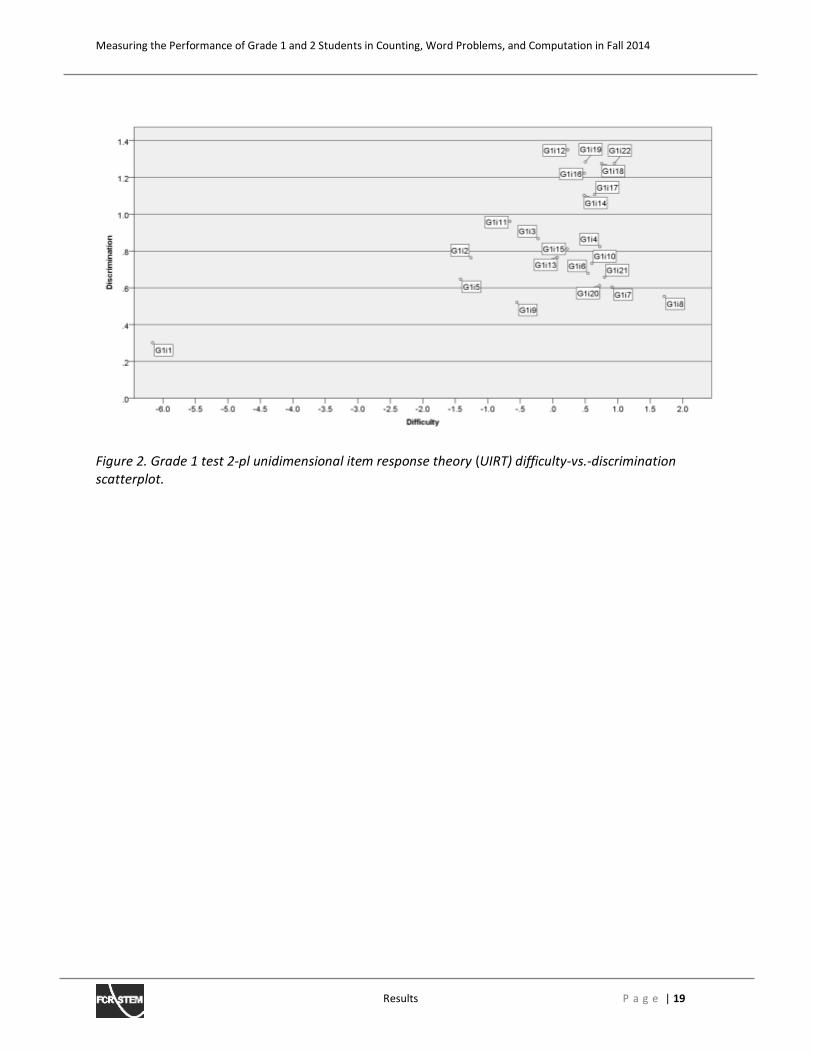
Table 7 reveals that one item on the grade 1 test fell below the minimum acceptable value ( に3) for item
difficulty. The high proportion correct observed for Item 1 (.96) is consistent with the estimate for its
difficulty parameter.
Table 7. Grade 1 Test Item Descriptions, Percentage Correct, and Unidimensional IRT Parameters
Proportion
correct
2-pl UIRT parameters
Section Item description Discrimination Difficulty
Counting
Item 1a .955 0.302 に6.159
Item 2 .778 0.763 に1.260
Item 3 .558 0.867 に0.225
Item 4 .321 0.824 0.726
Word Problems
Item 5 .781 0.647 に1.420
Item 6 .378 0.679 0.543
Item 7 .315 0.604 0.914
Item 8 .201 0.554 1.716
Item 9a .603 0.521 に0.552
Item 10 .359 0.733 0.602
Computation
Item 11 .683 0.961 に0.661
Item 12 .436 1.350 0.231
Item 13 .493 0.766 0.068
Item 14 .368 1.102 0.484
Item 15 .453 0.812 0.224
Item 16 .355 1.223 0.485
Item 17 .330 1.107 0.644
Item 18 .292 1.275 0.753
Item 19 .365 1.284 0.501
Item 20a .364 0.612 0.718
Item 21 .342 0.658 0.796
Item 22 .245 1.277 0.950
Note. n = 1,595 grade 1 students who completed the EMSA in fall 2014. 2-pl UIRT refers to 2-parameter logistic
unidimensional item response theory model. Discrimination estimates use a 1.702 scaling constant to minimize the
maximum difference between the normal and logistic distribution functions (Camilli, 1994). aInformation about items
that were removed during the calibration process and not used in the final scale is presented in italics.
We plotted the discrimination and difficulty parameters to inform our decision on retaining or dropping
items. Figure 2 presents the grade 1 difficulty-versus-discrimination scatterplot. Because several
satisfactorily discriminating items fell near the lower-end of the difficulty range, the lower end of the
difficulty distribution seemed adequately represented without the retention of item 1. In addition, the
difficulty parameter estimate for item 1 of に6.16 exceeded the minimum threshold of に3 by a large
margin. We therefore determined that item 1 did not pass the item screening.
Measuring the Performance of Grade 1 and 2 Students in Counting, Word Problems, and Computation in Fall 2014
Results P a g e | 19
Figure 2. Grade 1 test 2-pl unidimensional item response theory (UIRT) difficulty-vs.-discrimination
scatterplot.
Measuring the Performance of Grade 1 and 2 Students in Counting, Word Problems, and Computation in Fall 2014
Results P a g e | 20
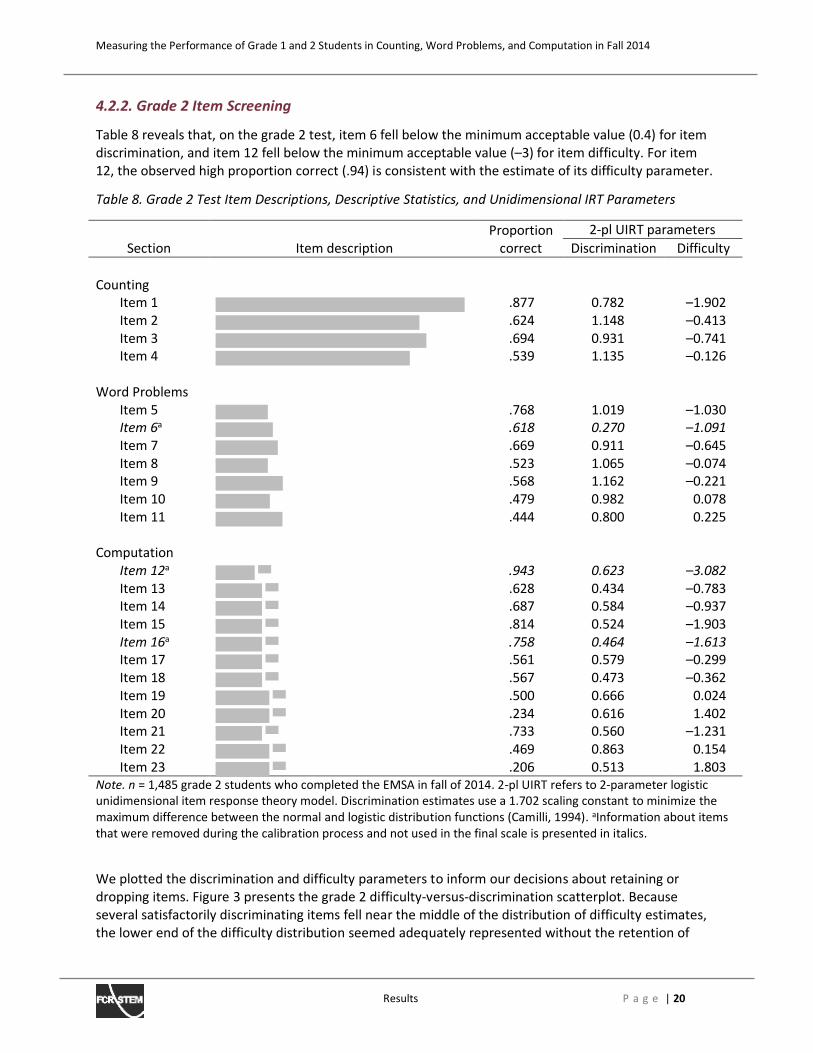
4.2.2. Grade 2 Item Screening
Table 8 reveals that, on the grade 2 test, item 6 fell below the minimum acceptable value (0.4) for item
discrimination, and item 12 fell below the minimum acceptable value (に3) for item difficulty. For item
12, the observed high proportion correct (.94) is consistent with the estimate of its difficulty parameter.
Table 8. Grade 2 Test Item Descriptions, Descriptive Statistics, and Unidimensional IRT Parameters
Proportion
correct
2-pl UIRT parameters
Section Item description Discrimination Difficulty
Counting
Item 1 .877 0.782 に1.902
Item 2 .624 1.148 に0.413
Item 3 .694 0.931 に0.741
Item 4 .539 1.135 に0.126
Word Problems
Item 5 .768 1.019 に1.030
Item 6a .618 0.270 に1.091
Item 7 .669 0.911 に0.645
Item 8 .523 1.065 に0.074
Item 9 .568 1.162 に0.221
Item 10 .479 0.982 0.078
Item 11 .444 0.800 0.225
Computation
Item 12a .943 0.623 に3.082
Item 13 .628 0.434 に0.783
Item 14 .687 0.584 に0.937
Item 15 .814 0.524 に1.903
Item 16a .758 0.464 に1.613
Item 17 .561 0.579 に0.299
Item 18 .567 0.473 に0.362
Item 19 .500 0.666 0.024
Item 20 .234 0.616 1.402
Item 21 .733 0.560 に1.231
Item 22 .469 0.863 0.154
Item 23 .206 0.513 1.803
Note. n = 1,485 grade 2 students who completed the EMSA in fall of 2014. 2-pl UIRT refers to 2-parameter logistic
unidimensional item response theory model. Discrimination estimates use a 1.702 scaling constant to minimize the
maximum difference between the normal and logistic distribution functions (Camilli, 1994). aInformation about items
that were removed during the calibration process and not used in the final scale is presented in italics.
We plotted the discrimination and difficulty parameters to inform our decisions about retaining or
dropping items. Figure 3 presents the grade 2 difficulty-versus-discrimination scatterplot. Because
several satisfactorily discriminating items fell near the middle of the distribution of difficulty estimates,
the lower end of the difficulty distribution seemed adequately represented without the retention of
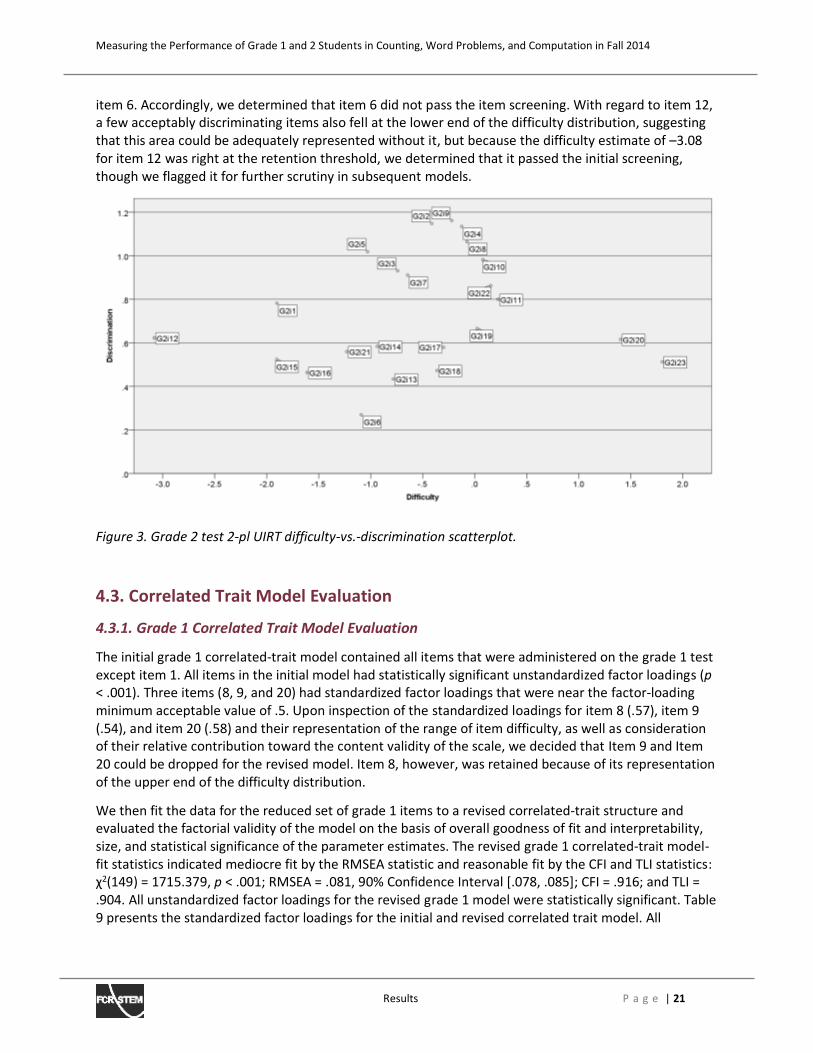
Measuring the Performance of Grade 1 and 2 Students in Counting, Word Problems, and Computation in Fall 2014
Results P a g e | 21
item 6. Accordingly, we determined that item 6 did not pass the item screening. With regard to item 12,
a few acceptably discriminating items also fell at the lower end of the difficulty distribution, suggesting
that this area could be adequately represented without it, but because the difficulty estimate of に3.08
for item 12 was right at the retention threshold, we determined that it passed the initial screening,
though we flagged it for further scrutiny in subsequent models.
Figure 3. Grade 2 test 2-pl UIRT difficulty-vs.-discrimination scatterplot.
4.3. Correlated Trait Model Evaluation
4.3.1. Grade 1 Correlated Trait Model Evaluation
The initial grade 1 correlated-trait model contained all items that were administered on the grade 1 test
except item 1. All items in the initial model had statistically significant unstandardized factor loadings (p
< .001). Three items (8, 9, and 20) had standardized factor loadings that were near the factor-loading
minimum acceptable value of .5. Upon inspection of the standardized loadings for item 8 (.57), item 9
(.54), and item 20 (.58) and their representation of the range of item difficulty, as well as consideration
of their relative contribution toward the content validity of the scale, we decided that Item 9 and Item
20 could be dropped for the revised model. Item 8, however, was retained because of its representation
of the upper end of the difficulty distribution.
We then fit the data for the reduced set of grade 1 items to a revised correlated-trait structure and
evaluated the factorial validity of the model on the basis of overall goodness of fit and interpretability,
size, and statistical significance of the parameter estimates. The revised grade 1 correlated-trait model-
fit statistics indicated mediocre fit by the RMSEA statistic and reasonable fit by the CFI and TLI statistics:
‐2(149) = 1715.379, p < .001; RMSEA = .081, 90% Confidence Interval [.078, .085]; CFI = .916; and TLI =
.904. All unstandardized factor loadings for the revised grade 1 model were statistically significant. Table
9 presents the standardized factor loadings for the initial and revised correlated trait model. All
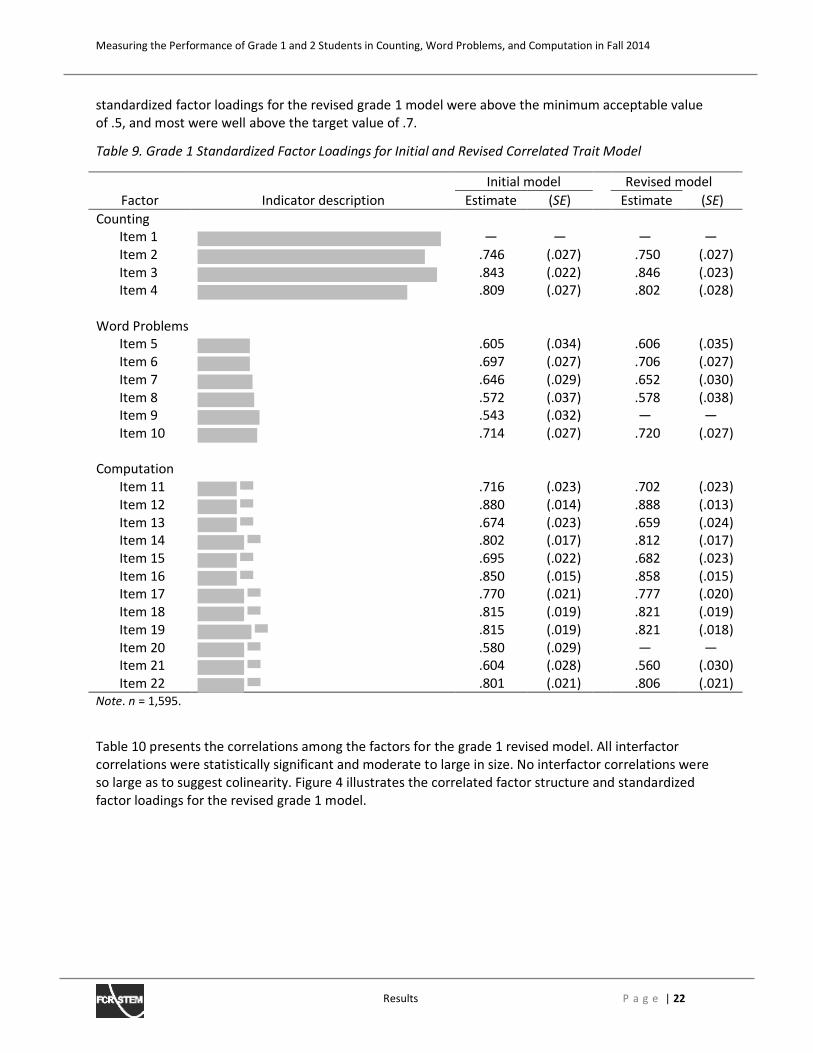
Measuring the Performance of Grade 1 and 2 Students in Counting, Word Problems, and Computation in Fall 2014
Results P a g e | 22
standardized factor loadings for the revised grade 1 model were above the minimum acceptable value
of .5, and most were well above the target value of .7.
Table 9. Grade 1 Standardized Factor Loadings for Initial and Revised Correlated Trait Model
Factor
Initial model Revised model
Indicator description Estimate (SE) Estimate (SE)
Counting
Item 1 ね ね ね ね
Item 2 .746 (.027) .750 (.027)
Item 3 .843 (.022) .846 (.023)
Item 4 .809 (.027) .802 (.028)
Word Problems
Item 5 .605 (.034) .606 (.035)
Item 6 .697 (.027) .706 (.027)
Item 7 .646 (.029) .652 (.030)
Item 8 .572 (.037) .578 (.038)
Item 9 .543 (.032) ね ね
Item 10 .714 (.027) .720 (.027)
Computation
Item 11 .716 (.023) .702 (.023)
Item 12 .880 (.014) .888 (.013)
Item 13 .674 (.023) .659 (.024)
Item 14 .802 (.017) .812 (.017)
Item 15 .695 (.022) .682 (.023)
Item 16 .850 (.015) .858 (.015)
Item 17 .770 (.021) .777 (.020)
Item 18 .815 (.019) .821 (.019)
Item 19 .815 (.019) .821 (.018)
Item 20 .580 (.029) ね ね
Item 21 .604 (.028) .560 (.030)
Item 22 .801 (.021) .806 (.021)
Note. n = 1,595.
Table 10 presents the correlations among the factors for the grade 1 revised model. All interfactor
correlations were statistically significant and moderate to large in size. No interfactor correlations were
so large as to suggest colinearity. Figure 4 illustrates the correlated factor structure and standardized
factor loadings for the revised grade 1 model.
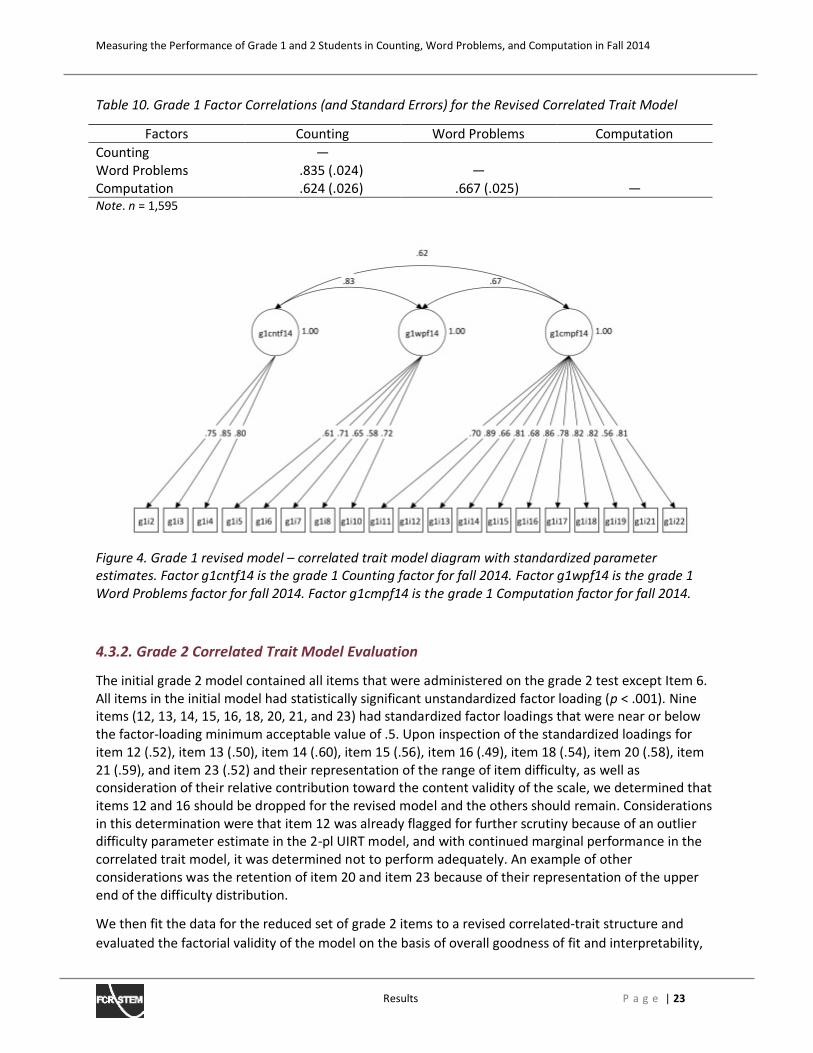
Measuring the Performance of Grade 1 and 2 Students in Counting, Word Problems, and Computation in Fall 2014
Results P a g e | 23
Table 10. Grade 1 Factor Correlations (and Standard Errors) for the Revised Correlated Trait Model
Factors Counting Word Problems Computation
Counting は
Word Problems .835 (.024) は
Computation .624 (.026) .667 (.025) は
Note. n = 1,595
Figure 4. Grade 1 revised model に correlated trait model diagram with standardized parameter
estimates. Factor g1cntf14 is the grade 1 Counting factor for fall 2014. Factor g1wpf14 is the grade 1
Word Problems factor for fall 2014. Factor g1cmpf14 is the grade 1 Computation factor for fall 2014.
4.3.2. Grade 2 Correlated Trait Model Evaluation
The initial grade 2 model contained all items that were administered on the grade 2 test except Item 6.
All items in the initial model had statistically significant unstandardized factor loading (p < .001). Nine
items (12, 13, 14, 15, 16, 18, 20, 21, and 23) had standardized factor loadings that were near or below
the factor-loading minimum acceptable value of .5. Upon inspection of the standardized loadings for
item 12 (.52), item 13 (.50), item 14 (.60), item 15 (.56), item 16 (.49), item 18 (.54), item 20 (.58), item
21 (.59), and item 23 (.52) and their representation of the range of item difficulty, as well as
consideration of their relative contribution toward the content validity of the scale, we determined that
items 12 and 16 should be dropped for the revised model and the others should remain. Considerations
in this determination were that item 12 was already flagged for further scrutiny because of an outlier
difficulty parameter estimate in the 2-pl UIRT model, and with continued marginal performance in the
correlated trait model, it was determined not to perform adequately. An example of other
considerations was the retention of item 20 and item 23 because of their representation of the upper
end of the difficulty distribution.
We then fit the data for the reduced set of grade 2 items to a revised correlated-trait structure and
evaluated the factorial validity of the model on the basis of overall goodness of fit and interpretability,
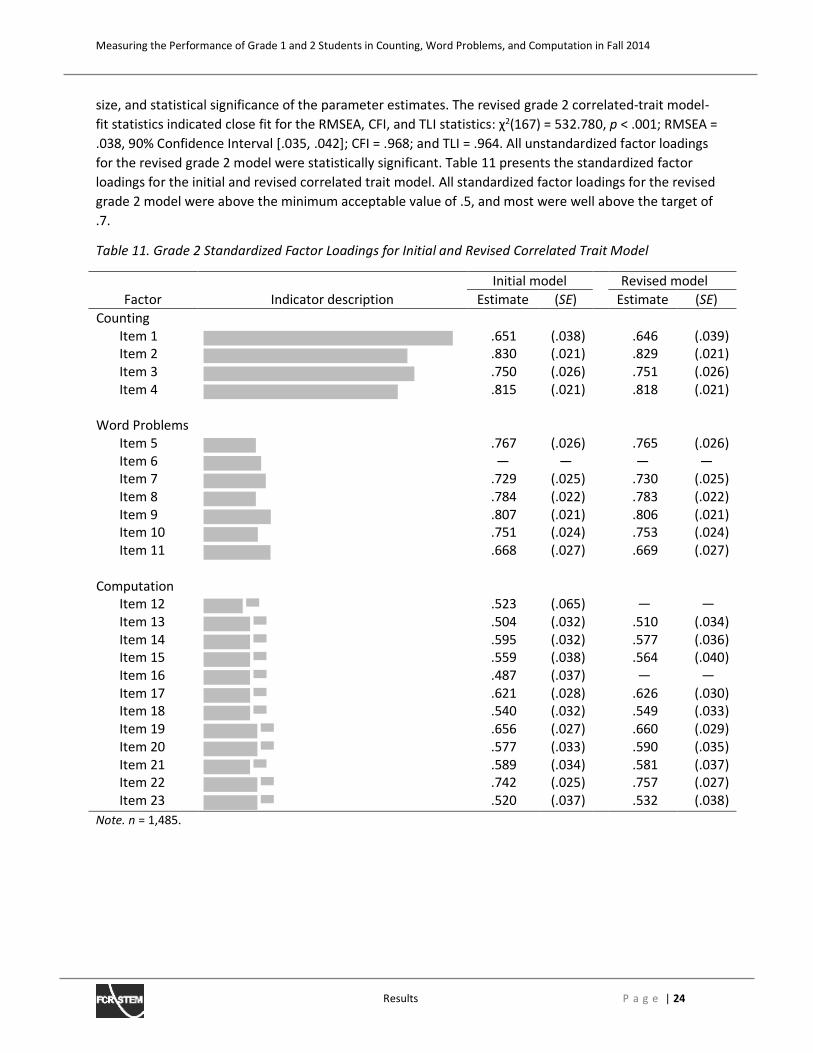
Measuring the Performance of Grade 1 and 2 Students in Counting, Word Problems, and Computation in Fall 2014
Results P a g e | 24
size, and statistical significance of the parameter estimates. The revised grade 2 correlated-trait model-
fit statistics indicated close fit for the RMSEA, CFI, and TLI statisticsぎ ‐2(167) = 532.780, p < .001; RMSEA =
.038, 90% Confidence Interval [.035, .042]; CFI = .968; and TLI = .964. All unstandardized factor loadings
for the revised grade 2 model were statistically significant. Table 11 presents the standardized factor
loadings for the initial and revised correlated trait model. All standardized factor loadings for the revised
grade 2 model were above the minimum acceptable value of .5, and most were well above the target of
.7.
Table 11. Grade 2 Standardized Factor Loadings for Initial and Revised Correlated Trait Model
Factor
Initial model Revised model
Indicator description Estimate (SE) Estimate (SE)
Counting
Item 1 .651 (.038) .646 (.039)
Item 2 .830 (.021) .829 (.021)
Item 3 .750 (.026) .751 (.026)
Item 4 .815 (.021) .818 (.021)
Word Problems
Item 5 .767 (.026) .765 (.026)
Item 6 は は は は
Item 7 .729 (.025) .730 (.025)
Item 8 .784 (.022) .783 (.022)
Item 9 .807 (.021) .806 (.021)
Item 10 .751 (.024) .753 (.024)
Item 11 .668 (.027) .669 (.027)
Computation
Item 12 .523 (.065) は は
Item 13 .504 (.032) .510 (.034)
Item 14 .595 (.032) .577 (.036)
Item 15 .559 (.038) .564 (.040)
Item 16 .487 (.037) は は
Item 17 .621 (.028) .626 (.030)
Item 18 .540 (.032) .549 (.033)
Item 19 .656 (.027) .660 (.029)
Item 20 .577 (.033) .590 (.035)
Item 21 .589 (.034) .581 (.037)
Item 22 .742 (.025) .757 (.027)
Item 23 .520 (.037) .532 (.038)
Note. n = 1,485.
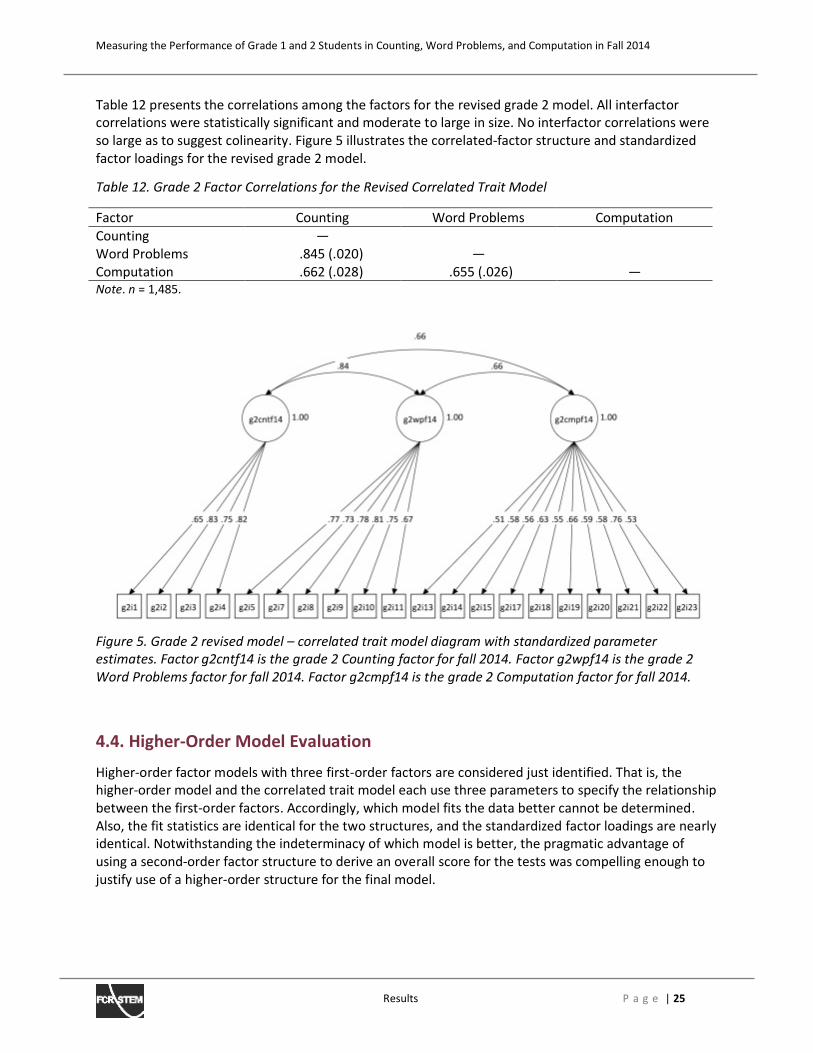
Measuring the Performance of Grade 1 and 2 Students in Counting, Word Problems, and Computation in Fall 2014
Results P a g e | 25
Table 12 presents the correlations among the factors for the revised grade 2 model. All interfactor
correlations were statistically significant and moderate to large in size. No interfactor correlations were
so large as to suggest colinearity. Figure 5 illustrates the correlated-factor structure and standardized
factor loadings for the revised grade 2 model.
Table 12. Grade 2 Factor Correlations for the Revised Correlated Trait Model
Factor Counting Word Problems Computation
Counting は
Word Problems .845 (.020) は
Computation .662 (.028) .655 (.026) は
Note. n = 1,485.
Figure 5. Grade 2 revised model に correlated trait model diagram with standardized parameter
estimates. Factor g2cntf14 is the grade 2 Counting factor for fall 2014. Factor g2wpf14 is the grade 2
Word Problems factor for fall 2014. Factor g2cmpf14 is the grade 2 Computation factor for fall 2014.
4.4. Higher-Order Model Evaluation
Higher-order factor models with three first-order factors are considered just identified. That is, the
higher-order model and the correlated trait model each use three parameters to specify the relationship
between the first-order factors. Accordingly, which model fits the data better cannot be determined.
Also, the fit statistics are identical for the two structures, and the standardized factor loadings are nearly
identical. Notwithstanding the indeterminacy of which model is better, the pragmatic advantage of
using a second-order factor structure to derive an overall score for the tests was compelling enough to
justify use of a higher-order structure for the final model.
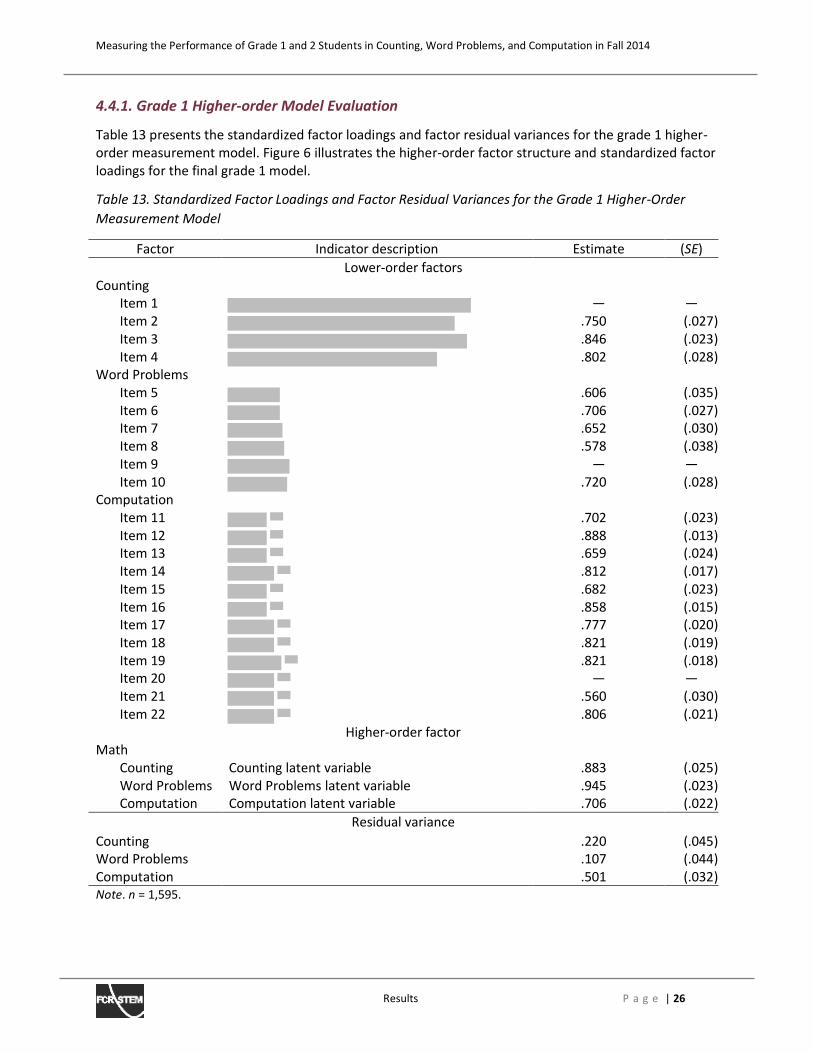
Measuring the Performance of Grade 1 and 2 Students in Counting, Word Problems, and Computation in Fall 2014
Results P a g e | 26
4.4.1. Grade 1 Higher-order Model Evaluation
Table 13 presents the standardized factor loadings and factor residual variances for the grade 1 higher-
order measurement model. Figure 6 illustrates the higher-order factor structure and standardized factor
loadings for the final grade 1 model.
Table 13. Standardized Factor Loadings and Factor Residual Variances for the Grade 1 Higher-Order
Measurement Model
Factor Indicator description Estimate (SE)
Lower-order factors
Counting
Item 1 は は
Item 2 .750 (.027)
Item 3 .846 (.023)
Item 4 .802 (.028)
Word Problems
Item 5 .606 (.035)
Item 6 .706 (.027)
Item 7 .652 (.030)
Item 8 .578 (.038)
Item 9 は は
Item 10 .720 (.028)
Computation
Item 11 .702 (.023)
Item 12 .888 (.013)
Item 13 .659 (.024)
Item 14 .812 (.017)
Item 15 .682 (.023)
Item 16 .858 (.015)
Item 17 .777 (.020)
Item 18 .821 (.019)
Item 19 .821 (.018)
Item 20 は は
Item 21 .560 (.030)
Item 22 .806 (.021)
Higher-order factor
Math
Counting Counting latent variable .883 (.025)
Word Problems Word Problems latent variable .945 (.023)
Computation Computation latent variable .706 (.022)
Residual variance
Counting .220 (.045)
Word Problems .107 (.044)
Computation .501 (.032)
Note. n = 1,595.
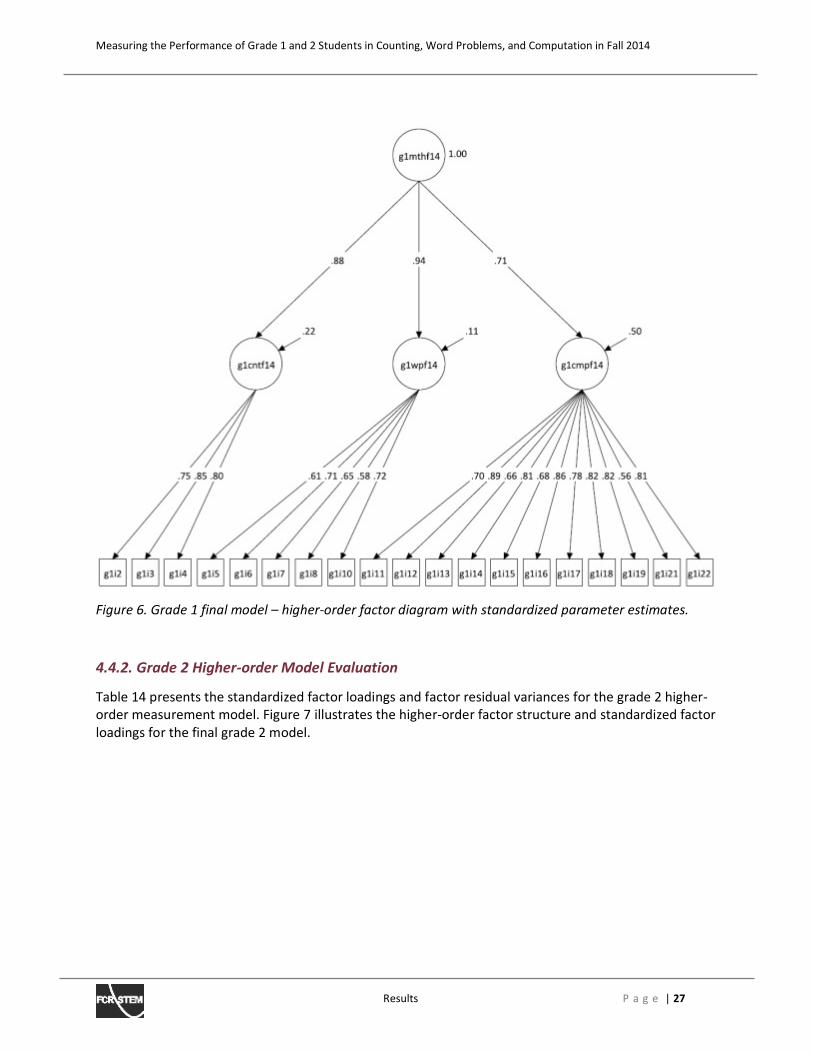
Measuring the Performance of Grade 1 and 2 Students in Counting, Word Problems, and Computation in Fall 2014
Results P a g e | 27
Figure 6. Grade 1 final model に higher-order factor diagram with standardized parameter estimates.
4.4.2. Grade 2 Higher-order Model Evaluation
Table 14 presents the standardized factor loadings and factor residual variances for the grade 2 higher-
order measurement model. Figure 7 illustrates the higher-order factor structure and standardized factor
loadings for the final grade 2 model.
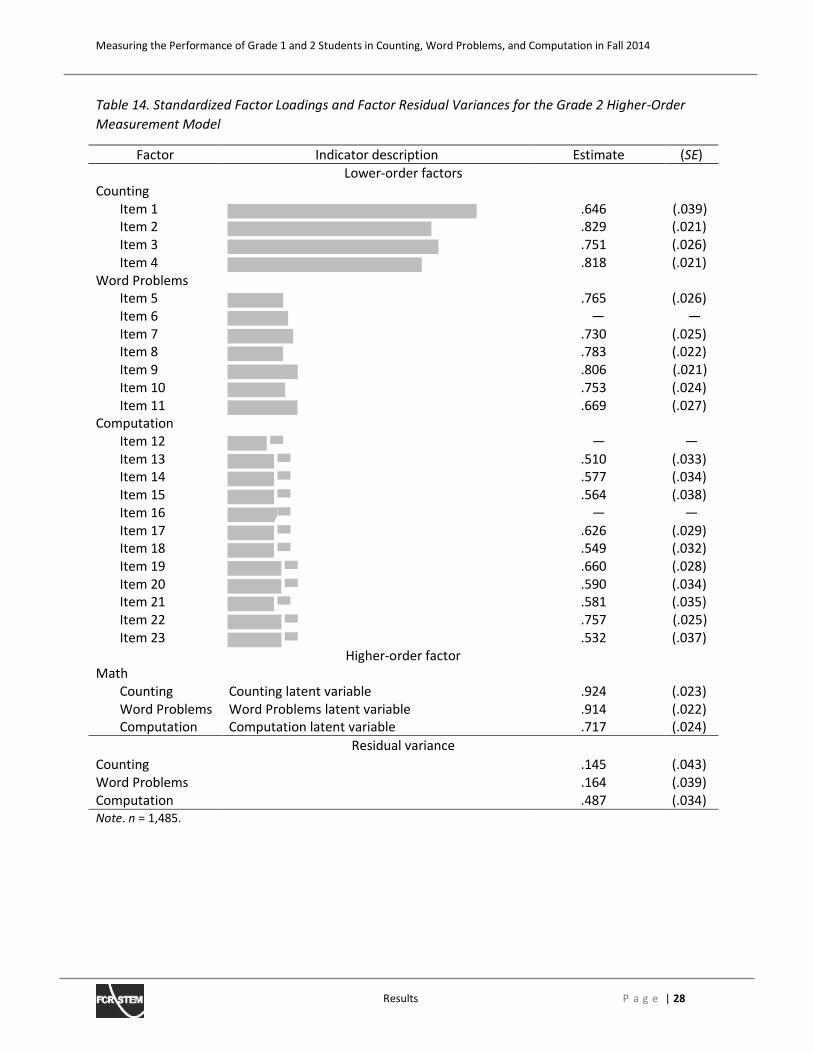
Measuring the Performance of Grade 1 and 2 Students in Counting, Word Problems, and Computation in Fall 2014
Results P a g e | 28
Table 14. Standardized Factor Loadings and Factor Residual Variances for the Grade 2 Higher-Order
Measurement Model
Factor Indicator description Estimate (SE)
Lower-order factors
Counting
Item 1 .646 (.039)
Item 2 .829 (.021)
Item 3 .751 (.026)
Item 4 .818 (.021)
Word Problems
Item 5 .765 (.026)
Item 6 は ね
Item 7 .730 (.025)
Item 8 .783 (.022)
Item 9 .806 (.021)
Item 10 .753 (.024)
Item 11 .669 (.027)
Computation
Item 12 は は
Item 13 .510 (.033)
Item 14 .577 (.034)
Item 15 .564 (.038)
Item 16 は は
Item 17 .626 (.029)
Item 18 .549 (.032)
Item 19 .660 (.028)
Item 20 .590 (.034)
Item 21 .581 (.035)
Item 22 .757 (.025)
Item 23 .532 (.037)
Higher-order factor
Math
Counting Counting latent variable .924 (.023)
Word Problems Word Problems latent variable .914 (.022)
Computation Computation latent variable .717 (.024)
Residual variance
Counting .145 (.043)
Word Problems .164 (.039)
Computation .487 (.034)
Note. n = 1,485.
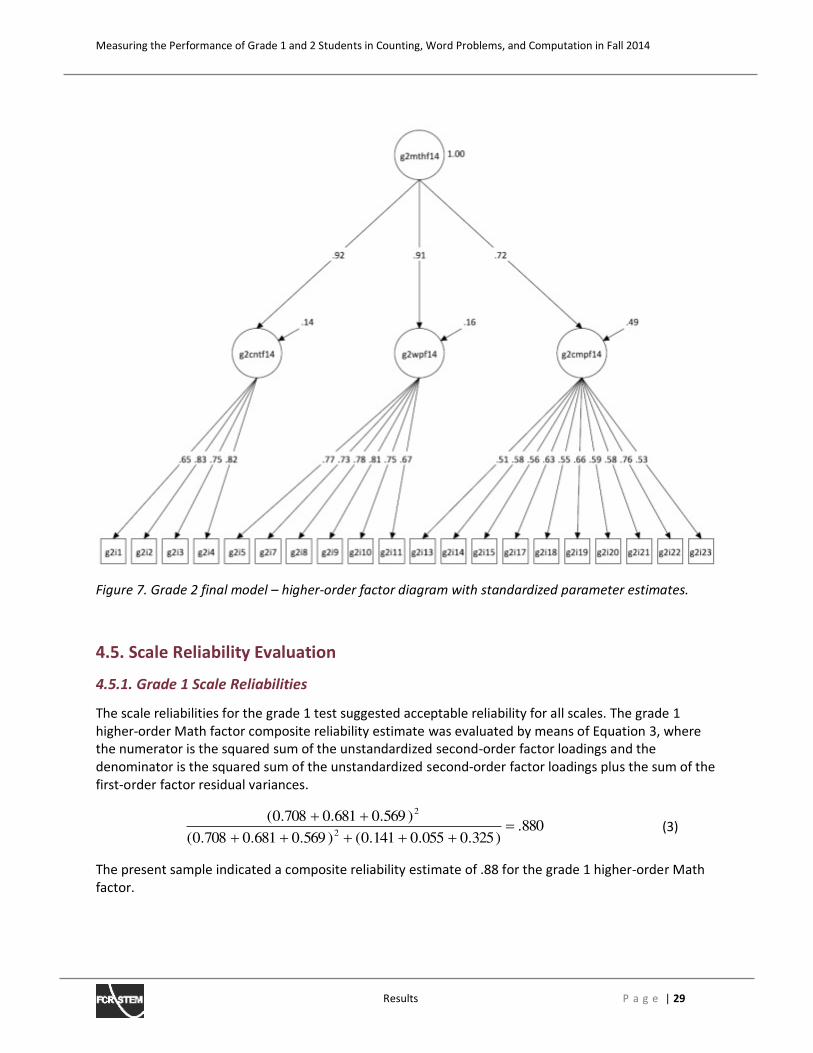
Measuring the Performance of Grade 1 and 2 Students in Counting, Word Problems, and Computation in Fall 2014
Results P a g e | 29
Figure 7. Grade 2 final model に higher-order factor diagram with standardized parameter estimates.
4.5. Scale Reliability Evaluation
4.5.1. Grade 1 Scale Reliabilities
The scale reliabilities for the grade 1 test suggested acceptable reliability for all scales. The grade 1
higher-order Math factor composite reliability estimate was evaluated by means of Equation 3, where
the numerator is the squared sum of the unstandardized second-order factor loadings and the
denominator is the squared sum of the unstandardized second-order factor loadings plus the sum of the
first-order factor residual variances.
(3)
The present sample indicated a composite reliability estimate of .88 for the grade 1 higher-order Math
factor.
880.)325.0055.0141.0()569.0681.0708.0(
)569.0681.0708.0(2
2
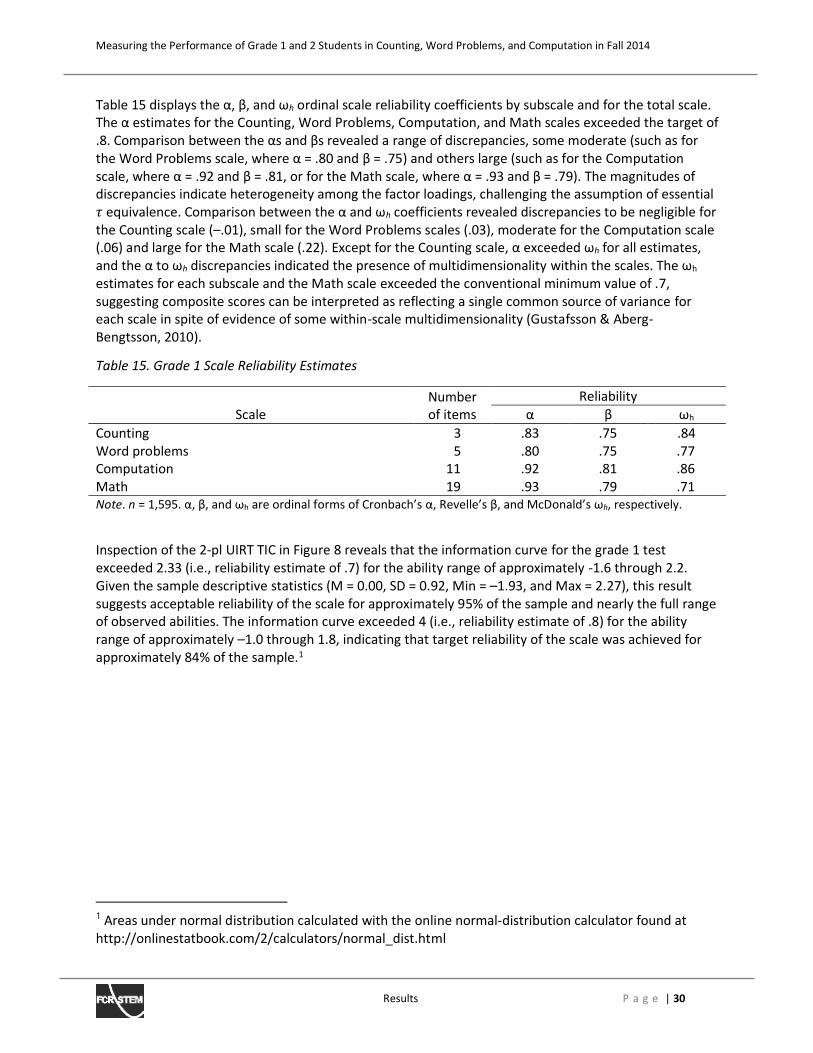
Measuring the Performance of Grade 1 and 2 Students in Counting, Word Problems, and Computation in Fall 2014
Results P a g e | 30
Table 15 displays デエW üが éが ;ミS \h ordinal scale reliability coefficients by subscale and for the total scale.
TエW ü Wゲデキマ;デWゲ aラヴ デエW Cラ┌ミデキミェ, Word Problems, Computation, and Math scales exceeded the target of
くΒく Cラマヮ;ヴキゲラミ HWデ┘WWミ デエW üゲ ;ミS éゲ ヴW┗W;ノWS ; ヴ;ミェW ラa SキゲIヴWヮ;ミIキWゲが ゲラマW マラSWヴ;デW ふゲ┌Iエ ;ゲ aラヴ the Word Problems scale, ┘エWヴW ü Э くΒ0 ;ミS é Э くΑ5) and others large (such as for the Computation
scale, ┘エWヴW ü Э くΓ2 ;ミS é Э く81, or for the Math scale, ┘エWヴW ü Э くΓ3 ;ミS é Э く79). The magnitudes of
discrepancies indicate heterogeneity among the factor loadings, challenging the assumption of essential 酵 Wケ┌キ┗;ノWミIWく Cラマヮ;ヴキゲラミ HWデ┘WWミ デエW ü ;ミS \h coefficients revealed discrepancies to be negligible for
the Counting scale (に.01), small for the Word Problems scales (.03), moderate for the Computation scale
(.06) and large for the Math scale (.22). Except for the Counting scaleが ü W┝IWWSWS \h for all estimates,
and デエW ü デラ \h discrepancies indicated the presence of multidimensionality ┘キデエキミ デエW ゲI;ノWゲく TエW \h
estimates for each subscale and the Math scale exceeded the conventional minimum value of .7,
suggesting composite scores can be interpreted as reflecting a single common source of variance for
each scale in spite of evidence of some within-scale multidimensionality (Gustafsson & Aberg-
Bengtsson, 2010).
Table 15. Grade 1 Scale Reliability Estimates
Number
of items
Reliability
Scale ü é \h
Counting 3 .83 .75 .84
Word problems 5 .80 .75 .77
Computation 11 .92 .81 .86
Math 19 .93 .79 .71
Note. n = 1,595. ü, é, and \h are ラヴSキミ;ノ aラヴマゲ ラa CヴラミH;Iエげゲ üが RW┗WノノWげゲ éが ;ミS MIDラミ;ノSげゲ \h, respectively.
Inspection of the 2-pl UIRT TIC in Figure 8 reveals that the information curve for the grade 1 test
exceeded 2.33 (i.e., reliability estimate of .7) for the ability range of approximately -1.6 through 2.2.
Given the sample descriptive statistics (M = 0.00, SD = 0.92, Min = に1.93, and Max = 2.27), this result
suggests acceptable reliability of the scale for approximately 95% of the sample and nearly the full range
of observed abilities. The information curve exceeded 4 (i.e., reliability estimate of .8) for the ability
range of approximately に1.0 through 1.8, indicating that target reliability of the scale was achieved for
approximately 84% of the sample.1
1 Areas under normal distribution calculated with the online normal-distribution calculator found at
http://onlinestatbook.com/2/calculators/normal_dist.html
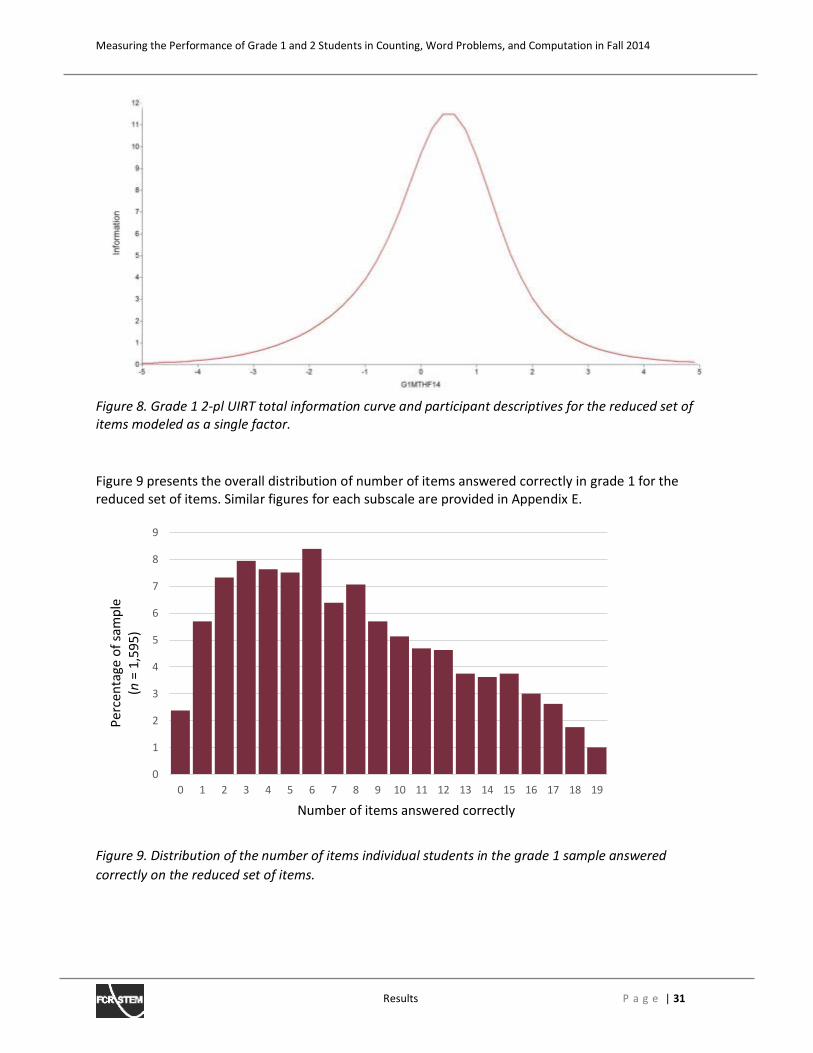
Measuring the Performance of Grade 1 and 2 Students in Counting, Word Problems, and Computation in Fall 2014
Results P a g e | 31
Figure 8. Grade 1 2-pl UIRT total information curve and participant descriptives for the reduced set of
items modeled as a single factor.
Figure 9 presents the overall distribution of number of items answered correctly in grade 1 for the
reduced set of items. Similar figures for each subscale are provided in Appendix E.
Figure 9. Distribution of the number of items individual students in the grade 1 sample answered
correctly on the reduced set of items.
0
1
2
3
4
5
6
7
8
9
0 1 2 3 4 5 6 7 8 9 10 11 12 13 14 15 16 17 18 19
Pe
rce
nta
ge
of
sam
ple
(n =
1,5
95
)
Number of items answered correctly
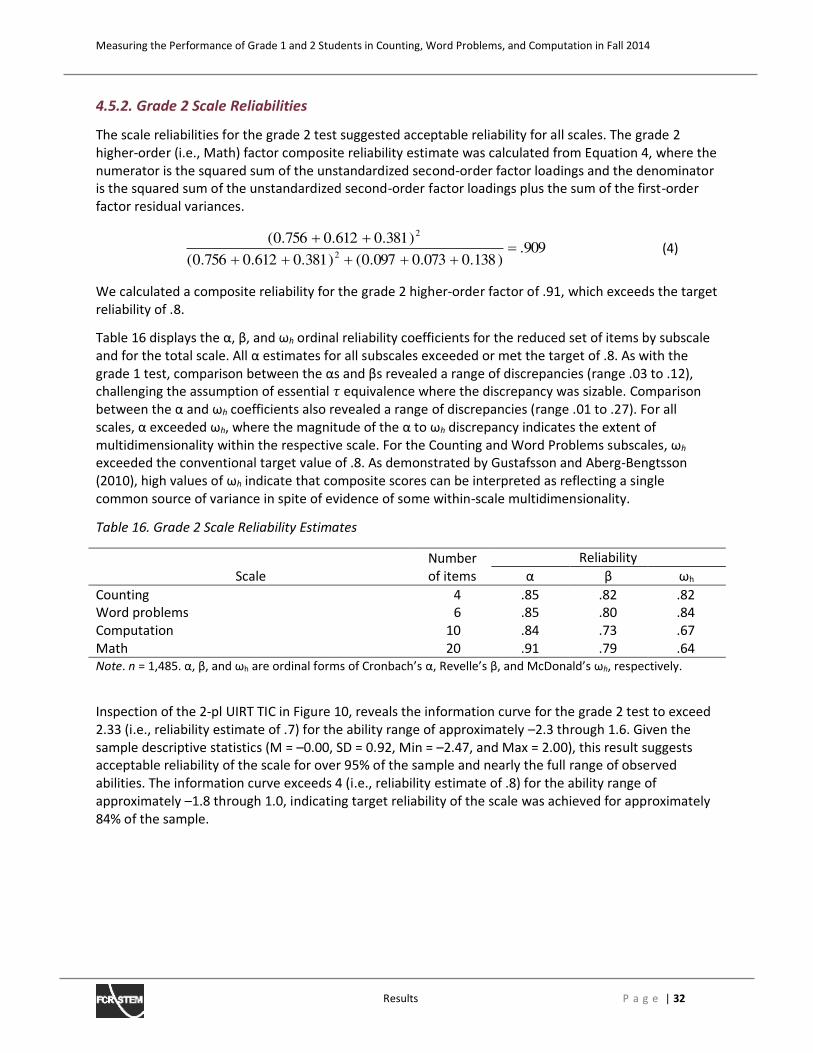
Measuring the Performance of Grade 1 and 2 Students in Counting, Word Problems, and Computation in Fall 2014
Results P a g e | 32
4.5.2. Grade 2 Scale Reliabilities
The scale reliabilities for the grade 2 test suggested acceptable reliability for all scales. The grade 2
higher-order (i.e., Math) factor composite reliability estimate was calculated from Equation 4, where the
numerator is the squared sum of the unstandardized second-order factor loadings and the denominator
is the squared sum of the unstandardized second-order factor loadings plus the sum of the first-order
factor residual variances.
(4)
We calculated a composite reliability for the grade 2 higher-order factor of .91, which exceeds the target
reliability of .8.
Table 16 displays the ü, é, and \h ordinal reliability coefficients for the reduced set of items by subscale
and for the total scale. All ü estimates for all subscales exceeded or met the target of .8. As with the
grade 1 test, comparison between the üs and és revealed a range of discrepancies (range .03 to .12),
challenging the assumption of essential 酵 equivalence where the discrepancy was sizable. Comparison
between the ü and \h coefficients also revealed a range of discrepancies (range .01 to .27). For all
scales, ü exceeded \h, where the magnitude of the ü to \h discrepancy indicates the extent of
multidimensionality within the respective scale. For the Counting and Word Problems subscales, \h
exceeded the conventional target value of .8. As demonstrated by Gustafsson and Aberg-Bengtsson
(2010), high values of \h indicate that composite scores can be interpreted as reflecting a single
common source of variance in spite of evidence of some within-scale multidimensionality.
Table 16. Grade 2 Scale Reliability Estimates
Number
of items
Reliability
Scale ü é \h
Counting 4 .85 .82 .82
Word problems 6 .85 .80 .84
Computation 10 .84 .73 .67
Math 20 .91 .79 .64
Note. n = 1,485. ü, é, and \h ;ヴW ラヴSキミ;ノ aラヴマゲ ラa CヴラミH;Iエげゲ üが RW┗WノノWげゲ é, ;ミS MIDラミ;ノSげゲ \h, respectively.
Inspection of the 2-pl UIRT TIC in Figure 10, reveals the information curve for the grade 2 test to exceed
2.33 (i.e., reliability estimate of .7) for the ability range of approximately に2.3 through 1.6. Given the
sample descriptive statistics (M = に0.00, SD = 0.92, Min = に2.47, and Max = 2.00), this result suggests
acceptable reliability of the scale for over 95% of the sample and nearly the full range of observed
abilities. The information curve exceeds 4 (i.e., reliability estimate of .8) for the ability range of
approximately に1.8 through 1.0, indicating target reliability of the scale was achieved for approximately
84% of the sample.
909.)138.0073.0097.0()381.0612.0756.0(
)381.0612.0756.0(2
2
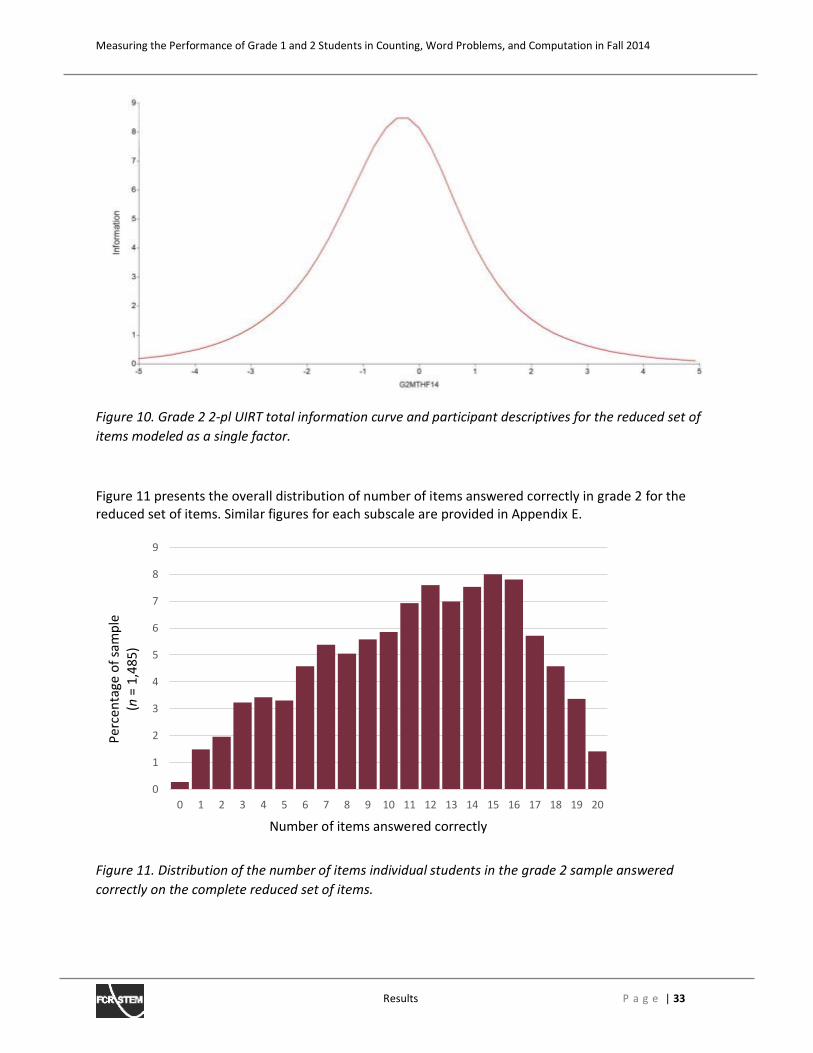
Measuring the Performance of Grade 1 and 2 Students in Counting, Word Problems, and Computation in Fall 2014
Results P a g e | 33
Figure 10. Grade 2 2-pl UIRT total information curve and participant descriptives for the reduced set of
items modeled as a single factor.
Figure 11 presents the overall distribution of number of items answered correctly in grade 2 for the
reduced set of items. Similar figures for each subscale are provided in Appendix E.
Figure 11. Distribution of the number of items individual students in the grade 2 sample answered
correctly on the complete reduced set of items.
0
1
2
3
4
5
6
7
8
9
0 1 2 3 4 5 6 7 8 9 10 11 12 13 14 15 16 17 18 19 20
Pe
rce
nta
ge
of
sam
ple
(n =
1,4
85
)
Number of items answered correctly
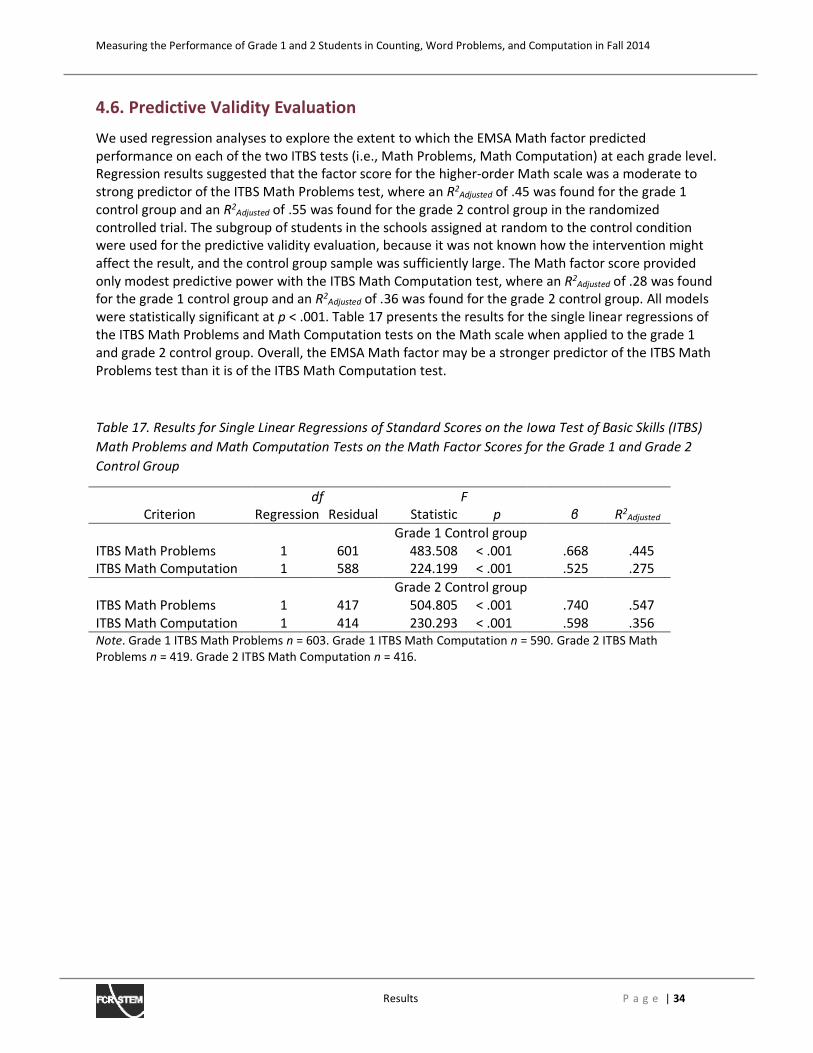
Measuring the Performance of Grade 1 and 2 Students in Counting, Word Problems, and Computation in Fall 2014
Results P a g e | 34
4.6. Predictive Validity Evaluation
We used regression analyses to explore the extent to which the EMSA Math factor predicted
performance on each of the two ITBS tests (i.e., Math Problems, Math Computation) at each grade level.
Regression results suggested that the factor score for the higher-order Math scale was a moderate to
strong predictor of the ITBS Math Problems test, where an R2Adjusted of .45 was found for the grade 1
control group and an R2Adjusted of .55 was found for the grade 2 control group in the randomized
controlled trial. The subgroup of students in the schools assigned at random to the control condition
were used for the predictive validity evaluation, because it was not known how the intervention might
affect the result, and the control group sample was sufficiently large. The Math factor score provided
only modest predictive power with the ITBS Math Computation test, where an R2Adjusted of .28 was found
for the grade 1 control group and an R2Adjusted of .36 was found for the grade 2 control group. All models
were statistically significant at p < .001. Table 17 presents the results for the single linear regressions of
the ITBS Math Problems and Math Computation tests on the Math scale when applied to the grade 1
and grade 2 control group. Overall, the EMSA Math factor may be a stronger predictor of the ITBS Math
Problems test than it is of the ITBS Math Computation test.
Table 17. Results for Single Linear Regressions of Standard Scores on the Iowa Test of Basic Skills (ITBS)
Math Problems and Math Computation Tests on the Math Factor Scores for the Grade 1 and Grade 2
Control Group
df F
Criterion Regression Residual Statistic p é R2Adjusted
Grade 1 Control group
ITBS Math Problems 1 601 483.508 < .001 .668 .445
ITBS Math Computation 1 588 224.199 < .001 .525 .275
Grade 2 Control group
ITBS Math Problems 1 417 504.805 < .001 .740 .547
ITBS Math Computation 1 414 230.293 < .001 .598 .356
Note. Grade 1 ITBS Math Problems n = 603. Grade 1 ITBS Math Computation n = 590. Grade 2 ITBS Math
Problems n = 419. Grade 2 ITBS Math Computation n = 416.
Measuring the Performance of Grade 1 and 2 Students in Counting, Word Problems, and Computation in Fall 2014
Discussion and Conclusions P a g e | 35
5. Discussion and Conclusions
The intended use of the fall 2014 EMSA tests was to serve as a baseline test of student achievement to
be used as a covariate in a randomized controlled trial of a teacher professional-development
intervention. The development and analysis of the fall 2014 EMSA tests are consistent with general
recommendations for test development and test validation for the intended purposes of the Fall 2014
EMSA. If the test were used for other purposes, such as to distinguish among levels of individual student
achievement, it would require further development and validation.
The field tests involved a diverse sample of several thousand grade 1 and 2 students in fall 2014. The
tests were administered at the beginning of the school year by classroom teachers in most cases. The
test scores were not known by the schools or used for any kind of school- or teacher-accountability
purpose. Our sample does not reveal how changes in these testing conditions might affect the data.
Further validation efforts would be necessary if the test were administered under different conditions or
used for different purposes.
5.1. Validation
Flake et al. (2017) outline three phases of construct validation: substantive, structural, and external.
These phases provide a useful lens for evaluating the validity of the test for its intended purpose. The
development and field testing of the fall 2014 EMSA provides evidence of validity for each of the three
phases. We discuss each of those phases in that order.
5.1.1. Substantive Validation
The analysis of content in the CCSS-M and the CGI professional development program provided a
definition of the content. The items were developed on the basis of previous tests and expert
knowledge of the CCSS-M and the CGI program. Items were selected or written on the basis of results of
the fall 2013 EMSA tests and the spring 2014 MPAC interview. Administration procedures were
consistent with typical classroom assessment in mathematics, including that of standardized tests such
as the ITBS. External review of items and scoring criteria provided further support for the substantive
phase of construct validation.
5.1.2. Structural Validation
The structural phase of validation was fairly extensive in the field test of the fall 2014 EMSA tests. Initial
screening provided a calibration phase to determine the difficulty and discrimination of items to the
target population. The data were fit to both a correlated-traits and a second-order factor analysis
model. To generate overall test scores, we regressed three first-order factors (Counting, Word Problems,
Computation) onto a single second-order factor (Math). The second-order Math factor score is intended
to serve as the overall achievement score on the test. Goodness-of-fit statistics varied but generally
indicated that the specified measurement models provided a reasonable fit to the data. The grade 1
model RMSEA statistic indicated mediocre fit and the CFI and TLI statistics indicated reasonable fit.
The reliabilities of the test scales were determined by means of a composite reliability estimate for the
M;デエ a;Iデラヴ ;ミS ラヴSキミ;ノ aラヴマゲ ラa CヴラミH;Iエげゲ ü for the three subscales. The grade 1 math composite
reliability was .88. The grade 2 math composite reliability was .91. Grade 1 ü estimates for the three
subscales all met or exceeded the conventional target value of .8 (range .80 to .92). Grade 2 ü estimates
for the three subscales all exceeded the conventional target value of .8 (range .84 to .85).
Measuring the Performance of Grade 1 and 2 Students in Counting, Word Problems, and Computation in Fall 2014
Discussion and Conclusions P a g e | 36
Dキ;ェミラゲデキI ;ミS ゲ┌ヮヮノWマWミデ;ヴ┞ ;ミ;ノ┞ゲWゲ ラa ゲI;ノW ヴWノキ;Hキノキデ┞が キミIノ┌Sキミェ ラヴSキミ;ノ aラヴマゲ ラa RW┗WノノWげゲ é and
MIDラミ;ノSげs \h coefficients and IRT information-based reliability estimates provided further insight into
the test. Little discrepancy was apparent among these various reliability estimates, but the MIDラミ;ノSげゲ \h for the higher-level Math factor can be interpreted to indicate potential multidimensionality in the
scale. The TIC indicates that reliability estimates exceed .80 for a large proportion of the sample at both
grade levels. The calibration of items to the ability levels of the target population probably contributed
to the high reliability estimates.
5.1.3. External Validation
We examined evidence for the predictive validity of the test by regressing the standard scores for the
level 7 and level 8 ITBS tests (Dunbar et al., 2008) tests on the Math factor scores for grades 1 and 2,
respectively. This type of information is particularly useful to researchers and evaluators in the power
analysis phase of research design. Regression results suggested that the Math score was a moderate to
strong predictor of the ITBS Math Problems test. The Math scores provided more modest predictive
power with the ITBS Math Computation test. The regression analyses suggest the test to be an
appropriate covariate in analyses that use the ITBS tests as outcomes.
5.2. Summary and Conclusions
The development process and results of the fall 2014 field test provide evidence of substantive,
structural, and external validity of the fall 2014 EMSA tests (Flake, Pek, & Hehman, 2017). The results
indicate that the resulting tests are well suited for their intended purpose. An area for improvement and
further development for that intended purpose would be to design the tests so that they can be linked
vertically across grade levels (using a common set of anchor items in each of the three sections of the
test) to enable the grade 1 and 2 scores to be generated on a common scale. Vertical scaling would
permit pooling of data across grade levels, which might increase statistical power for a given sample
involving students at multiple grade levels.
Measuring the Performance of Grade 1 and 2 Students in Counting, Word Problems, and Computation in Fall 2014
References P a g e | 37
References
Bentler, P. M., & Bonett, D. G. (1980). Significance tests and goodness of fit in the analysis of covariance
structures. Psychological Bulletin, 88(3), 588に606.
Browne, M. W., & Cudeck, R. (1992). Alternative ways of assessing model fit. Sociological Methods & Research,
21(2), 230に258.
Camilli, G. (1994). Origin of the scaling constant d = 1.7 in item response theory. Journal of Educational and
Behavioral Statistics, 19(3), 293に295.
Carpenter, T. P., Fennema, E., Franke, M. L., Levi, L., & Empson, S. B. (1999). CエキノSヴWミげゲ マ;デエWマ;デキIゲぎ Cラェミキデキ┗Wノ┞ guided instruction. Portsmouth, NH: Heinemann.
Carpenter, T. P., Fennema, E., Peterson, P. L., Chiang, C. P., & Loef, M. (1989). Using knowledge of childrenげs
mathematics thinking in classroom teaching: An experimental study. American Educational Research
Journal, 26(4), 385に531.
Chen, F., Curran, P. J., Bollen, K. A., Kirby, J., & Paxton, P. (2008). An empirical evaluation of the use of fixed
cutoff points in RMSEA test statistic in structural equation models. Sociological Methods & Research,
36(4), 462-494.
Dunbar, S. B., Hoover, H. D., Frisbie, D. A., Ordman, V. L., Oberley, K. R., Naylor, R. J., & Bray, G. B. (2008). Iowa
Test of Basic Skills®, Form C, Level 7. Rolling Meadows, IL: Riverside Publishing.
Embretson, S.E. & Reise, S. P. (2000). Item response theory for Psychologists. Mahwah, NJ: Lawrence Erlbaum
Associates.
Fennema, E., Carpenter, T. P., Franke, M. L., Levi, L., Jacobs, V. R., & Empson, S. B. (1996). A longitudinal study
of learning to use childrenげs thinking in mathematics instruction. Journal for Research in Mathematics
Education, 27(4), 458に477.
Flake, J. K., Pek, J., & Hehman, E. (2017). Construct validation in social and personality research: Current
practice and recommendations. Social Psychological and Personality Science, 8(4), 1に9.
Gadermann, A. M., Guhn, M., & Zumbo, B. D. (2012). Estimating ordinal reliability for Likert-type and ordinal
item response data: A conceptual, empirical, and practical guide. Practical Assessment, Research &
Evaluation, 17(3). Available online: http://pareonline.net/getvn.asp?v=17&n=3
Geldhof, G. J., Preacher, K. J., & Zyphur, M. J. (2014). Reliability estimation in a multilevel confirmatory factor
analysis framework. Psychological Methods, 19(1), 72に91.
Gustafsson, J. E., & Aberg-Bengtsson, L. (2010). Unidimensionality and the interpretability of psychological
instruments. In S. E. Embretson (Ed.), Measuring psychological constructs (pp. 97に121). Washington, DC:
American Psychological Association.
Hu, L., & Bentler, P. M. (1999). Cutoff criteria for fit indexes in covariance structure analysis: Conventional
criteria versus new alternatives. Structural Equation Modeling: A Multidisciplinary Journal, 6(1), 1に55, doi:
10.1080/10705519909540118.
Jacobs, V. R., Franke, M. L., Carpenter, T. P., Levi, L., & Battey, D. (2007). Professional development focused on
children's algebraic reasoning in elementary school. Journal for Research in Mathematics Education,
38(3), 258に288.
Measuring the Performance of Grade 1 and 2 Students in Counting, Word Problems, and Computation in Fall 2014
References P a g e | 38
MacCallum, R. C., Browne, M. W., & Sugawara, H. M. (1996). Power analysis and determination of sample size
for covariance structure modeling. Psychological Methods, 1(2), 130に149.
Marsh, H. W., Hau, K.-T., & Wen, Z. (2004). In search of golden rules: Comment on hypothesis-testing
approaches to setting cutoff values for fit indexes and dangers in overgeneralizing Hu and Bentler's
(1999) findings. Structural Equation Modeling, 11(3), 320-341.
Muthén, L. K., & Muthén, B. O. (1998-2012). Mヮノ┌ゲ UゲWヴげゲ G┌キSW. Seventh Edition. Los Angeles, CA: Muthén &
Muthén.
NGACBP (National Governors Association Center for Best Practices) and CCSSO (Council of Chief State School
Officers). (2010). Common Core State Standards for Mathematics. Washington, DC: Authors.
Nunnally, J. C., & Bernstein, I. H. (1994). Psychometric theory (3rd ed.). New York: McGraw-Hill.
Nye, C. D. & Drasgow, F. (2011). Assessing goodness of fit: Simple rules of thumb simply do not work.
Organizational Research Methods, 14(3), 548に570.
R Development Core Team (2014). R: A language and environment for statistical computing. Vienna, Austria: R
Foundation for Statistical Computing. Retrieved from http://www.R-project.org
Reise, S. P., Horan, W. P., & Blanchard, J. J. (2011). The challenges of fitting an item response theory model to
the Social Anhedonia Scale. Journal of Personality Assessment, 93(3), 213に224.
Revelle, W. (1979). Hierarchical cluster analysis and the internal structure of tests. Multivariate Behavioral
Research, 14(1), 57に74.
Revelle, W. (2016). psych: Procedures for personality and psychological research (Version 1.6.6). Evanston,
Illinois: Northwestern University. Retrieved from http://CRAN.R-project.org/package=psych
Schoen, R. C., LaVenia, M., Bauduin, C., & Farina, K. (2016). Elementary mathematics student assessment:
Measuring the performance of grade 1 and 2 students in counting, word problems, and computation in
fall 2013 (Research Report No. 2016-03). Tallahassee, FL: Learning Systems Institute, Florida State
University.
Schoen, R. C., LaVenia, M., Champagne, Z. M., & Farina, K. (2016). Mathematics performance and cognition
(MPAC) interview: Measuring grade 1 and 2 student achievement in number, operations, and equality in
spring 2014 (Research Report No. 2016に01). Tallahassee, FL: Learning Systems Institute, Florida State
University. doi:10.1725/fsu.1493238156
Schoen, R. C., Champagne, Z. M., Whitacre, I., & McCrackin, S. (Manuscript submitted for review). Comparing
the frequency and variation of additive word problems in U.S. first-grade textbooks in the 1980s and the
Common Core era. Teachers College Record.
Stigler, J. W., Fuson, K. C., Ham, M., & Kim, M. S. (1986). An analysis of addition and subtraction word problems
in American and Soviet elementary mathematics textbooks. Cognition and Instruction, 3(3), 153に171.
Streiner, D. L. (2003) Starting at the beginning: An introduction to coefficient alpha and internal consistency.
Journal of Personality Assessment, 80(1), 99に103.
)キミH;ヴェが Rく Eくが RW┗WノノWが Wくが Yラ┗Wノが Iくが わ Lキが Wく ふヲヰヰヵぶく CヴラミH;Iエげゲ ü, Revelleげs é, McDonaldげs \h: Their relations
with each other and two alternative conceptualizations of reliability. Psychometrika, 70(1), 123に133.
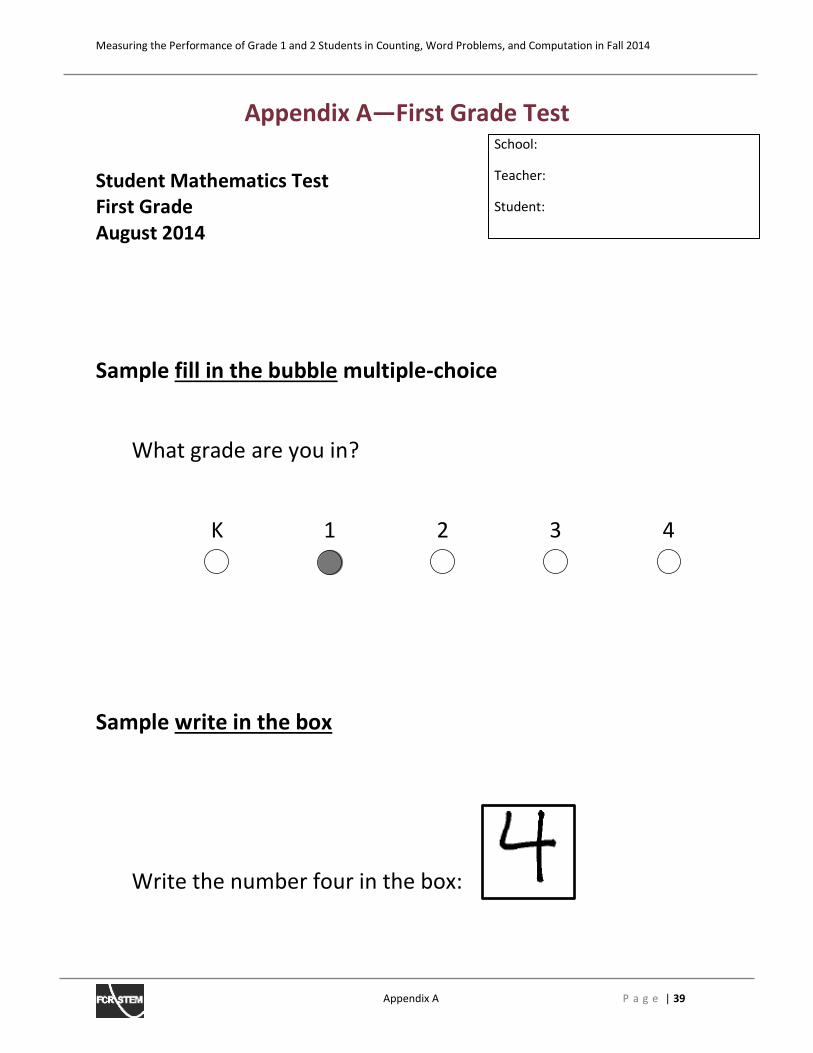
Measuring the Performance of Grade 1 and 2 Students in Counting, Word Problems, and Computation in Fall 2014
Appendix A P a g e | 39
Appendix AͶFirst Grade Test
Student Mathematics Test
First Grade
August 2014
Sample fill in the bubble multiple-choice
What grade are you in?
K 1 2 3 4
Sample write in the box
Write the number four in the box:
School:
Teacher:
Student:
Measuring the Performance of Grade 1 and 2 Students in Counting, Word Problems, and Computation in Fall 2014
Appendix A P a g e | 40
Measuring the Performance of Grade 1 and 2 Students in Counting, Word Problems, and Computation in Fall 2014
Appendix A P a g e | 41
Measuring the Performance of Grade 1 and 2 Students in Counting, Word Problems, and Computation in Fall 2014
Appendix A P a g e | 42
Measuring the Performance of Grade 1 and 2 Students in Counting, Word Problems, and Computation in Fall 2014
Appendix A P a g e | 43
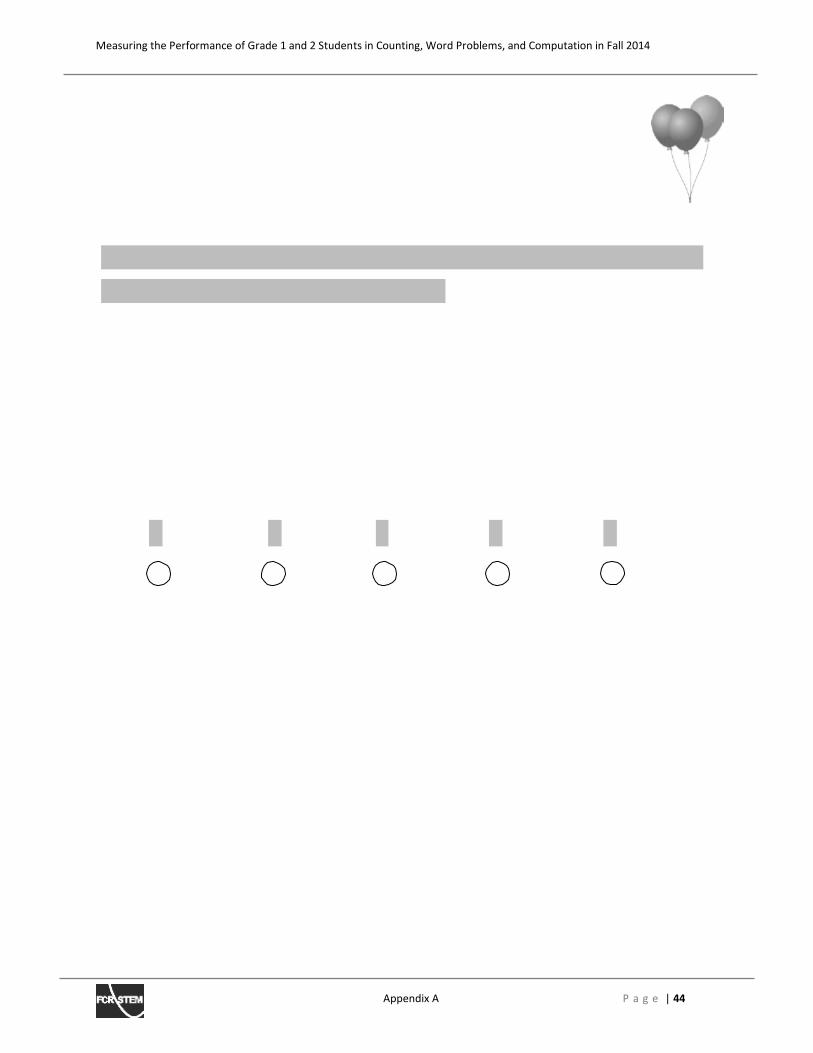
Measuring the Performance of Grade 1 and 2 Students in Counting, Word Problems, and Computation in Fall 2014
Appendix A P a g e | 44
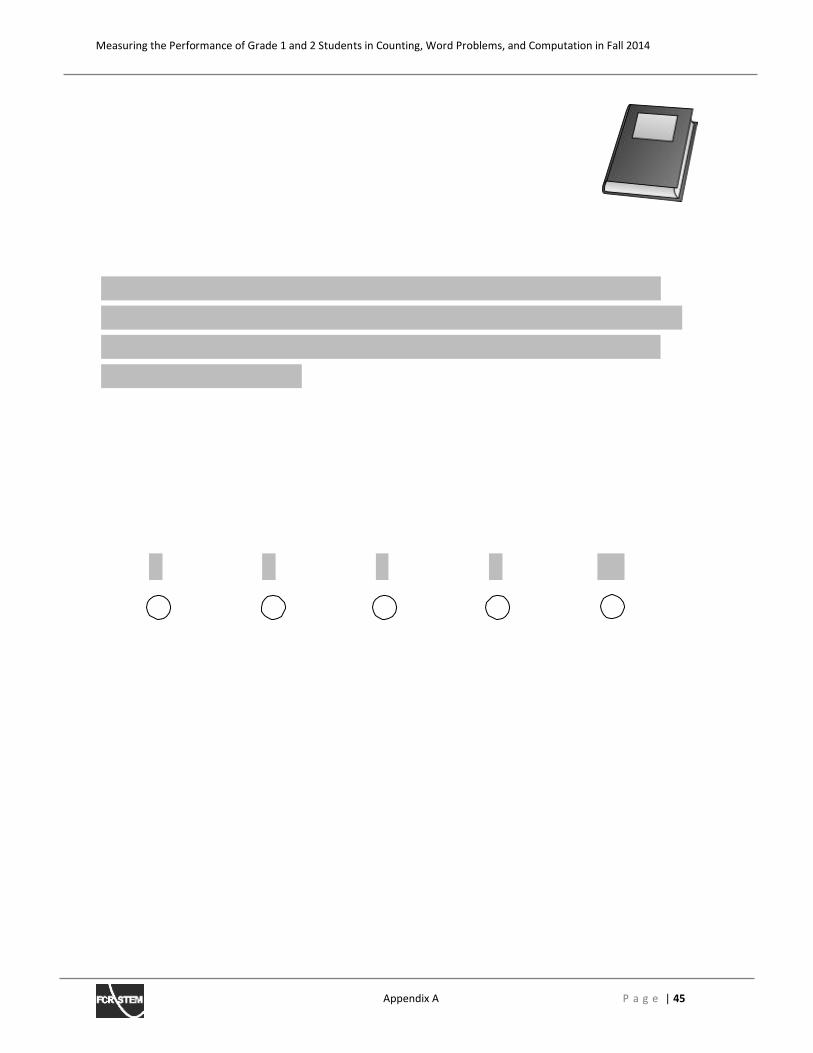
Measuring the Performance of Grade 1 and 2 Students in Counting, Word Problems, and Computation in Fall 2014
Appendix A P a g e | 45
Measuring the Performance of Grade 1 and 2 Students in Counting, Word Problems, and Computation in Fall 2014
Appendix A P a g e | 46
Measuring the Performance of Grade 1 and 2 Students in Counting, Word Problems, and Computation in Fall 2014
Appendix A P a g e | 47
Measuring the Performance of Grade 1 and 2 Students in Counting, Word Problems, and Computation in Fall 2014
Appendix A P a g e | 49
Measuring the Performance of Grade 1 and 2 Students in Counting, Word Problems, and Computation in Fall 2014
Appendix A P a g e | 51
Measure copyright 2014, Replicating the CGI Experiment in Diverse Environments, Florida State University. Not for reproduction or use without
written consent of Replicating the CGI Experiment in Diverse Environments. Measure development supported by the U.S. Department of
Education, Institute of Education Sciences (IES) grant award # R305A120781.
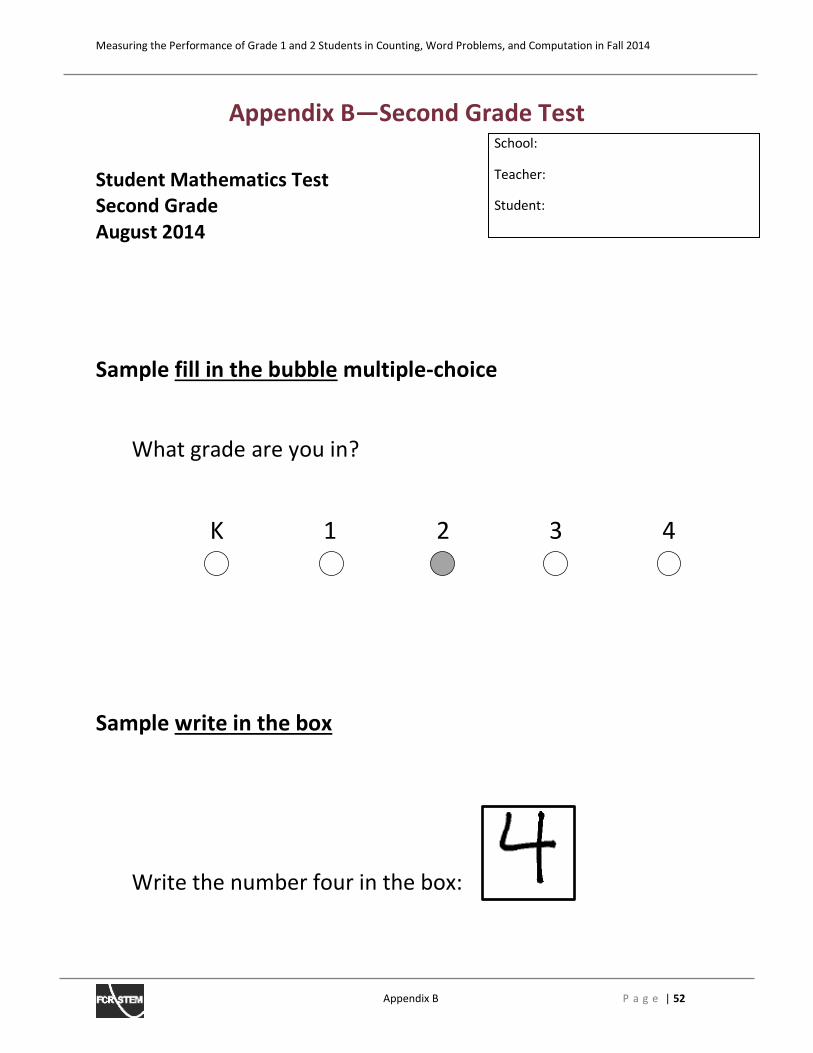
Measuring the Performance of Grade 1 and 2 Students in Counting, Word Problems, and Computation in Fall 2014
Appendix B P a g e | 52
Appendix BͶSecond Grade Test
Student Mathematics Test
Second Grade
August 2014
Sample fill in the bubble multiple-choice
What grade are you in?
K 1 2 3 4
Sample write in the box
Write the number four in the box:
School:
Teacher:
Student:
Measuring the Performance of Grade 1 and 2 Students in Counting, Word Problems, and Computation in Fall 2014
Appendix B P a g e | 53
Measuring the Performance of Grade 1 and 2 Students in Counting, Word Problems, and Computation in Fall 2014
Appendix B P a g e | 54
Measuring the Performance of Grade 1 and 2 Students in Counting, Word Problems, and Computation in Fall 2014
Appendix B P a g e | 55
Measuring the Performance of Grade 1 and 2 Students in Counting, Word Problems, and Computation in Fall 2014
Appendix B P a g e | 56
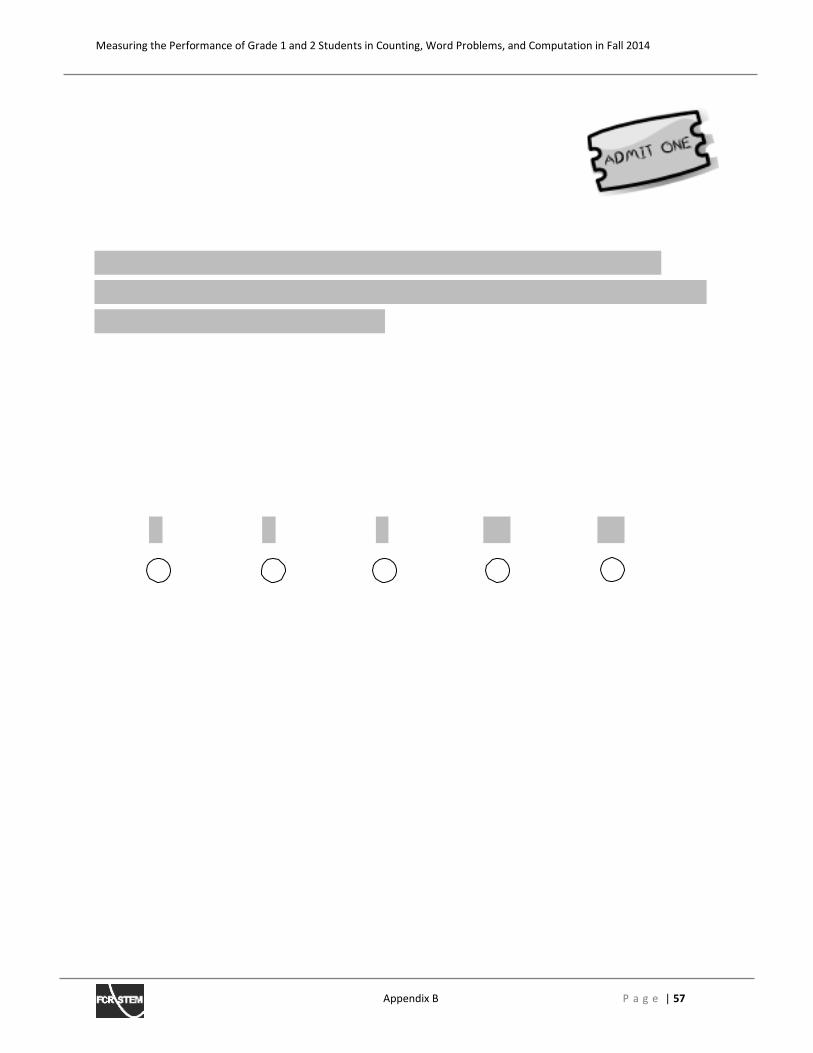
Measuring the Performance of Grade 1 and 2 Students in Counting, Word Problems, and Computation in Fall 2014
Appendix B P a g e | 57
Measuring the Performance of Grade 1 and 2 Students in Counting, Word Problems, and Computation in Fall 2014
Appendix B P a g e | 58
Measuring the Performance of Grade 1 and 2 Students in Counting, Word Problems, and Computation in Fall 2014
Appendix B P a g e | 59
Measuring the Performance of Grade 1 and 2 Students in Counting, Word Problems, and Computation in Fall 2014
Appendix B P a g e | 60
Measuring the Performance of Grade 1 and 2 Students in Counting, Word Problems, and Computation in Fall 2014
Appendix B P a g e | 61
Measuring the Performance of Grade 1 and 2 Students in Counting, Word Problems, and Computation in Fall 2014
Appendix B P a g e | 62
Measuring the Performance of Grade 1 and 2 Students in Counting, Word Problems, and Computation in Fall 2014
Appendix B P a g e | 63
Measuring the Performance of Grade 1 and 2 Students in Counting, Word Problems, and Computation in Fall 2014
Appendix B P a g e | 64
Measuring the Performance of Grade 1 and 2 Students in Counting, Word Problems, and Computation in Fall 2014
Appendix B P a g e | 65
Measuring the Performance of Grade 1 and 2 Students in Counting, Word Problems, and Computation in Fall 2014
Appendix C P a g e | 66
Appendix CͶFirst Grade Administration Guide
Primary Grades Math Study:
Pretest Guidelines, Administration Instructions, and
Student Information Sheet
First Grade
2014–2015
Measure copyright 2014, Replicating the CGI Experiment in Diverse Environments, Florida State
University. Not for reproduction or use without written consent of Replicating the CGI Experiment
in Diverse Environments. Measure development supported by the U.S. Department of Education,
Institute of Education Sciences (IES) grant award # R305A120781.
Measuring the Performance of Grade 1 and 2 Students in Counting, Word Problems, and Computation in Fall 2014
Appendix C P a g e | 67
Table of Contents
Pretest Guidelines ............................................................................................................................2
Overview ......................................................................................................................................2
Pretest Testing Window............................................................................................................2
Materials .......................................................................................................................................2
Test Booklets ............................................................................................................................2
Students to be Tested....................................................................................................................2
Preparing for Testing ....................................................................................................................3
The first page of each test booklet has the following box for student information: ....................3
Manipulatives ...........................................................................................................................3
Administering the Test .................................................................................................................3
Accommodations ..........................................................................................................................4
Testing in the Primary Grades ......................................................................................................4
Testing Time Allocation...............................................................................................................4
Submitting the Pre-test Materials .................................................................................................4
Pretest Administration Instructions – Grade 1 .................................................................................5
Pretest Student Information Sheet .................................................................................................12
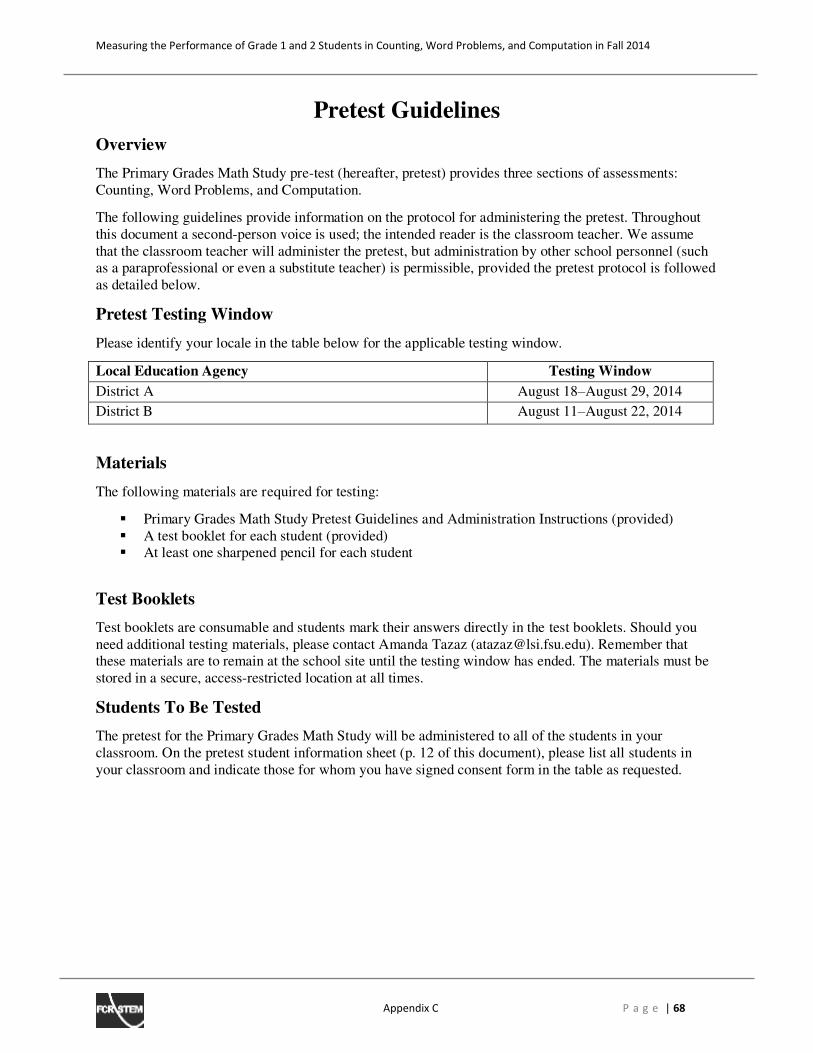
Measuring the Performance of Grade 1 and 2 Students in Counting, Word Problems, and Computation in Fall 2014
Appendix C P a g e | 68
Pretest Guidelines
Overview
The Primary Grades Math Study pre-test (hereafter, pretest) provides three sections of assessments:
Counting, Word Problems, and Computation.
The following guidelines provide information on the protocol for administering the pretest. Throughout
this document a second-person voice is used; the intended reader is the classroom teacher. We assume
that the classroom teacher will administer the pretest, but administration by other school personnel (such
as a paraprofessional or even a substitute teacher) is permissible, provided the pretest protocol is followed
as detailed below.
Pretest Testing Window
Please identify your locale in the table below for the applicable testing window.
Local Education Agency Testing Window
District A August 18–August 29, 2014
District B August 11–August 22, 2014
Materials
The following materials are required for testing:
▪ Primary Grades Math Study Pretest Guidelines and Administration Instructions (provided)
▪ A test booklet for each student (provided)
▪ At least one sharpened pencil for each student
Test Booklets
Test booklets are consumable and students mark their answers directly in the test booklets. Should you
need additional testing materials, please contact Amanda Tazaz ([email protected]). Remember that
these materials are to remain at the school site until the testing window has ended. The materials must be
stored in a secure, access-restricted location at all times.
Students To Be Tested
The pretest for the Primary Grades Math Study will be administered to all of the students in your
classroom. On the pretest student information sheet (p. 12 of this document), please list all students in
your classroom and indicate those for whom you have signed consent form in the table as requested.
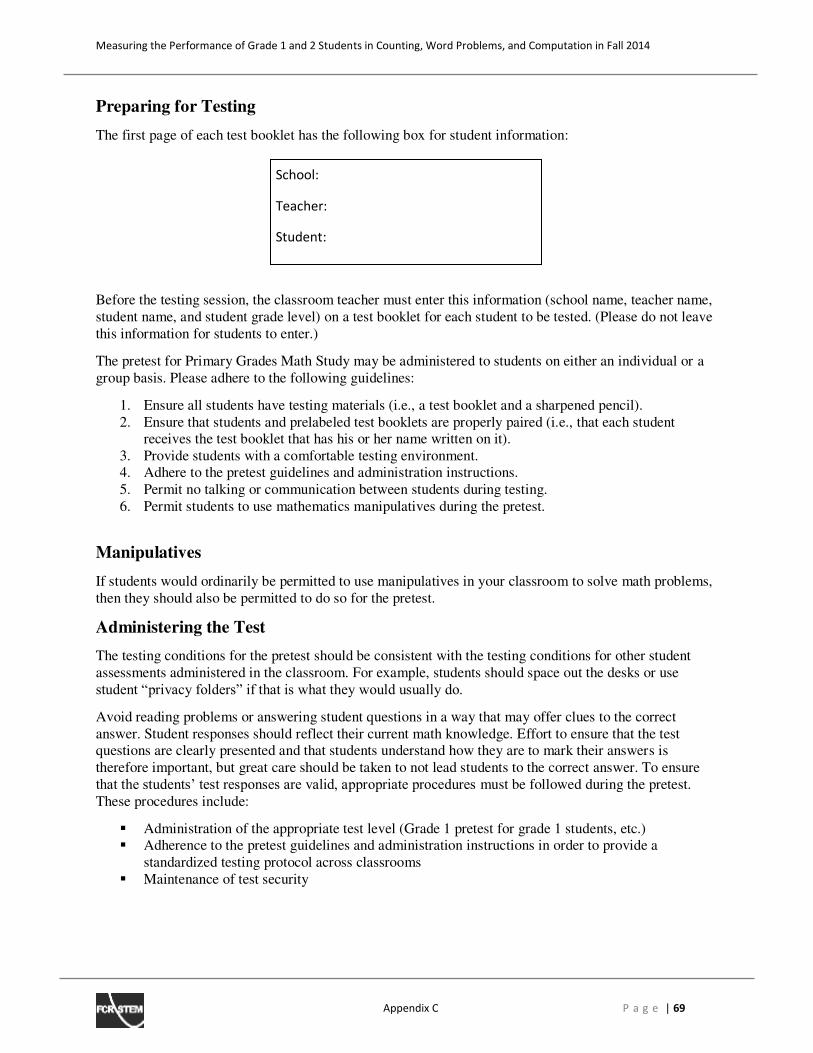
Measuring the Performance of Grade 1 and 2 Students in Counting, Word Problems, and Computation in Fall 2014
Appendix C P a g e | 69
Preparing for Testing
The first page of each test booklet has the following box for student information:
Before the testing session, the classroom teacher must enter this information (school name, teacher name,
student name, and student grade level) on a test booklet for each student to be tested. (Please do not leave
this information for students to enter.)
The pretest for Primary Grades Math Study may be administered to students on either an individual or a
group basis. Please adhere to the following guidelines:
1. Ensure all students have testing materials (i.e., a test booklet and a sharpened pencil).
2. Ensure that students and prelabeled test booklets are properly paired (i.e., that each student
receives the test booklet that has his or her name written on it).
3. Provide students with a comfortable testing environment.
4. Adhere to the pretest guidelines and administration instructions.
5. Permit no talking or communication between students during testing.
6. Permit students to use mathematics manipulatives during the pretest.
Manipulatives
If students would ordinarily be permitted to use manipulatives in your classroom to solve math problems,
then they should also be permitted to do so for the pretest.
Administering the Test
The testing conditions for the pretest should be consistent with the testing conditions for other student
assessments administered in the classroom. For example, students should space out the desks or use
student “privacy folders” if that is what they would usually do.
Avoid reading problems or answering student questions in a way that may offer clues to the correct
answer. Student responses should reflect their current math knowledge. Effort to ensure that the test
questions are clearly presented and that students understand how they are to mark their answers is
therefore important, but great care should be taken to not lead students to the correct answer. To ensure
that the students’ test responses are valid, appropriate procedures must be followed during the pretest.
These procedures include:
▪ Administration of the appropriate test level (Grade 1 pretest for grade 1 students, etc.)
▪ Adherence to the pretest guidelines and administration instructions in order to provide a
standardized testing protocol across classrooms
▪ Maintenance of test security
School:
Teacher:
Student:
Measuring the Performance of Grade 1 and 2 Students in Counting, Word Problems, and Computation in Fall 2014
Appendix C P a g e | 70
Accommodations
Students with special academic plans (e.g., IEP, 504, ELL) may receive whatever accommodations are
specified in their plans, at the teacher’s discretion.
Testing in the Primary Grades
Because children at this age level vary in their familiarity with whole-group testing procedures, the
following recommendations are provided to facilitate a smooth testing procedure and minimize student
frustration:
▪ Ensure students understand the testing instructions.
▪ Monitor students to ensure they are completing the correct questions.
▪ Provide students with sufficient time to answer the questions.
Testing Time Allocation
Administration of the pretest should take approximately 45 minutes. This is not a timed test, and students
should be allowed adequate time to answer the test questions.
Submitting the Pretest Materials
Upon conclusion of testing, repack the test booklets in the original packaging. Please be sure to include
the pretest guidelines, administration instructions, and completed student information sheet in the
package. All unused test booklets should be repacked for return to project personnel. A Primary Grades
Math Study representative will coordinate with your school to set a date to retrieve the testing materials
from you. The target period of pickup will be the week of September 2.
If you have questions about this process, contact [email protected].
Measuring the Performance of Grade 1 and 2 Students in Counting, Word Problems, and Computation in Fall 2014
Appendix C P a g e | 71
Pretest Administration Instructions—Grade 1
[The boxes contain the script that you will read to the student.]
Your class is about to take a short math assessment. You will need a pencil.
Verify that every student has a pencil.
I will now pass out the assessments. The assessments are already labeled with your
names. When you receive the assessment, keep it face up, and do not turn any
pages; we will all begin at the same time after I go over the instructions.
Ensure that students and prelabeled test booklets are properly paired (i.e., that each
student receives the test booklet that has his or her name written on it).
The first page of the assessment gives the instructions and provides samples of
how you will mark your answers.
For some problems you will fill in the bubble beneath (below) the answer choice
you think is correct. These are multiple-choice problems where you need to choose
one answer from the list of possible answers.
Look at the first example.
It asks: ‘What grade are you in?’ The correct answer choice is 1. Notice how the bubble beneath (below) the 1 has been shaded in for you. For some problems, you
are going to mark your answer choices the same way, by shading in the bubble
beneath (below) the answer choice you think is correct.
For some problems, you will write the answer that you think is correct in a box.
Look at the second example. It says: "Write the number four in the box." The
correct answer is written for you in the box. For some problems, you are going to
write your answer the same way, by writing the answer you think is correct in a
box.
If you are not sure which answer is correct, mark the answer that you think is best.
Make sure you mark an answer for every question.
Measuring the Performance of Grade 1 and 2 Students in Counting, Word Problems, and Computation in Fall 2014
Appendix C P a g e | 72
I will read all of the problems to you. Please do not say any answers out loud. You
will answer all of the questions by writing on your paper.
You may underline words in the problems if you find that helpful. Also, feel free to
use the white space on the paper to work out your answers.
Are there any questions?
Address any questions.
If there are no more questions, turn to the page with the stars.
Pause; check to ensure all students are on the correct page.
I am going to read the problem one more time:
When you finish, put your pencil down.
Pause and wait for all students to complete the item.
Turn to the page with the dog at the top.
Pause; check to ensure all students are on the correct page.
I am going to read the problem one more time:
When you finish, put your pencil down.
Pause and wait for all students to complete the item.
Turn to the page with the frog at the top.
Pause; check to ensure all students are on the correct page.
Measuring the Performance of Grade 1 and 2 Students in Counting, Word Problems, and Computation in Fall 2014
Appendix C P a g e | 73
I am going to read the problem one more time.
When you finish, put your pencil down.
Pause and wait for all students to complete the item.
Turn to the page with the bicycle at the top.
Pause; check to ensure all students are on the correct page.
I am going to read the problem one more time:
When you are finished, put your pencil down.
Turn to the page with the balloons at the top.
Pause; check to ensure all students are on the correct page.
Shade in the circle below the answer you think is correct.
I am going to read the problem one more time:
Shade in the circle below the answer you think is correct.
When you are finished, put your pencil down.
Pause and wait for all students to complete the item.
Measuring the Performance of Grade 1 and 2 Students in Counting, Word Problems, and Computation in Fall 2014
Appendix C P a g e | 74
Turn to the page with the book at the top.
Pause; check to ensure all students are on the correct page.
Shade in the circle below the answer you think is correct.
I am going to read the problem one more time:
Shade in the circle below the answer you think is correct.
When you are finished, put your pencil down.
Pause and wait for all students to complete the item.
Turn to the page with the car at the top.
Pause; check to ensure all students are on the correct page.
Shade in the circle below the answer you think is correct.
I am going to read the problem one more time:
Shade in the circle below the answer you think is correct.
When you are finished, put your pencil down.
Pause and wait for all students to complete the item.
Turn to the page with the movie ticket at the top.
Measuring the Performance of Grade 1 and 2 Students in Counting, Word Problems, and Computation in Fall 2014
Appendix C P a g e | 75
Pause; check to ensure all students are on the correct page.
Shade in the circle below the answer you think is correct.
I am going to read the problem one more time:
Shade in the circle below the answer you think is correct.
When you are finished, put your pencil down.
Pause and wait for all students to complete the item.
Turn to the page with the soccer ball at the top.
Pause; check to ensure all students are on the correct page.
Shade in the circle below the answer you think is correct.
I am going to read the problem one more time:
Shade in the circle below the answer you think is correct.
When you are finished, put your pencil down.
Pause and wait for all students to complete the item.
Turn to the page with the smiley face at the top.
Pause; check to ensure all students are on the correct page.
Measuring the Performance of Grade 1 and 2 Students in Counting, Word Problems, and Computation in Fall 2014
Appendix C P a g e | 76
Shade in the circle below the answer you think is correct.
I am going to read the problem one more time:
Shade in the circle below the answer you think is correct.
When you are finished, put your pencil down.
Pause and wait for all students to complete the item.
Turn to the page with the fish at the top.
Pause; check to ensure all students are on the correct page.
Please complete the following problems on this page and the next page. Please
write the correct answer in the box. When I say “begin’” you can start answering the questions. Any questions?
Address any questions.
BEGIN.
Circulate as students work on the problems.
Provide students with ample time to complete the problems. Once you see that
students have completed the problems, please end the assessment.
END.
Collect all testing materials.
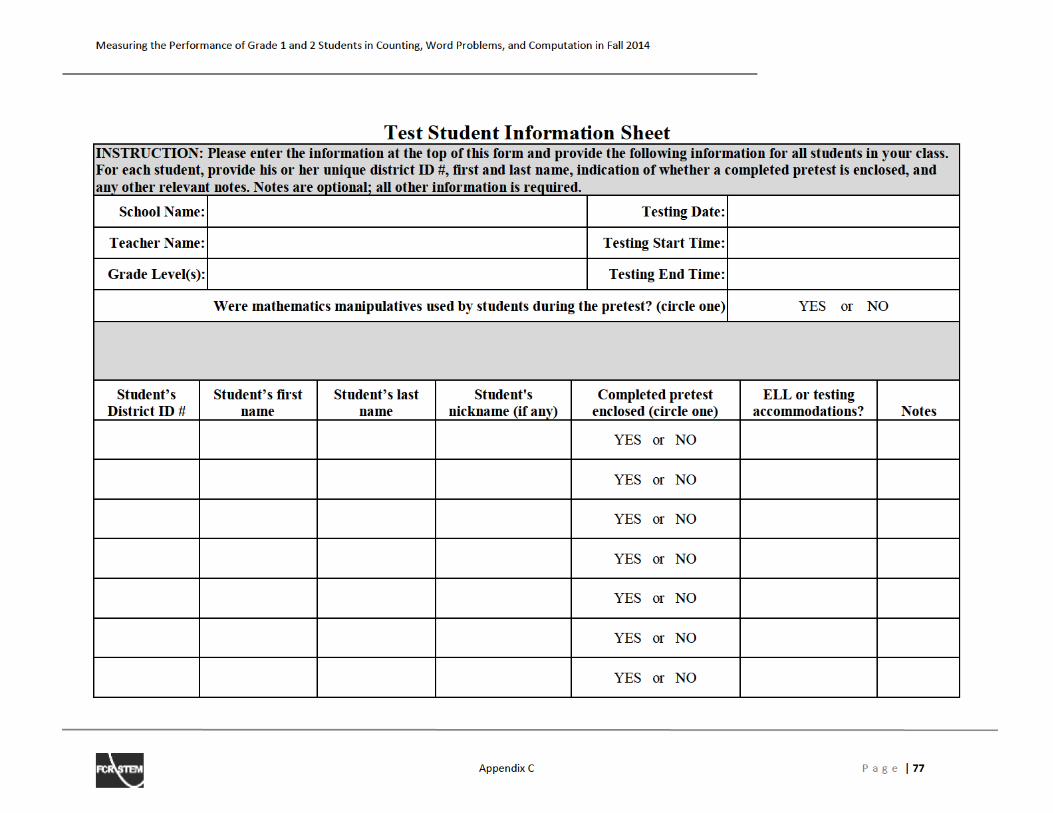
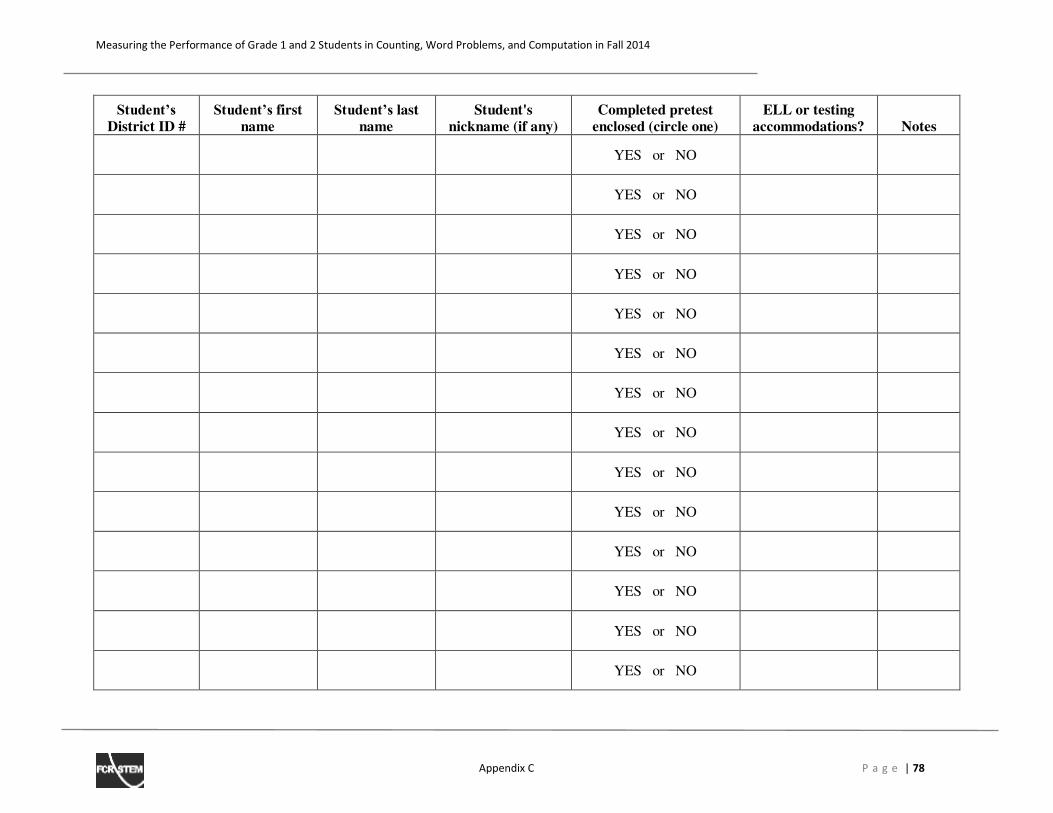
Measuring the Performance of Grade 1 and 2 Students in Counting, Word Problems, and Computation in Fall 2014
Appendix C P a g e | 78
Student’s District ID #
Student’s first
name
Student’s last
name
Student's
nickname (if any)
Completed pretest
enclosed (circle one)
ELL or testing
accommodations? Notes
YES or NO
YES or NO
YES or NO
YES or NO
YES or NO
YES or NO
YES or NO
YES or NO
YES or NO
YES or NO
YES or NO
YES or NO
YES or NO
YES or NO
Measuring the Performance of Grade 1 and 2 Students in Counting, Word Problems, and Computation in Fall 2014
Appendix D P a g e | 79
Appendix DͶSecond Grade Administration Guide
Primary Grades Math Study:
Pretest Guidelines, Administration Instructions, and
Student Information Sheet
Second Grade
2014–2015
Measure copyright 2014, Replicating the CGI Experiment in Diverse Environments, Florida State
University. Not for reproduction or use without written consent of Replicating the CGI Experiment
in Diverse Environments. Measure development supported by the U.S. Department of Education,
Institute of Education Sciences (IES) grant award # R305A120781.
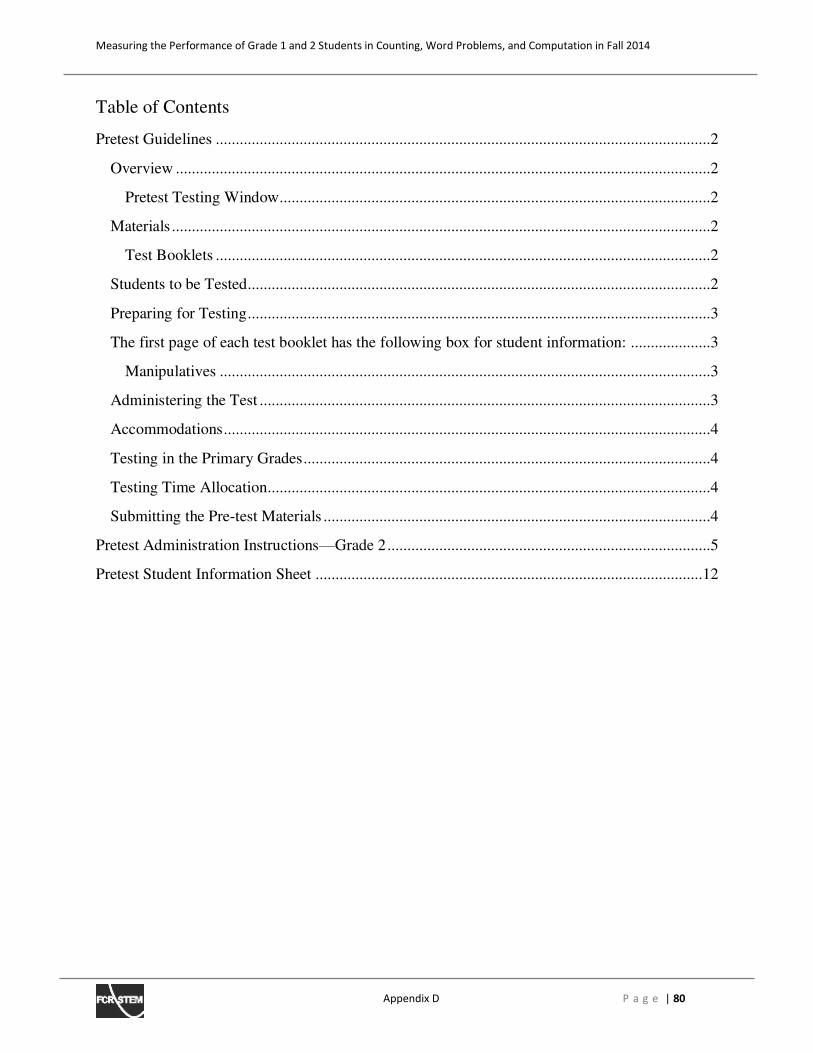
Measuring the Performance of Grade 1 and 2 Students in Counting, Word Problems, and Computation in Fall 2014
Appendix D P a g e | 80
Table of Contents
Pretest Guidelines ............................................................................................................................2
Overview ......................................................................................................................................2
Pretest Testing Window............................................................................................................2
Materials .......................................................................................................................................2
Test Booklets ............................................................................................................................2
Students to be Tested....................................................................................................................2
Preparing for Testing ....................................................................................................................3
The first page of each test booklet has the following box for student information: ....................3
Manipulatives ...........................................................................................................................3
Administering the Test .................................................................................................................3
Accommodations ..........................................................................................................................4
Testing in the Primary Grades ......................................................................................................4
Testing Time Allocation...............................................................................................................4
Submitting the Pre-test Materials .................................................................................................4
Pretest Administration Instructions—Grade 2 .................................................................................5
Pretest Student Information Sheet .................................................................................................12
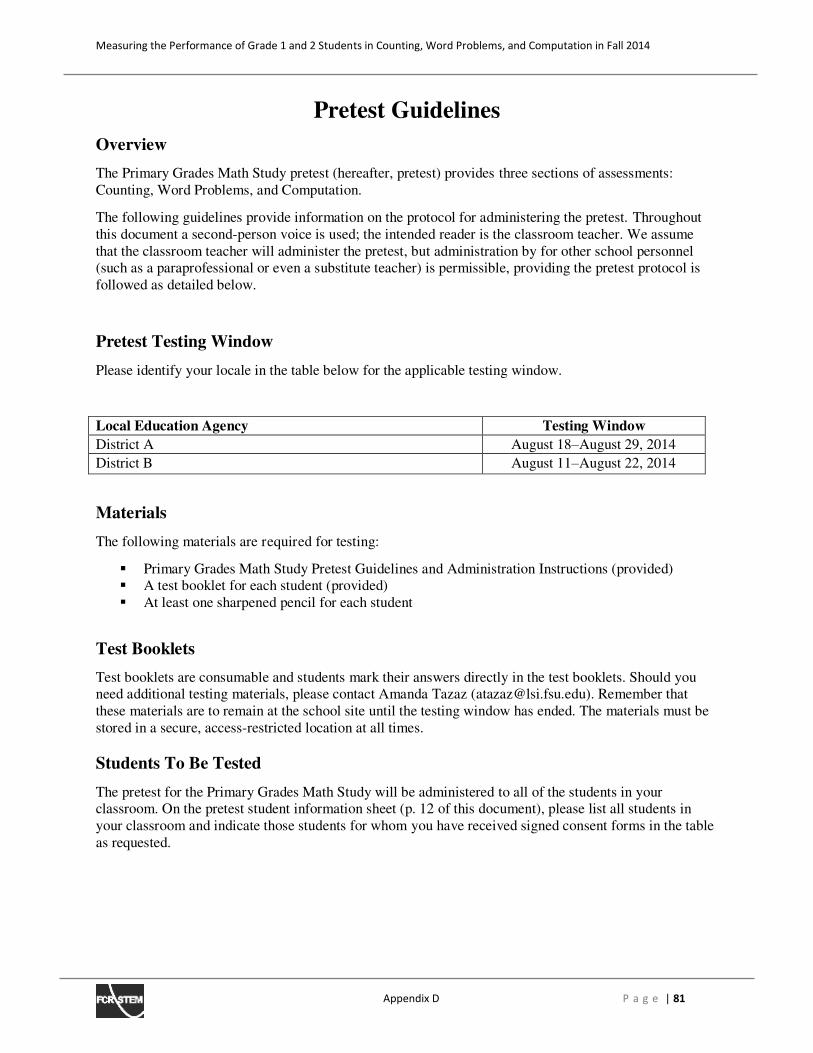
Measuring the Performance of Grade 1 and 2 Students in Counting, Word Problems, and Computation in Fall 2014
Appendix D P a g e | 81
Pretest Guidelines
Overview
The Primary Grades Math Study pretest (hereafter, pretest) provides three sections of assessments:
Counting, Word Problems, and Computation.
The following guidelines provide information on the protocol for administering the pretest. Throughout
this document a second-person voice is used; the intended reader is the classroom teacher. We assume
that the classroom teacher will administer the pretest, but administration by for other school personnel
(such as a paraprofessional or even a substitute teacher) is permissible, providing the pretest protocol is
followed as detailed below.
Pretest Testing Window
Please identify your locale in the table below for the applicable testing window.
Local Education Agency Testing Window
District A August 18–August 29, 2014
District B August 11–August 22, 2014
Materials
The following materials are required for testing:
▪ Primary Grades Math Study Pretest Guidelines and Administration Instructions (provided)
▪ A test booklet for each student (provided)
▪ At least one sharpened pencil for each student
Test Booklets
Test booklets are consumable and students mark their answers directly in the test booklets. Should you
need additional testing materials, please contact Amanda Tazaz ([email protected]). Remember that
these materials are to remain at the school site until the testing window has ended. The materials must be
stored in a secure, access-restricted location at all times.
Students To Be Tested
The pretest for the Primary Grades Math Study will be administered to all of the students in your
classroom. On the pretest student information sheet (p. 12 of this document), please list all students in
your classroom and indicate those students for whom you have received signed consent forms in the table
as requested.
Measuring the Performance of Grade 1 and 2 Students in Counting, Word Problems, and Computation in Fall 2014
Appendix D P a g e | 82
Preparing for Testing
The first page of each test booklet has the following box for student information:
Before the testing session, the classroom teacher must enter this information (school name, teacher name,
student name, and student grade level) on a test booklet for each student to be tested. (Please do not leave
this information for students to enter.)
The pretest for Primary Grades Math Study may be administered to students on either an individual or a
group basis. Please adhere to the following guidelines:
1. Ensure all students have testing materials (i.e., test booklet and a sharpened pencil).
2. Ensure that students and prelabeled test booklets are properly paired (i.e., that each student
receives the test booklet that has his or her name written on it).
3. Provide students with a comfortable testing environment.
4. Adhere to the pretest guidelines and administration instructions.
5. Permit no talking or communication between students during testing.
6. Permit students to use mathematics manipulatives during the pretest.
Manipulatives
If students would ordinarily be permitted to use manipulatives in your classroom to solve math problems,
then they should also be permitted to do so for the pretest.
Administering the Test
The testing conditions for the pretest should be consistent with the testing conditions for other student
assessments administered in the classroom. For example, students should space out the desks or use
student “privacy folders” if that is what they would usually do.
Avoid reading problems or answering student questions in a way that may offer clues to the correct
answer. Student responses should reflect their current math knowledge. Effort to ensure that the test
questions are clearly presented and that students understand how they are to mark their answers is
important, but great care should be taken to not lead students to the correct answer. To ensure that the
students’ test responses are valid, appropriate procedures must be followed during the pretest. These
procedures include:
▪ Administration of the appropriate test level (Grade 2 pre-test for Grade 2 students, etc.)
▪ Adherence to the pretest guidelines and administration instructions in order to provide a
standardized testing protocol across classrooms
▪ Maintenance of test security
School:
Teacher:
Student:
Measuring the Performance of Grade 1 and 2 Students in Counting, Word Problems, and Computation in Fall 2014
Appendix D P a g e | 83
Accommodations
Students with special academic plans (e.g., IEP, 504, ELL) may receive whatever accommodations are
specified in their plans, at the teacher’s discretion.
Testing in the Primary Grades
Because children at this age level vary in their familiarity with whole-group testing procedures, the
following recommendations are provided to facilitate a smooth testing procedure and minimize student
frustration:
▪ Ensure students understand the testing instructions.
▪ Monitor students to ensure they are completing the correct questions.
▪ Provide students with sufficient time to answer the questions.
Testing Time Allocation
Administration of the pretest should take approximately 45 minutes. This is not a timed test, and students
should be allowed adequate time to answer the test questions.
Submitting the Pretest Materials
Upon conclusion of testing, repack the test booklets in the original packaging. Please be sure to include
the pretest guidelines, administration instructions, and completed student information sheet in the
package. All unused test booklets should be repacked for return to project personnel. A Primary Grades
Math Study representative will coordinate with your school to set a date to retrieve the testing materials
from you. The target period of pickup will be the week of September 2.
If you have questions about this process, contact Amanda Tazaz via email ([email protected]).
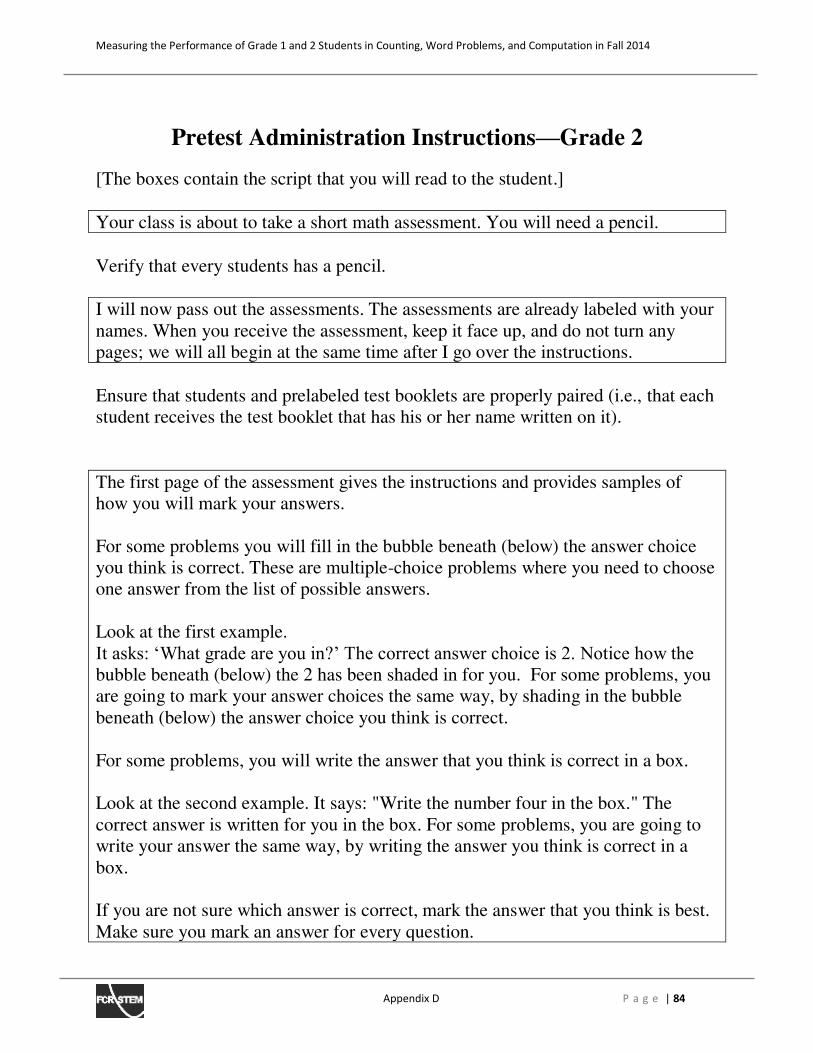
Measuring the Performance of Grade 1 and 2 Students in Counting, Word Problems, and Computation in Fall 2014
Appendix D P a g e | 84
Pretest Administration Instructions—Grade 2
[The boxes contain the script that you will read to the student.]
Your class is about to take a short math assessment. You will need a pencil.
Verify that every students has a pencil.
I will now pass out the assessments. The assessments are already labeled with your
names. When you receive the assessment, keep it face up, and do not turn any
pages; we will all begin at the same time after I go over the instructions.
Ensure that students and prelabeled test booklets are properly paired (i.e., that each
student receives the test booklet that has his or her name written on it).
The first page of the assessment gives the instructions and provides samples of
how you will mark your answers.
For some problems you will fill in the bubble beneath (below) the answer choice
you think is correct. These are multiple-choice problems where you need to choose
one answer from the list of possible answers.
Look at the first example.
It asks: ‘What grade are you in?’ The correct answer choice is 2. Notice how the bubble beneath (below) the 2 has been shaded in for you. For some problems, you
are going to mark your answer choices the same way, by shading in the bubble
beneath (below) the answer choice you think is correct.
For some problems, you will write the answer that you think is correct in a box.
Look at the second example. It says: "Write the number four in the box." The
correct answer is written for you in the box. For some problems, you are going to
write your answer the same way, by writing the answer you think is correct in a
box.
If you are not sure which answer is correct, mark the answer that you think is best.
Make sure you mark an answer for every question.
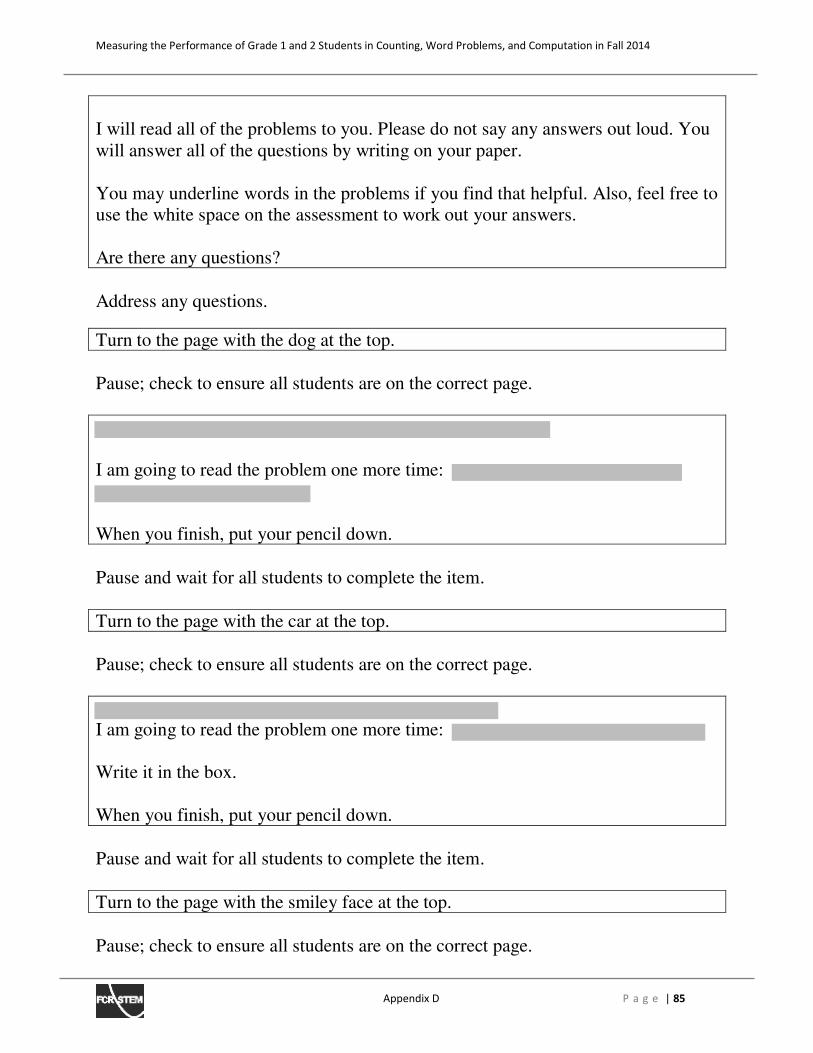
Measuring the Performance of Grade 1 and 2 Students in Counting, Word Problems, and Computation in Fall 2014
Appendix D P a g e | 85
I will read all of the problems to you. Please do not say any answers out loud. You
will answer all of the questions by writing on your paper.
You may underline words in the problems if you find that helpful. Also, feel free to
use the white space on the assessment to work out your answers.
Are there any questions?
Address any questions.
Turn to the page with the dog at the top.
Pause; check to ensure all students are on the correct page.
I am going to read the problem one more time:
When you finish, put your pencil down.
Pause and wait for all students to complete the item.
Turn to the page with the car at the top.
Pause; check to ensure all students are on the correct page.
I am going to read the problem one more time:
Write it in the box.
When you finish, put your pencil down.
Pause and wait for all students to complete the item.
Turn to the page with the smiley face at the top.
Pause; check to ensure all students are on the correct page.
Measuring the Performance of Grade 1 and 2 Students in Counting, Word Problems, and Computation in Fall 2014
Appendix D P a g e | 86
I am going to read the problem one more time:
Write it in the box.
When you finish, put your pencil down.
Pause and wait for all students to complete the item.
Turn to the page with the balloons at the top.
Pause; check to ensure all students are on the correct page.
I am going to read the problem one more time.
Write it in the box.
When you finish, put your pencil down.
Pause and wait for all students to complete the item.
Turn to the page with the movie ticket at the top.
Pause; check to ensure all students are on the correct page.
Shade in the circle below the answer you think is correct.
I am going to read the problem one more time:
When you are finished, put your pencil down.
Pause and wait for all students to complete the item.
Measuring the Performance of Grade 1 and 2 Students in Counting, Word Problems, and Computation in Fall 2014
Appendix D P a g e | 87
Turn to the page with the soccer ball at the top.
Pause; check to ensure all students are on the correct page.
Shade in the circle below the answer you think is correct.
I am going to read the problem one more time:
Shade in the circle below the answer you think is correct.
When you are finished, put your pencil down.
Pause and wait for all students to complete the item.
Turn to the page with the zebra at the top.
Pause; check to ensure all students are on the correct page.
Shade in the circle below the answer you think is correct.
I am going to read the problem one more time:
Shade in the circle below the answer you think is correct.
When you are finished, put your pencil down at the top.
Pause and wait for all students to complete the item.
Turn to the page with the pencil at the top.
Pause; check to ensure all students are on the correct page.
Measuring the Performance of Grade 1 and 2 Students in Counting, Word Problems, and Computation in Fall 2014
Appendix D P a g e | 88
Shade in the circle below the answer you think is correct.
Shade in the circle below the answer you think is correct.
When you are finished, put your pencil down.
Pause and wait for all students to complete the item.
Turn to the page with the book at the top.
Pause; check to ensure all students are on the correct page.
Shade in the circle below the answer you think is correct.
I am going to read the problem one more time:
When you are finished, put your pencil down.
Pause and wait for all students to complete the item.
Turn to the page with the frog at the top.
Pause; check to ensure all students are on the correct page.
Shade in the circle below the answer you think is correct.
Measuring the Performance of Grade 1 and 2 Students in Counting, Word Problems, and Computation in Fall 2014
Appendix D P a g e | 89
I am going to read the problem one more time:
When you are finished, put your pencil down.
Pause and wait for all students to complete the item.
Turn to the page with the fish at the top.
Pause; check to ensure all students are on the correct page.
Shade in the circle below the answer you think is correct.
I am going to read the problem one more time:
When you are finished, put your pencil down.
Pause and wait for all students to complete the item.
Turn to the page with the bicycle at the top.
Pause; check to ensure all students are on the correct page.
Please complete the following problems on this page and the next page. Please
write the correct answer in the box. When I say “begin,” you can start answering the questions. Any questions?
Address any questions.
BEGIN.
Circulate as students work on the problems.
Measuring the Performance of Grade 1 and 2 Students in Counting, Word Problems, and Computation in Fall 2014
Appendix D P a g e | 90
Provide students with ample time to complete the problems. Once you see that all
students have completed the problems please end the assessment.
END.
Collect all testing materials.
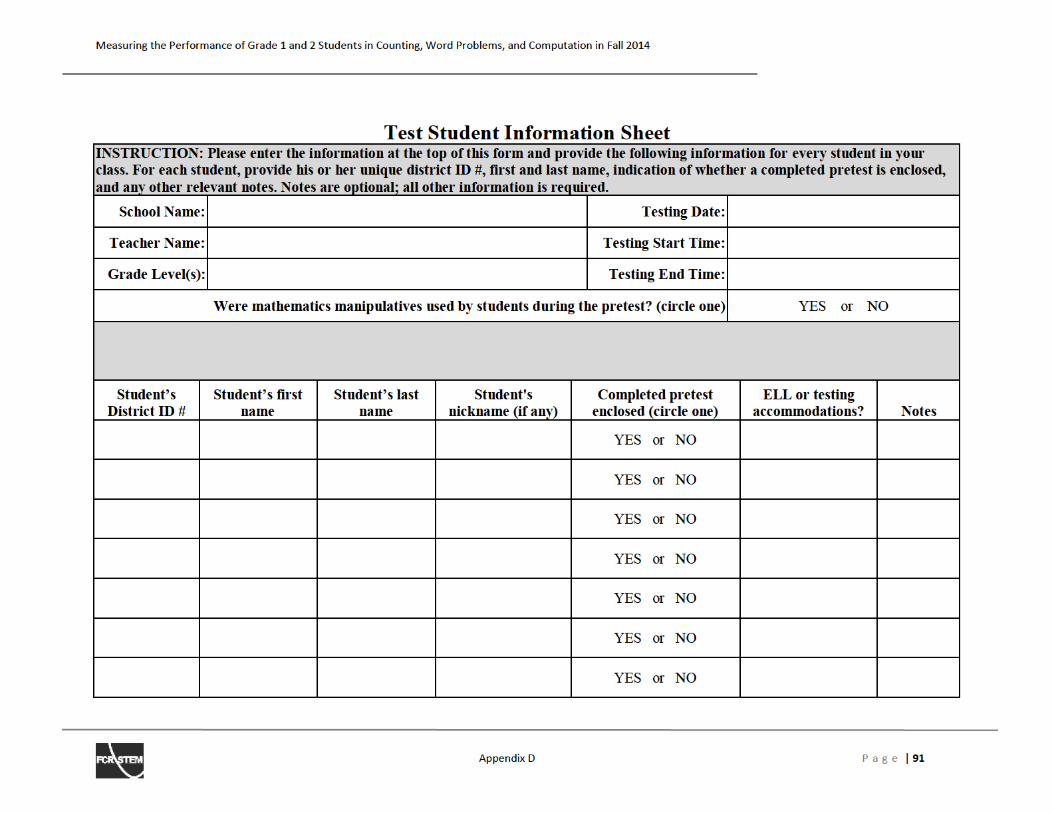
Measuring the Performance of Grade 1 and 2 Students in Counting, Word Problems, and Computation in Fall 2014
Appendix D P a g e | 92
Student’s District ID #
Student’s first
name
Student’s last
name
Student's
nickname (if any)
Completed pretest
enclosed (circle one)
ELL or testing
accommodations? Notes
YES or NO
YES or NO
YES or NO
YES or NO
YES or NO
YES or NO
YES or NO
YES or NO
YES or NO
YES or NO
YES or NO
YES or NO
YES or NO
YES or NO
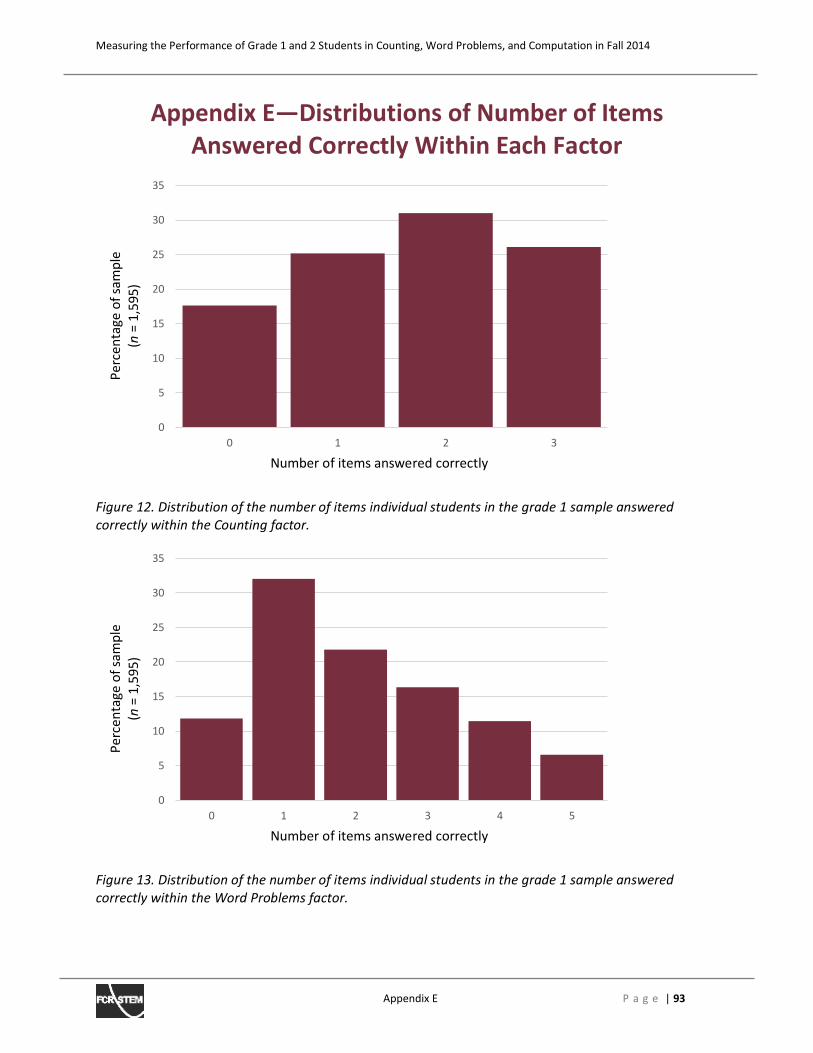
Measuring the Performance of Grade 1 and 2 Students in Counting, Word Problems, and Computation in Fall 2014
Appendix E P a g e | 93
Appendix EͶDistributions of Number of Items
Answered Correctly Within Each Factor
Figure 12. Distribution of the number of items individual students in the grade 1 sample answered
correctly within the Counting factor.
Figure 13. Distribution of the number of items individual students in the grade 1 sample answered
correctly within the Word Problems factor.
0
5
10
15
20
25
30
35
0 1 2 3
0
5
10
15
20
25
30
35
0 1 2 3 4 5
Pe
rce
nta
ge
of
sam
ple
(n =
1,5
95
)
Number of items answered correctly
Pe
rce
nta
ge
of
sam
ple
(n =
1,5
95
)
Number of items answered correctly
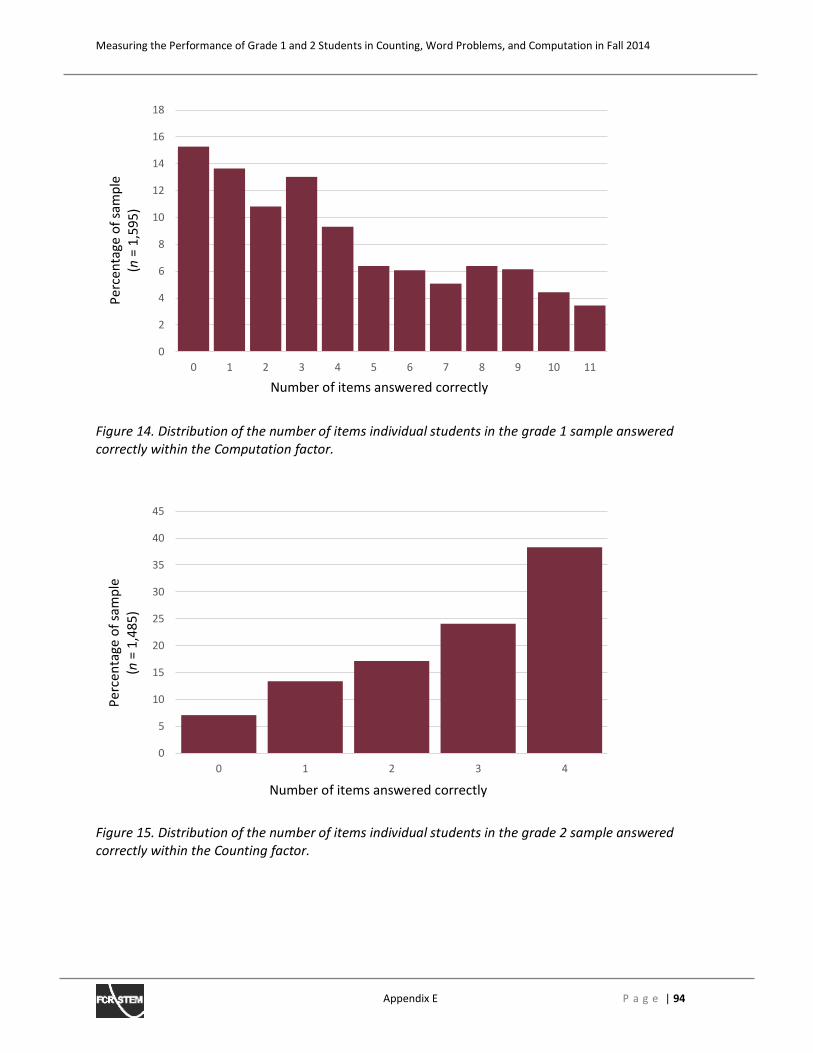
Measuring the Performance of Grade 1 and 2 Students in Counting, Word Problems, and Computation in Fall 2014
Appendix E P a g e | 94
Figure 14. Distribution of the number of items individual students in the grade 1 sample answered
correctly within the Computation factor.
Figure 15. Distribution of the number of items individual students in the grade 2 sample answered
correctly within the Counting factor.
0
2
4
6
8
10
12
14
16
18
0 1 2 3 4 5 6 7 8 9 10 11
0
5
10
15
20
25
30
35
40
45
0 1 2 3 4
Pe
rce
nta
ge
of
sam
ple
(n =
1,5
95
)
Number of items answered correctly
Pe
rce
nta
ge
of
sam
ple
(n =
1,4
85
)
Number of items answered correctly
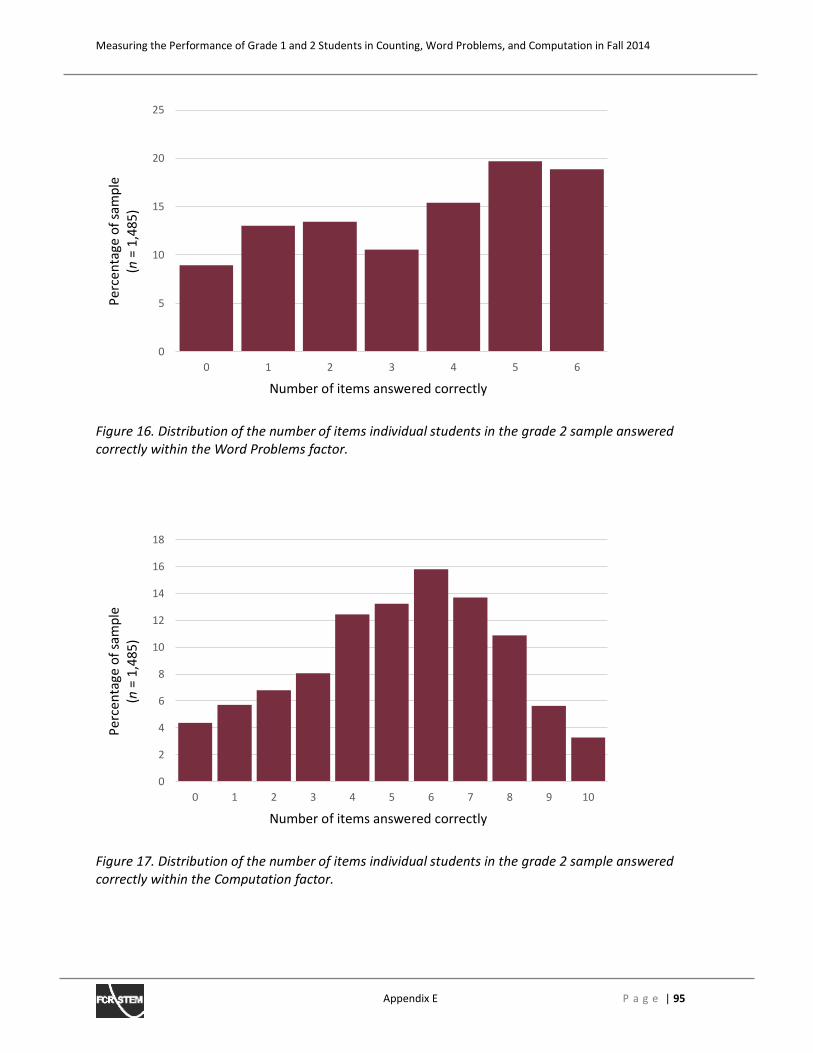
Measuring the Performance of Grade 1 and 2 Students in Counting, Word Problems, and Computation in Fall 2014
Appendix E P a g e | 95
Figure 16. Distribution of the number of items individual students in the grade 2 sample answered
correctly within the Word Problems factor.
Figure 17. Distribution of the number of items individual students in the grade 2 sample answered
correctly within the Computation factor.
0
5
10
15
20
25
0 1 2 3 4 5 6
0
2
4
6
8
10
12
14
16
18
0 1 2 3 4 5 6 7 8 9 10
Pe
rce
nta
ge
of
sam
ple
(n =
1,4
85
)
Number of items answered correctly
Pe
rce
nta
ge
of
sam
ple
(n =
1,4
85
)
Number of items answered correctly
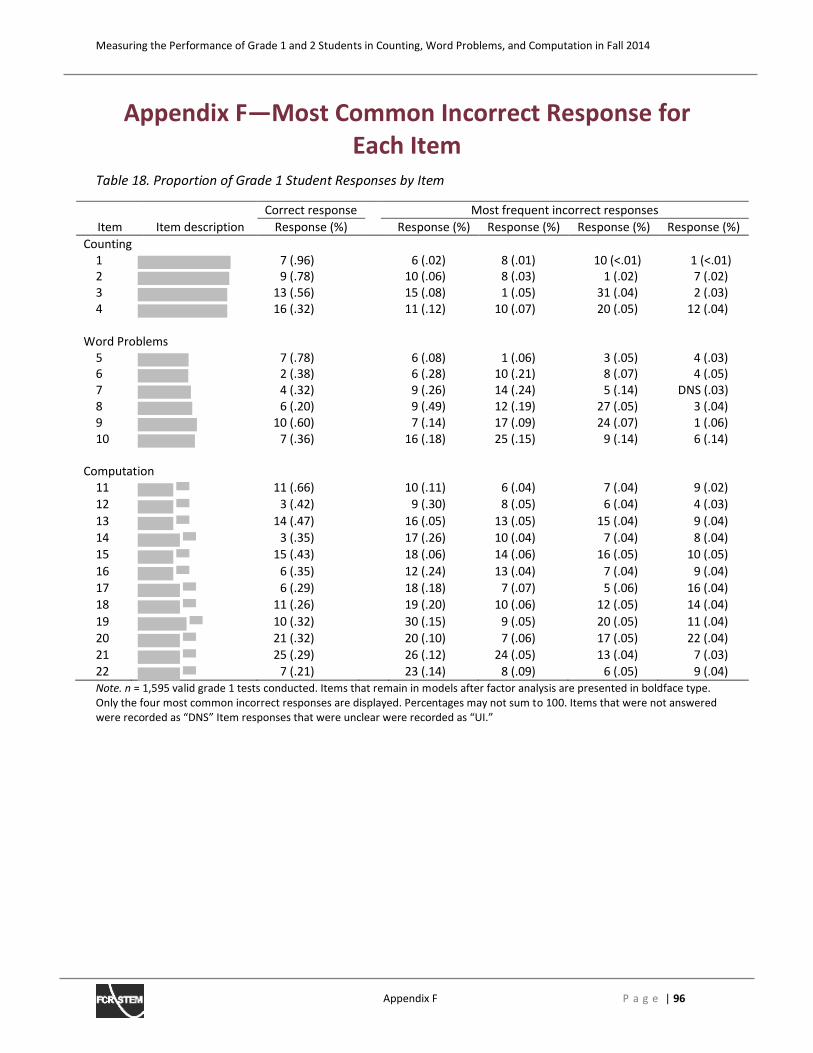
Measuring the Performance of Grade 1 and 2 Students in Counting, Word Problems, and Computation in Fall 2014
Appendix F P a g e | 96
Appendix FͶMost Common Incorrect Response for
Each Item
Table 18. Proportion of Grade 1 Student Responses by Item
Correct response Most frequent incorrect responses
Item Item description Response (%) Response (%) Response (%) Response (%) Response (%)
Counting
1 7 (.96) 6 (.02) 8 (.01) 10 (<.01) 1 (<.01)
2 9 (.78) 10 (.06) 8 (.03) 1 (.02) 7 (.02)
3 13 (.56) 15 (.08) 1 (.05) 31 (.04) 2 (.03)
4 16 (.32) 11 (.12) 10 (.07) 20 (.05) 12 (.04)
Word Problems
5 7 (.78) 6 (.08) 1 (.06) 3 (.05) 4 (.03)
6 2 (.38) 6 (.28) 10 (.21) 8 (.07) 4 (.05)
7 4 (.32) 9 (.26) 14 (.24) 5 (.14) DNS (.03)
8 6 (.20) 9 (.49) 12 (.19) 27 (.05) 3 (.04)
9 10 (.60) 7 (.14) 17 (.09) 24 (.07) 1 (.06)
10 7 (.36) 16 (.18) 25 (.15) 9 (.14) 6 (.14)
Computation
11 11 (.66) 10 (.11) 6 (.04) 7 (.04) 9 (.02)
12 3 (.42) 9 (.30) 8 (.05) 6 (.04) 4 (.03)
13 14 (.47) 16 (.05) 13 (.05) 15 (.04) 9 (.04)
14 3 (.35) 17 (.26) 10 (.04) 7 (.04) 8 (.04)
15 15 (.43) 18 (.06) 14 (.06) 16 (.05) 10 (.05)
16 6 (.35) 12 (.24) 13 (.04) 7 (.04) 9 (.04)
17 6 (.29) 18 (.18) 7 (.07) 5 (.06) 16 (.04)
18 11 (.26) 19 (.20) 10 (.06) 12 (.05) 14 (.04)
19 10 (.32) 30 (.15) 9 (.05) 20 (.05) 11 (.04)
20 21 (.32) 20 (.10) 7 (.06) 17 (.05) 22 (.04)
21 25 (.29) 26 (.12) 24 (.05) 13 (.04) 7 (.03)
22 7 (.21) 23 (.14) 8 (.09) 6 (.05) 9 (.04)
Note. n = 1,595 valid grade 1 tests conducted. Items that remain in models after factor analysis are presented in boldface type.
Only the four most common incorrect responses are displayed. Percentages may not sum to 100. Items that were not answered
┘WヴW ヴWIラヴSWS ;ゲ さDN“ざ IデWマ ヴWゲヮラミゲWゲ デエ;デ ┘WヴW ┌ミIノW;ヴ ┘WヴW ヴWIラヴSWS ;ゲ さUIくざ
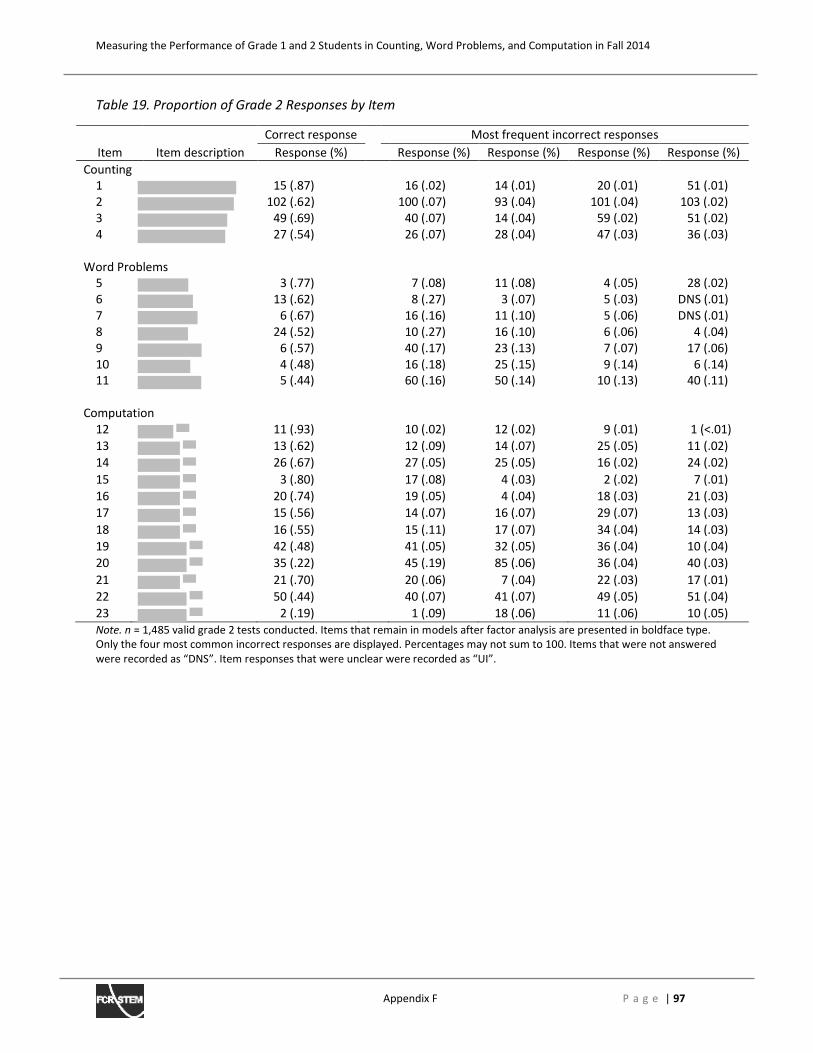
Measuring the Performance of Grade 1 and 2 Students in Counting, Word Problems, and Computation in Fall 2014
Appendix F P a g e | 97
Table 19. Proportion of Grade 2 Responses by Item
Correct response Most frequent incorrect responses
Item Item description Response (%) Response (%) Response (%) Response (%) Response (%)
Counting
1 15 (.87) 16 (.02) 14 (.01) 20 (.01) 51 (.01)
2 102 (.62) 100 (.07) 93 (.04) 101 (.04) 103 (.02)
3 49 (.69) 40 (.07) 14 (.04) 59 (.02) 51 (.02)
4 27 (.54) 26 (.07) 28 (.04) 47 (.03) 36 (.03)
Word Problems
5 3 (.77) 7 (.08) 11 (.08) 4 (.05) 28 (.02)
6 13 (.62) 8 (.27) 3 (.07) 5 (.03) DNS (.01)
7 6 (.67) 16 (.16) 11 (.10) 5 (.06) DNS (.01)
8 24 (.52) 10 (.27) 16 (.10) 6 (.06) 4 (.04)
9 6 (.57) 40 (.17) 23 (.13) 7 (.07) 17 (.06)
10 4 (.48) 16 (.18) 25 (.15) 9 (.14) 6 (.14)
11 5 (.44) 60 (.16) 50 (.14) 10 (.13) 40 (.11)
Computation
12 11 (.93) 10 (.02) 12 (.02) 9 (.01) 1 (<.01)
13 13 (.62) 12 (.09) 14 (.07) 25 (.05) 11 (.02)
14 26 (.67) 27 (.05) 25 (.05) 16 (.02) 24 (.02)
15 3 (.80) 17 (.08) 4 (.03) 2 (.02) 7 (.01)
16 20 (.74) 19 (.05) 4 (.04) 18 (.03) 21 (.03)
17 15 (.56) 14 (.07) 16 (.07) 29 (.07) 13 (.03)
18 16 (.55) 15 (.11) 17 (.07) 34 (.04) 14 (.03)
19 42 (.48) 41 (.05) 32 (.05) 36 (.04) 10 (.04)
20 35 (.22) 45 (.19) 85 (.06) 36 (.04) 40 (.03)
21 21 (.70) 20 (.06) 7 (.04) 22 (.03) 17 (.01)
22 50 (.44) 40 (.07) 41 (.07) 49 (.05) 51 (.04)
23 2 (.19) 1 (.09) 18 (.06) 11 (.06) 10 (.05)
Note. n = 1,485 valid grade 2 tests conducted. Items that remain in models after factor analysis are presented in boldface type.
Only the four most common incorrect responses are displayed. Percentages may not sum to 100. Items that were not answered
were ヴWIラヴSWS ;ゲ さDN“ざく IデWマ ヴWゲヮラミゲWゲ デエ;デ ┘WヴW ┌ミIノW;ヴ ┘WヴW ヴWIラヴSWS ;ゲ さUIざく