suggested sections for plan vivo technical...
TRANSCRIPT
Mikoko Pamoja Technical Specification
1
Mikoko Pamoja
Management and protection of mangrove forest in Kenya
for community benefit through carbon credits
A technical specification prepared by the Mikoko Pamoja team, 3 August 2011 Corresponding author: Mark Huxham, [email protected]
Mikoko Pamoja Technical Specification
2
Table of Contents
1. Summary ..........................................................................................................................3 2. Scope/applicability ...........................................................................................................4
2.1 Background ........................................................................................................... 4 2.2 Description of project area and activity areas ...................................................... 4 2.3 Map of project area and activity areas ................................................................. 6
Figure 1. The project area.......................................................................................6 Figure 2. Activity areas 1 and 3 ..............................................................................7
3. Carbon pools ....................................................................................................................8 Table 1. Carbon pools considered in Mikoko Pamoja ............................................8
4. Carbon baseline (without-project scenario).....................................................................9 4.1 Initial carbon stocks in project activity areas ........................................................ 9
Table 2: Initial carbon stocks in project activity areas ............................................9 4.2 Methods to estimate initial C stocks ..................................................................... 9 4.3 Expected change in carbon stocks without project activities ............................. 11
Figure 3. Mean (± S.E.) CO2 fluxes in Rhizophora mucronata forest. ................13 Figure 4. Mean (± S.E.) CH4 fluxes in R. mucronata forest.................................13 Figure 5. Mean (± S.E.) cumulative elevation change in R. mucronata forest. ...14 Table 3. Summary of current and projected C stocks in three activity areas. .....14
5. Project activities .............................................................................................................14 Table 4. Project activities ......................................................................................14
6. Land management plan .................................................................................................16 6.1 The land management system ........................................................................... 16 6.2 Tree species........................................................................................................ 16 6.3 Site preparation, planting and care of trees ....................................................... 16 6.4 Implementation and operational plan and responsibilities ................................. 17
Table 5. Continuous project activities ...................................................................17 Table 6: Management and harvesting of Casuarina woodlot ...............................18
6.6 Managing risks .................................................................................................... 19 Table 7: Potential leakage problems and mitigation actions to be adopted. ......19 Table 8. Other risks ...............................................................................................19
7. Carbon benefits from project activities (with-project scenario) .....................................22 7.1 Expected change in aboveground carbon stocks with project activities............ 22 7.2 Expected change in belowground carbon stocks with project activities ............ 24 7.3 Crediting period................................................................................................... 24 7.4 Carbon risk buffer ............................................................................................... 24
8. Summaries of Key Variables and Saleable Carbon ......................................................26 Figure 6. Summary of carbon benefits with and without project. .........................26 Table 9. Summary of key variables and justifications given in sections 3-6 ........26 Table 10. Annual carbon benefits and annual income anticipated ......................28
9. Monitoring and PES .......................................................................................................29 Table 11. Monitoring indicators and PES payment levels....................................29
10. References...................................................................................................................30 Appendix 1 – BioClimate Risk Buffer Calculation Tool .....................................................32 Appendix 2 – calculations for Sonneratia plantation .........................................................36 Appendix 3. Below ground C losses..................................................................................38 Appendix 4. Excel formula applied to growth of individual trees in reference plots. ........39
Mikoko Pamoja Technical Specification Summary and Scope
3
1. Summary
A community-led project in Kenya will protect 107 ha of natural mangrove forest and 10 hectares of plantation as well as planting an additional 0.4 ha of forest annually,
over a project time-scale of 20 years.
Carbon benefits are conservatively estimated as 2500 tonnes CO2 yr-1, which is derived from a mix of avoided deforestation, prevented forest degradation and new planting.
Because mangroves provide a wide range of other ecosystem services, including
coastal protection, nursery habitat for fish and water purification, preserving and restoring these forests will have multiple additional benefits that are not accounted for here.
All projected profit from Mikoko Pamoja will be invested in local projects determined
through community consultation.
There are three activity areas considered in this technical specification:
Activity area 1: Rhizophora mucronata forest
107 ha of mangrove forest (divided into two sub-areas) will be protected.
Activity area 2. Rhizophora mucronata plantations
10 ha of existing plantation (consisting of two separate areas) will be protected.
Activity area 3. Sonneratia alba plantation on the open beach
0.4 ha of open beach will be planted annually. 8 ha will be planted in total.
Mikoko Pamoja Technical Specification Summary and Scope
4
2. Scope/applicability 2.1 Background
This technical specification is for the Mikoko Pamoja project. It applies to an area of mangrove forest (consisting mostly of Rhizophora mucronata) and to areas of former forest that are now bare and eroding beachlines.
Mangroves are amongst the most threatened of all ecosystems, with global rates of
destruction exceeding those of terrestrial tropical forests (Valiela et al., 2001). They are also amongst the most efficient of all natural carbon sinks and provide a very wide range of other ecosystem services (Donato et al., 2011; Balmford et al., 2002).
Mangroves are declining in quality and area throughout Kenya; their total extent decreased by 0.7% per year between 1985 and 2000 (Kirui et al., in prep.).
2.2 Description of project area and activity areas
The project area is Gazi Bay, Kenya (4o 25’S and 39o 50’E; Figure 1). Gazi bay is
situated on the south coast of Kenya, some 50 km from Mombasa. The bay is sheltered from strong waves by the Chale Peninsula to the east and a fringing coral reef to the south. Two seasonal rivers, Kidogoweni and Mkurumudji, drain into the
bay and groundwater seepage is restricted to a few points. Total annual precipitation (1000-1600 mm) falls mainly in two rainy seasons (April-August and October-
November). Air temperature is 24-39oC and relative humidity averages 95%. All the areas relevant to this proposal lie between mid-tidal and spring high-tidal levels, that is between 1 and 4 metres above sea level (the spring tidal range is ~4.0 m).
Sediment in these areas ranges from sand through to fine muddy silt. All the nine species of mangroves occurring in Kenya are found in Gazi bay; the dominant
species (and the most important one for this specification) is Rhizophora mucronata. Sonneratia alba is the only species capable of tolerating the exposed beach conditions found to the south east of the bay, close to Gazi village, and this species
will be used for project activities there (in activity area 3, Sonneratia alba plantation on open beach).
The 615 ha of mangrove forest at Gazi is the best-studied mangrove ecosystem in Africa, and amongst the best known in the world (see e.g. Huxham et al., 2010;
Bosire et al., 2003; Kairo et al., 2001). There is a long history of community participation in and support for mangrove research and restoration (Kairo, 1995) and
Gazi village hosts a field station run by the Kenya Marine and Fisheries Research Institute which specialises in mangrove research.
The mangrove forests of Gazi bay have been exploited for many years especially for building poles and fuel-wood (Bosire et al., 2003; Kairo, 1995). This exploitation
continues today and has produced a human-impacted forest with numerous stumps and other indications of cutting (Dahdouh-Guebas et al., 2004).
Mikoko Pamoja Technical Specification Summary and Scope
5
The Kenyan government owns the mangrove forests and legal extraction is limited to individuals and groups with a Kenya Forest Service licence (although illegal
extraction is common). The Mikoko Pamoja project will ensure local tenure-ship through a Community Forest Association agreement and all profit from the project
will be used for community benefit. Activity area 1 is located in this natural, degraded forest (figure 2). In the past, clear-
felling due to the industrial extraction of fuel wood left large contiguous blank areas, including one along a wave exposed beach. This site was previously covered by a
fringing Sonneratia forest ~ 40-70 m deep and ~800 m long. As a consequence of tree removal the site experiences coastal erosion resulting in coconut palms in the adjacent agricultural field being washed into the sea and mangrove death up-current
caused by swamping of trees by eroded sand (Dahdouh-Guebas et al., 2004). These deforested areas show little or no natural regeneration but experimental
restoration efforts have been successful there (Kirui et al., 2008). Activity area 2 consists of two plantations of Rhizophora mucronata established in
formerly denuded areas 11 and 16 years ago.
Activity area 3 is located in the deforested beach area to the south of the village (figure 2).
Mikoko Pamoja Technical Specification Summary and Scope
6
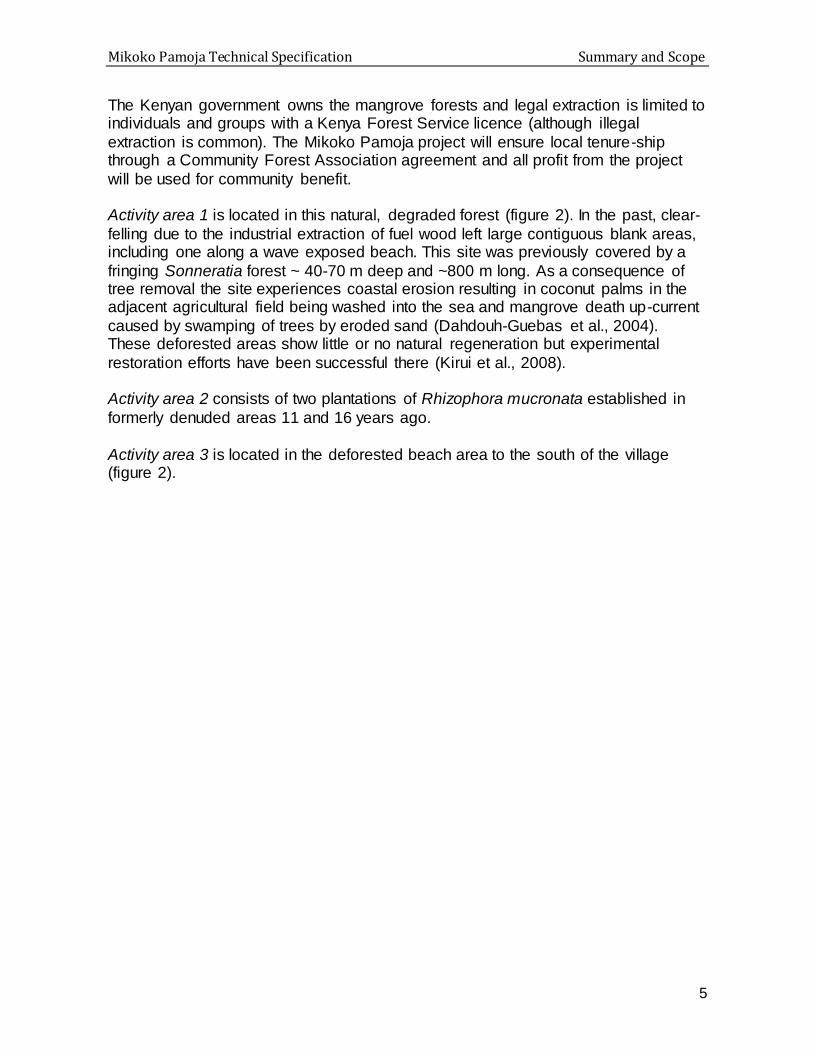
2.3 Map of project area and activity areas
Figure 1. The project area. Image taken from Google Earth 2 May 2011
Key Activity area Baseline
land cover type
Activity
Yellow stippled
Activity area 1
Rhizophora mucronata forest
Protection of Rhizophora mucronata
forest
Brown squares
Activity area 2
Rhizophora mucronata plantations
Protection of Rhizophora mucronata
plantations
Red outline Activity area 3
Open beach Sonneratia alba plantation
1 Km
Mikoko Pamoja Technical Specification Summary and Scope
7
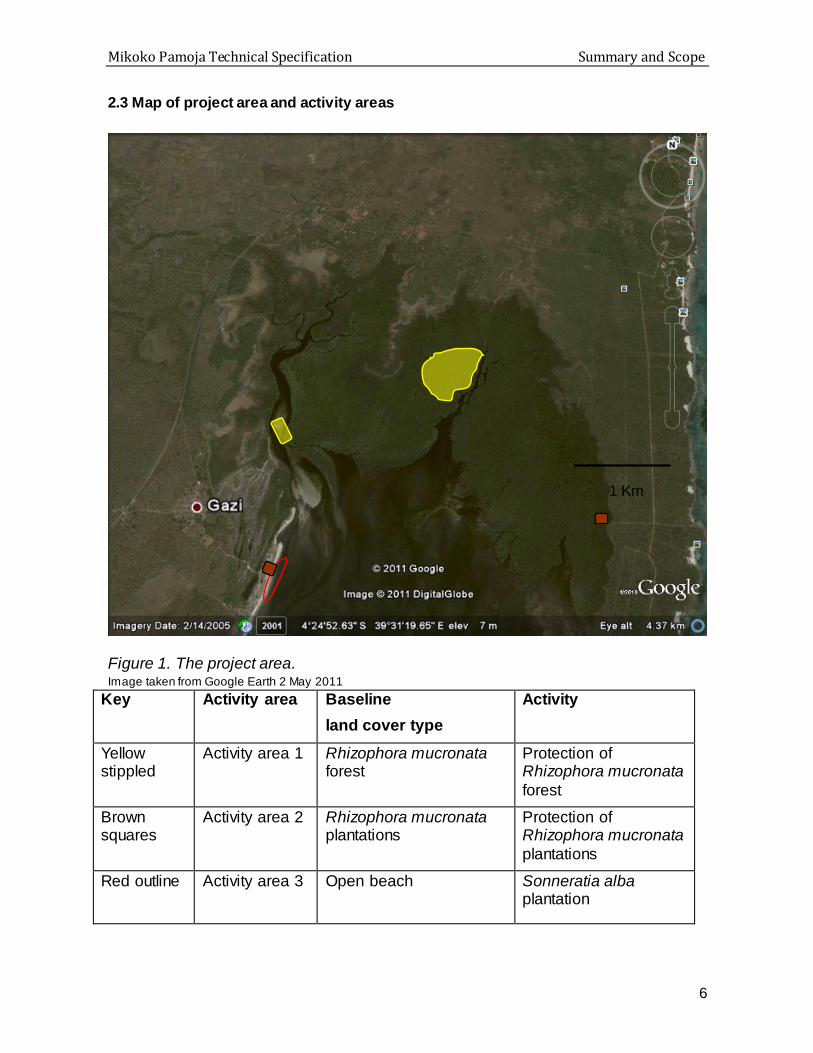
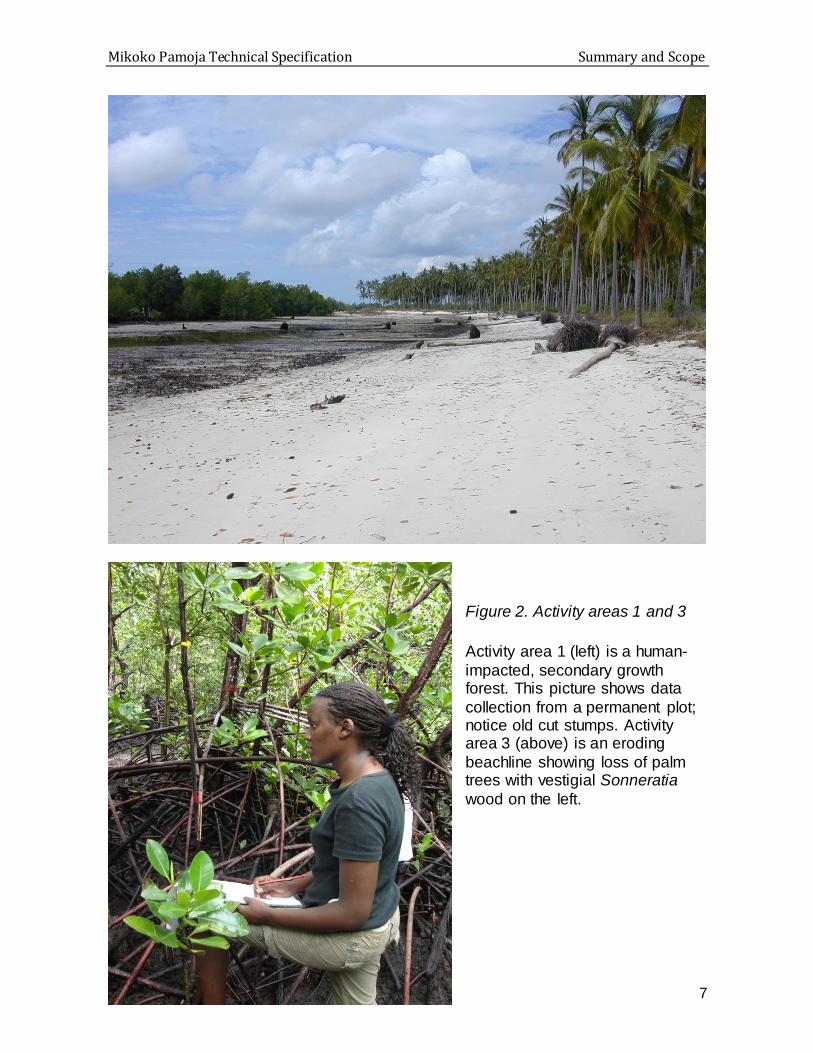
Figure 2. Activity areas 1 and 3
Activity area 1 (left) is a human-
impacted, secondary growth forest. This picture shows data
collection from a permanent plot; notice old cut stumps. Activity area 3 (above) is an eroding
beachline showing loss of palm trees with vestigial Sonneratia
wood on the left.
Mikoko Pamoja Technical Specification Carbon Pools
8
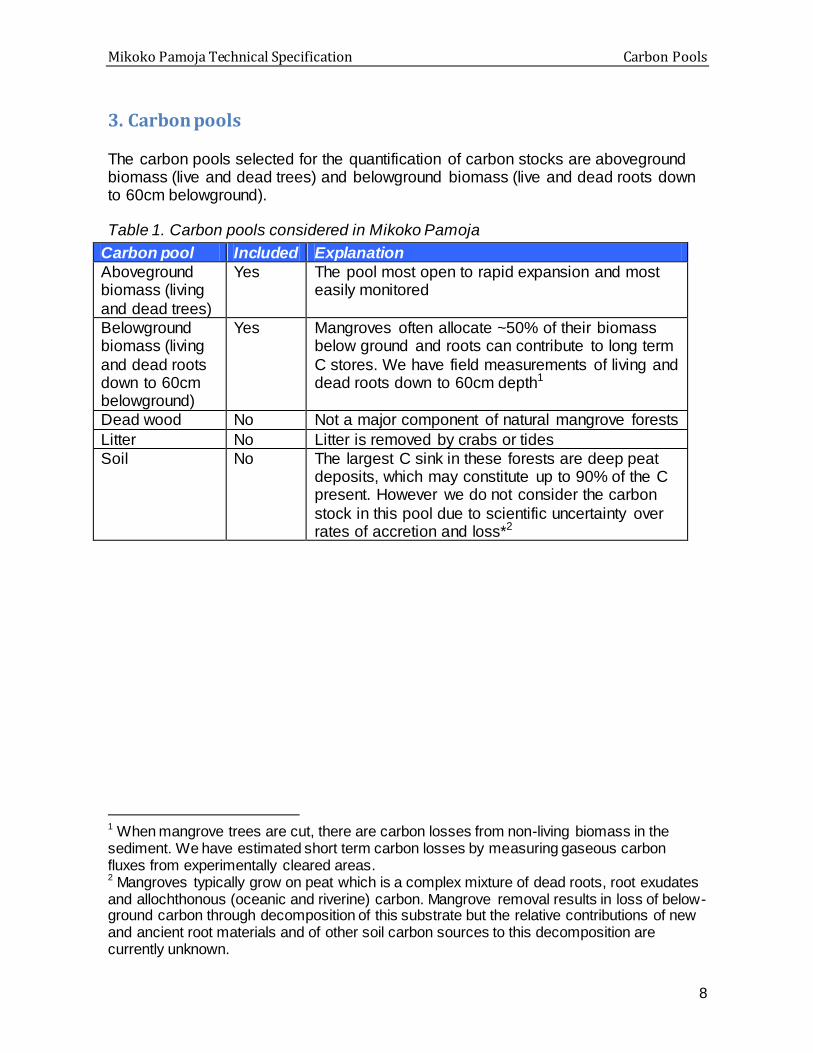
3. Carbon pools
The carbon pools selected for the quantification of carbon stocks are aboveground biomass (live and dead trees) and belowground biomass (live and dead roots down to 60cm belowground).
Table 1. Carbon pools considered in Mikoko Pamoja
Carbon pool Included Explanation
Aboveground biomass (living
and dead trees)
Yes The pool most open to rapid expansion and most easily monitored
Belowground biomass (living
and dead roots down to 60cm belowground)
Yes Mangroves often allocate ~50% of their biomass below ground and roots can contribute to long term
C stores. We have field measurements of living and dead roots down to 60cm depth1
Dead wood No Not a major component of natural mangrove forests
Litter No Litter is removed by crabs or tides
Soil No The largest C sink in these forests are deep peat deposits, which may constitute up to 90% of the C present. However we do not consider the carbon
stock in this pool due to scientific uncertainty over rates of accretion and loss*2
1 When mangrove trees are cut, there are carbon losses from non-living biomass in the sediment. We have estimated short term carbon losses by measuring gaseous carbon fluxes from experimentally cleared areas. 2 Mangroves typically grow on peat which is a complex mixture of dead roots, root exudates and allochthonous (oceanic and riverine) carbon. Mangrove removal results in loss of below-ground carbon through decomposition of this substrate but the relative contributions of new and ancient root materials and of other soil carbon sources to this decomposition are currently unknown.
Mikoko Pamoja Technical Specification Carbon Pools
9
4. Carbon baseline (without-project scenario) 4.1 Initial carbon stocks in project activity areas
Our Plan Vivo involves three different activity areas with different initial carbon stocks:
1. Rhizophora forest. This is part of the main forest at Gazi with an estimated
aboveground dry mass (mean ± SE) of 452 ± 72 t ha-1 (Kirui et al., 2006).
Belowground dry mass (to 60cm depth) is 35.8 t ha-1 living roots and 32.6 t ha-1 dead roots (Tamooh et al., 2008). But note that this 68.4 t in total is a
large underestimate of below-ground carbon since most of it will lie below this depth. The project will protect two areas within this forest type; a 100 ha area in the main natural forest and an area of 7 ha located nearer to the village and
close to a mangrove walkway and developing eco-tourism centre (Figure 1). 2. Rhizophora plantations. These are small (7 ha and 3 ha) areas of Rhizophora
trees planted 16 and 11 years ago respectively (Figure 1). At 12 years of age the larger plantation had 141.56 t ha-1 total dry mass, consisting of 106.7 ± 24 (mean ± SD) aboveground mass (Kairo et al., 2008) as well as 35.9 t ha-1
belowground dry mass comprised of 24.9 t ha-1 living and 10 t ha-1 dead roots (Tamooh et al., 2008).
3. Open beach. This is an area of beach that was clear-felled some 40 years ago and is now suffering from erosion (Figure 2). The baseline carbon here is therefore zero.
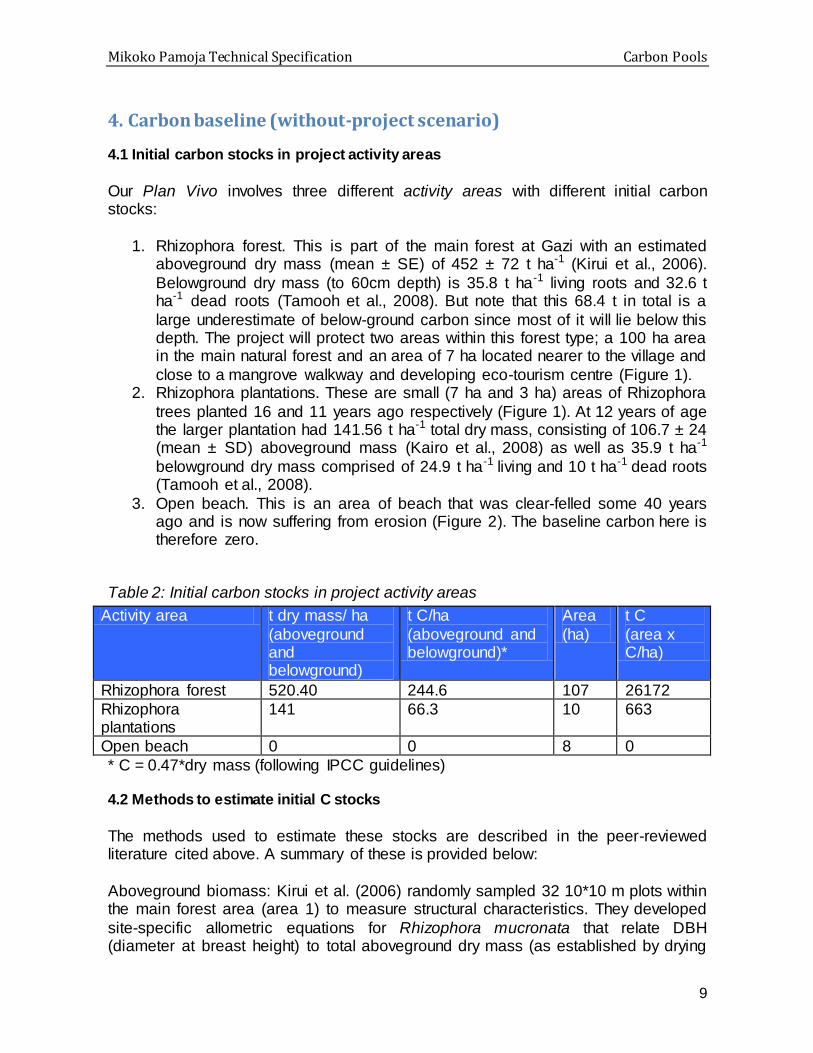
Table 2: Initial carbon stocks in project activity areas
Activity area t dry mass/ ha
(aboveground and belowground)
t C/ha
(aboveground and belowground)*
Area
(ha)
t C
(area x C/ha)
Rhizophora forest 520.40 244.6 107 26172
Rhizophora plantations
141 66.3 10 663
Open beach 0 0 8 0
* C = 0.47*dry mass (following IPCC guidelines) 4.2 Methods to estimate initial C stocks
The methods used to estimate these stocks are described in the peer-reviewed literature cited above. A summary of these is provided below:
Aboveground biomass: Kirui et al. (2006) randomly sampled 32 10*10 m plots within the main forest area (area 1) to measure structural characteristics. They developed
site-specific allometric equations for Rhizophora mucronata that relate DBH (diameter at breast height) to total aboveground dry mass (as established by drying

Mikoko Pamoja Technical Specification Carbon Pools
10
and weighing sample trees) and used these data to derive their estimate of aboveground biomass. We use their work to provide our initial C estimate since it is
the most recent, comprehensive and peer reviewed data available giving site-specific numbers, and we do not expect carbon stocks to have changed significantly
since the time of the survey. Aboveground C stocks in the older and larger plantation were estimated by Kairo et al. (2008). Again these estimates are the most thorough available and are not expected to differ significantly from contemporary carbon
stocks. We have no independent estimates for the smaller, younger plantation, but since it is in a similar location and now of the same age as the larger plantation
when it was surveyed we think using the same figures is justified (particularly given its small size and small contribution to total C credits).
Belowground biomass: the methodology is described in full in Tamooh et al. (2008) and this text is taken from there:
Three 10 x 10 m plots were marked in the Rhizophora forest and two in the plantation. Four trees per plot were randomly selected for root coring. A ring was
drawn around the base of of each tree and was subsequently subdivided into 3 parts at 120o. For each tree, three cores (60 cm deep and 15.6 cm diameter) were
taken from each of three horizontal positions; at the tree base, at mid canopy and at the edge of the canopy. Hence, a total of 36 cores were taken per plot. Cores were divided into three 20 cm vertical categories: 0-20 cm, 20-40 cm, and 40-60
cm. Each sample was washed over a 1 mm mesh and live and dead roots separated. Live roots were then sorted into diameter classes: < 5mm, 5-10mm,
10-20 mm, 20-30 mm, 30-40 mm and >40 mm. All roots were weighed fresh. A representative fresh sub-sample from each root class was oven dried at 800 C to a constant weight and re-weighed. Results obtained were pooled to obtain dry root
biomass per unit ground area.
The calculations were based on the dry weights obtained. For root biomass at the base of tree stems, the basal area of the trees (G, per m2) within the 100 m2
plot was determined using the conventional basal area formula (Cintrón and
Schaeffer-Novelli, 1984); 1
2 G=
∑ (D/2)2 π
10000
Where D (cm) was diameter at breast height (1.3 m above ground) of the trees in the plot. Basal area was summed over all trees within each plot. The area occupied by a single core (Acore) was 0.0191 m2 (15.6 cm diameter). Root
biomass at the middle (Mmiddle) and edge (Medge) of the tree canopy for all species were found not to differ significantly and were therefore pooled together and
considered as root biomass “between” the trees in the calculations, i.e.:
2
edgemiddle
between
MMM

Mikoko Pamoja Technical Specification Carbon Pools
11
Therefore,
coreA
GM
A
GMM
)100(between
core
base
plot
TOT
(kg/m2)
where plot
TOTM and Mbase were the total mass of roots for the 100 m2 plot and the
mass of roots at the base of trees, respectively. Values per hectare were then
correspondingly obtained.
4.3 Expected change in carbon stocks without project activities
In the absence of the project the forest area will suffer a reduction in above and below-ground carbon stocks because of unlicensed removal:
4.3.1 Unlicensed cutting – aboveground C
Abundant evidence (including numerous peer-reviewed studies) demonstrates that
the forests have suffered significant human impacts over the last few decades. Kairo (1995) documented extensive signs of cutting and recorded the results of early
attempts to restore forests. Kairo et al. (2001) described how the mangroves at Gazi fit a general pattern of over-exploitation in Kenya. Using aerial photographs Dahdouh-Guebas et al. (2004) showed a loss of 51% in mangrove coverage
between 1972 and 1992 in one area of the bay and predicted further losses based on these past trends and on vegetation analyses. Recent unpublished work by the
team shows how the mangroves in Gazi Bay are economically over-harvested, representing a secondary forest with extensive human impact in comparison to more pristine northern forests (Cohen et al., in prep). Aboveground biomass in area 1 (the
main forest) was estimated as 515 t ha in 1992 (Slim et al. 1996); comparison with the more recent estimate by Kirui et al. (2006) implies a loss of aboveground
biomass of 4.5 t ha-1 yr-1 within the main forest (area 1). In addition, eco-physiological modelling shows that the forests in the area could show similar levels of productivity to those in the north if spared from human impact (Blumowski, 2011).
The project team have just completed an analysis of mangrove spatial coverage in
Kenya using satellite imagery and aerial photography and tracking changes between 1985 and 2010 (Kirui et al., 2011). This showed an average rate of loss of 0.7% yr-1 across the whole of Kenya for those 25 years and 0.28% yr-1 in the decade before
2010. We will use this national estimate of 0.28% loss per year as our expected change in spatial coverage in the absence of project activities, and translate this
spatial loss to loss of carbon. Where the forest coverage is projected to remain (i.e. the large majority of our proposed protected areas) we assume a baseline of no carbon loss due to degradation. This is conservative for two reasons:
1) Most of the impact that is easily seen on the ground and is recorded in the
literature is forest degradation rather than total removal. The 0.28% yr-1
Mikoko Pamoja Technical Specification Carbon Pools
12
estimate does not address forest degradation (since the remote sensing techniques cannot detect it). Protecting degraded forests from further
degradation will result in them accumulating biomass, but in the absence of data from pristine un-cut forests (or detailed time-series showing historical
loss due to degradation) it is not possible to accurately say how continued degradation would reduce biomass. The best estimate available is that the Gazi forests have lost 4.5 t ha-1 yr-1 due to forest degradation over the 14
years between 1992 and 2006. Since we have only this single previous published estimate, and given the variability involved in these figures, we
have chosen to assume a highly conservative zero change baseline for forest degradation.
2) Historical rates of forest removal in the Gazi area have far exceeded the 0.28% value (Dahdouh-Guebas et al., 2004) and we will use only the most
recent and slower rate from the national assessment rather than the faster average rate taken over 25 years. Recent work by the project team (Briers 2011, unpublished) using remote sensing data to identify risk factors showed
hotels, roads and related coastal developments to be important drivers of loss; these are particularly concentrated in the populous south coast and
rates of loss here exceed those in the north.
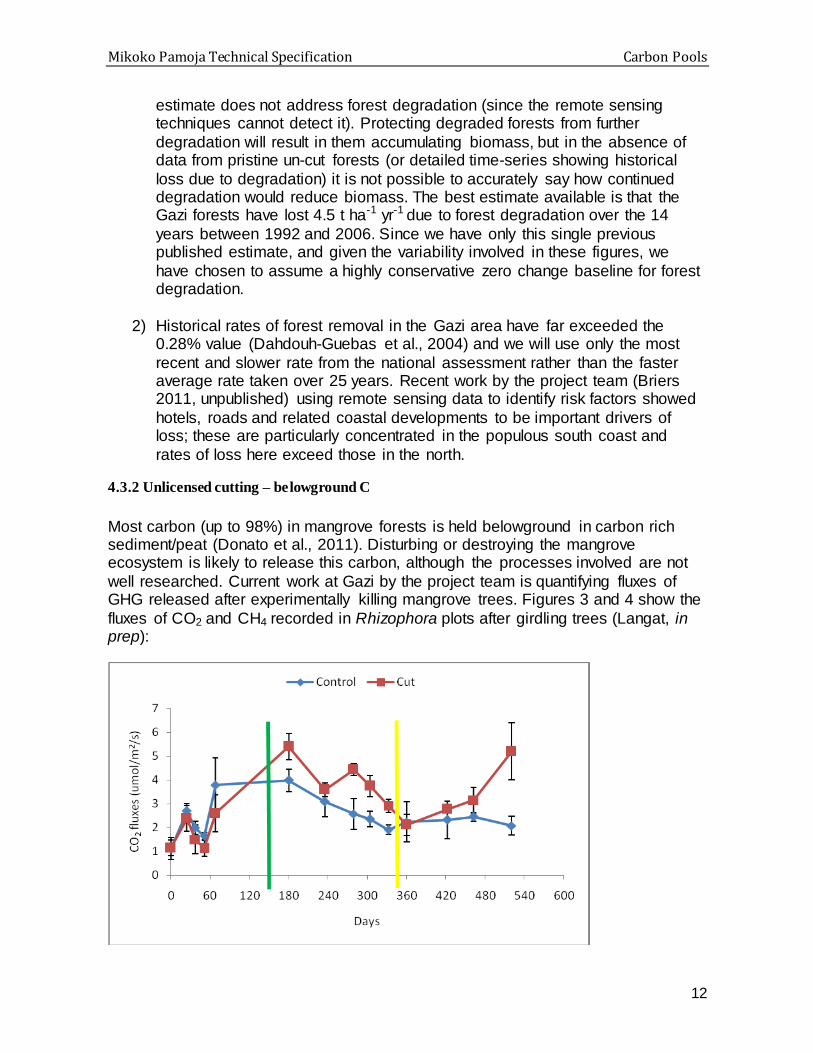
4.3.2 Unlicensed cutting – belowground C
Most carbon (up to 98%) in mangrove forests is held belowground in carbon rich sediment/peat (Donato et al., 2011). Disturbing or destroying the mangrove ecosystem is likely to release this carbon, although the processes involved are not
well researched. Current work at Gazi by the project team is quantifying fluxes of GHG released after experimentally killing mangrove trees. Figures 3 and 4 show the
fluxes of CO2 and CH4 recorded in Rhizophora plots after girdling trees (Langat, in prep):

Mikoko Pamoja Technical Specification Carbon Pools
13
Figure 3. Mean (± S.E.) CO2 fluxes in Rhizophora mucronata forest.
Girdled period was between 150 (green vertical line) and 340 (yellow vertical line) days after start of sampling, clear-cut period = 340 days onwards.
Figure 4. Mean (± S.E.) CH4 fluxes in R. mucronata forest. Girdled period was between 150 (green vertical line) and 340 (yellow vertical line) days after start of sampling, clear-cut period = 340 days onwards
These results show enhanced carbon dioxide and methane fluxes (above the control
values) as a result of cutting, equating to roughly equivalent to an extra 1.3 micromoles m-2 s-1 (or 3.85 t C ha-1 over 290 days) CO2 and 7 nmol m-2 s-1 (or 0.021 t C ha-1 over 290 days) CH4 . These results are presented over 290 days since this
was the period of time between experimental girdling of trees and their complete removal. Whilst methane emissions had returned to control levels after this time,
CO2 fluxes remained elevated. In fact plots in which trees had been killed now show highly significant on-going subsidence as a result of the decomposition of below-ground material (Figure 5).
Mikoko Pamoja Technical Specification Carbon Pools
14
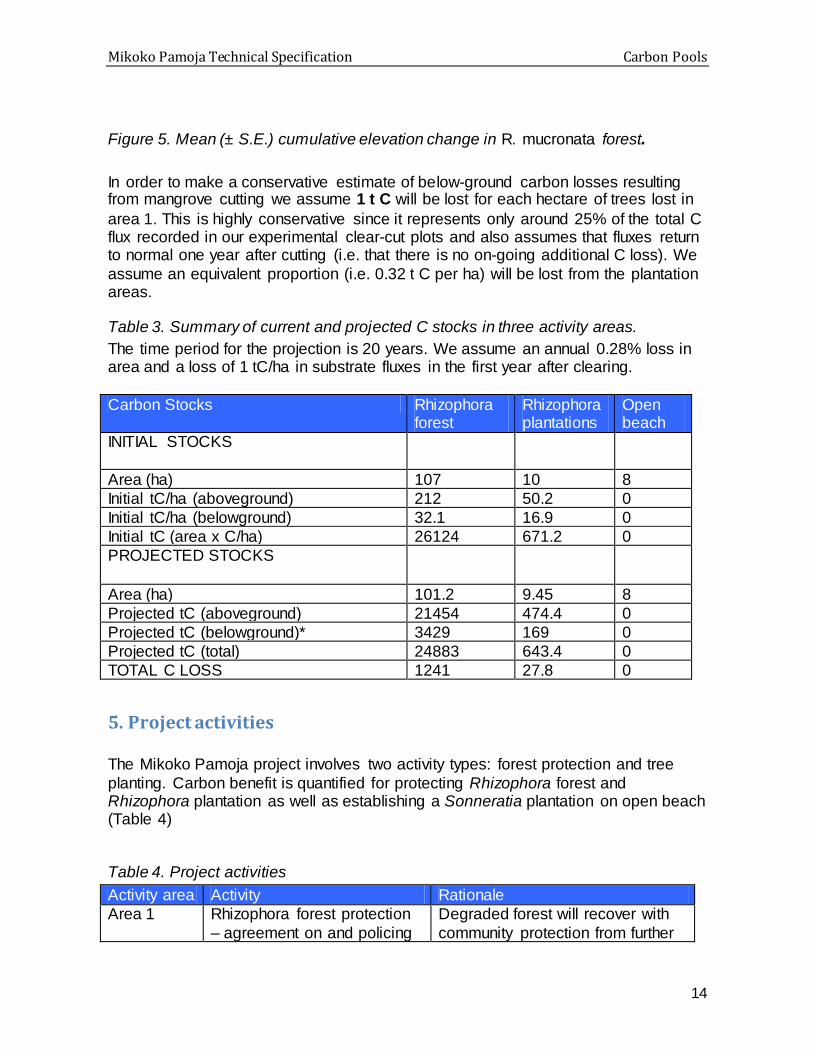
Figure 5. Mean (± S.E.) cumulative elevation change in R. mucronata forest.
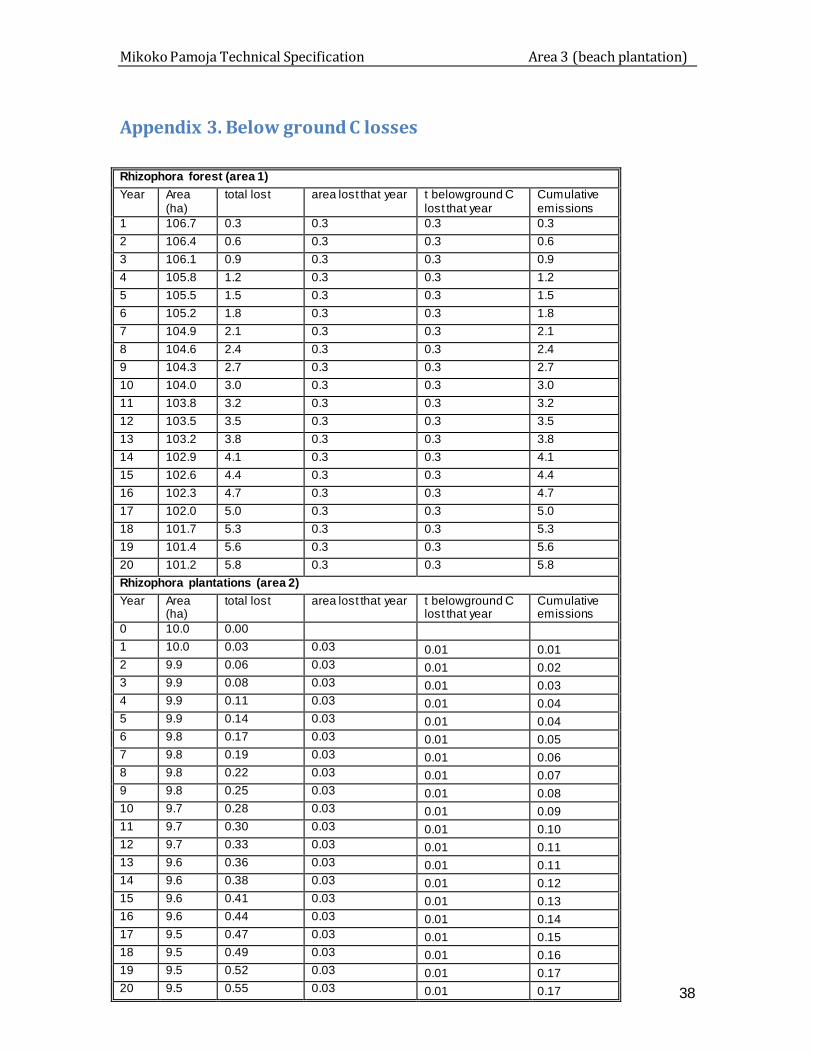
In order to make a conservative estimate of below-ground carbon losses resulting from mangrove cutting we assume 1 t C will be lost for each hectare of trees lost in
area 1. This is highly conservative since it represents only around 25% of the total C flux recorded in our experimental clear-cut plots and also assumes that fluxes return to normal one year after cutting (i.e. that there is no on-going additional C loss). We
assume an equivalent proportion (i.e. 0.32 t C per ha) will be lost from the plantation areas.
Table 3. Summary of current and projected C stocks in three activity areas.
The time period for the projection is 20 years. We assume an annual 0.28% loss in area and a loss of 1 tC/ha in substrate fluxes in the first year after clearing.
Carbon Stocks Rhizophora forest
Rhizophora plantations
Open beach
INITIAL STOCKS
Area (ha) 107 10 8
Initial tC/ha (aboveground) 212 50.2 0
Initial tC/ha (belowground) 32.1 16.9 0
Initial tC (area x C/ha) 26124 671.2 0
PROJECTED STOCKS
Area (ha) 101.2 9.45 8
Projected tC (aboveground) 21454 474.4 0
Projected tC (belowground)* 3429 169 0
Projected tC (total) 24883 643.4 0
TOTAL C LOSS 1241 27.8 0
5. Project activities The Mikoko Pamoja project involves two activity types: forest protection and tree
planting. Carbon benefit is quantified for protecting Rhizophora forest and Rhizophora plantation as well as establishing a Sonneratia plantation on open beach (Table 4)
Table 4. Project activities
Activity area Activity Rationale
Area 1 Rhizophora forest protection
– agreement on and policing
Degraded forest will recover with
community protection from further

Mikoko Pamoja Technical Specification Carbon Pools
15
of clear boundaries for protected, no-take areas
degradation and removal; current C stocks conserved and more C accumulated.
Area 2 Rhizophora plantation protection – agreement on and policing of clear
boundaries for protected, no-take areas
Recent plantations will avoid incursions and poaching with rapidly growing trees conserving
current C and sequestering new C.
Area 3 Sonneratia tree planting and
protection
Clear-felled and eroding beach
area will benefit from planting of new trees that cannot establish unaided. Some direct C benefits as
a result but other ecosystem benefits such as coastline
protection even more important.
In addition to the activities for which carbon benefit is quantified, a woodlot of Casuarina equisitifolia trees will be established on community land. As part of the
leakage mitigation plan, the Casuarina woodlot will provide fuel wood and timber for local people and a sustainable source of income for the community fund.
We propose to use this species because:
a) It is already widely present along the coast, both in commercial (small scale) plantations and as wild (naturalised) trees.
b) There is expertise and local resources available to support its growing. A number
of villagers already have trees growing on their smallholdings and thus have the knowledge to grow the trees and the networks of suppliers and nurseries to support them. We took their advice (that is the advice of the users and local community) on
the best species to use in the woodlot.
c) It grows very fast and produces poles that can be used to replace mangroves in building and brush in firewood.
The woodlot will be planted in an area near the Gazi school building which is
community land next to a farm and a coconut plantation. Hence this is already agricultural/urban land with no conservation interest. The water table in this area is close to the surface and water is abundant. There are freshwater seeps on the
beach and the rainfall is more than 1000 mm per year. Hence we are confident that this relatively small plantation will not affect the water table and will have no
detrimental impacts on conservation or wildlife.

Mikoko Pamoja Technical Specification Carbon Benefits
16
6. Land management plan 6.1 The land management system
All mangrove land in Kenya is trust land; it is registered by the government of Kenya as Forest Reserve. The land is swampy receiving sea water during all spring tides.
This project will establish community tenure-ship of the project areas through the establishment and support of a Community Forest Association for the Gazi Bay area; this will provide a legal instrument to allow community benefit. The government
of Kenya, through the Kenya Forest Service, is highly supportive of joint forest management with communities.
The main benefit to be derived from this proposed management – the main saleable product of the project – will be Plan Vivo certificates (carbon credits). However
mangroves are amongst the most ecologically valuable of all ecosystems and provide a wide range of other services and benefits, including traditional medicines
and fish, protection of the shoreline from erosion and control of water quality. Hence by protecting and restoring mangroves we will be facilitating a wide range of additional benefits which are not explicitly priced in this proposal. 6.2 Tree species
The natural forest in activity area 1 is dominated by Rhizophora mucronata but has some Ceriops tagal and Bruguiera gymnorrhiza individuals. The Rhizophora plantations (activity area 2) are monospecific Rhizophora mucronata stands. The
proposed plantations (activity area 3) will be monospecific Sonneratia alba stands (this is the only species that can survive the beach conditions). All these are native
species. In addition to these areas we propose a non-native plantation of 3000 Casuarina equisetifolia as part of our leakage mitigation plans (see below). 6.3 Site preparation, planting and care of trees
Sonneratia alba plantation
Establishing and maintaining the Sonneratia plantation at the beach site will require the following organisation:
Nursery establishment – this will precede the outplanting of Sonneratia; nurseries are protected areas near to Gazi village which have been used successfully for
many years to raise seedlings to 4-6 months of age before planting. Experienced local people will work on the nursery teams for two weeks every year. The teams will
be led and recruited by the Mikoko Pamoja project co-ordinator. We anticipate using a mix of paid and volunteer labour (with salaries eventually funded from project income, but covered for the first year by start-up funding already secured). The exact
mix of support will eventually be determined annually by the Mikoko Pamoja community council following discussion on how best to spend project income.

Mikoko Pamoja Technical Specification Carbon Benefits
17
Site preparation and planting – site preparation will involve establishing wave breaks from eroded palm trunks already on the beach. Trees will be planted at 6 months of
age at 0.8m intervals (since higher density planting facilitates survival). Preparation and planting teams will consist of a mix of international volunteers (from
Earthwatch), local volunteers (particularly the women’s and youth groups) and paid project workers. Start-up money will fund the plantation in our initial year, with project income being used after that.
Site monitoring – this task will be performed by international volunteers annually,
overseen by the project team. Preparation of the Casuarina woodlot site will involve removal of grass and brash
and the digging of holes prior to planting. The seedlings will be purchased from the participating community youth group. The site will be fenced (to prevent cattle
damage) and protected by a 5m wide firebreak. Trees will be weeded twice yearly and pruned annually; planting during the rainy season will preclude the need for initial watering and local experience is that watering is not required subsequently.
The schedule of harvesting is detailed in Table 6 below. 6.4 Implementation and operational plan and responsibilities
Project implementation will involve the following activities:
Mapping and marking of perimeters of agreed protected areas.
Project roadshow with communication materials and talks in all relevant villages
Preparation of planting area (area 3, Sonneratia planting on open beach).
Establishment of Casuarina plantation (including ground preparation, planting
and fencing).
Establishment of MP community committee (under the auspices of the new community forest association) to guide the project on community spending
targets.
These initial activities will be supported separately from start-up funding already secured. They are the responsibility of the whole project team. Continuous project activities are described in Table 5.
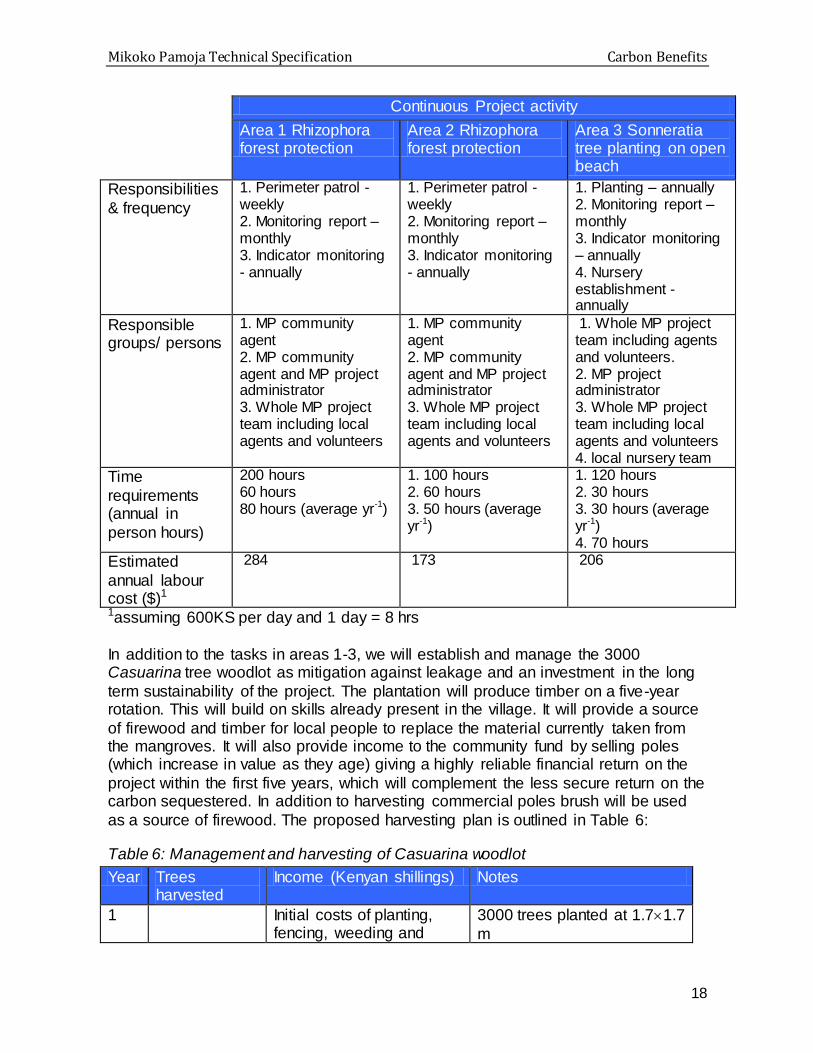
Table 5. Continuous project activities
(separate from organisational and administrative tasks) with approximate costs of
casual labour (additional to permanent project staff).
Mikoko Pamoja Technical Specification Carbon Benefits
18
Continuous Project activity
Area 1 Rhizophora forest protection
Area 2 Rhizophora forest protection
Area 3 Sonneratia tree planting on open beach
Responsibilities
& frequency
1. Perimeter patrol - weekly 2. Monitoring report – monthly 3. Indicator monitoring - annually
1. Perimeter patrol - weekly 2. Monitoring report – monthly 3. Indicator monitoring - annually
1. Planting – annually 2. Monitoring report – monthly 3. Indicator monitoring – annually 4. Nursery establishment - annually
Responsible groups/ persons
1. MP community agent 2. MP community agent and MP project administrator 3. Whole MP project team including local agents and volunteers
1. MP community agent 2. MP community agent and MP project administrator 3. Whole MP project team including local agents and volunteers
1. Whole MP project team including agents and volunteers. 2. MP project administrator 3. Whole MP project team including local agents and volunteers 4. local nursery team
Time
requirements (annual in
person hours)
200 hours 60 hours 80 hours (average yr-1)
1. 100 hours 2. 60 hours 3. 50 hours (average yr-1)
1. 120 hours 2. 30 hours 3. 30 hours (average yr-1) 4. 70 hours
Estimated
annual labour cost ($)1
284 173 206
1assuming 600KS per day and 1 day = 8 hrs
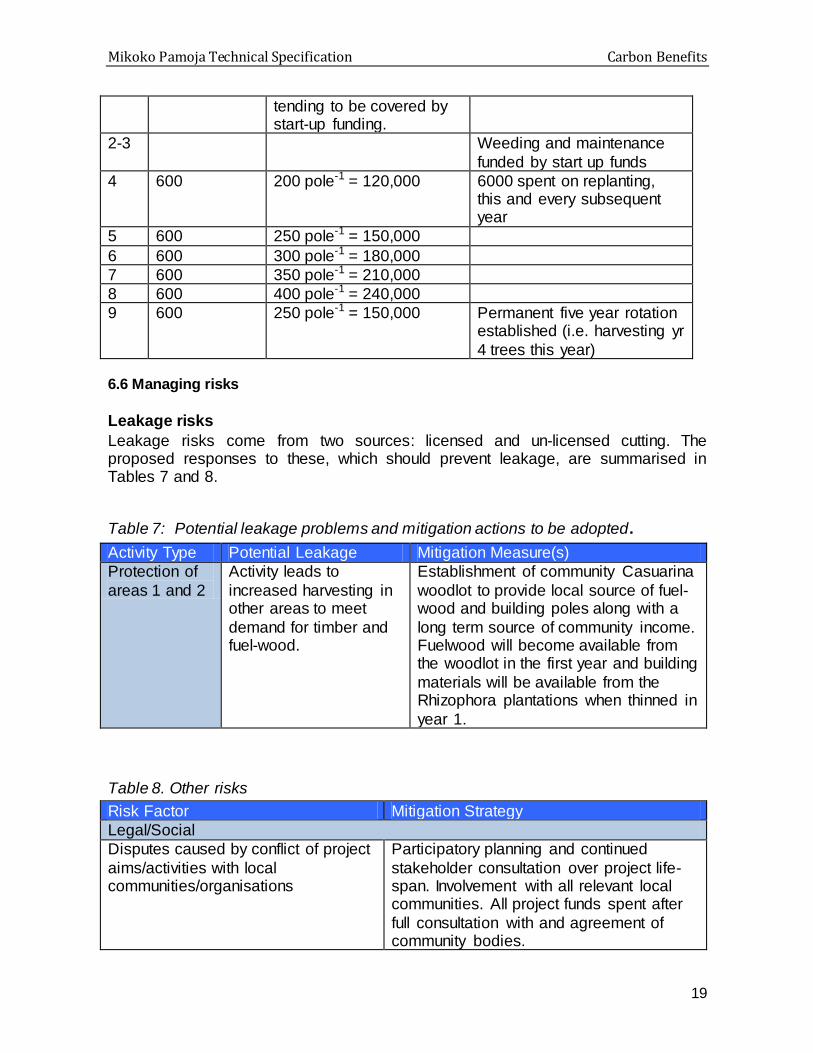
In addition to the tasks in areas 1-3, we will establish and manage the 3000 Casuarina tree woodlot as mitigation against leakage and an investment in the long
term sustainability of the project. The plantation will produce timber on a five-year rotation. This will build on skills already present in the village. It will provide a source
of firewood and timber for local people to replace the material currently taken from the mangroves. It will also provide income to the community fund by selling poles (which increase in value as they age) giving a highly reliable financial return on the
project within the first five years, which will complement the less secure return on the carbon sequestered. In addition to harvesting commercial poles brush will be used
as a source of firewood. The proposed harvesting plan is outlined in Table 6:
Table 6: Management and harvesting of Casuarina woodlot
Year Trees harvested
Income (Kenyan shillings) Notes
1 Initial costs of planting, fencing, weeding and
3000 trees planted at 1.71.7
m
Mikoko Pamoja Technical Specification Carbon Benefits
19
tending to be covered by start-up funding.
2-3 Weeding and maintenance
funded by start up funds
4 600 200 pole-1 = 120,000 6000 spent on replanting, this and every subsequent year
5 600 250 pole-1 = 150,000
6 600 300 pole-1 = 180,000
7 600 350 pole-1 = 210,000
8 600 400 pole-1 = 240,000
9 600 250 pole-1 = 150,000 Permanent five year rotation established (i.e. harvesting yr
4 trees this year) 6.6 Managing risks
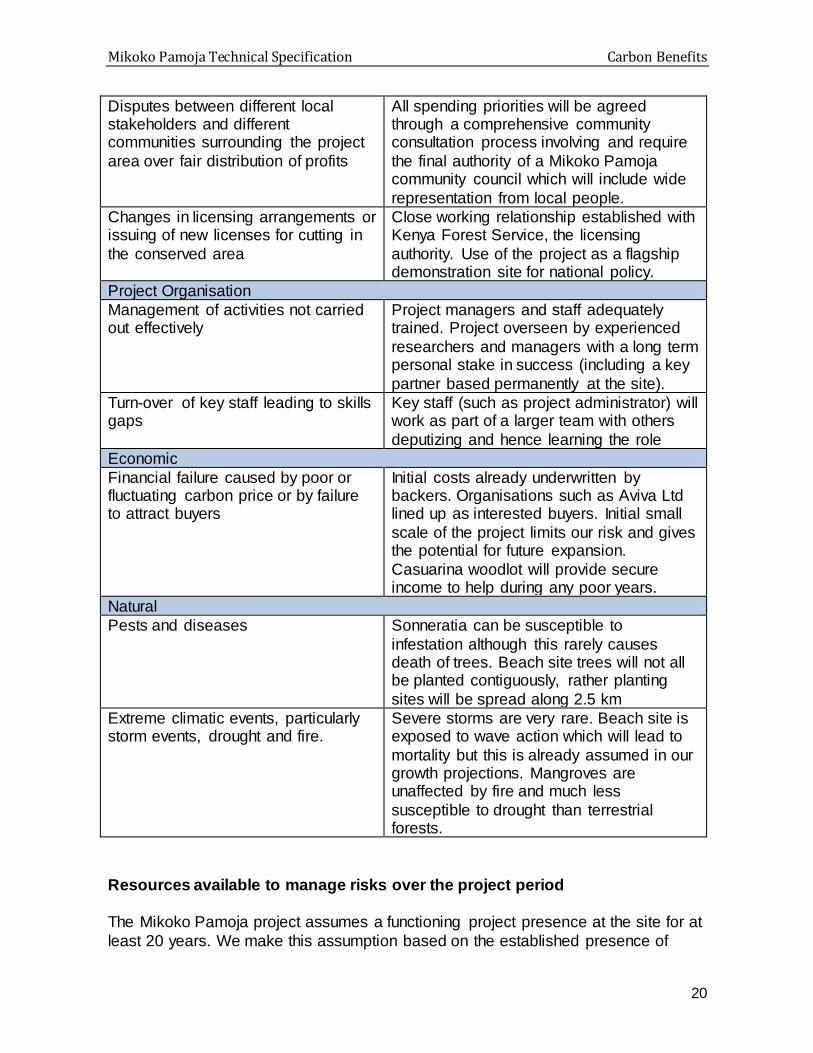
Leakage risks
Leakage risks come from two sources: licensed and un-licensed cutting. The proposed responses to these, which should prevent leakage, are summarised in Tables 7 and 8.
Table 7: Potential leakage problems and mitigation actions to be adopted.
Activity Type Potential Leakage Mitigation Measure(s)
Protection of
areas 1 and 2
Activity leads to
increased harvesting in other areas to meet
demand for timber and fuel-wood.
Establishment of community Casuarina
woodlot to provide local source of fuel-wood and building poles along with a
long term source of community income. Fuelwood will become available from the woodlot in the first year and building
materials will be available from the Rhizophora plantations when thinned in
year 1.
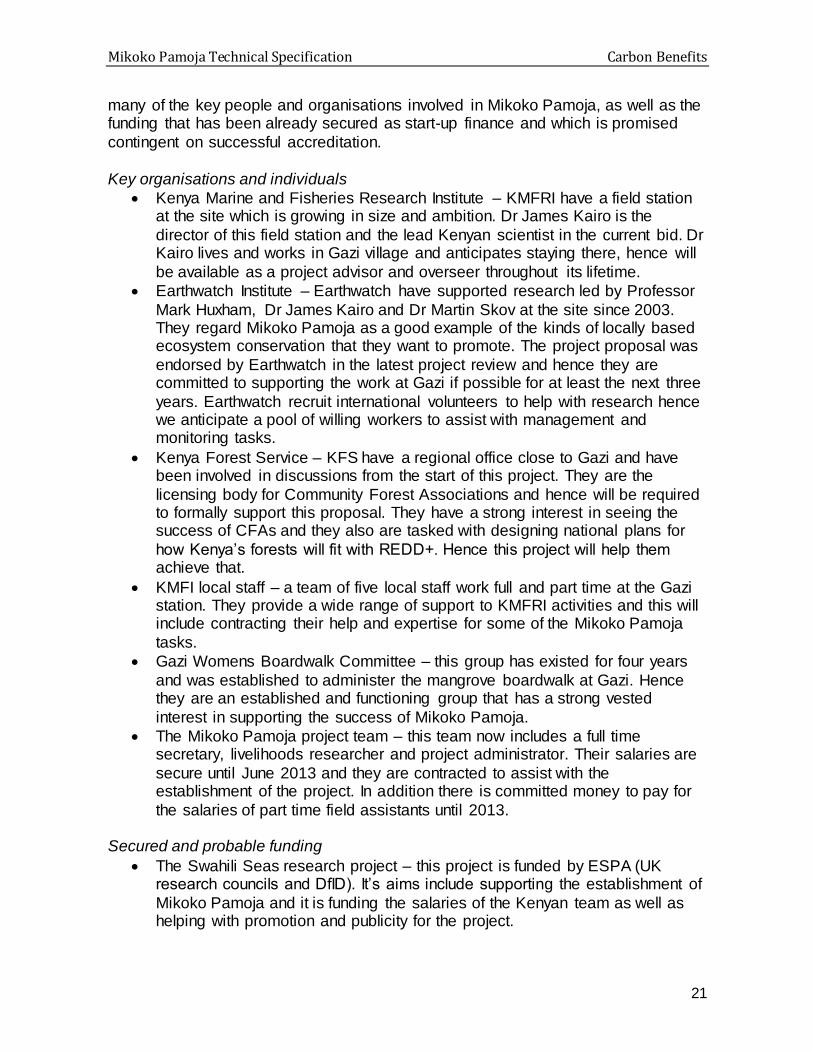
Table 8. Other risks
Risk Factor Mitigation Strategy
Legal/Social
Disputes caused by conflict of project
aims/activities with local communities/organisations
Participatory planning and continued
stakeholder consultation over project life-span. Involvement with all relevant local communities. All project funds spent after
full consultation with and agreement of community bodies.
Mikoko Pamoja Technical Specification Carbon Benefits
20
Disputes between different local stakeholders and different communities surrounding the project
area over fair distribution of profits
All spending priorities will be agreed through a comprehensive community consultation process involving and require
the final authority of a Mikoko Pamoja community council which will include wide
representation from local people.
Changes in licensing arrangements or issuing of new licenses for cutting in
the conserved area
Close working relationship established with Kenya Forest Service, the licensing
authority. Use of the project as a flagship demonstration site for national policy.
Project Organisation
Management of activities not carried out effectively
Project managers and staff adequately trained. Project overseen by experienced
researchers and managers with a long term personal stake in success (including a key
partner based permanently at the site).
Turn-over of key staff leading to skills gaps
Key staff (such as project administrator) will work as part of a larger team with others
deputizing and hence learning the role
Economic
Financial failure caused by poor or fluctuating carbon price or by failure to attract buyers
Initial costs already underwritten by backers. Organisations such as Aviva Ltd lined up as interested buyers. Initial small
scale of the project limits our risk and gives the potential for future expansion.
Casuarina woodlot will provide secure income to help during any poor years.
Natural
Pests and diseases Sonneratia can be susceptible to
infestation although this rarely causes death of trees. Beach site trees will not all be planted contiguously, rather planting
sites will be spread along 2.5 km
Extreme climatic events, particularly storm events, drought and fire.
Severe storms are very rare. Beach site is exposed to wave action which will lead to
mortality but this is already assumed in our growth projections. Mangroves are unaffected by fire and much less
susceptible to drought than terrestrial forests.
Resources available to manage risks over the project period
The Mikoko Pamoja project assumes a functioning project presence at the site for at
least 20 years. We make this assumption based on the established presence of
Mikoko Pamoja Technical Specification Carbon Benefits
21
many of the key people and organisations involved in Mikoko Pamoja, as well as the funding that has been already secured as start-up finance and which is promised
contingent on successful accreditation.
Key organisations and individuals
Kenya Marine and Fisheries Research Institute – KMFRI have a field station at the site which is growing in size and ambition. Dr James Kairo is the
director of this field station and the lead Kenyan scientist in the current bid. Dr Kairo lives and works in Gazi village and anticipates staying there, hence will
be available as a project advisor and overseer throughout its lifetime.
Earthwatch Institute – Earthwatch have supported research led by Professor
Mark Huxham, Dr James Kairo and Dr Martin Skov at the site since 2003. They regard Mikoko Pamoja as a good example of the kinds of locally based ecosystem conservation that they want to promote. The project proposal was
endorsed by Earthwatch in the latest project review and hence they are committed to supporting the work at Gazi if possible for at least the next three
years. Earthwatch recruit international volunteers to help with research hence we anticipate a pool of willing workers to assist with management and monitoring tasks.
Kenya Forest Service – KFS have a regional office close to Gazi and have been involved in discussions from the start of this project. They are the
licensing body for Community Forest Associations and hence will be required to formally support this proposal. They have a strong interest in seeing the success of CFAs and they also are tasked with designing national plans for
how Kenya’s forests will fit with REDD+. Hence this project will help them achieve that.
KMFI local staff – a team of five local staff work full and part time at the Gazi station. They provide a wide range of support to KMFRI activities and this will include contracting their help and expertise for some of the Mikoko Pamoja
tasks.
Gazi Womens Boardwalk Committee – this group has existed for four years
and was established to administer the mangrove boardwalk at Gazi. Hence they are an established and functioning group that has a strong vested
interest in supporting the success of Mikoko Pamoja.
The Mikoko Pamoja project team – this team now includes a full time secretary, livelihoods researcher and project administrator. Their salaries are
secure until June 2013 and they are contracted to assist with the establishment of the project. In addition there is committed money to pay for
the salaries of part time field assistants until 2013. Secured and probable funding
The Swahili Seas research project – this project is funded by ESPA (UK research councils and DfID). It’s aims include supporting the establishment of
Mikoko Pamoja and it is funding the salaries of the Kenyan team as well as helping with promotion and publicity for the project.
Mikoko Pamoja Technical Specification Carbon Benefits
22
Aviva Ltd – Aviva have committed funding for the next 2 years to help with start-up costs. For example all the costs involved in the Casuarina plantation
will be met by these funds.
Earthwatch Institute – in addition to helping provide research funding and
resources, Earthwatch would like to invest carbon offsetting money into this project upon its accreditation; hence we are confident of finding a buyer
quickly for most of our credits. In addition to Earthwatch, Aviva Ltd have also expressed interest in buying credits.
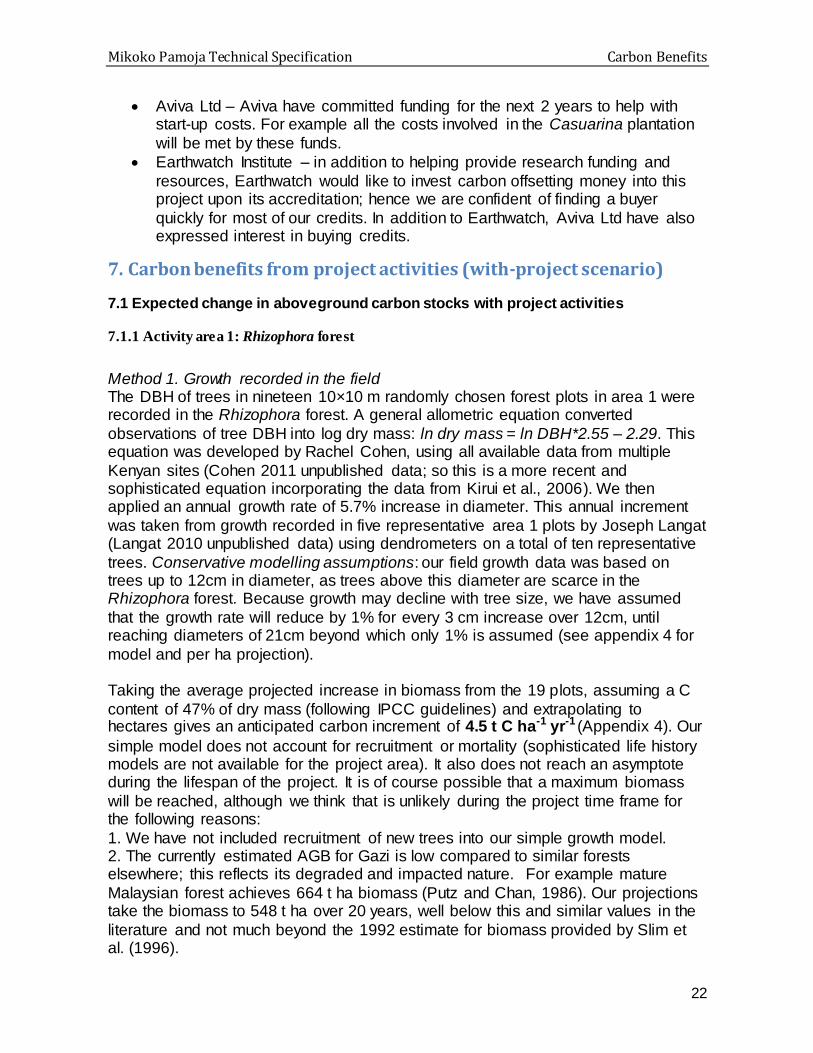
7. Carbon benefits from project activities (with-project scenario) 7.1 Expected change in aboveground carbon stocks with project activities
7.1.1 Activity area 1: Rhizophora forest
Method 1. Growth recorded in the field The DBH of trees in nineteen 10×10 m randomly chosen forest plots in area 1 were recorded in the Rhizophora forest. A general allometric equation converted
observations of tree DBH into log dry mass: ln dry mass = ln DBH*2.55 – 2.29. This equation was developed by Rachel Cohen, using all available data from multiple
Kenyan sites (Cohen 2011 unpublished data; so this is a more recent and sophisticated equation incorporating the data from Kirui et al., 2006). We then applied an annual growth rate of 5.7% increase in diameter. This annual increment
was taken from growth recorded in five representative area 1 plots by Joseph Langat (Langat 2010 unpublished data) using dendrometers on a total of ten representative
trees. Conservative modelling assumptions: our field growth data was based on trees up to 12cm in diameter, as trees above this diameter are scarce in the Rhizophora forest. Because growth may decline with tree size, we have assumed
that the growth rate will reduce by 1% for every 3 cm increase over 12cm, until reaching diameters of 21cm beyond which only 1% is assumed (see appendix 4 for
model and per ha projection). Taking the average projected increase in biomass from the 19 plots, assuming a C
content of 47% of dry mass (following IPCC guidelines) and extrapolating to hectares gives an anticipated carbon increment of 4.5 t C ha-1 yr-1 (Appendix 4). Our
simple model does not account for recruitment or mortality (sophisticated life history models are not available for the project area). It also does not reach an asymptote during the lifespan of the project. It is of course possible that a maximum biomass
will be reached, although we think that is unlikely during the project time frame for the following reasons:
1. We have not included recruitment of new trees into our simple growth model. 2. The currently estimated AGB for Gazi is low compared to similar forests elsewhere; this reflects its degraded and impacted nature. For example mature
Malaysian forest achieves 664 t ha biomass (Putz and Chan, 1986). Our projections take the biomass to 548 t ha over 20 years, well below this and similar values in the
literature and not much beyond the 1992 estimate for biomass provided by Slim et al. (1996).
Mikoko Pamoja Technical Specification Carbon Benefits
23
3. It is unlikely that mangrove forests ever stop accumulating carbon. Terrestrial tropical forests do not and mangroves become more efficient at capturing carbon
(particularly below-ground and including in the form of sediment C from high tide – which is conservatively not included in our estimates here but which amounts to
between 0.5 – 2 t C ha-1yr-1 in area 1) as they get more mature. Method 2. Eco-physiological modelling
The Biome BGC 5.0 biogeochemical model available for Excel (http://www.ntsg.umt.edu/models/bgc/) was used to provide an alternative
assessment of ecosystem productivity. The model simulates the storage and fluxes of water, carbon and nitrogen fluxes in ecosystems. The model simulates fluxes at daily steps and can be applied at different scales. Biome BGC was developed for
terrestrial vegetation ecosystems and requires modifications to be applied to water-logged mangrove habitats. However, the model can be applied to mangroves after
modification according to Luo and others, including effects of salinity on water stress (Luo et al. 2010). The water stress index is modified to account for the impact of salinity by introducing water osmotic potential into the model. The modified Biome
BGC model was obtained from Zhongkui Luo and Osbert Jianxin Sun by request, and was applied to Gazi mangroves and parameterised using appropriate field data
(Blumowski, 2011). The model predicts productivity ranging from 3.2 – 8.8 t C ha-1 yr-1 at the site depending on the level of osmotic stress (caused by salinity) in the soil. We used field data on actual productivity collected over 12 years for the
Rhizophora plantation at Gazi (taken from Kairo et al., 2008) to validate the model. The results showed the best fit at the lowest assumed osmotic stress (i.e. the field
data suggests that the top of the predicted productivity is more likely). Method 3. Comparisons with other sites
The figures reported here fit within the range of observations from similar sites, although are towards the lower (conservative) end. For example Clough et al. (1997)
reported aboveground biomass accumulation of 6.6 t C ha-1 yr-1 in a 22 year old Rhizophora apiculata forest in Malaysia, whilst Ong et al. (1995) report an above-ground biomass increment of 24 t ha-1 yr-1 in a 20 year old plantation.
7.1.2 Activity area 2. Rhizophora plantations
These areas are plantations without any current protection. Although small in area (and therefore contributing little to the overall carbon credit claimed in this technical
specification) they are of scientific and ecological value and we include them in order to provide protection and prevent on-going incursions. They are more productive
than mature forest; after 12 years their aboveground biomass accumulation (averaged over 12 years) was 4.4 t C ha –1 yr-1 (Kairo et al., 2008). Since total accumulation will be relatively small in the first five years, and given that the plantations are now three years older, assuming a total of 4.5 t C ha –1 yr-1 as for the
natural forest is therefore conservative. Prescribed thinning is conducted in the
plantation every 5.0 yrs to remove newly recruited samplings as well as to space the trees.
Mikoko Pamoja Technical Specification Carbon Benefits
24
7.1.3 Activity area 3. Sonneratia plantation on the open beach
This area is exposed to wave energy and shifting sand. We are experienced at
planting in such conditions but expect mortality of ~40% (Kirui et al., 2008). We propose planting 5000 trees yr-1 over an area of 0.4 ha. Hence over 20 years there will be 8 ha planted in total. Following the calculations for activity area 1 (and noting
that this is conservative given higher productivity for new forests) we assume that these trees will reach a productivity of 4.5 t C ha –1 yr-1 once they are 12 years old
(increasing in increments of 0.4 over twelve years and then stabilising). Cumulative carbon captured over twenty years, based on these growth assumptions and an extra 0.4 ha planted per year, gives a mean of 11.1 t C yr-1 captured (see Appendix
2). As the plantation will serve a protective function, no cutting is prescribed. 7.2 Expected change in belowground carbon stocks with project activities
Mangroves allocate a relatively large proportion of their total carbon budget to root production (Tamooh et al., 2008). High root: shoot ratios may reflect unstable
substrates or water stress related to hyper salinity; for example, Saintilan (1997) reported ratios as high as 4:1 in high tidal high salinity areas. Although such figures
are extreme, many estimates (including some taken from the current project area) show root: shoot ratios in excess of 0.3 (Tamooh et al., 2008). There is very little scientific information on root productivity (as opposed to root mass) in mangroves,
but we assume that the ratio of belowground productivity: aboveground productivity must relate to the ratio of belowground biomass: aboveground biomass. In this project we will assume a root production: shoot production ratio of 0.15. Given the
much higher root:shoot biomass ratios reported in the literature (and recorded from the project area) this represents a highly conservative assumption. Hence new belowground carbon stocks in all of the activity areas are calculated as 0.15 times the aboveground productivity.
7.3 Crediting period
Plan Vivo certificates (carbon credits) will be claimed for a 20 year period. This is equivalent to the period of maximum growth for new forests and will allow the
gradual planting of 8 ha of plantation. It will also allow substantial funds (and therefore community benefits) to flow to the communities. The current phase of
community restoration and research activities at the site, involving key members of the proposal team, began 18 years ago, hence a time span of 20 years is not over-ambitious based on current experience. 7.4 Carbon risk buffer
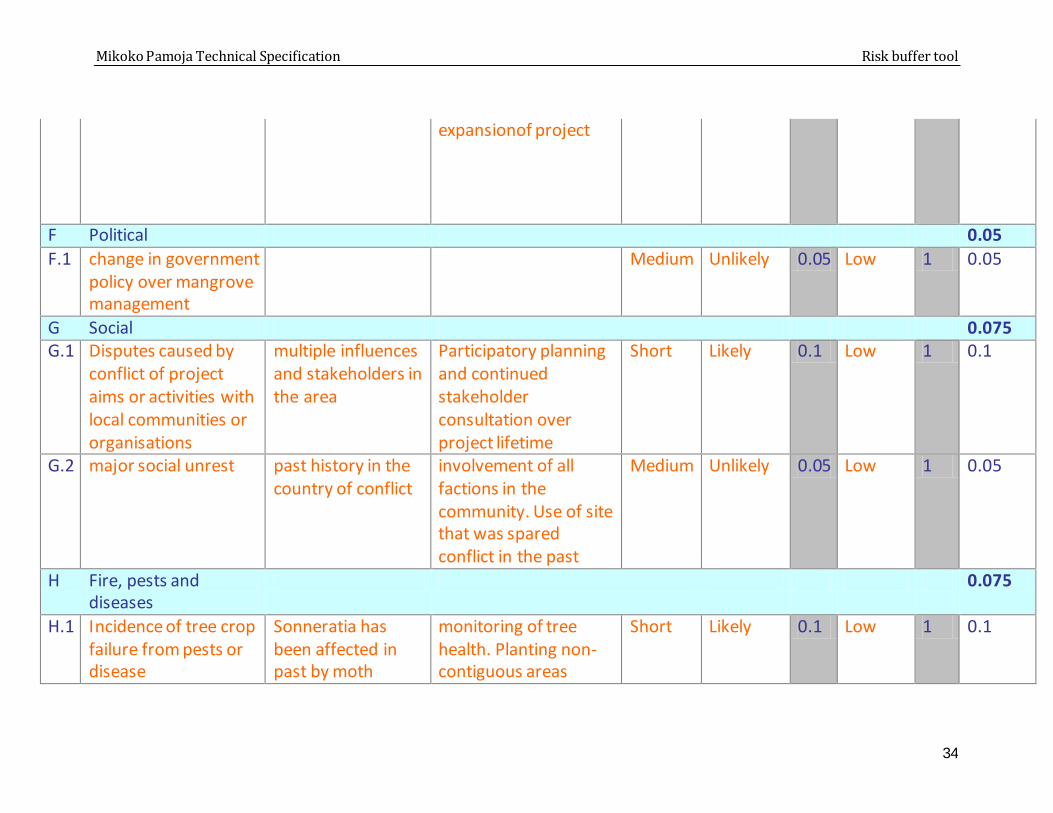
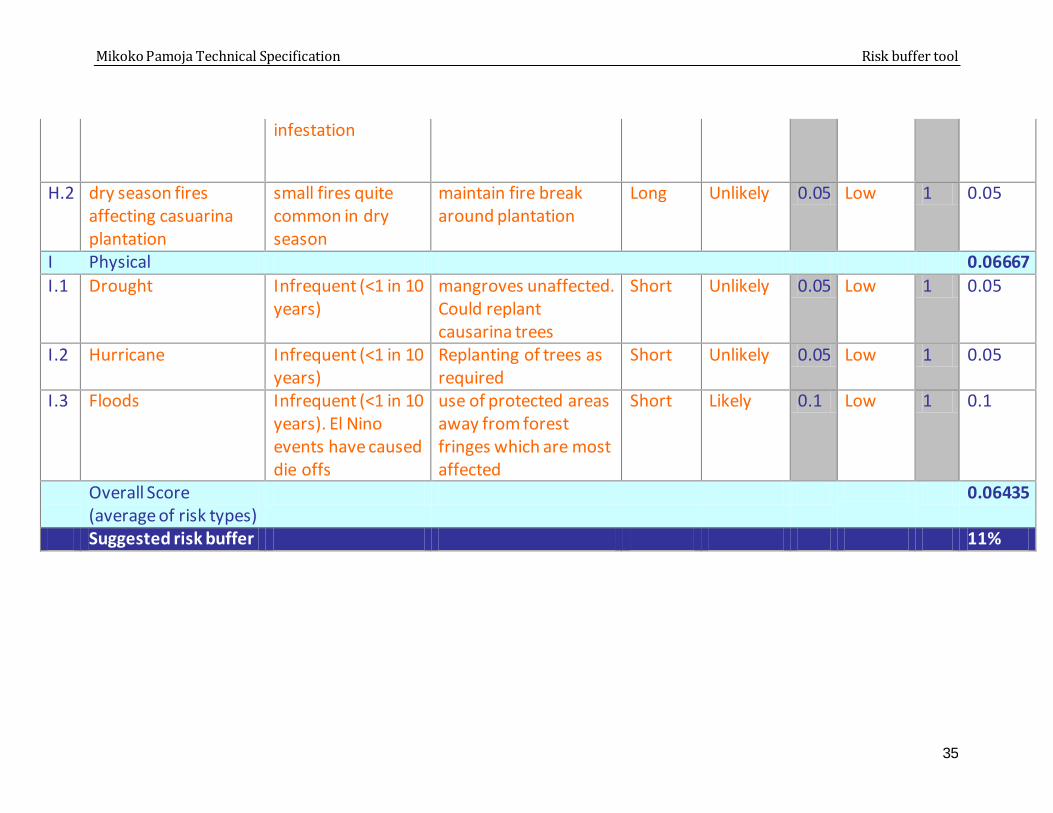
A carbon risk buffer is a proportion of carbon that is kept aside and not sold as Plan
Vivo Certificates. Output from the Bioclimate Risk tool (Bioclimate 2010) suggests an appropriate risk
buffer of 11% (the full table is in Appendix 1). The risks and mitigation strategies

Mikoko Pamoja Technical Specification Carbon Benefits
25
outlined qualitatively above concur in suggesting low levels of risk. As a conservative assumption we will apply a risk buffer of 15% .

Mikoko Pamoja Technical Specification Carbon Benefits
26
8. Summaries of Key Variables and Saleable Carbon The without-project (baseline) scenario assumes an annual 0.28% loss of forest in
areas 1 (Rhizophora mucronata forest) and 2 (Rhizophora mucronata plantations).
The with-project scenario includes above and below-ground sequestration in areas 1 (Rhizophora mucronata forest), 2 (Rhizophora mucronata plantations), and 3 (Sonneratia alba plantation).
The total benefit is the difference at 20 years between with-project and without-
project (baseline) lines, consisting of new carbon (A) and avoided loss (B).
Figure 6. Summary of carbon benefits with and without project.
25000
27000
29000
31000
33000
35000
37000
39000
41000
0 5 10 15 20
Years
To
nn
es C
with project
without project
initial
AB
13754
tonnes
total C
benefit
Mikoko Pamoja Technical Specification Carbon Benefits
27
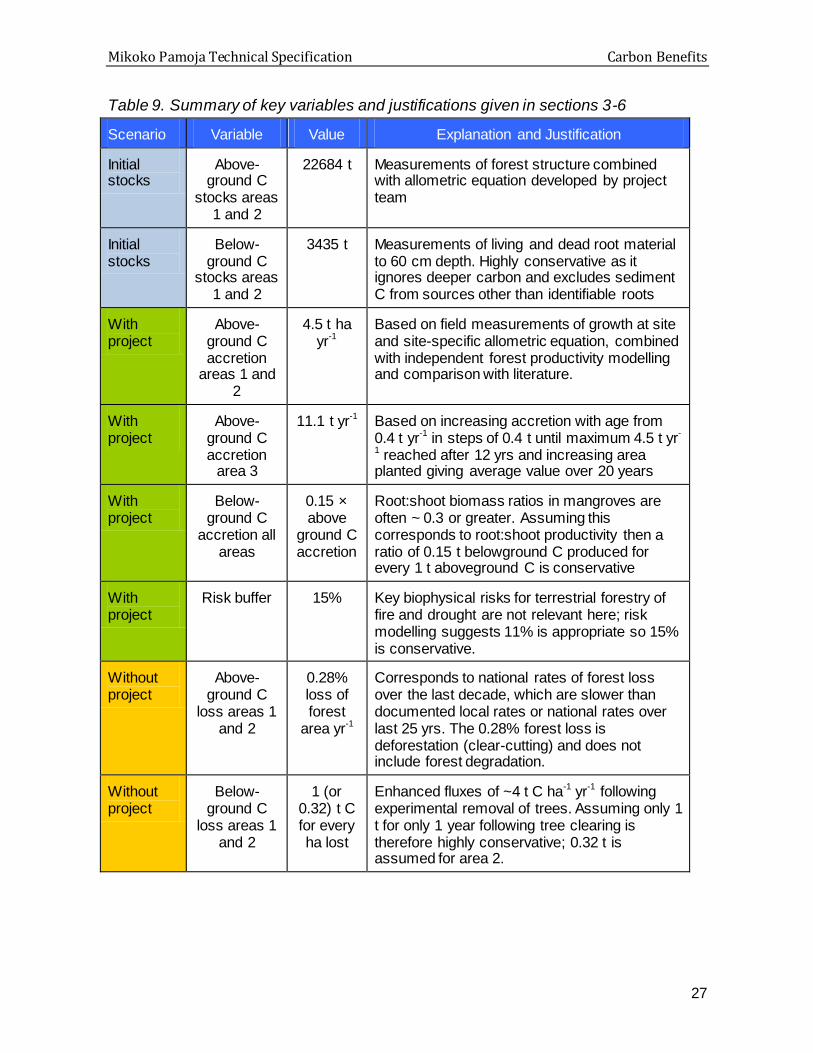
Table 9. Summary of key variables and justifications given in sections 3-6
Scenario Variable Value Explanation and Justification
Initial stocks
Above-ground C
stocks areas 1 and 2
22684 t Measurements of forest structure combined with allometric equation developed by project team
Initial stocks
Below-ground C
stocks areas 1 and 2
3435 t Measurements of living and dead root material to 60 cm depth. Highly conservative as it ignores deeper carbon and excludes sediment C from sources other than identifiable roots
With project
Above-ground C accretion
areas 1 and 2
4.5 t ha yr-1
Based on field measurements of growth at site and site-specific allometric equation, combined with independent forest productivity modelling and comparison with literature.
With project
Above-ground C accretion
area 3
11.1 t yr-1 Based on increasing accretion with age from 0.4 t yr
-1 in steps of 0.4 t until maximum 4.5 t yr
-
1 reached after 12 yrs and increasing area planted giving average value over 20 years
With project
Below-ground C
accretion all areas
0.15 × above
ground C accretion
Root:shoot biomass ratios in mangroves are often ~ 0.3 or greater. Assuming this corresponds to root:shoot productivity then a ratio of 0.15 t belowground C produced for every 1 t aboveground C is conservative
With project
Risk buffer 15% Key biophysical risks for terrestrial forestry of fire and drought are not relevant here; risk modelling suggests 11% is appropriate so 15% is conservative.
Without project
Above-ground C
loss areas 1 and 2
0.28% loss of forest
area yr-1
Corresponds to national rates of forest loss over the last decade, which are slower than documented local rates or national rates over last 25 yrs. The 0.28% forest loss is deforestation (clear-cutting) and does not include forest degradation.
Without project
Below-ground C
loss areas 1 and 2
1 (or 0.32) t C for every ha lost
Enhanced fluxes of ~4 t C ha-1 yr
-1 following
experimental removal of trees. Assuming only 1 t for only 1 year following tree clearing is therefore highly conservative; 0.32 t is assumed for area 2.
Mikoko Pamoja Technical Specification Carbon Benefits
28
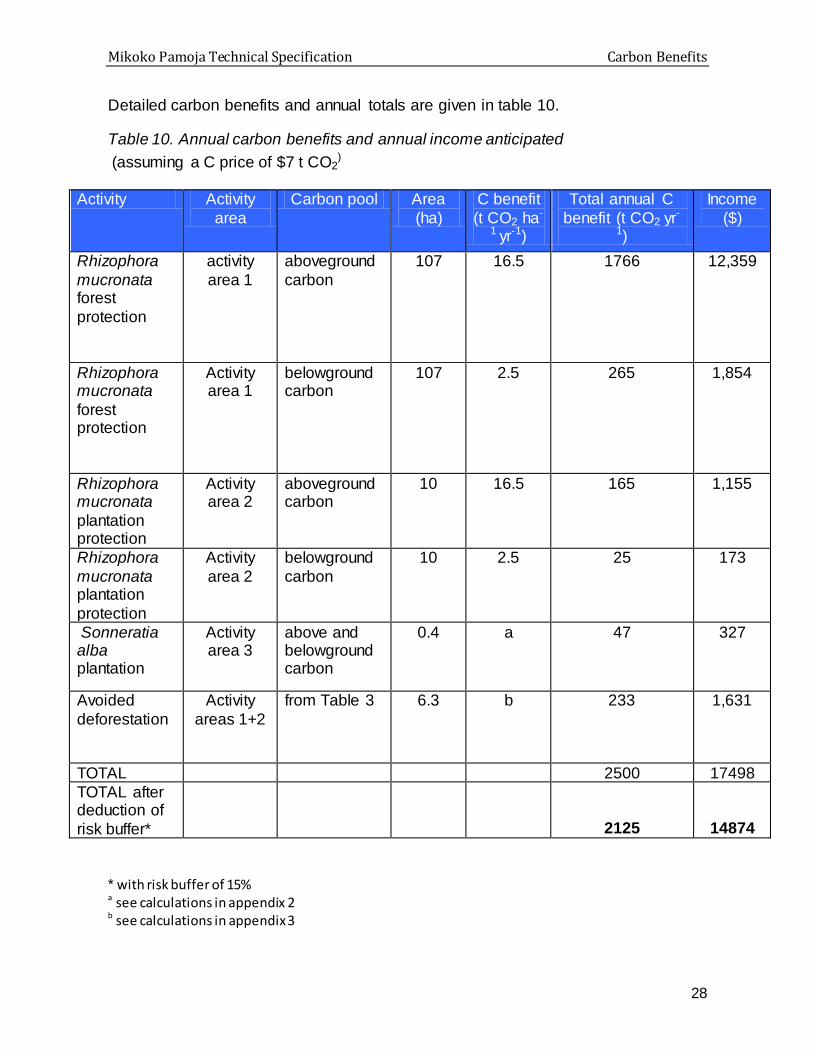
Detailed carbon benefits and annual totals are given in table 10.
Table 10. Annual carbon benefits and annual income anticipated
(assuming a C price of $7 t CO2)
Activity Activity
area
Carbon pool Area
(ha)
C benefit
(t CO2 ha-
1 yr-1)
Total annual C
benefit (t CO2 yr-
1)
Income
($)
Rhizophora
mucronata forest
protection
activity
area 1
aboveground
carbon
107 16.5 1766 12,359
Rhizophora mucronata
forest protection
Activity area 1
belowground carbon
107 2.5 265 1,854
Rhizophora mucronata
plantation protection
Activity area 2
aboveground carbon
10 16.5 165 1,155
Rhizophora
mucronata plantation
protection
Activity
area 2
belowground
carbon
10 2.5 25 173
Sonneratia alba plantation
Activity area 3
above and belowground carbon
0.4 a 47 327
Avoided
deforestation
Activity
areas 1+2
from Table 3 6.3 b 233 1,631
TOTAL 2500 17498
TOTAL after deduction of
risk buffer*
2125 14874
* with risk buffer of 15% a see calculations in appendix 2 b see calculations in appendix 3
Mikoko Pamoja Technical Specification Monitoring and PES
29
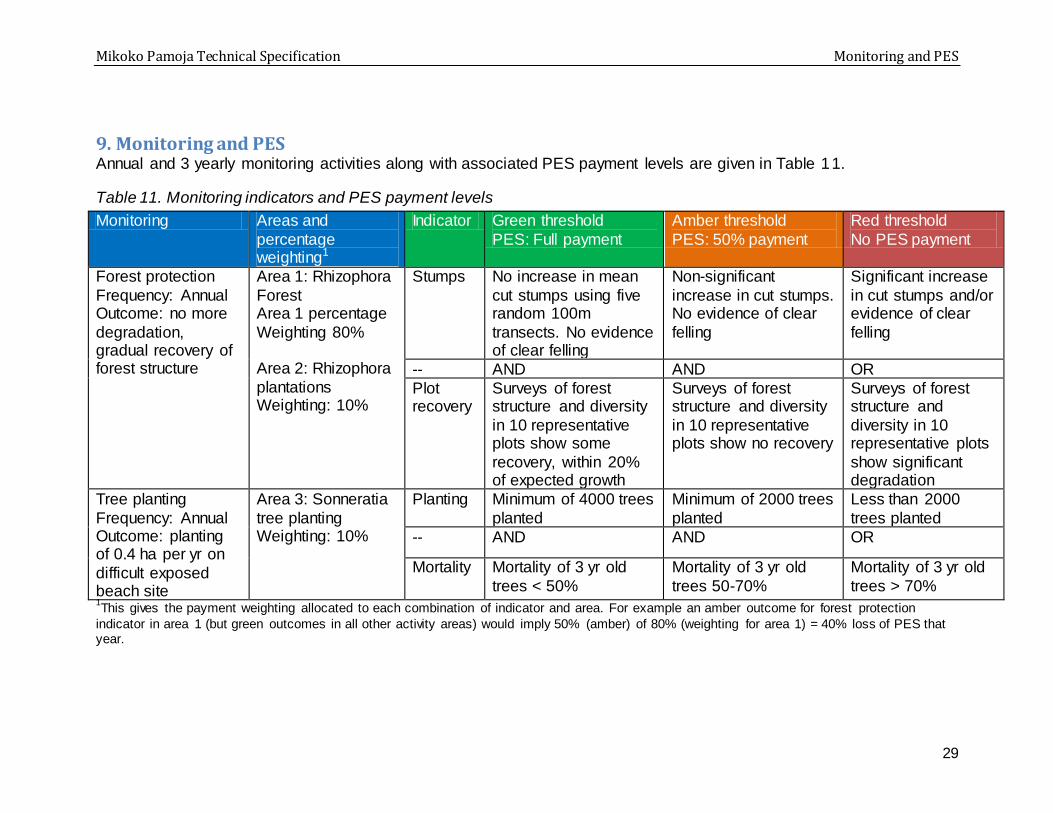
9. Monitoring and PES Annual and 3 yearly monitoring activities along with associated PES payment levels are given in Table 11.
Table 11. Monitoring indicators and PES payment levels
Monitoring Areas and
percentage weighting1
Indicator Green threshold
PES: Full payment
Amber threshold
PES: 50% payment
Red threshold
No PES payment
Forest protection
Frequency: Annual Outcome: no more
degradation, gradual recovery of forest structure
Area 1: Rhizophora
Forest Area 1 percentage
Weighting 80% Area 2: Rhizophora
plantations Weighting: 10%
Stumps No increase in mean
cut stumps using five random 100m
transects. No evidence of clear felling
Non-significant
increase in cut stumps. No evidence of clear
felling
Significant increase
in cut stumps and/or evidence of clear
felling
-- AND AND OR
Plot recovery
Surveys of forest structure and diversity
in 10 representative plots show some
recovery, within 20% of expected growth
Surveys of forest structure and diversity
in 10 representative plots show no recovery
Surveys of forest structure and
diversity in 10 representative plots
show significant degradation
Tree planting
Frequency: Annual Outcome: planting of 0.4 ha per yr on
difficult exposed beach site
Area 3: Sonneratia
tree planting Weighting: 10%
Planting Minimum of 4000 trees
planted
Minimum of 2000 trees
planted
Less than 2000
trees planted
-- AND AND OR
Mortality Mortality of 3 yr old
trees < 50%
Mortality of 3 yr old
trees 50-70%
Mortality of 3 yr old
trees > 70% 1This gives the payment weighting allocated to each combination of indicator and area. For example an amber outcome for forest protection
indicator in area 1 (but green outcomes in all other activity areas) would imply 50% (amber) of 80% (weighting for area 1) = 40% loss of PES that year.
Mikoko Pamoja Technical Specification Risk buffer tool
30
10. References Balmford, A., Bruner, A., Cooper, P., Constanza, R.,Farber, S., Green, R., Jenkins, M., Jefferiss, P.,Jessamy, V., Madden, J., Munro, K., Myers, N., Naeem, S., Paavola, J., Rayment, M., Rosendo, S., Roughgarden, J., Trumper, K. and Turner, R. 2002. Economic reasons for conserving wild nature. Science, 297, 950-953.
BioClimate 2010. Managing risks for non-sustainability, version 1, a method to identify risks of non-sustainability, mitigation measures, and overall risk of non-sustainability. BioClimate Research and Development Limited, April 2010.
Blumowski, T. 2011. Modelling productivity of mangroves in Kenya. Honours dissertation, Edinburgh Napier University.
Bosire, J. O., Dahdouh-Guebas, F., Kairo J. G. and Koedam, N. 2003. Colonization of non-planted mangrove species into restored mangrove stands in Gazi bay, Kenya. Aquatic Botany 76, 267-279.
Clough, B.F., Ong, J.E., and Gong, W.K. 1997. Estimating leaf area index and photosynthetic production in canopies of the mangrove Rhizophora apiculata. Marine Ecology Progress Series 159, 285-292.
Dahdouh-Guebas, F., Van Pottelbergh, I., Kairo, J. G., Cannicci, S. and Koedam, N. 2004. Human-impacted mangroves in Gazi (Kenya): predicting future vegetation based on retrospective remote sensing, social surveys, and distribution of trees. Marine Ecology Progress Series, 272, 77-92.
Donato, D.C., Kauffman, J.B., Murdiyarso, D., Kurnianto, S., Stidham, M. and Kanninen, M. 2011. Mangroves among the most carbon-rich forests in the tropics. Nature Geoscience. DOI:10.1038/NGEO1123
Huxham, M., Kumara, M. P., Jayatissa, L.P., Krauss, K.W., Kairo, J., Langat, J., Mencuccini, M., Skov, M.W. and Kirui, B. 2010. Intra and inter- specific facilitation in mangroves may increase resilience to climate change threats. Philosophical Transactions of the Royal Society B 365, 2127-2135.
Kairo, J.G., Lang'at,J.K, Dahdouh-Guebas, F., Bosire, J., Karachi, M. 2008. Structural development and productivity of replanted mangrove plantations in Kenya. Forest Ecology and Management, 255, 2670-2677
Kairo, J. G., Dahdouh-Guebas, F., Bosire J. and Koedam, N. 2001. Restoration and management of mangrove systems – A lesson for and from the East African region. South African Journal of Botany 67, 383-389.
Kairo, J. G., 1995. Community participatory forestry for rehabilitation of deforested mangrove areas of gazi bay (Kenya). A first approach. Final technical report. WWF-US and University of Nairobi.
Kirui, B., Huxham, M., Kairo, J. and Skov, M. 2008. Influence of species richness and environmental context on early survival of replanted mangroves at Gazi bay, Kenya. Hydrobiologia 603, 171–181.
Luo, Z., Sun, O.J., Wang, E., Ren, H. and Xu, H. 2010. Modeling Productivity in Mangrove Forests as Impacted by Effective Soil Water Availability and Its Sensitivity to Climate Change Using Biome-BGC. Ecosystems 13, 949–965.

Mikoko Pamoja Technical Specification Risk buffer tool
31
Ong, J., Gong,W., Clough, B.F., 1995. Structure and productivity of a 20-year old stand of Rhizophora apiculata Bl. mangrove forest. J. Biogeography 22,417–424.
Putz, F. E. and Chan, H. T. (1986) Tree growth, dynamics, and productivity in a mature mangrove forest in Malaysia. Forest Ecology and Management 17, 211-230.
Saintilan, N. 1997. Above- and below-ground biomass of mangroves in a sub-tropical estuary. Marine and Freshwater Research 48, 601-604.
Slim, F. J., Gwada, P., Kodjo, M., Hemminga, M. A. 1996. Biomass and litterfall of Ceriops and Rhizophora in the Mangrove forests of Gazi bay, Kenya. Marine and Freshwater Resources 47, 999-1007.
Tamooh, F, Huxham, M., Karachi, M., Mencuccini, M., Kairo, J.G. and Kirui, B. 2008. Below-ground root yield and distribution in natural and replanted mangrove forests at Gazi bay, Kenya. Forest Ecology and Management 256, 1290-1297.
Valiela, I., Bowen, J.L. and York, J.K. 2001. Mangrove forests: one of the world's threatened major tropical environments. BioScience 51, 807

Mikoko Pamoja Technical Specification Risk buffer tool
32
Appendix 1 – BioClimate Risk Buffer Calculation Tool
Managing risks of non-
sustainability
BioClimate Research and Development
Version 2
08/04/2010
User inputs
Risk type Situation Action Time-scale
Will it happen?
Severity Score
A Land ownership / tenure
0.075
A.1 Land tenure changed or disputed
using community trust land
ensure KFS agreement Long Unlikely 0.05 Low 1 0.05
A.3 conflicting land-use interests
others might want to use the plantation sites
ensure community agreement and involvement
Medium Likely 0.1 Low 1 0.1
B Financial 0.075
B.1 Project financial plan over-optimistic
unable to meet community expectations
Be careful to communicate uncertainties. Secure more funding
Short Unlikely 0.05 Low 1 0.05
B.2 Carbon price drops drastically
as above as above Short Likely 0.1 Low 1 0.1
C Technical 0.05

Mikoko Pamoja Technical Specification Risk buffer tool
33
C.1 Insufficient technical capacity to monitor targets
Technical competence
Training of staff Short Unlikely 0.05 Low 1 0.05
D Management 0.0625
D.1 Ineffective management
reliant on management at a distance
Project managers and staff adequately trained, kenyan managers on site
Short Unlikely 0.05 Low 1 0.05
D.2 Poor record keeping Robust proceedures and keen oversight, record keeping part of job description
Short Unlikely 0.05 Low 1 0.05
D.3 Staff with relevant skills and expertise
Careful selection of project staff and training
Short Unlikely 0.05 Low 1 0.05
D.4 Tree damage from browsing
cattle roaming in area
maintain fence around Casuarina plantation and be vigilant for goat grazing at beach
Short Likely 0.1 Low 1 0.1
E Opportunity costs 0.05
E.1 Returns to community and stakeholder
alternative opportunities become available
Development of business plans (reviewed periodically) for economically viable management, and
Medium Unlikely 0.05 Low 1 0.05
Mikoko Pamoja Technical Specification Risk buffer tool
34
expansionof project
F Political 0.05
F.1 change in government policy over mangrove management
Medium Unlikely 0.05 Low 1 0.05
G Social 0.075
G.1 Disputes caused by conflict of project aims or activities with local communities or organisations
multiple influences and stakeholders in the area
Participatory planning and continued stakeholder consultation over project lifetime
Short Likely 0.1 Low 1 0.1
G.2 major social unrest past history in the country of conflict
involvement of all factions in the community. Use of site that was spared conflict in the past
Medium Unlikely 0.05 Low 1 0.05
H Fire, pests and diseases
0.075
H.1 Incidence of tree crop failure from pests or disease
Sonneratia has been affected in past by moth
monitoring of tree health. Planting non-contiguous areas
Short Likely 0.1 Low 1 0.1
Mikoko Pamoja Technical Specification Risk buffer tool
35
infestation
H.2 dry season fires affecting casuarina plantation
small fires quite common in dry season
maintain fire break around plantation
Long Unlikely 0.05 Low 1 0.05
I Physical 0.06667
I.1 Drought Infrequent (<1 in 10 years)
mangroves unaffected. Could replant causarina trees
Short Unlikely 0.05 Low 1 0.05
I.2 Hurricane Infrequent (<1 in 10 years)
Replanting of trees as required
Short Unlikely 0.05 Low 1 0.05
I.3 Floods Infrequent (<1 in 10 years). El Nino events have caused die offs
use of protected areas away from forest fringes which are most affected
Short Likely 0.1 Low 1 0.1
Overall Score (average of risk types)
0.06435
Suggested risk buffer 11%

Mikoko Pamoja Technical Specification Area 3 (beach plantation)
36
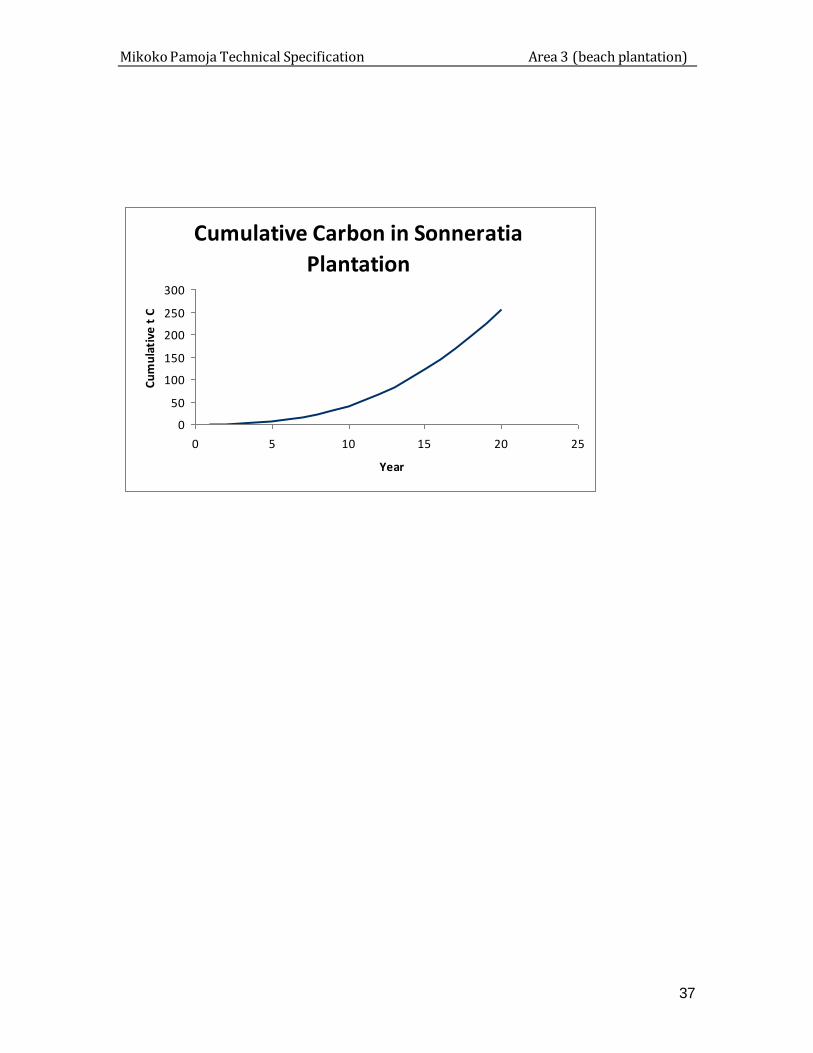
Appendix 2 – calculations for Sonneratia plantation Cumulative area planted (ha)
Year Total aboveground C that year
Total belowground C that year
Total C that year
Cumulative Total
8 20 26.76 4.014 30.774 255.07
7.6 19 24.96 3.744 28.704 224.296
7.2 18 23.16 3.474 26.634 195.592
6.8 17 21.36 3.204 24.564 168.958
6.4 16 19.56 2.934 22.494 144.394
6 15 17.76 2.664 20.424 121.9
5.6 14 15.96 2.394 18.354 101.476
5.2 13 14.16 2.124 16.284 83.122
4.8 12 12.36 1.854 14.214 66.838
4.4 11 10.56 1.584 12.144 52.624
4 10 8.8 1.32 10.12 40.48
3.6 9 7.2 1.08 8.28 30.36
3.2 8 5.76 0.864 6.624 22.08
2.8 7 4.48 0.672 5.152 15.456
2.4 6 3.36 0.504 3.864 10.304
2 5 2.4 0.36 2.76 6.44
1.6 4 1.6 0.24 1.84 3.68
1.2 3 0.96 0.144 1.104 1.84
0.8 2 0.48 0.072 0.552 0.736
0.4 1 0.16 0.024 0.184 0.184
SUMMARY FIGURES
aboveground belowground totals
cumulative totals
221.8 33.27 255.07
average C over 20yr 11.09 1.66 12.75
average CO2 20yrs 40.67 6.10 46.77
See the figure below for these data displayed graphically
Mikoko Pamoja Technical Specification Area 3 (beach plantation)
37
Cumulative Carbon in Sonneratia
Plantation
0
50
100
150
200
250
300
0 5 10 15 20 25
Year
Cu
mu
lati
ve t
C
Mikoko Pamoja Technical Specification Area 3 (beach plantation)
38
Appendix 3. Below ground C losses Appendix 3. Below ground C losses
Rhizophora forest (area 1)
Year Area (ha)
total lost area lost that year t belowground C lost that year
Cumulative emissions
1 106.7 0.3 0.3 0.3 0.3
2 106.4 0.6 0.3 0.3 0.6
3 106.1 0.9 0.3 0.3 0.9
4 105.8 1.2 0.3 0.3 1.2
5 105.5 1.5 0.3 0.3 1.5
6 105.2 1.8 0.3 0.3 1.8
7 104.9 2.1 0.3 0.3 2.1
8 104.6 2.4 0.3 0.3 2.4
9 104.3 2.7 0.3 0.3 2.7
10 104.0 3.0 0.3 0.3 3.0
11 103.8 3.2 0.3 0.3 3.2
12 103.5 3.5 0.3 0.3 3.5
13 103.2 3.8 0.3 0.3 3.8
14 102.9 4.1 0.3 0.3 4.1
15 102.6 4.4 0.3 0.3 4.4
16 102.3 4.7 0.3 0.3 4.7
17 102.0 5.0 0.3 0.3 5.0
18 101.7 5.3 0.3 0.3 5.3
19 101.4 5.6 0.3 0.3 5.6
20 101.2 5.8 0.3 0.3 5.8
Rhizophora plantations (area 2)
Year Area (ha)
total lost area lost that year t belowground C lost that year
Cumulative emissions
0 10.0 0.00
1 10.0 0.03 0.03 0.01 0.01
2 9.9 0.06 0.03 0.01 0.02
3 9.9 0.08 0.03 0.01 0.03
4 9.9 0.11 0.03 0.01 0.04
5 9.9 0.14 0.03 0.01 0.04
6 9.8 0.17 0.03 0.01 0.05
7 9.8 0.19 0.03 0.01 0.06
8 9.8 0.22 0.03 0.01 0.07
9 9.8 0.25 0.03 0.01 0.08
10 9.7 0.28 0.03 0.01 0.09
11 9.7 0.30 0.03 0.01 0.10
12 9.7 0.33 0.03 0.01 0.11
13 9.6 0.36 0.03 0.01 0.11
14 9.6 0.38 0.03 0.01 0.12
15 9.6 0.41 0.03 0.01 0.13
16 9.6 0.44 0.03 0.01 0.14
17 9.5 0.47 0.03 0.01 0.15
18 9.5 0.49 0.03 0.01 0.16
19 9.5 0.52 0.03 0.01 0.17
20 9.5 0.55 0.03 0.01 0.17
Mikoko Pamoja Technical Specification Area 3 (beach plantation)
39
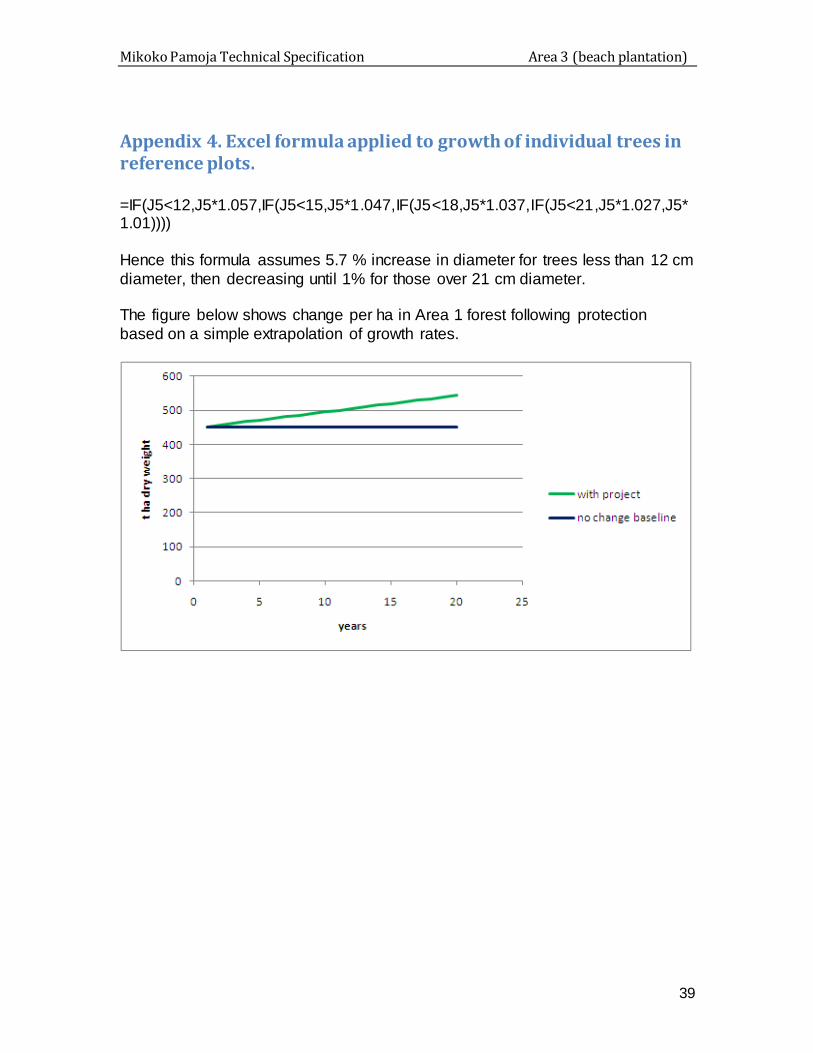
Appendix 4. Excel formula applied to growth of individual trees in reference plots. =IF(J5<12,J5*1.057,IF(J5<15,J5*1.047,IF(J5<18,J5*1.037,IF(J5<21,J5*1.027,J5*1.01))))
Hence this formula assumes 5.7 % increase in diameter for trees less than 12 cm
diameter, then decreasing until 1% for those over 21 cm diameter. The figure below shows change per ha in Area 1 forest following protection
based on a simple extrapolation of growth rates.