suggested solutions - ca sri lanka · suggested solutions ... 1.3.2 demonstrate the importance of...
TRANSCRIPT

SUGGESTED SOLUTIONS
KB2– Business Management Accounting
June 2015
All Rights Reserved

Suggested Solutions (KC2), June 2015 Page 2 of 17
SECTION 1 Answer 01
Relevant Learning Outcome/s: 1.1.1, 1.1.3 1.1.1 Assess the key features of the absorption costing method and ABC method. 1.1.3 Evaluate product profitability and customer profitability decision using information generated from
absorption costing and activity based costing.
Customer
AH LW Company
Contribution (Rs. '000) 1,500 810 9,000
Packs sold ('000) 50 27 300
Sales visits to customers 24 12 200
Orders placed by customers 75 20 700
Normal deliveries to customers 45 15 240
Urgent deliveries to customers 5 - 30
Activity costs Rs. '000
Sales visits to customers 1,000
Processing orders 1,400
Normal deliveries 2,400
Urgent deliveries 1,200
(a)
Activity (Cost driver) Cost
Cost
drivers Cost per cost
driver
Rs. '000 Rs.
Sales visits to customers (Sales visits) 1,000 200 5,000
Processing orders (Orders processed) 1,400 700 2,000
Normal deliveries to customers (Normal deliveries) 2,400 240 10,000
Urgent deliveries to customers (Urgent deliveries) 1,200 30 40,000

Suggested Solutions (KC2), June 2015 Page 3 of 17
Customer Profitability AH LW
Rs. '000 Rs. '000
Contribution 1,500 810
Customer costs:
Sales visits 120 60
Processing orders 150 40
Normal deliveries 450 150
Urgent deliveries 200 -
920 250
Customer Profit 580 560
(b) Improving Profitability
Persuade customers to increase order quantities (even by offering discounts after a cost benefit analysis) and thereby reduce the number of orders which will reduce the order processing cost.
Curtail sales visits by improving efficiency of delivery scheduling, attempting to merge deliveries to same customers and combining deliveries to different customers, which will reduce costs of sales visits and delivery costs.
Charge additional delivery cost to the customers on urgent deliveries: either cost will be recovered or urgent deliveries will reduce due to the disincentive.

Suggested Solutions (KC2), June 2015 Page 4 of 17
Answer 02
Relevant Learning Outcome/s: 1.3.2, 1.3.3 1.3.2 Demonstrate the importance of the following concepts for cost accounting and decision making: - Kaizen costing - Quality- related costing (TQM) - Manufacturing/ Enterprise resource planning (MRP and ERP) 1.3.3 Assess environmental accounting (including its importance, types of costs and techniques available).
(a) Costs of quality conformance are the costs incurred by an organisation in attempting to ensure
that its quality standards are complied with before the product or service is completed. In other words, it refers to the total cost of achieving specified quality standards.
In contrast, costs of quality non-conformance are costs that occur as a result of quality failures.
This could be broadly twofold: (i) internal failure costs - which arise because the failure requires the product / service to be
re-worked. (ii) external failure costs - which arise because of the damage the failure causes to the
business as a result of supplying a poor quality item to a customer. (b) SHL is operating in a market where consumers consider price and quality as the main factors when
making the buying decision. This is not unusual but highlights the need for SHL to understand the profile of its customers. i.e. to what extent they are prepared to pay for high quality. SHL should understand that there is a trade-off between price and quality.
The more that SHL spends on developing a quality product, the greater will be its costs and hence
its product selling price will need to reflect this additional cost in order for SHL to be profitable. SHL will need to decide whether to follow a low price, low quality strategy or a high price, high
quality strategy, or to follow a strategy that lies somewhere between these two extremes. (c) Kaizen principles encourage gradual and continuous improvement by making small changes in the
product or the method of operations.
SHL operates in a market where products have comparatively a short life cycle. If this life cycle could be extended then this would result in greater profitability for SHL. Kaizen principles could achieve this by gradually improving product quality without any increase in price for example by making small changes to the components being used in its products.
Suggested Solutions (KC2), June 2015 Page 5 of 17
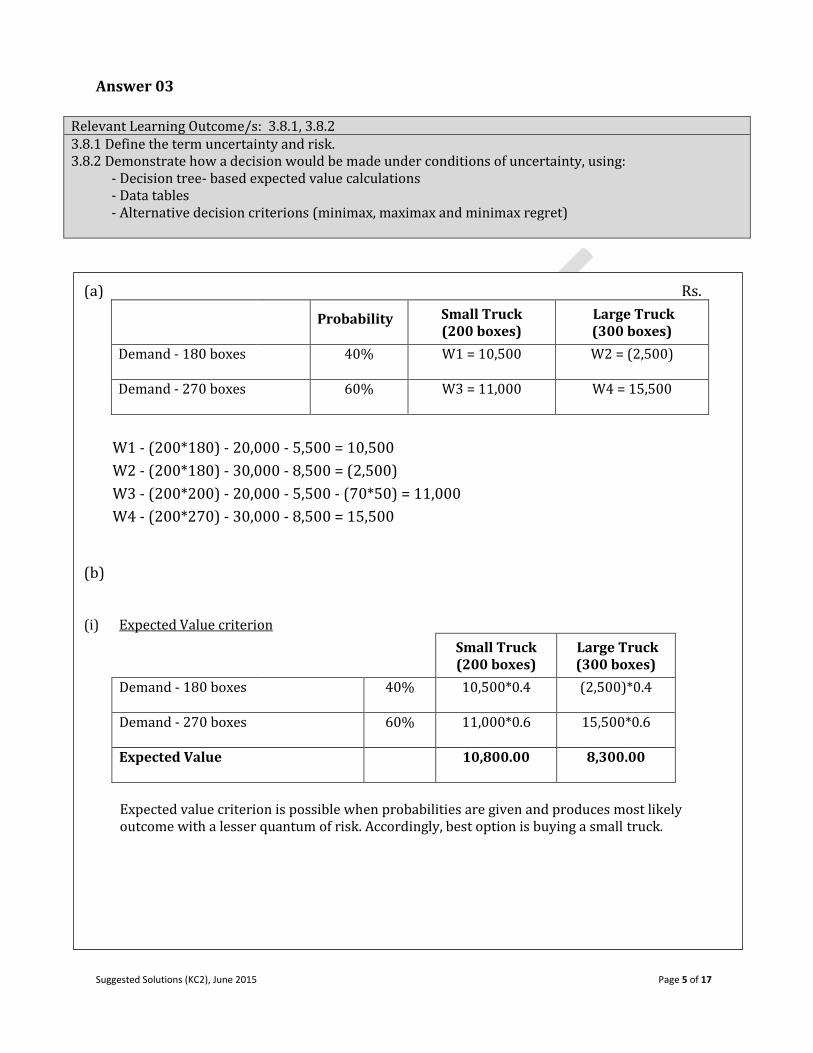
Answer 03
Relevant Learning Outcome/s: 3.8.1, 3.8.2 3.8.1 Define the term uncertainty and risk. 3.8.2 Demonstrate how a decision would be made under conditions of uncertainty, using:
- Decision tree- based expected value calculations - Data tables - Alternative decision criterions (minimax, maximax and minimax regret)
(a) Rs.
Probability
Small Truck (200 boxes)
Large Truck (300 boxes)
Demand - 180 boxes
40%
W1 = 10,500
W2 = (2,500)
Demand - 270 boxes
60%
W3 = 11,000
W4 = 15,500
W1 - (200*180) - 20,000 - 5,500 = 10,500
W2 - (200*180) - 30,000 - 8,500 = (2,500)
W3 - (200*200) - 20,000 - 5,500 - (70*50) = 11,000
W4 - (200*270) - 30,000 - 8,500 = 15,500
(b)
(i) Expected Value criterion
Small Truck (200 boxes)
Large Truck (300 boxes)
Demand - 180 boxes
40%
10,500*0.4
(2,500)*0.4
Demand - 270 boxes
60%
11,000*0.6
15,500*0.6
Expected Value
10,800.00
8,300.00
Expected value criterion is possible when probabilities are given and produces most likely outcome with a lesser quantum of risk. Accordingly, best option is buying a small truck.

Suggested Solutions (KC2), June 2015 Page 6 of 17
(ii) Maximax decision criterion
If the management is optimistic (risk taking attitude) then the management would choose maximax decision rule which selects the maximum of highest return;
ST LT
Highest return (Rs) 11000 15500
Large truck should be bought since it gives the highest return.
(iii) Maximin decision criterion
If the management is pessimistic (risk avoiding attitude) then the management would choose maximum of minimum return. Selection of best worst-case scenario.
ST LT
Lowest return (Rs) 10500 (2,500)
Small truck should be bought since it gives the highest return from the lowest return.

Suggested Solutions (KC2), June 2015 Page 7 of 17
Answer 04
Relevant Learning Outcome/s: 4.2.1 4.2.1 Discuss different types of transfer pricing possible under decentralized organizational structure
(including maximum and minimum price, cost based pricing, market based pricing, dual pricing and negotiated pricing).
(a) Calculation of revised price per unit
Rs.
Variable cost (120/1.2) 100.00
Fixed cost ((300/60)*2)200% 20.00
Full cost 120.00
Profit margin (10%) 12.00
Proposed Transfer Price 132.00 per unit
(b) (i) Maximum transfer price - The lowest market price at which Division B could purchase the goods or services externally. Therefore the maximum price should be LKR 125.
(ii) The minimum transfer price should be the sum of the supplying division's marginal cost plus opportunity cost of the item transferred. The marginal cost of a LED bulb is LKR 100. Division B could sell any quantity of bulbs to the external market at LKR 125. Therefore The opportunity cost = The maximum contribution foregone by Division B if transferred at Rs. 100 (Rs. 125 less selling & distribution cost (Rs. 4) and less Rs. 100 = Rs 21)
Therefore the minimum transfer price stands at Rs.121 per bulb.
(iii) Any price between Rs. 121 and Rs. 125 is acceptable to both divisions.
Accordingly, EPL's current transfer pricing policy of Rs. 120 and the proposed policy of Rs. 132 are not the best transfer prices.
( c)
Dual rate transfer pricing sets two different prices for the transferring division and receiving division. Usually transferring division invoices at a higher price whereas the receiving division records these purchases at lower rate ideally marginal cost of the transferring division. This method motivate both divisions and enable them to achieve their profit targets. However, The company profit will be overstated due to duplication of profit and hence, a separate accounting entry should be passed to neutralise this overstatement of profit.

Suggested Solutions (KC2), June 2015 Page 8 of 17
Answer 05
Relevant Learning Outcome/s: 5.1.3, 5.1.4, 5.1.6 5.1.3 Discuss receivable and payable management (including credit policy, credit assessment, credit
control and collection and factoring option). 5.1.4 Discuss available options of inventory management. 5.1.6 Assess receivable management decisions such as cash discounts, age analysis, change in credit policy
including whether to factor or not.
(a) Annual demand = 100,000 + 110,000 + 190,000 + 140,000 = 540,000
Annual production capacity = 135,000 x 4 = 540,000
Therefore, the capacity is just sufficient to meet the demand and no overtime is required.
Current system - constant production
Quarter 1 2 3 4 Total
Opening inventory - 35,000 60,000 5,000
Production 135,000 135,000 135,000 135,000
Sales 100,000 110,000 190,000 140,000
Closing inventory 35,000 60,000 5,000 -
Average inventory 17,500 47,500 32,500 2,500
Storage cost (Rs) 70,000 190,000 130,000 10,000 400,000 (b) JIT production system
Quarter 1 2 3 4
Sales 100,000 110,000 190,000 140,000
Normal production 100,000 110,000 135,000 135,000
OT production - - 54,000 5,000
Lost sales - - 1,000 -
Rs
Incremental cost of OT working per unit
Labour: 20% x 35 7
Overhead: 10% x 10 1
8

Suggested Solutions (KC2), June 2015 Page 9 of 17
Q3 additional cost on OT production (54,000*8) 432,000
Q4 additional cost on OT production (5,000*8) 40,000
Q3 loss of contribution (1,000*15) 15,000
Total incremental cost due to JIT 487,000
Storage cost that can be saved 400,000
Net adverse impact on profit (87,000)
Changing to JIT will result in profits reducing by Rs. 87,000 for the year.
Therefore, change to JIT is not recommended.
Suggested Solutions (KC2), June 2015 Page 10 of 17
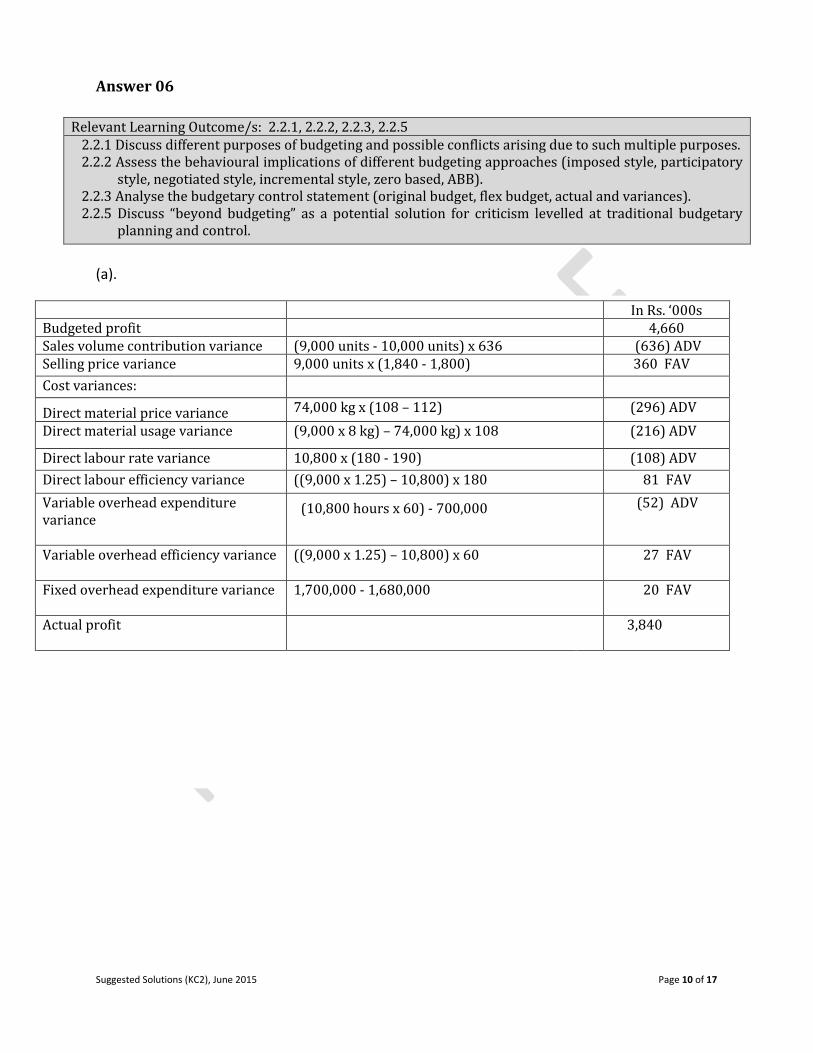
Answer 06
(a). lllll
Relevant Learning Outcome/s: 2.2.1, 2.2.2, 2.2.3, 2.2.5 2.2.1 Discuss different purposes of budgeting and possible conflicts arising due to such multiple purposes. 2.2.2 Assess the behavioural implications of different budgeting approaches (imposed style, participatory
style, negotiated style, incremental style, zero based, ABB). 2.2.3 Analyse the budgetary control statement (original budget, flex budget, actual and variances). 2.2.5 Discuss “beyond budgeting” as a potential solution for criticism levelled at traditional budgetary
planning and control.
In Rs. ‘000s Budgeted profit 4,660 Sales volume contribution variance (9,000 units - 10,000 units) x 636 (636) ADV Selling price variance 9,000 units x (1,840 - 1,800) 360 FAV
Cost variances:
Direct material price variance
74,000 kg x (108 – 112) (296) ADV
Direct material usage variance (9,000 x 8 kg) – 74,000 kg) x 108 (216) ADV
Direct labour rate variance 10,800 x (180 - 190) (108) ADV
Direct labour efficiency variance ((9,000 x 1.25) – 10,800) x 180 81 FAV
Variable overhead expenditure variance
(10,800 hours x 60) - 700,000
(52) ADV
Variable overhead efficiency variance
((9,000 x 1.25) – 10,800) x 60
27 FAV
Fixed overhead expenditure variance
1,700,000 - 1,680,000
20 FAV
Actual profit
3,840

Suggested Solutions (KC2), June 2015 Page 11 of 17
Workings
Budgeted Profit for the Period (10,000 units) Rs. '000
Sales @ 1,800 18,000
Direct Materials @ 864 (8,640)
Direct Labour @ 225 (2,250)
Variable Production Overheads @ 75 (750)
Contribution @ 636 6,360
Fixed Production Overheads 1,700
Budgeted Profit 4,660
Actual Profit for the Period (9,000 units) Rs. '000
Sales 9,000 units x 1,840 16,560
Direct Materials 74,000kg x 112 (8,288)
Direct Labour 10,800 hours x 190 (2,052)
Variable Production Overheads (700)
Contribution 5,520
Fixed Production Overheads (1,680)
Actual Profit 3,840

Suggested Solutions (KC2), June 2015 Page 12 of 17
(b) In a standard marginal costing variance statement the sales volume contribution variance is calculated using the standard contribution per unit. In a standard absorption costing variance statement, standard contribution is replaced by the standard profit per unit, which includes a fixed overhead absorption rate.
The difference in the variance is represented in the absorption costing variance statement by the fixed production overhead volume variance, which is calculated as the difference in actual and budgeted volume x the fixed overhead absorption rate. The fixed production overhead volume variance represents a part of the under absorbed fixed overhead as a result of producing a lower volume than budgeted.
(c) Sales volume profit
variance
(9,000 units - 10,000 units) x 466 = 466,000 Adv
It would also be necessary to include a fixed production overhead volume variance as follows:
Fixed production overhead volume variance (9,000 units – 10,000 units) x 170 = 170,000 Adv
(d) The arguments in favour of using absorption costing for profit reporting and inventory valuation:
(i) Fixed production overheads can be a large proportion of total production costs. It is therefore important that these costs are included in the measurement of product costs, as they have to be recovered to make a profit.
(ii) Absorption costing follows the matching concept by carrying forward a proportion of the fixed production overhead costs in the inventory valuation to be matched against the sales revenue generated when the items are sold.
(iii) It is necessary to include fixed production overheads in inventory valuations for financial
statements.
(iv) It has been argued that in the longer term, all costs are variable and it is appropriate to try to identify overhead costs with the products or services that cause them.

Suggested Solutions (KC2), June 2015 Page 13 of 17
Answer 07
Relevant Learning Outcome/s: 3.7.1, 3.7.2, 3.7.3 3.7.1 Explain the process of long- term decision-making (proposal generating, initial screening, analysis
and acceptance, and monitor and review). 3.7.2 Compute non- discounted cash flow methods ( payback/accounting rate of return and discounted
cash flow methods ( net present value/ internal rate of return/profitability index/ discounted payback) with:
- Inflation - Tax - Uncertainty ( use of probabilities and sensitivity analysis is expected) 3.7.3 Evaluate projects considering results derived from non-discounted cash flow and DCF valuation
methods and other related factors.
(a) Cash Flows
Y00 (Rs. 000)
Y01 (Rs. 000)
Y02 (Rs. 000)
Y03 (Rs. 000)
Y04 (Rs. 000)
Booth and commissioning (10mn+2mn) (12,000) - - - -
Sale of scraps - - - - 3,000
Booth maintenance - (2,000) (2,000) (2,200) (2,420)
Concrete work done (Sunk cost) - - - - -
Revenue (W2) from existing facilities - 2,000 2,400 3,000 3,400 Contribution on additional revenue (W3) - 4,000 4,400 4,840 4,840
Saving on labour cost - 500 500 500 500
Increase in electricity cost - (200) (200) (200) (200)
Net Cash Flows (12,000) 4,300 5,100 5,940 9,120
Tax @ 28% - (1204) (1428) (1663) (2,554) Net Cash flows after tax before cash inflow due to Cap. all
(12,000) 3,096 3,672 4,277 6,566
DR at 12% 1.000 0.893 0.797 0.712 0.636
DCF (before Cap. all) (12,000) 2,764 2,927 3,045 4,176
Cash inflow due to Cap. all (W-4) - 1,120 1,120 1,120 -
DR cash inflow due to [email protected]% 1 0.850 0.723 0.615 0.523 DCF cash inflow due to Cap. all @ 17.6% - 952 810 688 -
Net DCF (12,000) 3,716 3,737 3,733 4,176
NPV 3,362
Since this investment generates a positive NPV, the investment is financially desirable to ASL

Suggested Solutions (KC2), June 2015 Page 14 of 17
(b)(i) NCF Cumul.
(12,000) (12,000)
Y-01 4,216 (7,784)
Y-02 4,792 (2,992)
Y-03 5,397 2,405
Payback period = 2years +(2992/5397)*12 = 2 years & 7 months (approx.)
WI - Since all cash flows are subject to inflation at a uniform rate of 5% we can apply
the real discounting rate.
Real discounting rate = ((1 + nominal DR)/(1+inflation)) - 1
= (1.176/1.05) - 1
= 12%
W2 - Increase in forecasted revenue over existing revenue
Y01 (Rs. 000)
Y02 (Rs. 000)
Y03 (Rs. 000)
Y04 (Rs. 000)
Forecasted revenue 10,000 12,000 15,000 17,000
Increase in contrib. (20%) 2,000 2,400 3,000 3,400
W3 - Contribution from additional revenue
Additional revenue 5,000 5,500 6,050 6,050
Contribution (80%) 4,000 4,400 4,840 4,840
W4 -
Capital allowance 4,000 4,000 4,000 -
Cash inflow due to Cap.all(@28% 1,120 1,120 1,120
Note: Cash inflows due to capital allowances are discounted at the nominal DR as they are not affected by inflation.

Suggested Solutions (KC2), June 2015 Page 15 of 17
(ii) Payback period is useful due to the following;
■ It can be easily applied and understood.
■ If the company is facing liquidity issue payback period, helps to identify the period within which it can recover the initial capital investment.
■ When the continuation of the investment for the expected period is uncertain due to technology changes/product changes etc. this method is useful.
■ More useful when small investments are being evaluated.
1 Mark for each point - Maximum 2
Marks
(c)
When DR = 20%,(Real)
Y00 (Rs. 000)
Y01 (Rs. 000)
Y02 (Rs. 000)
Y03 (Rs. 000)
Y04 (Rs. 000)
NCF (before Cap. all) (12,000) 3,096 3,672 4,277 6,566
DR 1.000 0.833 0.694 0.579 0.482
PV (12,000) 2,579 2,548 2,476 3,165
Cash flow due to Cap. all - 1,120 1,120 1,120
DR @ 26% nominal - 0.794 0.630 0.500
DCF due to Cap. all - 889 706 560
Net DCF (12,000) 3,468 3,254 3,036 3,165
NPV = 923
NPV @ 12% (real) 3,362
NPV @ 20% (real) 923
IRR
20% + 8% 923 2439
IRR 23% (real)
= 29.15% (nominal)
If the discounted rate (company's cost of capital) increases above 29.15% this project is not financially desirable. In other words, if the financing cost for this project exceeds 29.15% the project will not be financially worthwhile.

Suggested Solutions (KC2), June 2015 Page 16 of 17
(d)
(i) The highest price is the price at which the NPV of the investment become zero.
The NPV as calculated above
Rs.000 3,362
Cost of the repair booth 10,000
Total PV other than cost of repair booth (at Y01) 13,362
When delayed by another one year (DR at Y01 = 0.893) 11,932
Price of the repair booth now (DR at Y00 = 1) (10,000)
The new NPV 1,932
If money is advanced the NPV will come down by 1,430
Rs.000
(ii) Here, the NPV should be at least 1,932
NPV in one year ahead 2,164
NPV when price of the booth equals to 10mn 3,362
Possible decrease in NPV due to increase in price (1,198)
If X is the price revision, the effect on NPV should be;
(-X*1) + (X/3*28%*2.188) + (X*30%*72%*0.636) = (0.65841X)
X=increase in price = 1,198/0.65841 (Rs.) 1819.533
Increased/Revised price should be (Rs. '000) 11,820

Suggested Solutions (KC2), June 2015 Page 17 of 17
Notice of Disclaimer
The answers given are entirely by the Institute of Chartered Accountants of Sri Lanka (CA Sri
Lanka) and you accept the answers on an "as is" basis.
They are not intended as “Model answers’, but rather as suggested solutions.
The answers have two fundamental purposes, namely:
1. to provide a detailed example of a suggested solution to an examination question; and
2. to assist students with their research into the subject and to further their understanding
and appreciation of the subject.
The Institute of Chartered Accountants of Sri Lanka (CA Sri Lanka) makes no warranties with
respect to the suggested solutions and as such there should be no reason for you to bring any
grievance against the Institute of Chartered Accountants of Sri Lanka (CA Sri Lanka). However,
if you do bring any action, claim, suit, threat or demand against the Institute of Chartered
Accountants of Sri Lanka (CA Sri Lanka), and you do not substantially prevail, you shall pay the
Institute of Chartered Accountants of Sri Lanka's (CA Sri Lanka’s) entire legal fees and costs
attached to such action. In the same token, if the Institute of Chartered Accountants of Sri Lanka
(CA Sri Lanka) is forced to take legal action to enforce this right or any of its rights described
herein or under the laws of Sri Lanka, you will pay the Institute of Chartered Accountants of Sri
Lanka (CA Sri Lanka) legal fees and costs.
© 2013 by the Institute of Chartered Accountants of Sri Lanka (CA Sri Lanka).
All rights reserved. No part of this document may be reproduced or transmitted in any form or by
any means, electronic, mechanical, photocopying, recording, or otherwise, without prior written
permission of the Institute of Chartered Accountants of Sri Lanka (CA Sri Lanka).
KB2 Business Management Accounting: Business Level Examination June 2015