suicide and attempted suicide in nova scotia · department of health promotion and ... population...
TRANSCRIPT

Suicide and Attempted Suicide
in Nova Scotia 1995–2004
A REPORT

Suicide and Attempted Suicide
in Nova Scotia 1995–2004
February • 2009
A REPORT

© Crown copyright, Province of Nova Scotia, 2009
ISBN: 978-1-55457-283-0
Suicide and Attempted Suicide in Nova Scotia (1995–2004): A Report
Population Health Research Unit (Dalhousie University) in collaboration with the Nova Scotia Department of HealthPromotion and Protection.
Designed by Laura Graham Design
To download additional copies, please visit the Nova Scotia Department of Health Promotion and Protectionwebsite: www.gov.ns.ca/hpp.
How to cite this document:
Peter Nestman (Population Health Research Unit). (2008). Suicide in Nova Scotia: A Report, Halifax: Nova ScotiaDepartment of Health Promotion and Protection.
February, 2009

Contents
Acknowledgments. . . . . . . . . . . . . . . . . . . . . . . . . . . . . . . . . . . . . . . . . . . . . 5
Foreword. . . . . . . . . . . . . . . . . . . . . . . . . . . . . . . . . . . . . . . . . . . . . . . . . . . . . 7
Methodology . . . . . . . . . . . . . . . . . . . . . . . . . . . . . . . . . . . . . . . . . . . . . . . . . 9
Factors Associated with Suicide . . . . . . . . . . . . . . . . . . . . . . . . . . . . . . . . . . 11
Limitations . . . . . . . . . . . . . . . . . . . . . . . . . . . . . . . . . . . . . . . . . . . . . . . . . . 12
Hospitalizations for Suicide Attempts . . . . . . . . . . . . . . . . . . . . . . . . . . . . 15
Injury-related Hospitalizations in Nova Scotia . . . . . . . . . . . . . . . . . . . . . . . . 15
Trends in Hospitalizations for Suicide Attempts (1995–2004) . . . . . . . . . . . . 16
Age Differences in Hospitalizations for Suicide Attempts . . . . . . . . . . . . . . . 18
Attempts per Individual Based on Age and Sex . . . . . . . . . . . . . . . . . . . . . . 18
Methods of Attempted Suicide . . . . . . . . . . . . . . . . . . . . . . . . . . . . . . . . . . 19
Demographic Factors in Hospitalizations for Suicide Attempts . . . . . . . . . . . 20
Location of Suicide Attempt before a Hospitalization. . . . . . . . . . . . . . . . . . 21
Prior Mental Health and/or Substance Abuse History . . . . . . . . . . . . . . . . . . 22
Prior Health Care Usage. . . . . . . . . . . . . . . . . . . . . . . . . . . . . . . . . . . . . . . . 24
Length of Stay for Hospitalizations for Suicide Attempts . . . . . . . . . . . . . . . 26
Mortality Due to Suicide . . . . . . . . . . . . . . . . . . . . . . . . . . . . . . . . . . . . . . . 29
Deaths by Suicide: The National Context . . . . . . . . . . . . . . . . . . . . . . . . . . . 29
Overall Mortality in a Provincial Context (2001–2004) . . . . . . . . . . . . . . . . . 29
Injury-Related Deaths in Nova Scotia . . . . . . . . . . . . . . . . . . . . . . . . . . . . . . 30
Overall Trends In Completed Suicides (1995–2004) . . . . . . . . . . . . . . . . . . . 31
History of Prior Attempts of Completed Suicides (1995–2004). . . . . . . . . . . 32
Sex Differences in Completed Suicides. . . . . . . . . . . . . . . . . . . . . . . . . . . . . 32
Age Differences in Completed Suicide . . . . . . . . . . . . . . . . . . . . . . . . . . . . . 33
Methods of Completing Suicide. . . . . . . . . . . . . . . . . . . . . . . . . . . . . . . . . . 34
Suicide and Socio-demographic Factors . . . . . . . . . . . . . . . . . . . . . . . . . . . . 36
Suicide, Mental Health, and the Health System. . . . . . . . . . . . . . . . . . . . 39
Most Recent Mental Health Disorder Contact Prior to Suicide . . . . . . . . . . . 39
Likelihood of Being in Contact With a Health Provider. . . . . . . . . . . . . . . . . 40
Severity of Mental Disorder and Suicide. . . . . . . . . . . . . . . . . . . . . . . . . . . . 41
Completed Suicides without Any Health System Contacts . . . . . . . . . . . . . . 43
Summary of Facts . . . . . . . . . . . . . . . . . . . . . . . . . . . . . . . . . . . . . . . . . . . . . 45
Hospitalization for Suicide Attempts . . . . . . . . . . . . . . . . . . . . . . . . . . . . . . 45
Completed Suicides . . . . . . . . . . . . . . . . . . . . . . . . . . . . . . . . . . . . . . . . . . . 46
Appendix 1: Suicide ICD 9 & 10 Definition Codes . . . . . . . . . . . . . . . . . . 47
Appendix 2: Mental Health Chapter Codes. . . . . . . . . . . . . . . . . . . . . . . . 48
Appendix 3: Average Annual Income by Quartile . . . . . . . . . . . . . . . . . . 49
Reference List . . . . . . . . . . . . . . . . . . . . . . . . . . . . . . . . . . . . . . . . . . . . . . . . . 51
Su
icid
e a
nd
Atte
mp
te
d S
uic
ide
in
No
va
Sc
otia
•


Acknowledgments
The creation of this report is the result of the collective effort by many people who care deeply aboutthe lives of Nova Scotians and are committed to addressing the issue of suicide in our province. TheDepartment of Health Promotion and Protection thanks all of those individuals who contributed theirtime and wisdom to the development of this report.
In particular, the Department of Health Promotion and Protection acknowledges with great appreciationall of the contributions made by the members of the steering committee established to help guide thedevelopment of this report and assist in the data analysis and interpretation.
Steering Committee Members
• Dr. Steven Kisely, Department of Community Health and Epidemiology, Dalhousie University andQueensland Centre for Health Data Service, Queensland University, Australia
• Dr. John Campbell, Director, Mental Health Services, Annapolis Valley Health
• Dr. Matthew J. Bowes, Chief Medical Examiner, Nova Scotia Medical Examiner Service
• Dr. Stan Kutcher, Sun Life Financial Chair in Adolescent Mental Health; IWK Health Centre andDalhousie University
• Dr. Susan Kirkland, Department of Community Health and Epidemiology, Dalhousie University
• Leighan Wichman, Executive Director, Youth Project
• Kevin Ryan, First Nations and Inuit Health, Health Canada
• Angela Davis, Coordinator, Communities Addressing Suicide Together, Canadian Mental HealthAssociation, Nova Scotia Division
• Tony Prime, Coordinator, Adult Services, Mental Health, Children’s Services, and Addictions TreatmentBranch, Nova Scotia Department of Health
• Emily Schleihauf, Public Health Officer, Population Health Assessment and Surveillance, Nova ScotiaDepartment of Health Promotion and Protection
• Julian Young, Coordinator, Injury Prevention and Control, Chronic Disease and Injury Prevention, NovaScotia Department of Health Promotion and Protection
• Peter Nestman, Population Health Research Unit, Dalhousie University
The Department of Health Promotion and Protection also wishes to acknowledge the contributions tothe report made by Dr. S. Hussain, Dr. George Kephart, Dr. Judy Guernsey, Leslie Anne Campbell, Dr.Michael Sullivan, Carole Tremblay, and Dr. Jean Hughes.
The analysis and the report were written and prepared by researcher/coordinator Peter Nestman with theassistance of analyst Yan Wang, analyst Ravin Randhawa, and former director Mark Smith of thePopulation Health Research Unit (PHRU) at Dalhousie University, and Julian Young, Nova ScotiaDepartment of Health Promotion and Protection. Su
icid
e a
nd
Atte
mp
te
d S
uic
ide
in
No
va
Sc
otia
5


Foreword
Suicide, or attempted suicide, eventually touches the lives of many Nova Scotians, whether throughfamily, a friend, a work colleague, or a community member. This is an important public health issue, butdespite the fact that most of us are affected by it, it remains a silent problem, quietly whispered aboutbehind closed doors. We need to bring suicide to the forefront and develop a better understanding ofthe patterns and trends associated with suicide and attempted suicide in our province. This will allow usto further enhance the societal, policy, and individual supports required to address suicide in Nova Scotia.
In 2004 Nova Scotia became the first jurisdiction in Canada to establish a provincial injury preventionstrategy led and funded by government. The Nova Scotia Injury Prevention Strategy identifies addressingsuicide as a priority, and in support, the Department of Health Promotion and Protection collaboratedwith many partners to launch the Nova Scotia Strategic Framework to Address Suicide in the fall of2006.
Development of the following report was one of the recommended actions outlined in the framework.It draws on a number of data sources to present an accurate, statistical picture of suicide and attemptedsuicide in Nova Scotia. Our intent is for this report to be a resource in our collective efforts to addresssuicide—a resource that will inform the actions and decisions of policy makers and suicide preventionstakeholders alike.
Suicide and attempted suicide are an issue that affects all of us, and I encourage you to make suicideprevention a priority. For those of you who have already done so, thank you for your work in this area.By working together across all sectors we can help prevent many suicides and suicide attempts andimprove the lives of our families, friends, and communities.
Robert Strang, MD, MHSC, FRCPCChief Public Health OfficerDepartment of Health Promotion and Protection
Su
icid
e a
nd
Atte
mp
te
d S
uic
ide
in
No
va
Sc
otia
7


Methodology
This report examines hospital and vital statistics records for suicides and suicide attempts in Nova Scotiaover a 10-year period, between fiscal years 1995 and 2004. It examines demographic factors, the meansutilized for attempted and completed suicides, and the types of health-care services that suicidalindividuals made use of.
A suicide is defined in this report as intentionally terminating one’s own life through one of thefollowing means:
• intentional self-poisoning with one of the following:
- anticonvulsant, sleeping disorder, depression/anxiety drugs
- non-narcotic pain, fever, or anti-inflammatory medication
- motor vehicle exhaust or other gases/vapours
- medications and/or biological substances (e.g., general anesthetics, muscle relaxants, nitrous oxide,etc.)
- other
• hanging, strangulation, or suffocation
• intentional drowning or submersion
• intentional discharge from a firearm such as
- a handgun
- a hunting rifle, shotgun, or large firearm
- other and unspecified firearms
• intentional jumping from high places
• intentional cutting or piercing with a sharp object
• other means, with intention, such as
- the use of fire, flames, or smoke
- steam, hot vapours, or objects
- the use of blunt objects
- moving in front of moving objects
- crashing a motor vehicle
- utilizing explosive materials
- other unspecified or specified methods
A complete list of the diagnostic codes analysed in this report can be found in Appendix 1. The diagnostic codes listed do not distinguish between self-harm and suicide.
Su
icid
e a
nd
Atte
mp
te
d S
uic
ide
in
No
va
Sc
otia
9

Provincial suicide statistics were analysed from the following two datasets:
• Vital Statistics Database (VS): The VS database contains detailed information about all deaths inNova Scotia, including demographic information and underlying cause of death. This database wasused to evaluate Nova Scotia deaths that were coded as a suicide.
• Canadian Institute for Health Information Discharge Abstract Database (CIHI-DAD): The information in this database comes from admission/separation forms completed by hospitals atthe end of each uninterrupted patient stay. The CIHI-DAD contains comprehensive, patient-levelinformation (e.g., demographics, diagnoses, treatments) for each admission to a Nova Scotia hospital.These data provide information about the nature of suicide-related hospitalizations (e.g., time andlocation of an attempted suicide, anatomic site of injury, length of hospital stay, etc.).
Diagnostic information in both VS and CIHI-DAD is coded using the International Statistical Classificationof Diseases and Related Health Problems, more commonly referred to as ICD-9-CM for years 1995–2001and ICD-10-CA for 2001–2004. These systems provide specific codes for health conditions and injuries,including suicide (Appendix 1).
The two datasets used in this study identified a cohort of 5,958 individuals who were either hospitalizedfor one or more suicide attempts or who died by suicide between the fiscal years 1995 and 2004. Otherdatasets used to augment the analyses were the following:
• Insured Patient Registry: The Insured Patient Registry contains longitudinal information (e.g., dateof birth, patient geography) about every resident of Nova Scotia who is registered as a beneficiary ofprovincial Medical Services Insurance (MSI) health care. This registry was used to determine thepopulation eligible for health-care services in each year. Records for some citizens who have theirhealth-care costs covered under federal plans (e.g., Canadian Armed Forces, RCMP) are not capturedin this database.
• 2001 Canada Census – Nova Scotia Component (Census): The 2001 Census file containsstatistical data from the 2001 Canadian Census including demographic and household informationand socio-economic indicators. These data were used to assign median household income (at thedissemination area level) to the study sample.
• Patient Geography Database: The Patient Geography Database contains geographic informationbased on postal code for every patient in each of the other databases. In areas where postal codes donot map exactly to other geographic boundaries, Statistics Canada’s Postal Code Conversion File(PCCF+) was used to map postal codes to census dissemination areas. The procedure assignsgeographic codes probabilistically using the relative population weights of the surrounding areas. Thisprocedure was used to assign individual records to district health authorities (DHAs) and censusdissemination areas (DAs).
• Mental Health Outpatient Information System: The Mental Health Outpatient InformationSystem contains patient and provider information relating to mental health clinics across Nova Scotia.This database was used when analysing the history of visits to mental health clinics of the populationwho attempted or completed suicide.1
• MSI Physician Billings: The Physician Billing database contains administrative records for eachinsured health service rendered by a physician and paid for by the Nova Scotia provincial healthcaresystem. These services include those in an office of a general practitioner, in an emergency room andby specialists such as psychiatrists.
10
Su
icid
e a
nd
Atte
mp
te
d S
uic
ide
in
No
va
Sc
otia
1. MHOIS: Although the reliability of the information in this dataset has been questioned, it was used for thisreport as it is one of the few datasets available specific to mental health.
2. Confidence Intervals were calculated using the following formulas:
3. The definition for urban/rural status used in this report is similar to “metropolitan/non-metropolitan” status.
Crude and age-adjusted rates of attempted suicide and suicides were calculated. Crude rates representthe actual number of suicide attempts or deaths during each fiscal year (i.e., 11/100,000). An age-adjusted rate is a weighted average of the age-specific crude rates, where the weights are theproportions of persons in the corresponding age groups of a standard population. The purpose of usingage-adjusted rates is to enable comparisons between jurisdictions or groups that have populations withdifferent age-sex compositions or to make comparisons across different years. In this study, crude ratesdid not vary significantly from age-adjusted rates. Crude rates were provided in this report todemonstrate the actual numerical rate of suicide in Nova Scotia. Age-adjusted rates were offered whendifferent populations (e.g., sex, age) were being compared.
Suicide rates, both attempted and completed, were calculated by dividing the number of hospitaladmissions for suicide attempts or the number of suicide deaths listed in vital statistics by therepresentative population and multiplying that by 100,000. For example, there were 114 completedsuicides in 1999 in an overall population of 971,766, resulting in a crude death rate of 114/971,766 *100,000 = 11.73 per 100,000 2.
The frequency of hospitalizations for suicide attempts and suicide completions in comparison to othercauses of hospitalization and death was also provided in this report. For coding reasons, only years2001–2004 were captured, and it should be noted that there may be small fluctuations in thefrequencies of suicides compared to other causes of hospitalizations and deaths in other reports, as thecategories used may utilize different codes and years.
Factors Associated with Suicide
The report sought to measure the degree to which sex, age, and each of the following factors wereinfluences in the rate of attempted or completed suicide:
1. Urban/rural status: An area was defined as urban if it was designated as a census metropolitanarea (CMA) or a census agglomeration (CA) in the Patient Geography Database3. A CMA is ageographic region that encompasses an urban core with a population of 100,000 or more; a CA is ageographic region that encompasses an urban core with a population of 10,000–99,999. In NovaScotia, there is one CMA (Halifax), and there are four CAs (Kentville, Truro, New Glasgow, andSydney) (Statitics Canada 2001). All other regions of the province were defined as rural.
2. Household income: Median household income for census dissemination areas (DAs) was obtainedfrom the 2001 Canadian Census and linked to individual records by DA. The range and quartiles formedian household income were computed for each DHA.
3. Contacts with mental health services: The types of mental health services used by suicidalpatients were examined including
• hospital visits
• visits to mental health clinics (information from a variety of occupational providers)
• visits to emergency rooms (those that were billed through MSI)
• visits to a family physician
• visits to psychiatrists
Su
icid
e a
nd
Atte
mp
te
d S
uic
ide
in
No
va
Sc
otia
11

The report sought to identify rates of suicide and prior health-care utilization of those who attempted orcompleted suicide according to the severity of their mental disorder. For this report, the definition forsevere mental disorders includes bipolar and schizophrenia disorders. McAlpine and Mechanic (2000,277–92) state that “severe mental illnesses are those that are most clinically complex and persistent.Although the specific diagnoses and illnesses that meet these criteria may be debatable, there isconsensus that schizophrenia and bipolar disorders are among the most severe mental illnesses.” “Other mental disorders” would include other mental disorders and substance abuse.
ICD-9 and ICD-10 codes used to define mental health contacts are listed in Appendix 2 and include thefollowing categories of disorders:
Severe Mental Disorders Other Mental Disorders
• bipolar disorders • conduct disorders• schizophrenia disorders • anxiety disorders
• depressive disorders• other neurotic disorders• substance abuse• organic disorders• other
This report identifies health contacts and mental health diagnoses of individuals who attempted orcompleted suicide between the years 1995 and 2004. As it is important to understand the degree ofimpact that health services are having on different groups in preventing suicide, whether or not patientswere being guided to the appropriate services for their conditions and whether there were consistentlevels of service across the province, this report attempted to compare utilization patterns based onseverity of mental disorders and health status and by demographics (e.g., age, sex, income quartile,urban/rural status).
Limitations
The diagnostic codes analysed in this report are from the ICD-9-CM and ICD-10 coding systems, whichdo not distinguish between measures of self-harm with and without suicidal intent. As a result, thisreport could overestimate suicide numbers, particularly hospitalizations for attempted suicide amongstfemale youth between the ages of 14 and 24 years. According to Nixon, Cloutier, and Jansson (2008,308) “The most frequent reported forms of nonsuicidal self-harm (descending order) were: self-injurysuch as cutting, scratching and self-hitting, ingesting a medication in excess of the prescribed orgenerally recognized dosage, ingesting a recreational or illicit drug or alcohol as a means of self-harmand other nonspecified forms of self-injury.” On the other hand, certain types of suicide may gounderreported, as in many cases it may be difficult for a coroner to determine a specific intent to takelife.
Assessing suicide attempts is particularly challenging. Many suicide attempts do not result in theindividual being hospitalized for treatment because hospitals tend to admit only the most severe cases(Holley, Fick, and Love 1998). Moreover, many suicide attempts may go unreported to the medicalsystem. This leads to a loss of information for reports that depend on such data. Moreover, in thisanalysis every self-harm–related hospitalization is calculated as a suicide attempt. As there is thepossibility of transfers from hospital to hospital or even within wards in a singular hospital the resultcould lead to over-counting in some instances.
12
Su
icid
e a
nd
Atte
mp
te
d S
uic
ide
in
No
va
Sc
otia

It should also be noted that the validity of comparing suicide rates across jurisdictions and time spanshas been questioned. Previous reports have demonstrated variations in provincial suicide rates. Some ofthese differences may be attributable to different coding practices between jurisdictions. While mostprovinces share the same definition for suicide, the standard of proof required to make the finding byprovincial coroners or medical examiners may be different. Pearson-Nelson, Raffalovich and Bjarnason(2004, 335) noted that “the ICD-10 thus not only offers many more categories of suicide to choosefrom, but also many more categories of deaths of unknown causes and unknown intent. Cross-nationalresearch on the ways in which coroners categorize deaths using new categories would be a valuablecontribution to the study of international suicide rates.” They suggest that the implementation of ICD-10-CA is associated with significant decreases in suicide rates internationally.
This document reports the numbers and rates of suicide, both attempted and completed, by age, sex,urban/rural status, average household income quartile, and the extent of contact with select provincialhealth providers. While these factors are important, other areas of study identified by the Nova ScotiaFramework to Address Suicide (November 2006) could not be analysed. This includes ethnicity(specifically First Nations) and sexual orientation. At the time of this report, there were no datasetsavailable that could be used to analyse these cohorts. Although there are codes within the ICD-10-CAsystem associated with sexual orientation, they are not currently used within the province. The followingcohorts of importance in the study of suicide could also not be identifed in this report.
• The homeless
• Individuals with a history in the justice system. This would include people with a history within thejustice system at a federal or provincial level.
• Recipients of community services/continuing care programming. This would include programsadministered by the Department of Community Services and the Department of Health, such as grouphomes, independent living homes, residential and vocational living providers, home care and supportagencies, long term care facilities, and other supportive living arrangements, especially for those withmental disorders. At the time of this report, there was no way, within the parameters of this study, toidentify which individuals may or may not have received programming from any of these services.
• Recipients of provincial Pharmacare programming: Several provincially available Pharmacare programswere available for Nova Scotians during the period of this study (for those with diabetes, in lowerincome brackets, and Pharmacare for seniors and those in long-term care). The use of prescriptiondrugs is important in the field of mental health and suicide prevention. Prescription medication wasinitially examined for this report; however, results were not deemed to be evaluable due to incompletedata.
• Individuals living in specific communities or within families: Suicide clusters within specific communitieswere initially examined in the development of this report, and some preliminary findings indicated thatsuicides occur with higher frequency in specific communities (in certain postal codes and time frames).However, due to low population counts and privacy concerns, these results were omitted. A review offamily histories of suicide could not be conducted as there was no way within the health databases toidentify family relationships amongst individuals.
• Members of the Canadian Armed Forces: In addition to not being able to identify active members andveterans of the armed forces provincially, the health-care services often used by military personnel inNova Scotia are under federal jurisdiction, meaning the services used would not be captured byprovincial datasets, making this population additionally difficult to study for the purposes of thisreport.
Su
icid
e a
nd
Atte
mp
te
d S
uic
ide
in
No
va
Sc
otia
13
This report indicates a decrease in hospitalizations for suicide attempts over a 10-year time span.However, it will require additional analysis to determine if this trend represents a change in suicidalbehaviour or if it represents a change in coding, reporting, or management practices. To betterunderstand the complexity and impact of suicide on society, it is important to look beyond suicide ratesand try to understand the health and environmental factors that can influence suicidal behaviour.
Finally, this report indicates a higher degree of health system contact for mental health services amongstindividuals who attempted or completed suicide compared to the overall Nova Scotia population. Thisreport attempted to compare utilization patterns based on severity of mental disorders and healthstatus, and by demographics (e.g., age, sex, income quartile, rural urban status). The report indicatedthat there were divergences in prior usage of health-care services according to urban/rural status,income quartile, age, sex, age, and severity of mental disorder. However, the report does not indicatehow these divergences in usage affected care delivery outcomes or how the utilization patterns wereinfluenced by external factors (e.g., other government programming, families, workplace, etc.). Thereport is incomplete in that it does not include information on contacts with other government servicesand/or providers such as correctional services, law enforcement, the legal system, private-practicepsychologists, community services programs, housing programs, continuing care providers, schoolcounsellors, employers, provincial Pharmacare programming, and others. Furthermore, it does not assessthe level of awareness or the degree and effectiveness of suicide prevention programming amongsthealth providers.
14
Su
icid
e a
nd
Atte
mp
te
d S
uic
ide
in
No
va
Sc
otia
Hospitalizations for Suicide Attempts
Injury-related Hospitalizations in Nova Scotia
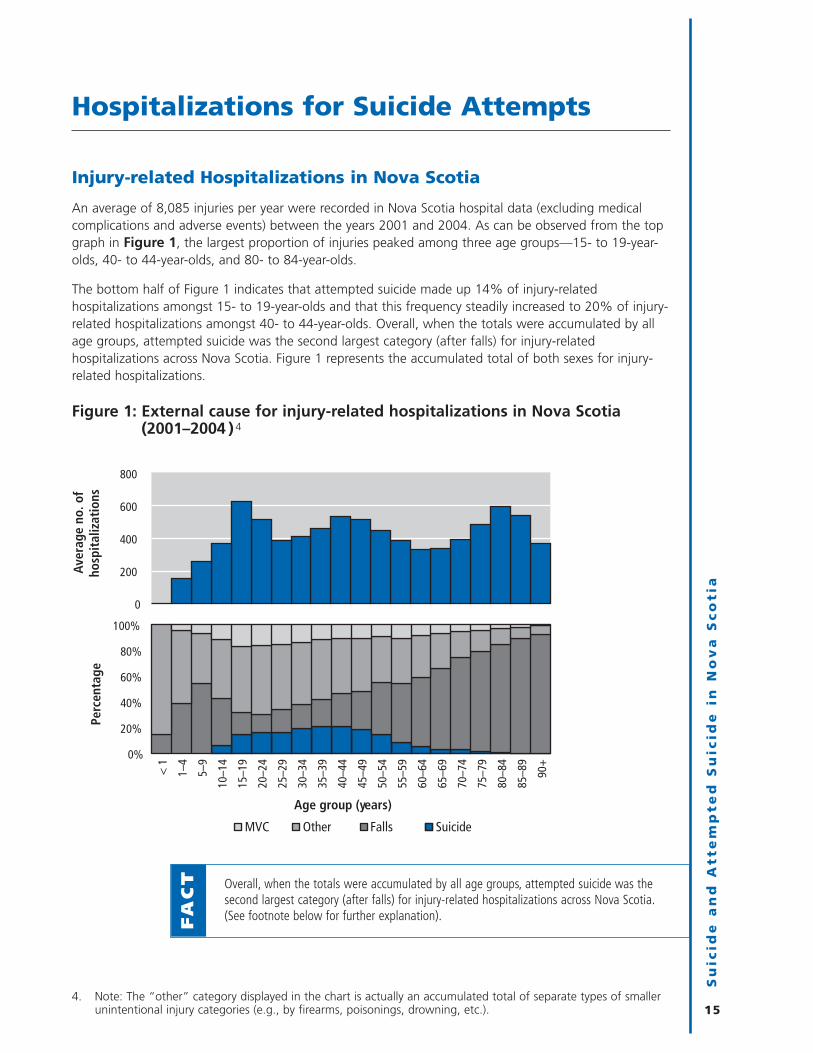
An average of 8,085 injuries per year were recorded in Nova Scotia hospital data (excluding medicalcomplications and adverse events) between the years 2001 and 2004. As can be observed from the topgraph in Figure 1, the largest proportion of injuries peaked among three age groups—15- to 19-year-olds, 40- to 44-year-olds, and 80- to 84-year-olds.
The bottom half of Figure 1 indicates that attempted suicide made up 14% of injury-relatedhospitalizations amongst 15- to 19-year-olds and that this frequency steadily increased to 20% of injury-related hospitalizations amongst 40- to 44-year-olds. Overall, when the totals were accumulated by allage groups, attempted suicide was the second largest category (after falls) for injury-relatedhospitalizations across Nova Scotia. Figure 1 represents the accumulated total of both sexes for injury-related hospitalizations.
Figure 1: External cause for injury-related hospitalizations in Nova Scotia(2001–2004 )4
Su
icid
e a
nd
Atte
mp
te
d S
uic
ide
in
No
va
Sc
otia
154. Note: The “other” category displayed in the chart is actually an accumulated total of separate types of smaller
unintentional injury categories (e.g., by firearms, poisonings, drowning, etc.).
Overall, when the totals were accumulated by all age groups, attempted suicide was thesecond largest category (after falls) for injury-related hospitalizations across Nova Scotia.(See footnote below for further explanation).F
AC
T
0%
20%
40%
60%
80%
100%
< 1
1–4
5–9
10–1
4
15–1
9
20–2
4
25–2
9
30–3
4
35–3
9
40–4
4
45–4
9
50–5
4
55–5
9
60–6
4
65–6
9
70–7
4
75–7
9
80–8
4
85–8
9
90+
Perc
enta
ge
Age group (years)
MVC Other Falls Suicide
0
200
400
600
800
Aver
age
no. o
f ho
spit
aliz
atio
ns

Trends in Hospitalizations for Suicide Attempts (1995–2004)
Between the years 1995 and 2004, there were 6,582 admissions for attempted suicide recorded in Nova Scotia hospitals (yearly average of 658). The rate of hospitalization for suicide attempts declinedover the 10-year period (Figure 2) (p value ≤ 0.05). Although this drop is statistically significant, itshould be interpreted with some caution, as the rates of attempted and completed suicide have beendeclining in many jurisdictions, and it has been argued that it may be the result of changes in codingpractices internationally (Pearson-Nelson, Raffalovich, and Bjarnason 2004). Moreover, it could simplymean that fewer attempts actually result in a hospitalization due to changes in hospital managementpractices.
Figure 2: Hospitalization rates for suicide attempts in Nova Scotia (1995–2004)5
Fifty-five per cent of those who were hospitalized for attempted suicide were female (Figure 3). Thedifference was more pronounced among younger age groups. However, as age increased, the disparitybetween males and females in the number of hospitalizations for suicide attempts declined.
Figure 3: Percent of hospitalizations for suicide attempt by sex (1995–2004)
16
Su
icid
e a
nd
Atte
mp
te
d S
uic
ide
in
No
va
Sc
otia
5. Age-adjusted rates of hospitalizations for suicide attempts were also calculated and did not show a variation intrend from the crude rate.
0%
20%
40%
60%
80%
100%
0–19 20–39 40–59 60–79 80+Perc
enta
ge o
f att
empt
ed s
uici
des
Age group (years)
Female55%
Male45%
0
25
50
75
1995
1996
1997
1998
1999
2000
2001
2002
2003
2004
No.
per
100
,000
peo
ple
Fiscal year
77 per 100,000
54 per 100,000

The rates of hospitalization for suicide attempt by both males and females declined over the 1995–2004period (p value ≤ 0.05). Females had higher hospitalization rates for suicide attempts than males duringthe study period (Figure 4). In general, women have higher rates of attempted suicide, while men havehigher rates of completed suicide (Langlois and Morrison 2002).
Figure 4: Age-adjusted hospitalization rates (with 95% confidence intervals)for suicide attempt by sex in Nova Scotia (1995–2004)
Su
icid
e a
nd
Atte
mp
te
d S
uic
ide
in
No
va
Sc
otia
17
• The age-adjusted rate of hospitalization for suicide attempts amongst femalesdeclined from 84 per 100,000 people in 1995 to 60 per 100,000 people in 2004.
• The age-adjusted rate of hospitalization for suicide attempts amongst malesdeclined from 67 per 100,000 people in 1995 to 49 per 100,000 people in 2004.F
AC
TS
0
25
50
75
100
1995
1996
1997
1998
1999
2000
2001
2002
2003
2004
No.
per
100
,000
peo
ple
Fiscal year (1995–2004)
Female hospitalization rate for suicide attempts
Male hospitalization rate for suicide attempts
84 per 100,000
67 per 100,000
49 per 100,000
60 per 100,000

Age Differences in Hospitalizations for Suicide Attempts
Figure 5 shows the hospitalization rates for suicide attempts by age group and sex. The top half of Figure 5 indicates that 15- to 19-year-olds had the highest rate of any single age group (134hospitalizations per 100,000 individuals). The bottom half of the figure indicates that females in this age group had a rate of hospitalization almost twice that of males.
Figure 5: Annual hospitalization rate (with 95% confidence intervals) forsuicide attempts by age group and sex (1995–2004)
Attempts per Individual Based on Age and Sex
Table 1: Attempts per individual by age and sex (1995–2004)
Sex Age group No. of individuals No. of attempts Attempts per individual
Female 0–19 617 726 1.2
20–39 1,123 1,574 1.4
40–59 875 1,148 1.3
60+ 171 202 1.2
Overall 2,786 3,650 1.3
Male 0–19 317 351 1.1
20–39 1,030 1,353 1.3
40–59 815 1,013 1.2
60+ 194 215 1.1
Overall 2,356 2,932 1.2
18
Su
icid
e a
nd
Atte
mp
te
d S
uic
ide
in
No
va
Sc
otia
0
50
100
150
200
10–1
4
15–1
9
20–2
4
25–2
9
30–3
4
35–3
9
40–4
4
45–4
9
50–5
4
55–5
9
60–6
4
65–6
9
70–7
4
75–7
9
80–8
4
85+
Aver
age
no. o
f hos
pita
lizat
ions
pe
r 10
0,00
0
Age group (years)
FemaleMale
0
50
100
150
200

Table 1 provides the total number of individuals who attempted suicide, the total number ofhospitalizations for attempted suicide, and the ratio between the two in years 1995–2004. As can beobserved from the table, the difference in attempts per individual between the age groups was notsignificant.
Methods of Attempted Suicide
Figure 6 shows by sex the different means of attempting suicide used by individuals who werehospitalized for a suicide attempt. The data indicate that poisoning was the most frequent means ofattempting suicide in Nova Scotia, especially among females. Males were numerically more likely thanfemales to be hospitalized for suicide attempts for all other means.
Figure 6: Frequency of hospitalizations for attempted suicide by sex and means(1995–2004)6
A closer examination of self-poisonings indicated that two subcategories contributed to the majority ofhospitalizations. These two categories were “non-narcotic pain, fever, or anti-inflammatory medications”and “anti-convulsion, sleep, depression, and/or anxiety medications.” Figure 7 demonstrates that therewas an age variation between these two categories: non-narcotic pain, fever, or anti-inflammatory pillswere numerically used most frequently by teenagers and young adults, whereas older individuals morefrequently made use of anti-convulsion, sleep, depression, and/or anxiety medications to attemptsuicide. The majority of self-poisonings with anti-convulsion, sleep, depression, and/or anxietymedications were with “tranquillizers and other psychotropic agents.”7
Su
icid
e a
nd
Atte
mp
te
d S
uic
ide
in
No
va
Sc
otia
19
6. It is likely that some of the hospitalizations, particularly for self-poisonings and cutting and piercings, were actsof self-harm, rather than attempted suicides. As previously noted, motive to commit an act is not recorded inthe database, so it is difficult to distinguish between acts of self-harm and suicide attempts.
7. Eighty-five per cent of self-poisonings with anti-convulsion, sleep, depression, and/or anxiety medications inyears 1995–2000 were “tranquillizers and other psychotropic agents.”
Poisoning was by far the most frequent means of attempting suicide in Nova Scotia.It was the method used in 80% of suicide attempts that resulted in hospitalization.
FA
CT
0100200300400500
Cutting / piercing
Other unspecified
Hanging / strangulation / suffocation
Jump (high places)
Drowning / submerging
Firearms
Female
100 200 300 400 500
Cutting / piercing
Other unspecified
Hanging / strangulation / suffocation
Jump (high places)
Drowning / submerging
Firearms
Male
No. of hospitalizations for suicide attempt
Mea
ns
0 1000 2000 3000 4000
Poisoning
1000200030004000
Poisoning

Figure 7: Frequency of “non-narcotic pain, fever, or anti-inflammatorymedications” and “anti-convulsion, sleep, depression, and/or anxietymedications” in self-poisonings (1995–2004)
Demographic Factors in Hospitalizations for Suicide Attempts
Median household incomes, obtained from the 2001 Canadian Census for Nova Scotia, were divided into four quartiles (Appendix 3). As can be seen in Figure 8 on the facing page, rates ofhospitalizations for suicide attempts were higher in lower income quartiles than in higher incomequartiles. Overall level of income was associated with suicide-related hospitalizations (chi square p value≤ 0.05)—in other words, there was a statistically significant inverse relationship between incomequartiles and the prevalence of hospitalization for a suicide attempt.
20
Su
icid
e a
nd
Atte
mp
te
d S
uic
ide
in
No
va
Sc
otia
Non-narcotic pain, fever, or anti-inflammatory pills were numerically used most frequently by teenagers andyoung adults in self-poisonings, whereas older individuals more frequently made use of anti-convulsion, sleep,depression, and/or anxiety medications to attempt suicide.F
AC
T
0%
25%
50%
75%
100%
0–19 20–39 40–59 60+
Anti-convulsion, sleep, depression and/or anxiety medications
Non-narcotic pain, fever or anti-inflammatory medications
Other
Age group (years)
No.
of h
ospi
taliz
atio
nsfo
r se
lf-po
ison
ing
0
500
1000
1500
2000
2500
Perc
enta
ge

Figure 8: Annual rates of hospitalization (with 95% confidence intervals) forsuicide attempts by median household income quartile in Nova Scotia(1995–2004)
Location of Suicide Attempt before a Hospitalization
Only 37% of hospitalization records for suicide attempts had known locations specifying where the actoccurred (2,489 out of 6,582 suicide attempts). Thus, the results in Figure 9 should be interpreted withcaution. Nevertheless, the figure demonstrates that “home” was the most frequent known location forsuicide attempts. Five per cent of attempted suicides occurred in a school, a service, or a public area(which include assembly halls, churches, cinemas, clubhouse, institutions for higher education, libraries,etc.). Two per cent of suicide attempts occurred in a residential institution (which include children’shomes, dormitories, homes for the sick, hospices, military camps, nursing homes, prisons, and reformschools).
Figure 9: Location of a suicide attempt before a hospitalization (1995–2004)
Su
icid
e a
nd
Atte
mp
te
d S
uic
ide
in
No
va
Sc
otia
21
Q1
25
50
75
100
0 Q2 Q3 Q4
No.
of
hosp
ital
izat
ions
for
suic
ide
atte
mpt
s pe
r 10
0,00
0 pe
ople
Medium household income quartile for 2001 Census
Lower income Higher income
Home 93% School / service / public area 5%
Residential institution 2%
Industry / construction area
Sport / recreation area
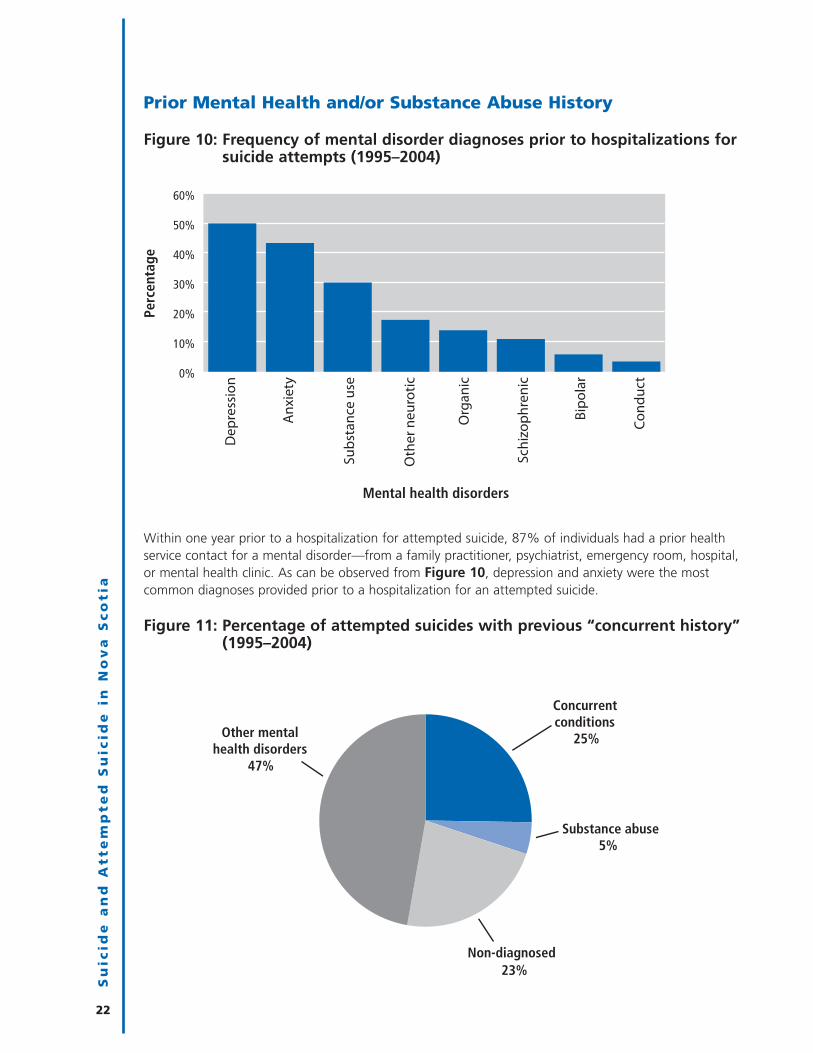
Prior Mental Health and/or Substance Abuse History
Figure 10: Frequency of mental disorder diagnoses prior to hospitalizations forsuicide attempts (1995–2004)
Within one year prior to a hospitalization for attempted suicide, 87% of individuals had a prior healthservice contact for a mental disorder—from a family practitioner, psychiatrist, emergency room, hospital,or mental health clinic. As can be observed from Figure 10, depression and anxiety were the mostcommon diagnoses provided prior to a hospitalization for an attempted suicide.
Figure 11: Percentage of attempted suicides with previous “concurrent history”(1995–2004)
22
Su
icid
e a
nd
Atte
mp
te
d S
uic
ide
in
No
va
Sc
otia
0%
10%
20%
30%
40%
50%
60%
Perc
enta
ge
Mental health disorders
Dep
ress
ion
Anx
iety
Subs
tanc
e us
e
Org
anic
Oth
er n
euro
tic
Schi
zoph
reni
c
Bipo
lar
Cond
uct
Concurrent conditions
25%
Substance abuse 5%
Non-diagnosed 23%
Other mental health disorders
47%

In 23% of hospitalizations for a suicide attempt, there was no previous mental health contact one yearprior to the attempt. These non-diagnosed cases were more frequently male or rural residents.8 In 47%of hospitalizations for a suicide attempt, there was a mental disorder diagnosis without a diagnosis ofsubstance abuse. In 5% of hospitalizations for a suicide attempt, there was a treatment for substanceabuse without any other mental disorder diagnosis. In 25% of hospitalizations for a suicide attempt,there was a previous history of substance abuse disorder and other mental disorders that could bedescribed as a “concurrent” condition (Figure 11). This meant that there was treatment for bothsubstance abuse and a mental disorder, from various types of providers. Relapse rates for individualswith concurrent conditions are considered to be higher than for individuals with diagnoses in only onecategory (Skinner et al. 2004). The number of individuals with concurrent diagnoses may beunderestimated, as secondary diagnoses are often under-reported.
An age- and sex-adjusted odds ratio was calculated for those who attempted suicide with a history ofconcurrent disorders and repeat hospitalizations for suicide attempts. The results indicated that thosewho attempted suicide with a history of concurrent disorders were four times more likely to have beenhospitalized for a suicide attempt multiple times, compared to the rest of the population who attemptedsuicide.9
The most frequent specific category for all substance abuse cases was alcohol abuse, followed by otherstimulants and opioids (Table 2). Substance abuse was highly interrelated with other mental healthproblems. In suicide attempts with histories of substance abuse problems, 84% had also receivedtreatment for another mental health disorder.10
Table 2: Number of hospitalizations for suicide attempt with substance abusehistory by type (1995–2004)
By substance No. of suicide attempts with previous Percentage ofSA diagnoses (total 6582 attempts) 11 suicide attempts
Alcohol 1004 15.3%
Other stimulants 798 12.1%
Opioids 189 2.9%
Sedatives or hypnotics 75 1.1%
Cocaine 59 0.9%
Cannabinoids 28 0.4%
Multiple drug use and use of other miscellaneous substances 622 9.5%
Total 1975 30%
Percentage of substance abusers with other mental disorders: 84%
Su
icid
e a
nd
Atte
mp
te
d S
uic
ide
in
No
va
Sc
otia
23
8. Hospitalizations for suicide attempts by individuals without previous mental disorder diagnoses were morecommon among males and rural residents. Binary logistic regressions were conducted on hospitalizations forsuicide attempts without mental disorder contacts by “sex” and urban/rural status. Both of these tests werestatistically significant (p-value ≤ 0.05 in years 1995–2004).
9. Confidence interval values were [mean (4.074), lower end (3.499), higher end (4.73), p-value was less than0.05]. A crude odd ratio was also calculated, which did not show a significant variation in value.
10. In 30% of hospitalizations for a suicide attempt there was a previous history of substance abuse see Figure 11(25% were concurrent + 5% only received treatment for substance abuse). 25%/30%=84%
11. Substance abuse total does not add up as individuals can be in more than one category.

Prior Health Care Usage
Seven per cent of hospitalizations for attempted suicide by individuals under the age of 60 had aprevious hospitalization for a reason other than that of mental disorders. For individuals 60 and older,23% had a previous hospitalization for “another reason”—other than for mental disorders (Figure 12).These “other reasons” would include other ailments such as chronic diseases, infectious diseases, orother causes of hospitalization not coded as a mental disorder. Mental disorder often co-occurs withother serious illnesses such as chronic diseases especially amongst seniors. (Public Health Agency ofCanada 2006)
Figure 12: Frequency of previous hospitalization for non-mental disorders oneyear prior to a hospitalization for a suicide attempt
It should be noted that Figure 12 provides only previous information on hospitalizations for otherreasons. The full degree of other illnesses that co-occur with individuals prior to their suicide attemptcannot be deduced from this chart. It would, however, show the degree of other health problemsrequiring a hospitalization.
24
Su
icid
e a
nd
Atte
mp
te
d S
uic
ide
in
No
va
Sc
otia
Mental disorder often co-occurs with other serious illnessessuch as chronic diseases especially amongst seniors.
FA
CT
• Individuals who were hospitalized for a suicide attempt with a concurrent history were four times more likely tohave been hospitalized for a suicide attempt multiple times, compared to those hospitalized for a suicideattempt without a concurrent history during years 1995–2004.
• In 84% of suicide attempts with a prior history of substance abuse, there was also a history of treatment formental disorders.F
AC
TS
0%
5%
10%
15%
20%
25%
0–59 60+
Perc
enta
ge
Age group (years)

One year prior to a hospitalization for attempted suicide, individuals utilized various health-care services(mental health clinics, psychiatrists, general practitioners, emergency rooms, hospitals) for mentaldisorders with varying degrees of frequency. General practitioners were the most heavily accessedprovider, followed by services through a mental health clinic. Figure 13 breaks down the averagenumber of mental disorder contacts of those who were hospitalized for a suicide attempt one year priorto the attempt according to urban/rural status. As can be observed from the figure, the difference infrequency of visits to general practitioners, mental health clinics, or hospitals according to rural/urbanstatus was not substantially different (p values > 0.05). The confidence intervals indicate that thedifferences in frequency are beyond the margin of error and do not indicate significant differences in thefrequency of use for these services. However, one year prior to a hospitalization for attempted suicide,rural individuals made significantly less use of emergency room services and psychiatric services thanthose hospitalized for suicide attempts in urban residences (p values ≤ 0.05).
Figure 13: Average number of mental health contacts (with 95% confidenceintervals) one year prior to hospitalization for suicide attempt, byrural/urban status (1995–2004)
Similarly, Figure 14 breaks down the average number of mental disorder contacts of those who werehospitalized for a suicide attempt one year prior to the attempt, this time according to residentialincome quartiles. As can be observed from the figure, there was no significant difference in prior use ofservices for hospitalizations or psychiatrist visits according to income quartiles prior to a suicide attempt(p values > 0.05). However, one year prior to a hospitalization for attempted suicide, those in lowerincome quartiles visited mental health clinics, emergency rooms, and general practitioners morefrequently than those in higher income quartiles (p values ≤ 0.05).
One year prior to a hospitalization for attempted suicide, rural individuals made significantly less useof emergency room services and psychiatric services for a mental disorder than those in urbanresidences hospitalized for suicide attempts.F
AC
T
Su
icid
e a
nd
Atte
mp
te
d S
uic
ide
in
No
va
Sc
otia
25
0
1
2
3
4
5
6
Mental healthclinic
Emergency room
Hospital Psychiatrist Generalpractitioner
Aver
age
no. o
f vis
its
Provider
Rural
Urban

Figure 14: Average number of mental health contacts (with 95% confidenceintervals) one year prior to hospitalization for suicide attempt, byincome quartiles (1995–2004)
Length of Stay for Hospitalizations for Suicide Attempts
An acute psychiatric unit is defined as a setting serving those in a psychiatric crisis with immediate carein a hospital environment. Figure 15 provides the average length of stay within an acute psychiatricunit for attempted suicide by sex and age. Females between the ages of 60 and 79 had the longestaverage length of stay in hospital with, on average, over 30 days of hospitalization. Males in the sameage group had the second highest lengths of stay (average of 28 days).
Figure 15: Average length of stay by sex and age for suicide attempts withinan acute psychiatric setting (1995–2004)
26
Su
icid
e a
nd
Atte
mp
te
d S
uic
ide
in
No
va
Sc
otia
One year prior to a hospitalization for attempted suicide, those in lower income quartiles visitedmental health clinics, emergency rooms, and general practitioners more frequently for a mentaldisorder than those in higher income quartiles.F
AC
T
0
1
2
3
4
5
6
Mental health clinic Emergency room Hospitalization Psychiatrist General practitioner
Aver
age
no. o
f vis
its
Provider
Lower income (Q1 and Q2) Higher income (Q3 and Q4)
0
10
20
30
0–19
20–3
9
40–5
9
60–7
9
80+
0–19
20–3
9
40–5
9
60–7
9
80+
Ave
rage
leng
th o
f st
ay in
day
s
Age category and gender
Male
Female

In a non-psychiatric medical setting, senior males had the longest average lengths of stay (average of 24days) for a suicide attempt (Figure 16).
Figure 16: Average length of stay by sex and age for suicide attempts within anon-psychiatric setting (1995–2004)
Su
icid
e a
nd
Atte
mp
te
d S
uic
ide
in
No
va
Sc
otia
27
0
10
20
30
0–19
20–3
9
40–5
9
60–7
9
80+
0–19
20–3
9
40–5
9
60–7
9
80+
Age category and gender
Male
Female
Ave
rage
leng
th o
f st
ay in
day
s


Mortality Due to Suicide
Deaths by Suicide: The National Context
Nova Scotia’s suicide rate in 2004 of 9 per 100,000 population was below the national average of 11per 100,000 population, according to data compiled through Statistics Canada (Statistics Canada n.d.)(Figure 17). Nova Scotia’s suicide rate was not significantly different from Ontario, Prince Edward Island,British Columbia, Saskatchewan, and Manitoba. The dark line in the centre of the chart indicates thenational average.
Figure 17: Age-adjusted suicide rates selected Canadian provinces (2004)
Overall Mortality in a Provincial Context (2001–2004)
There were 36,669 mortalities (all causes) amongst all ages between fiscal years 2001 and 2004 in NovaScotia—an average of over 8,165 deaths per year. As indicated in the top half of Figure 18, thenumber of deaths increased steadily with age, and most deaths occurred in individuals who were 70years of age or older. The second half of Figure 18 provides a frequency of death by cause of death foreach age category. Overall suicide was not a frequent cause of death. However, the figure demonstratesthat suicide frequency as a cause of death was most pronounced amongst those aged 15-44.
Su
icid
e a
nd
Atte
mp
te
d S
uic
ide
in
No
va
Sc
otia
29
Nova Scotia’s suicide rate (9 per 100,000 individuals) was lower than thenational average (11 per 100,000 individuals) in 2004.
FA
CT
0
5
10
15
PE ON NS NL BC MB SK NB AB QC
Dea
ths
per
100,
000
peop
le
By province

Figure 18: External cause for all deaths in Nova Scotia (2001–2004)
Injury-related Deaths in Nova Scotia
There were 1,781 injury-related deaths amongst all ages between fiscal years 2001 and 2004, anaverage of just under 445 injury-related deaths per year. As can be seen in Figure 19, injury-relateddeaths increased substantially in the 15- to 19-year age group, continued to rise until the mid-40s,declined slightly until the mid-60s, and then increased again until they peaked in the oldest age group(90+). The second half of Figure 19 provides a frequency of injury-related deaths by cause of death foreach age category.
Figure 19: External cause for injury deaths in Nova Scotia (2001–2004)(excluding medical complications)
30
Su
icid
e a
nd
Atte
mp
te
d S
uic
ide
in
No
va
Sc
otia
Suicide frequency as a cause of death was most pronounced amongst those aged 15–44.FACT
0%
20%
40%
60%
80%
100%
Perc
enta
ge
Age group (years)
Suicide Other Injuries Respiratory Circulatory Cancer All other causes
0
2000
4000
6000
No.
of d
eath
s
< 1 1-4
5-9
10-1
4
15-1
9
20-2
4
25-2
9
30-3
4
35-3
9
40-4
4
45-4
9
50-5
4
55-5
9
60-6
4
65-6
9
70-7
4
75-7
9
80-8
4
85-8
9
90+
0
50
100
150
200
No.
of i
njur
y de
aths
0%
25%
50%
75%
100%
<1
1–4
5–9
10–1
4
15–1
9
20–2
4
25–2
9
30–3
4
35–3
9
40–4
4
45–4
9
50–5
4
55–5
9
60–6
4
65–6
9
70–7
4
75–7
9
80–8
4
85–8
9
90+
Perc
enta
ge o
f inj
ury
deat
h by
cau
se
Age group (years)
Suicide Falls MVC Other

Overall Trends in Completed Suicides (1995–2004)
There were 885 suicide deaths recorded in the provincial vital statistics registry during the years1995–2004 (an annual average of 88.5). The rate declined over the 10-year period (Figure 20);however, this decline was not found to be statistically significant (p>0.05).12
Figure 20: Age-adjusted rates for suicide-related mortality in Nova Scotia(1995–2004)
Su
icid
e a
nd
Atte
mp
te
d S
uic
ide
in
No
va
Sc
otia
3112. Age-adjusted rates of completed suicide were also calculated and did not show a variation in trend from the
crude rate.
The Canadian Institute for Health Information reported in 2001 that in Canada “there were 1,012deaths due to suicides and self-inflicted injuries (including poisonings) in 1998–99. The majority(79%) of these suicide-related deaths was among men and the mean age of death was 44.”(Canadian Institute for Health Information 2001)F
AC
T
0
5
10
15
1995
1996
1997
1998
1999
2000
2001
2002
2003
2004
No.
per
100
,000
peo
ple
Fiscal year
11 per 100,000
8.5 per 100,000
The rate of suicide death in Nova Scotia declined from 11 per100,000 individuals in 1995 to 8.5 per 100,000 individuals in 2004.This decline was not statistically significant.F
AC
T

History of Prior Attempts of Completed Suicides (1995–2004)
A greater percentage of females were hospitalized previously for a suicide attempt prior to completingsuicide than males (Figure 21).
Figure 21: Frequency of previous history of hospitalizations for suicide attempt prior to death (1995–2004)
Sex Differences in Completed Suicides
Numerically, 84% of those who completed suicide in the years 1995–2004 were male (Figure 22).Males more frequently used means with greater lethality, such as firearms, to complete a suicide, whilefemales tended to choose less immediately lethal means, such as poisoning. Figure 23 shows the ratesof suicide for males and females in Nova Scotia per 100,000 residents during the fiscal 1995–2004timeframe (the declines observed in the chart were not statistically significant). This sex difference in thepercentage of attempted versus completed suicides is a consistent trend across Canada and much of theindustrialized world. In general, women have higher rates of attempted suicide, while men have higherrates of completed suicide.
Figure 22: Percent of suicides by sex (1995–2004)
32
Su
icid
e a
nd
Atte
mp
te
d S
uic
ide
in
No
va
Sc
otia
Female 16%
Male 84%
0%
5%
10%
15%
Female Male
Perc
enta
ge w
ith
prio
r att
empt
s

Figure 23: Age-adjusted suicide rates (with 95% confidence intervals) by sex inNova Scotia (1995–2004)
Age Differences in Completed Suicide
Figure 24 provides death rates due to completed suicide by age group. Males between 50 and 54 yearsof age had the highest rate of completed suicide, at over 25 deaths per 100,000. The highest femaleage category was between the ages of 40 and 44, at 6 deaths per 100,000.
Figure 24: Annual death rate (with 95% confidence intervals) for suicide byage group and sex (1995–2004)
Su
icid
e a
nd
Atte
mp
te
d S
uic
ide
in
No
va
Sc
otia
33
Males accounted for 84% of all suicide deaths between 1995 and 2004, eventhough 55% of hospitalizations for suicide attempts were female.
FA
CT
0
5
10
15
20
25 19
95
1996
1997
1998
1999
2000
2001
2002
2003
2004
No.
per
100
,000
peo
ple
Fiscal year (1995–2004)
Male
Female
19.5 per 100,000
3.8 per 100,000
14 per 100,000
3.1 per 100,000
0
10
20
30
10–1
4
15–1
9
20–2
4
25–2
9
30–3
4
35–3
9
40–4
4
45–4
9
50–5
4
55–5
9
60–6
4
65–6
9
70–7
4
75–7
9
80–8
4
85+
Aver
age
no. o
f de
aths
per
100
,000
Age group (years)
Female Male
0
10
20
30
Aver
age
no. o
f de
aths
per
100
,000
(b
y se
x)
Rates of suicide were highest amongst males between the ages of 35 and 59.FACT

The higher proportion of males completing suicide is consistent with ratios across Canada and mostwestern countries.
• In Nova Scotia the male-female ratio for completed suicide is approximately 4.5 to 1.
• Throughout Canada the ratio has generally been around 4 to 1 (Langlois and Morrison 2002).
• Amongst western countries the male-female ratio has ranged from 2 to 1 in the Netherlands to 7 to 1in Greece (Langlois and Morrison 2002).
Methods of Completing Suicide
Figure 25 provides a distribution of the methods used to complete suicide in Nova Scotia by sex.Among men, firearms were the most frequent means of completing suicide. Ninety-six per cent ofsuicide deaths by firearms were completed by males. Hanging, strangulation, or suffocation was thesecond most frequent means of suicide; most of these were hangings.13 Poisoning was the third mostfrequent cause of suicide death.
As can be observed in Figure 25, the methods used in completed suicides differ from those used inattempted suicide (Figure 6, p. 19). This is largely because certain methods have a much higher degreeof lethality. In other words, some methods are used less frequently in suicide attempts, but have a veryhigh likelihood of causing death.
Figure 25: Frequency of suicide deaths by sex and method 1995–2004
34
Su
icid
e a
nd
Atte
mp
te
d S
uic
ide
in
No
va
Sc
otia
13. Ninety-eight per cent of this category was estimated to be hanging, while 2% was estimated to be suffocationby plastic bag. Unlike the ICD-9 coding system, the ICD 10 system does not divide the hanging, strangulation,and suffocation category of suicide into sub-categories. Therefore, dividing this category into sub-categorieswas possible only for suicides between the years 1995 and 1999.
Ninety-six per cent of suicide deaths by firearms were completed by males.FACT
0 100 100 200 200 300 300
Cutting / piercing
Jump (high places)
Other
Drowning / submerging
Poisoning
Hanging / strangulation
Firearms
Female
No. of suicide deaths
Mea
ns
Male

Table 3: Estimated lethality of suicidal methods in Nova Scotia (1995–2004)
Percentage of suicide Method of suicide attempt attempts resulting in death
Firearms 88%
Drowning/submerging 74%
Hanging/strangulation/suffocation 70%
Jumping from high places 42%
Poisoning—overall 4%
Poisoning by type
• motor vehicle exhaust/other gases and vapours 62%
• other and unspecified drugs, medicaments, 8% and biological substances
• anti-convulsion, sleep, depression, 1%and/or anxiety medications
• non-narcotic pain, fever, or anti-inflammatory medications 1%
• other 3%
Cutting/piercing 3%
It is possible to estimate the lethality of suicidal methods provincially by dividing the number of suicidedeaths in each category by the total number of attempts in that category.14 As can be observed fromTable 3, when a firearm was used in a known suicide attempt, approximately 88% of cases resulted indeath. Overall, there was a only a 4% chance of death for individuals who used poisoning as theirmethod of attempted suicide; however, the inhalation of motor vehicle exhaust and other gases, whileused less frequently than other poisonings in attempted suicide, had a high degree of lethality.
Approximately 81% of suicide deaths caused by a firearm were unknown discharges. The other 19%were caused by a shotgun, hunting rifle, or large firearm. There were no known handgun dischargesrecorded. Access to firearms has been identified as a risk factor for suicide in rural areas (Dresang 2001).There is research demonstrating that homes with guns are five times more likely to be the scene of asuicide death than homes without guns (Kellermann et al. 1993). Hanging was also a lethal form ofsuicide and, unlike firearms or drugs, is a more readily accessible means. For this reason, hanging hasbeen a frequent method of suicide among young adults and individuals in controlled environments suchas prisons or correctional services. Age and urban/rural status were also factors that influenced themethod by which individuals made a suicidal act.15
Su
icid
e a
nd
Atte
mp
te
d S
uic
ide
in
No
va
Sc
otia
35
14 . Estimate of total suicidal episodes is calculated by adding hospitalizations for suicide attempt by cause with the total number of suicide deaths by cause. Lethality of means = deaths by suicide/[(hospitalizations forattempted suicide-hospitalizations that result in hospital death) + total suicide deaths].
15. Individuals who attempted or completed suicide and who were over the age of 59 or living in rural areas weremore likely to use a firearm in a suicide act (hospitalizations for suicide attempt + suicide completions), duringyears 1995–2004. Two binary logistic regressions were conducted to assess the validity of the relationshipbetween those over 59 and urban/rural status on firearms use in suicide acts. Both of these tests showed asignificant relationship with firearms usage (p-values ≤ 0.05).

Nearly a third of all self-poisoning deaths were due to carbon monoxide poisoning by means of motorvehicle exhaust or other gases and vapours (Figure 26), 38% were from medications and biologicalsubstances, and 18% were from anti-convulsion, sleeping disorder, depression/anxiety drugs.
Figure 26: Percentage of self-poisoning deaths by type (1995–2005)
Suicide and Socio-demographic Factors
While individuals in rural and urban settings utilized different methods to complete suicide, Figure 27indicates that the number of completed suicides is approximately similar to the distribution of urban andrural residents in Nova Scotia. Fifty-five per cent of completed suicides occurred in urban areas, while45% occurred in rural areas, which is very similar to the urban/rural frequency of Nova Scotians asdefined in this study.
Figure 27: Frequency of rural and urban completed suicides in Nova Scotia,(1995–2004)
36
Su
icid
e a
nd
Atte
mp
te
d S
uic
ide
in
No
va
Sc
otia
Rural 45%
Urban 55%
Anti-convulsion, sleep,depression and or anxiety
medication 18%
Non-narcotic pain, fever or anti-inflammatory medication 4%
Medications and/orbiological substance
38%
Motor vehicle exhaust and other gases and vapours
35%
Other 5%
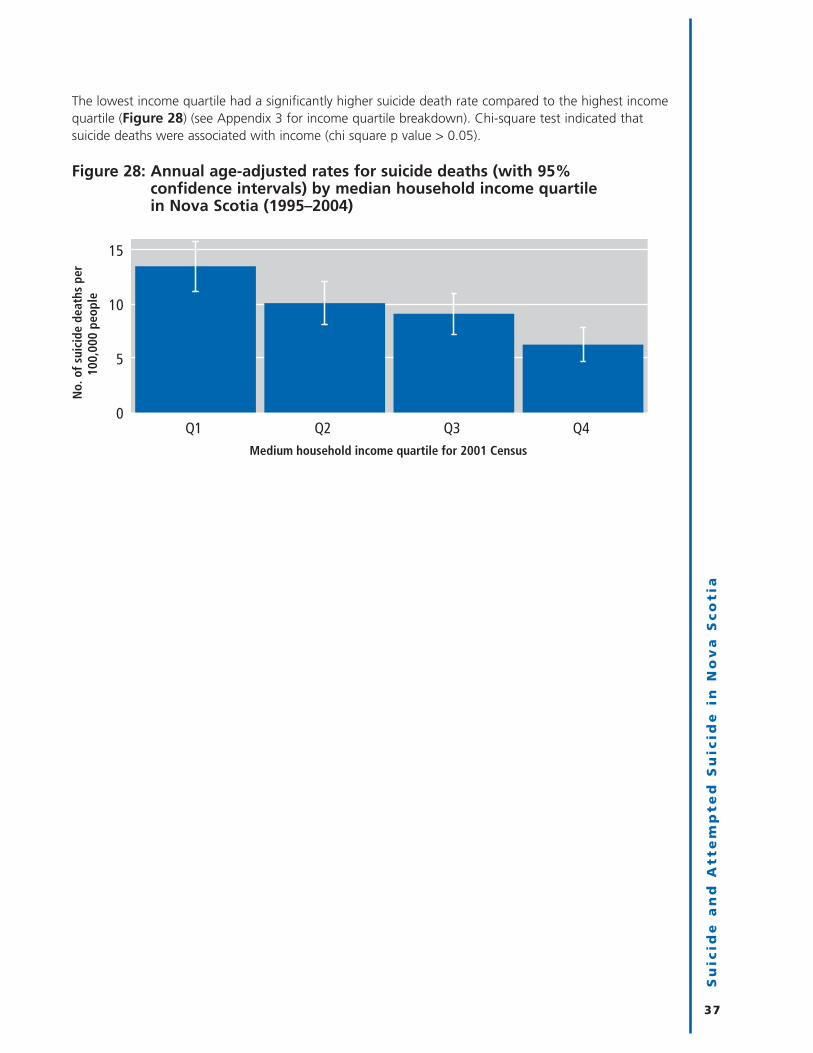
The lowest income quartile had a significantly higher suicide death rate compared to the highest incomequartile (Figure 28) (see Appendix 3 for income quartile breakdown). Chi-square test indicated thatsuicide deaths were associated with income (chi square p value > 0.05).
Figure 28: Annual age-adjusted rates for suicide deaths (with 95% confidence intervals) by median household income quartile in Nova Scotia (1995–2004)
Su
icid
e a
nd
Atte
mp
te
d S
uic
ide
in
No
va
Sc
otia
37
0
5
10
15
Q1 Q2 Q3 Q4
No.
of s
uici
de d
eath
s pe
r10
0,00
0 pe
ople
Medium household income quartile for 2001 Census


Suicide, Mental Health, and the Health System
Most Recent Mental Health Disorder Contact Prior to Suicide
Between 1995 and 2004, 27% of individuals who completed suicide had a last mental disorder contactwith health providers within one month preceding their death, and 55% had a mental disorder contactwithin one calendar year preceding death (Figure 29). As observed in Figure 29, the most frequent finalmental disorder contact prior to death was with family doctors or psychiatrists. Although the fact thatindividuals who complete suicide are likely to seek care close to the event is a necessary condition forclinicians to intervene, it may not be sufficient (Pirkus and Burgess 1998, 472). Some studies have foundthat visits by suicidal patients to their family physician prior to their suicide often involve simply receivinga repeat prescription (Obafunwa and Busuttil 1994, 428–32). Thus, a better understanding of the extentand nature of final contacts prior to death is necessary to establish if modifiable risk factors wereapparent.
Figure 29: Most recent mental disorder contact with health system providersfor individuals who completed suicide (1995–2004) by time frameand provider type
Su
icid
e a
nd
Atte
mp
te
d S
uic
ide
in
No
va
Sc
otia
39
0%
10%
20%
30%
40%
50%
60%
1 month prior to death 1 year prior to death
Perc
enta
ge
Time prior to death
Emergency visit
Hospital discharge
Visit to mental health clinic
Visit to family doctor
Visit to psychiatrist
Twenty-seven per cent of the suicide population had a last mental disorder contact with healthproviders within one month preceding their death, and 55% had a mental disorder contact withinone calendar year preceding death.F
AC
T

Likelihood of Being in Contact with a Health Provider
Between the years 1995 and 2004, individuals who completed suicide were more likely than the overallNova Scotia population to be treated by health-care services (provincial mental health clinics, emergencyrooms, psychiatrists, family physicians, or hospitals) for a mental disorder (Figure 30).16
Figure 30: Percentage of people with one or more mental disorder contacts inone year by provider type and health status (1995–2004)
40
Su
icid
e a
nd
Atte
mp
te
d S
uic
ide
in
No
va
Sc
otia
16. This analysis compares the percentage of the suicide population that had a mental health contact with aprovider one year prior to death to the average percentage contact during years 1995–2004 of the rest of theNova Scotia population in a fiscal year.
Of the individuals who completed suicide between the years 1995 and 2004
• Forty-five per cent visited a family physician for a mental disorder one or more times oneyear prior to their death.
• Eleven per cent visited a psychiatrist for a mental disorder one or more times one year priorto their death.
• Fifteen per cent visited an emergency ward for a mental disorder one or more times oneyear prior to their death.
• Sixteen per cent visited a mental health clinic for a mental disorder one or more times oneyear prior to their death.
• Twenty-one per cent were discharged from the hospital for a mental disorder one or moretimes one year prior to their death.
FA
CT
S
0%
15%
30%
45%
Perc
enta
ge o
f pop
ulat
ion
wit
h a
prov
ider
co
ntac
t fo
r m
enta
l hea
lth
Provider type
Visited a mental health
clinic
Was discharged from a hospital
Visited an emergency department
Visited a psychiatrist
Visited a family physician
Overall NS population
Individuals whodied by suicide

Severity of Mental Disorder and Suicide
Risk factors often cited to be associated with suicide include mental disorders, social isolation, substanceabuse, traumatic life events, terminal illness, and a family history of suicide (Langlois and Morrison2002). Suicide is not technically defined or coded administratively as a mental illness; however, peoplewho are prepared to end their own lives often require treatment and assistance from families,communities, and the health system for their mental health problems. Provincially, the most commonlytreated mental disorders were anxiety and depression. More-severe mental disorders, such as bipolardisorder and schizophrenia, generally occur in close to 1% of the population. Such individuals generallyrequire more intensive and consistent levels of care (McAlpine and Mechanic 2000).
Although the diagnosed population with severe mental disorders made up close to 1% of the totalNova Scotia population in years 1995–2004, they made up approximately 11% of individuals whocompleted suicide (Figure 31). Forty-four per cent of the suicide population had a history of othermental disorders, and the remainder had no prior treatment for a mental disorder. As can be observed,there was a greater proportion (45%) of completed suicides without a prior mental health contact thanattempted suicides without a prior mental health contact (Figure 11, 23% as shown on p. 22).
Figure 31: Proportion of completed suicides by severity of mental disorder(1995–2004)
Su
icid
e a
nd
Atte
mp
te
d S
uic
ide
in
No
va
Sc
otia
41
Suicide population with severe mental disorders
11%
Suicide populationwith other mental
disorders 44%
Non-diagnosed45%
• Forty-five per cent of completed suicides did not have a diagnosis for a mental disorder.
• Eleven per cent of completed suicides had a previous diagnosis of severe mental disorder(s).
• Forty-four per cent of completed suicides had a previous diagnosis of other mental disorder(s).
FA
CT
S

As can be observed from Figure 32, the rates of completed suicide amongst those with severe mentaldisorders were close to 133 per 100,000 people. This was roughly 7 times the rate of those with othermental disorders and 25 times the rate for Nova Scotians without any known mental disorders.
Figure 32: Rates of completed suicide (with 95% confidence intervals) bypopulations diagnosed with mental disorders—annual age-adjustedrates (1995–2004)
Generally, there are different utilization patterns for mental health services depending upon the severityof mental disorders (McAlpine and Mechanic 2000, 277–92). As can be observed from Figure 33, thetotal population with severe mental disorders who attempted or completed suicide (781 individualsmade 1,072 attempts) averaged more than seven visits with a family physician in the year prior to theirsuicide episode, compared to under five visits for the total population who attempted or completedsuicide with other mental disorders (3,497 individuals made 4,366 attempts).17 Those persons withsevere mental disorders who attempted or completed suicide averaged over twice as many visits topsychiatrists as those with less severe mental disorders who attempted or completed suicide.
As has been observed in other research, those with severe mental disorders were much more likely torepeatedly use inpatient, emergency room, and outpatient services (McAlpine and Mechanic 2000, 284).Persons with severe mental disorders who attempted or completed suicide had more than double thenumber of emergency room visits and discharges from the hospital and close to four times the numberof visits to mental health clinics as those with other mental disorders who attempted or completedsuicide (p values ≤ 0.05).
42
Su
icid
e a
nd
Atte
mp
te
d S
uic
ide
in
No
va
Sc
otia
17. Average number of contacts is the mean number of contacts individuals who have attempted suicide(subtracted by those who died in hospital) and those who completed suicide during years 1995–2004.
0
20
40
60
80
100
120
140
Undiagnosed Other mental disorders
Severe mental disorders
Rate
per
100
,000
peo
ple
Select populations
It has been observed thatsustained treatment ofpersons with severe mentalillness can reduce risks forhospitalization. (McAlpineand Mechanic 2000)
FA
CT

Figure 33: Average number of annual contacts (with 95% confidence intervals)for individuals one year prior to a suicidal act (1995–2004)
Completed Suicides without Any Health System Contacts
Some estimates indicate that 90% of people who complete suicide suffer from mental illness or asubstance abuse disorder that could be diagnosed (Conwell 1995). It cannot be over-emphasized howchallenging it is to identify individuals with suicidal intent before an attempt occurs. The World HealthOrganization estimates that, internationally, one in four patients visiting a health service has at least onemental, neurological, or behavioural disorder, but most of these disorders are undiagnosed anduntreated (World Health Organization 2008).
As discussed previously, 45% of individuals who completed suicide had no contact for a mental disorderwith health system providers prior to their suicide death (Figure 31). The age distribution, on the bottomchart of Figure 34, demonstrates that youth (ages 0–19) and individuals over the age of 80 had theleast contact with the health-care system for a mental disorder. The top graph demonstrates that therewas no pattern amongst age groups for treatment of any kind from the health system. What Figure 34demonstrates is that while there was no discernable pattern for overall health system usage by allgroups prior to a completed suicide, youth and those aged 80 and over were not seeing or beingdiagnosed specifically for mental disorders by health providers. Mental disorders often co-occur withother serious illnesses such as chronic diseases. As many older adults face these illnesses more frequently
Su
icid
e a
nd
Atte
mp
te
d S
uic
ide
in
No
va
Sc
otia
43
0 1 2 3 4 5 6 7 8 9 10 11 12
Visit to mental health clinic
Visit to emergency room
Outpatient of hospital
Visit to psychiatrist
Visit with a general practitioner
Average no. of prior visits
Prov
ider
Suicide population with other diagnosed mental illnesses Suicide population with previous severe mental illness diagnosis
• According to the World Health Organization, internationally “[m]ental disorders (particularly depression andsubstance abuse) are associated with more than 90% of all cases of suicide; however, suicide results frommany complex socio-cultural factors and is more likely to occur particularly during periods of socioeconomic,family and individual crisis situations (e.g., loss of a loved one, employment.” (World Health Organization2008a)
• Depression is the most frequent psychiatric disorder in the elderly. It is the reason for most suicides in thisage group. (Stoppe et al. 1999, 193–98)
• Approximately 10% of patients with schizophrenia die by suicide, 18% to 55% attempt suicide at some pointin their lives. (Radomsky et al. 1999, 1590)
FA
CT
S

than younger populations, mental disorders may go undetected or untreated as the focus of families,health professionals, and the patients themselves is with treating other ailments (Public Health Agencyof Canada 2006). There is also evidence that primary care practitioners may be less aware of diagnosesand procedures for children with mental disorders than they are for adults (Kutcher and Davidson 2007).
Figure 34: Percentage of suicide deaths without health system contacts oneyear prior to death (1995–2004)
44
Su
icid
e a
nd
Atte
mp
te
d S
uic
ide
in
No
va
Sc
otia
0%
25%
50%
75%
100%
0%
25%
50%
75%
100%
0–19 20–39 40–59 60–79 80+
Perc
enta
ge o
f sui
cide
sw
itho
ut m
enta
l dis
orde
rco
ntac
ts w
ith
prov
ider
s
Perc
enta
ge o
f sui
cide
s w
itho
ut a
ny h
ealt
h pr
ovid
er c
onta
cts
Age group (years)

Summary of Facts
Hospitalization for Suicide Attempts
• Suicide was the second largest category for injury-related hospitalizations across Nova Scotia(excluding medical complications and adverse events).
• The data indicate that the rate of hospitalizations for attempted suicide declined from 77 individualsper 100,000 people in 1995 to 54 individuals per 100,000 people in 2004.
• Fifty-five per cent of hospitalizations for suicide attempts were by females. The sex disparity was moreapparent among younger age groups and declined with age.
• Poisonings were by far the most frequent method of suicide attempts resulting in hospitalization inNova Scotia from 1995 to 2004. Females constituted 59% of hospitalizations due to self-poisoning.Males were more likely than females to be hospitalized for all other means of attempted suicide.
• Non-narcotic pain, fever, or anti-inflammatory pills were numerically used most frequently by teenagersand young adults in self-poisonings; whereas older individuals more frequently made use of anti-convulsion, sleep, depression, and/or anxiety medications to attempt suicide.
• Females between the ages of 15 and 19 had the highest hospitalization rate for attempted suicide ofany age category.
• There were higher rates of hospitalization for attempted suicide in lower income quartiles than inhigher income quartiles.
• It is estimated that 93% of known suicide attempts occurred within the home before beinghospitalized.
• In 84% of suicide attempts with a prior history of substance abuse there was also a history oftreatment for mental disorders.
• Individuals who had a history of concurrent disorders and who attempted suicide were four timesmore likely to be hospitalized multiple times for a suicide attempt than individuals with only one typeof disorder who attempted suicide.
• Within one year prior to a hospitalization for attempted suicide, 87% of individuals had a prior healthservice contact for a mental disorder, with either a family practitioner, psychiatrist, emergency room,hospital, or mental health clinic.
• There were fewer visits to emergency room services and psychiatric services for a mental disorder, oneyear prior to the attempt, for rural individuals than in cases where the individual had an urbanresidence.
• There were a greater number of visits, one year prior to the attempt, to mental health clinics,emergency rooms, and general practitioners by individuals in lower income quartiles, than byindividuals in higher income quartiles.
• Hospitalizations for suicide attempts by individuals without previous mental disorder diagnoses werestatistically more common among males and rural residents.
• In all of the hospitalizations for a suicide attempt in years 1995–2004 by individuals 60 and older,23% had a previous hospitalization for “another reason”—other than for mental health compared to7% for those under age 60.
Su
icid
e a
nd
Atte
mp
te
d S
uic
ide
in
No
va
Sc
otia
45

Completed Suicides
• In 2001, Nova Scotia’s suicide rate was lower than the national average; it was not significantlydifferent from Ontario, Prince Edward Island, British Columbia, Saskatchewan, or Manitoba.
• Nova Scotia’s suicide rate declined over the 1995–2004 period. This decline was not considered to bestatistically significant.
• Numerically, 84% of completed suicides were by males.
• Males between the ages of 50 and 54 had the highest rate of completed suicide.
• Use of firearms was the most frequent means of suicide death in Nova Scotia. Hanging, strangulation,or suffocation was the second most common means of completing suicide. Younger people tended touse hanging, strangulation, and suffocation more frequently, while seniors more frequently usedfirearms.
• There was no noticeable difference in frequency of suicide death for urban or rural Nova Scotians.
• Twenty-seven per cent of those who completed suicide had a final mental disorder contact with thehealth system one month prior to their death. Fifty-five per cent of those who completed suicide had afinal mental disorder contact within one calendar year prior to their death.
• Individuals who completed suicide had a greater degree of contact with all health service providers formental disorders.
• Nova Scotians with severe mental disorders had higher rates of suicide, at about 133 people per100,000, compared to Nova Scotians with less severe mental disorders. Nova Scotians with othermental disorders, but not schizophrenia or bipolar disorder, had higher rates of suicide, at 18 per100,000, compared to Nova Scotians without any diagnosed mental disorder. Nova Scotians withoutmental disorder diagnoses or treatment had a suicide rate of 5 persons per 100,000.
• Those with severe levels of mental disorder who attempted or completed suicide utilized providerservices with greater frequency than those who were diagnosed with less severe mental disorders priorto their suicide death or hospitalization.
• Those who completed a suicide without having a mental health diagnosis were more frequently males,youths, or seniors.
46
Su
icid
e a
nd
Atte
mp
te
d S
uic
ide
in
No
va
Sc
otia

Appendix 1: Suicide ICD 9 & 10 Definition Codes
Suicide By Cause ICD-10 codes ICD-9 codes
Poisoning• exposure to anti-inflammatories, pain relievers, X60 950.0
and arthritis drugs
• exposure to antiepileptic, sedative-hypnotic, X61 950.1, 950.2, 950.3antiparkinsonism, and psychotropic drugs
• other and unspecified drugs, medicaments, X64 950.4, 950.5and biological substances
• motor vehicle exhaust and other gases and vapours X 66, X67 952.0
• other X62, X63, X65, 950.7
X68, X69
Hanging, strangulation, and suffocation X70 953.0, 953.1
Drowning and submersion X71 954
Firearms• intentional self-harm by handgun discharge X72 955.00, 955.07, 955.06, 955.04,
955.05, 955.02, 955.03, 955.01,
955.08, 955.09
• self-harm by rifle, shotgun, and larger firearm discharge X73 955.1, 955.2
• other and unspecified firearm discharge X74 955.4
Cutting and/or piercing with a sharp object X78 956
Jumping from a high place X80 957.0, 957.1, 957.9
Jumping or lying before moving object X81 958.0
Other• crashing of motor vehicle X82 958.5
• other specified means X83 958.8
• intentional self-harm by explosive material X75 955.50, 955.90, 955.57, 955.97,
955.56, 955.96, 955.94, 955.54,
955.55, 955.95, 955.92, 955.93,
955.52, 955.53, 955.51, 955.91,
955.58, 955.98, 955.99, 955.59
• intentional self-harm by blunt object X79
• steam, hot vapours, and hot objects X77 958.20, 958.27, 958.26, 958.24,
958.25, 958.22, 958.23, 958.21,
958.28, 958.29
• self-harm by unspecified means X84 958.9
• smoke, fire, and flames X76 958.1
Su
icid
e a
nd
Atte
mp
te
d S
uic
ide
in
No
va
Sc
otia
47

48
Su
icid
e a
nd
Atte
mp
te
d S
uic
ide
in
No
va
Sc
otia
Appendix 2: Mental Health Chapter Codes
ICD-9-CM: 290-316 ICD-10-CA: F00- F69, F90-F99
Organic/Dementia ICD-9-CM: 290, 293, 294, 310 ICD-10-CA: F00-F09
Substance Abuse ICD-9-CM: 291, 292, 303-305 ICD-10-CA: F10-F19
Schizophrenic Disorder ICD-9-CM: 295, 297, 298 ICD-10-CA: F20-F29
Depression ICD-9-CM: 296.2, 296.3, ICD-10-CA: F32, F33, F34.1300.4, 311
Bipolar Disorder ICD-9-CM: 296.0, 296.1, ICD-10-CA: F30, F31 296.4-296.8
Anxiety ICD-9-CM: 300.0, 300.2, ICD-10-CA: F40- F43 300.3, 308, 309
Other Neurotic ICD-9-CM: 300.1, 300.5-300.9, ICD-10-CA: F44, F45, F48Disorder 306, 307.8, 316
Conduct Disorder ICD-9-CM: 312, 314 ICD-10-CA: F90-F92
Other Mood Disorders ICD-9-CM: 301.1, 296.99, 296.90 ICD-10-CA: F34.0, F34.8, F34.9, F38, F39
Other ICD-9-CM: 301.2-301.9, 302, ICD-10-CA: F50-F69, F93-F95, 307.0-307.7, 307.9, 313 F98, F99

Appendix 3: Average Annual Income by Quartile
Median household income, obtained from the 2001 Canadian Census, varied across DHA (Table 4). Thehighest incomes were observed in Capital District Health Authority, where median household incomes inthe 50th percentile were higher than those in the 75th percentile for all other districts except ColchesterEast Hants (Figure 35).
District health authority 1st quartile 2nd quartile 3rd quartile 4th quartile
Annapolis Valley $0–$30,599 $30,600–$35,266 $35,267–$40,226 ≥ $40,227
Cape Breton $0–$24,859 $24,860–$31,832 $31,833–$39,024 ≥ $39,025
Capital $0–$34,053 $34,054–$44,482 $44,483–$58,328 ≥ $58,329
Colchester East Hants $0–$30,582 $30,583–$35,631 $35,632–$46,139 ≥ $46,140
Cumberland $0–$29,969 $29,970–$33,080 $33,081–$38,701 ≥ $38,702
Guysborough Antigonish Strait $0–$27,033 $27,034–$34,204 $34,205–$42,842 ≥ $42,843
Pictou County $0–$30,851 $30,852–$37,235 $37,236–$43,377 ≥ $43,378
South Shore $0–$30,253 $30,254–$37,437 $37,438–$42,171 ≥ $42,172
Southwest Nova $0–$29,949 $29,950–$34,473 $34,474–$41,543 ≥ $41,544
Nova Scotia $0–$30,127 $30,128–$37,088 $37,089–$45,891 ≥ $45,892
Figure 35. Average household income percentiles from 2001 Census by DHA18
Su
icid
e a
nd
Atte
mp
te
d S
uic
ide
in
No
va
Sc
otia
49
$0 $15,000 $30,000 $45,000 $60,000
Capital
Cape Breton
Guysborough Antigonish Strait
Pictou County
Cumberland
Colchester East Hants
Annapolis Valley
Southwest Nova
South Shore
Nova Scotia
Median household income† percentiles from 2001 Census (CND dollars)
DH
A
75th percentile
50th percentile
25th percentile
18. Median household income for neighbourhood was assigned to records at the level of dissemination area.


Reference ListCanadian Institute for Health Information. 2001. “Suicide Leading Cause of Injury-Related Deaths among Middle-Aged Men in Ontario, Reports CIHI.” News release, November 28, 2001.http://secure.cihi.ca/cihiweb/dispPage.jsp?cw_page=media_28nov2001_e (accessed February 2008).
Conwell, Yeates, and David Brent. 1995. “Suicide and Aging I: Patterns of Psychiatric Diagnosis.” InternationalPsychogeriatrics 2 (7): 149–64.
Dresang, Lee T. 2001. “Gun Deaths in Rural and Urban Settings: Recommendations for Prevention.” Journal of theAmerican Board of Family Practice 14 (2): 107–15.
Holley, Heather L., Gordon H. Fick, and Edgar J. Love. 1998. “Suicide Following an Inpatient Hospitalization forSuicide Attempt: A Canadian Follow-up Study.” Social Psychiatry and Psychiatric Epidemiology 33 (11):543–51.
Kellermann, Arthur L., et al. 1993. “Gun Ownership as a Risk Factor for Homicide in the Home.” New EnglandJournal of Medicine 329 (15): 1084–91.
Kutcher, Stan, and Simon Davidson. 2007. “Mentally Ill Youth: Meeting Service Needs.” Canadian MedicalAssociation Journal 176 (4): 417.
Langlois, Stéphanie, and Peter Morrison. 2002. “Suicide Deaths and Suicide Attempts.” Statistics Canada HealthReports 13 (2): 9–22.
McAlpine, Donna D., and David Mechanic. 2000. “Utilization of Specialty Mental Health Care among Persons withSevere Mental Illness: The Roles of Demographics, Need, Insurancee, and Risk.” Health Services Research 35 (1 Pt2): 278.
Nixon, Mary K, Paula Cloutier, and S. Mikael Jansson. 2008. “Nonsuicidal Self-Harm in Youth: A Population-BasedSurvey.” Canadian Medical Association Journal 178 (3): 306–312.
Obafunwa, J.O., and A. Busuttil. 1994. “Clinical Contact Preceding Suicide.” Postgraduate Medical Journal 70: 428-432.
Pearson-Nelson, Benjamin J., Lawrence E. Raffalovich, and Thoroddur Bjarnason. 2004. “The Effects of Changes inthe World Health Organization’s International Classification of Diseases on Suicide Rates in 71 Countries,1950–1999.” Suicide and Life-Threatening Behaviour 34 (3): 328–36.
Pirkis, J., and P. Burgess. 1998. “Suicide and Recency of Health Care Contacts. A Systematic Review.” British Journalof Psychiatry 173, no. 6: 472.
Public Health Agency of Canada. 2006. “What are some of the mental health issues facing seniors?” November 10,2006. http://www.canadian-health-network.ca/servlet/ContentServer?cid=1158426796164&pagename=CHN-RCS%2FCHNResource%2FFAQCHNResourceTemplate&lang=En&c=CHNResource (accessed February 2008).
Radomsky, Elizabeth., Gretchen L. Haas, John J. Mann, and John A. Sweeney. 1999. “Suicidal Behavior in Patientswith Schizophrenia and Other Psychotic Disorders.” American Journal of Psychiatry 156 (10): 1590.
Skinner, W.J. Wayne, Caroline P. O‘Grady, Christina Bartha, and Carol Parker. Concurrent Substance Use and MentalHealth Disorders: An Information Guide. Toronto: Centre For Addiction and Mental Health.
Statistics Canada. Table 102-0563. http://cansim2.statcan.gc.ca/cgi-win/cnsmcgi.exe?Lang=E&CANSIMFile=CII\CII_1_E.htm&RootDir=CII/ (accessed January 13, 2009).
Statistics Canada. 2001. 2001 Census Dictionary. 92-378-XIE. Ottawa: Statistics Canada.
Stoppe, Gabriela, Hagen Sandholzer, Claudia Huppertz, Hauke Duwe, and Juergen Staedt. 1999. “Family Physiciansand the Risk of Suicide in the Depressed Elderly.” Journal of Affective Disorders 54 (1): 193–98.
World Health Organization. 2007 International Statistical Classification of Diseases and Related Health Problems,10th Revision Version for 2007. www.who.int/classifications/apps/icd/icd10online (accessed February 2008).
———. 2008. Mental Health. http://www.who.int/mental_health/en/ (accessed 2008 February).
———. 2008a. Mental Health—Suicide Prevention (SUPRE).www.who.int/mental_health/prevention/suicide/suicideprevent/en/ (accessed January 2008).
Su
icid
e a
nd
Atte
mp
te
d S
uic
ide
in
No
va
Sc
otia
51


