sukuk vs. eurobonds: is there a difference in value-at · pdf filesukuk vs. eurobonds: is...
TRANSCRIPT
WP/07/237
Sukuk vs. Eurobonds: Is There a Difference in Value-at-Risk?
Selim Cakir and Faezeh Raei

© 2007 International Monetary Fund WP/07/237 IMF Working Paper Middle East and Central Asia Department
Sukuk vs. Eurobonds: Is There a Difference in Value-at-Risk?
Prepared by Selim Cakir and Faezeh Raei1
Authorized by Aasim Husain
October 2007
Abstract
This Working Paper should not be reported as representing the views of the IMF. The views expressed in this Working Paper are those of the author(s) and do not necessarily represent those of the IMF or IMF policy. Working Papers describe research in progress by the author(s) and are published to elicit comments and to further debate.
This paper assesses the impact of bonds issued according to Islamic principles (Sukuk), on the cost and risk structure of investment portfolios by using the Value-at-Risk (VaR) framework. The market for Sukuk has grown tremendously in recent years at about 45 percent a year. Sukuk provide sovereign governments and corporations with access to the huge and growing Islamic liquidity pool, in addition to the conventional investor base. The paper analyzes whether secondary market behavior of Eurobonds and Sukuk issued by the same issuer are significantly different to provide gains from diversification. The analysis, employing the delta-normal as well as Monte-Carlo simulation methods, implies such gains are present and in certain cases very significant. JEL Classification Numbers: G11, G15, G32, G39. Keywords: Islamic Finance, Sukuk, Sharia-Compliance, Eurobonds, Value-at-Risk,
Diversification. Authors’ E-Mail Address: [email protected]; [email protected]
1 The authors would like to thank Aasim Husain, Abbas Mirakhor, Carlos Pinerua, Svetlana Vtyurina, Zamir Iqbal, Giath Shabsigh, and Gene Leon for their valuable comments and useful discussions. We also thank Branden Laumann and Jaime Espinosa for their assistance in finalizing the paper.
2
Contents Page
I. Introduction ............................................................................................................................3
II. Data and Methodology ..........................................................................................................5 A. Data ...........................................................................................................................5 B. Methodology .............................................................................................................8
III. Application to Sukuk and Eurobonds ................................................................................10
IV. Conclusion .........................................................................................................................12 References................................................................................................................................13 Tables 1. Selected Issues of Sukuk........................................................................................................3 2. Characteristics of Sukuk and Conventional Bonds in the Study ...........................................7 3. Correlations of Weekly Returns of Sukuk and Conventional Bonds in Trade Weeks ........10 4. VaR Estimates......................................................................................................................11 Figure 1. Aggregate Issuance of Sukuk.................................................................................................5 Appendices 1. Algorithm for Monte Carlo Simulation ...............................................................................16 2. Variance-Covariance Matrix of Weekly Returns of Bonds in Trade Weeks.......................19 3. VaR Estimates for Portfolios of Equally Weighted Bonds..................................................20
3
I. INTRODUCTION
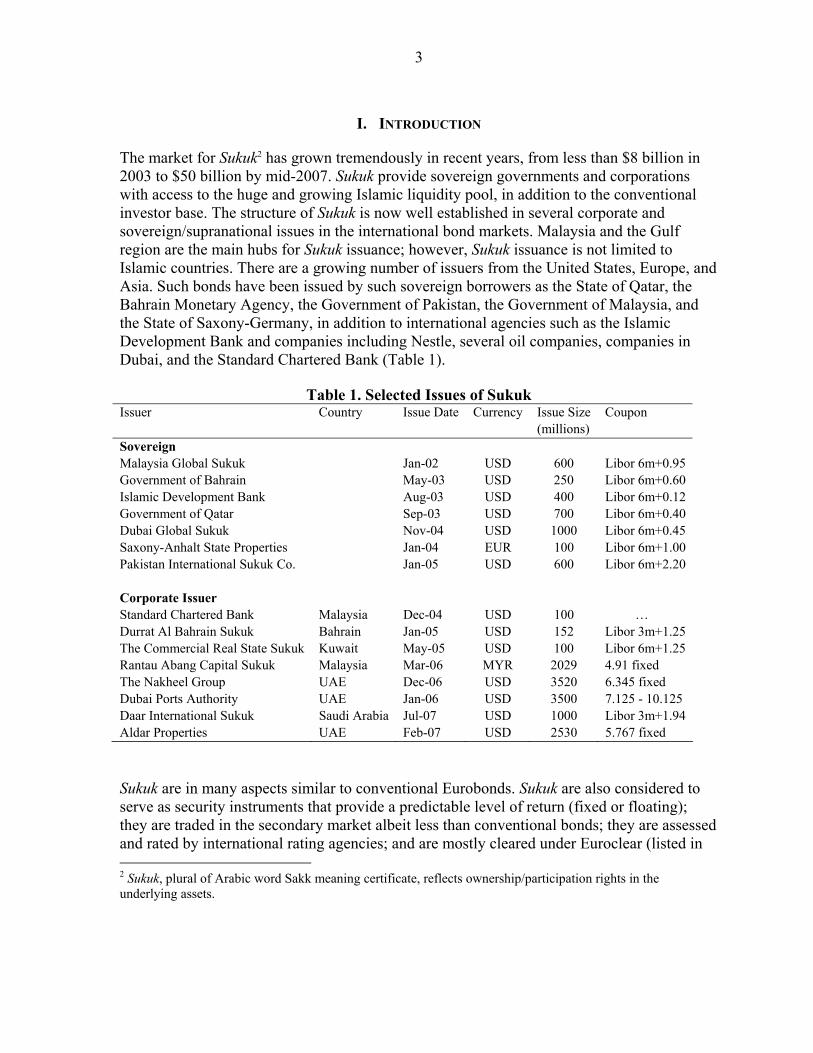
The market for Sukuk2 has grown tremendously in recent years, from less than $8 billion in 2003 to $50 billion by mid-2007. Sukuk provide sovereign governments and corporations with access to the huge and growing Islamic liquidity pool, in addition to the conventional investor base. The structure of Sukuk is now well established in several corporate and sovereign/supranational issues in the international bond markets. Malaysia and the Gulf region are the main hubs for Sukuk issuance; however, Sukuk issuance is not limited to Islamic countries. There are a growing number of issuers from the United States, Europe, and Asia. Such bonds have been issued by such sovereign borrowers as the State of Qatar, the Bahrain Monetary Agency, the Government of Pakistan, the Government of Malaysia, and the State of Saxony-Germany, in addition to international agencies such as the Islamic Development Bank and companies including Nestle, several oil companies, companies in Dubai, and the Standard Chartered Bank (Table 1).
Table 1. Selected Issues of Sukuk
Issuer Country Issue Date Currency Issue Size (millions)
Coupon
Sovereign Malaysia Global Sukuk Jan-02 USD 600 Libor 6m+0.95 Government of Bahrain May-03 USD 250 Libor 6m+0.60 Islamic Development Bank Aug-03 USD 400 Libor 6m+0.12 Government of Qatar Sep-03 USD 700 Libor 6m+0.40 Dubai Global Sukuk Nov-04 USD 1000 Libor 6m+0.45 Saxony-Anhalt State Properties Jan-04 EUR 100 Libor 6m+1.00 Pakistan International Sukuk Co. Jan-05 USD 600 Libor 6m+2.20 Corporate Issuer Standard Chartered Bank Malaysia Dec-04 USD 100 … Durrat Al Bahrain Sukuk Bahrain Jan-05 USD 152 Libor 3m+1.25 The Commercial Real State Sukuk Kuwait May-05 USD 100 Libor 6m+1.25 Rantau Abang Capital Sukuk Malaysia Mar-06 MYR 2029 4.91 fixed The Nakheel Group UAE Dec-06 USD 3520 6.345 fixed Dubai Ports Authority UAE Jan-06 USD 3500 7.125 - 10.125 Daar International Sukuk Saudi Arabia Jul-07 USD 1000 Libor 3m+1.94 Aldar Properties UAE Feb-07 USD 2530 5.767 fixed Sukuk are in many aspects similar to conventional Eurobonds. Sukuk are also considered to serve as security instruments that provide a predictable level of return (fixed or floating); they are traded in the secondary market albeit less than conventional bonds; they are assessed and rated by international rating agencies; and are mostly cleared under Euroclear (listed in 2 Sukuk, plural of Arabic word Sakk meaning certificate, reflects ownership/participation rights in the underlying assets.
4
Luxemburg). The convergence between Islamic and conventional finance, particularly in the case of Sukuk, is gaining momentum as foreseen by several scholars (Mirakhor 2007). This said, there are certain differences between conventional bonds and Sukuk. A bond represents the issuer’s pure debt, while Sukuk represent ownership stake in an underlying asset. For example, an Ijarah (lease)3 contract that is often used to structure sovereign Sukuk creates a lessee/lessor relationship which is different than a lender/borrower relationship. Investor protection mechanisms for Sukuk remain largely untested. Taxation could also become an issue for certain investors where the legal basis for taxation of Islamic securities is not legislated in the home country (Thuronyi, 2007). However, while Sukuk market is developing rapidly, it remains primarily a market where holders tend to keep bonds to maturity with limited secondary market trading (El Qorchi 2005). Sukuk offerings now appear on specialized exchanges such as the Dubai International Finance Exchange, the Labuan Exchange in Malaysia, and the Third Market in Vienna (Abdel-Khaleq and Richardson, 2007). In the West, London may emerge as the leading bridge between Islamic finance and more conventional sources of capital. The recent initiative to change tax laws has given Sukuk equivalent tax treatment with conventional bonds. Nevertheless, secondary market liquidity is expected to develop only gradually, as issuance picks up and investors become more familiar with the instruments. Do Sukuk provide the expected benefit from diversification to investors and issuers? If so, how significant are the gains from diversification? Alternatively, is the secondary market behavior of Eurobonds and Sukuk so similar that there is limited value in issuing Sukuk instead of Eurobonds? In order to shed light on these questions, this paper models the impact of Sukuk on hypothetical bond portfolios consisting of both Sukuk and Eurobonds and compares them to bond portfolios consisting only of Eurobonds. The application is limited to international issues of Sukuk and conventional bonds by the governments of Malaysia, Pakistan, Qatar, and Bahrain. The choice of issuers was dictated by the limited available data, particularly on secondary market trading. The chosen VaR methodology for evaluating risk is widely applied in the area of finance. The VaR approach measures the downside risk of a portfolio position as the maximum loss that can materialize at a future prescribed date with a given probability due to adverse changes in relevant asset and liability prices. Application of this methodology to bonds 3Under an Ijarah Sukuk, the bond issuer sells real estate assets to a Special Purpose Vehicle (SPV), which raises the funds by issuing Sukuk certificates. The SPV leases the assets back to the issuer, thus collecting rent which will be passed to Sukuk holders in the form of coupon payments. At the time of maturity, the SPV sells the assets back to the issuer at a predetermined price, thus collecting the principal and passing it to Sukuk holders. Some other Islamic bonds are based on profit sharing. In Mudarabah, an investor provides capital to an entrepreneur; the project’s profits are shared according to a predetermined ratio but any losses are borne solely by the investors. Under Musharakah, both investor and entrepreneur contribute resources to the project, any profits are shared at an agreed-upon ratio, and any losses are borne according to equity participation. Other Islamic instruments, Istisna and Salam are commonly used for the finance of working capital or production processes, where the financier pays for the working capital in advance and sells it to the borrower later (possibly at a mark-up). Salam is a deferred-payment or deferred-delivery sale, while Istisna is a joint object and price-deferred sale. For more details see Iqbal and Mirakhor (2006) and El-Gamal (2006).
5
requires a decomposition of the securities and an estimation of variances and covariance of returns on these securities. Variances and correlations of returns of each debt instrument are estimated from historical data. The analysis utilizes the VaR estimates, with data up to July 2007, to derive the covariance matrix of the shocks. The analysis generates several possible paths for the value of the bond portfolios using structured Monte Carlo simulations (10,000 replications) and delta-normal approach. The paper aims to contribute to the debate on the issuance of Sukuk as alternative investment/financing instruments. The rest of this paper is organized as follows. Section II describes the data and the methodology. Section III discusses bond portfolio simulations. Section IV provides some general conclusions.
II. DATA AND METHODOLOGY
A. Data
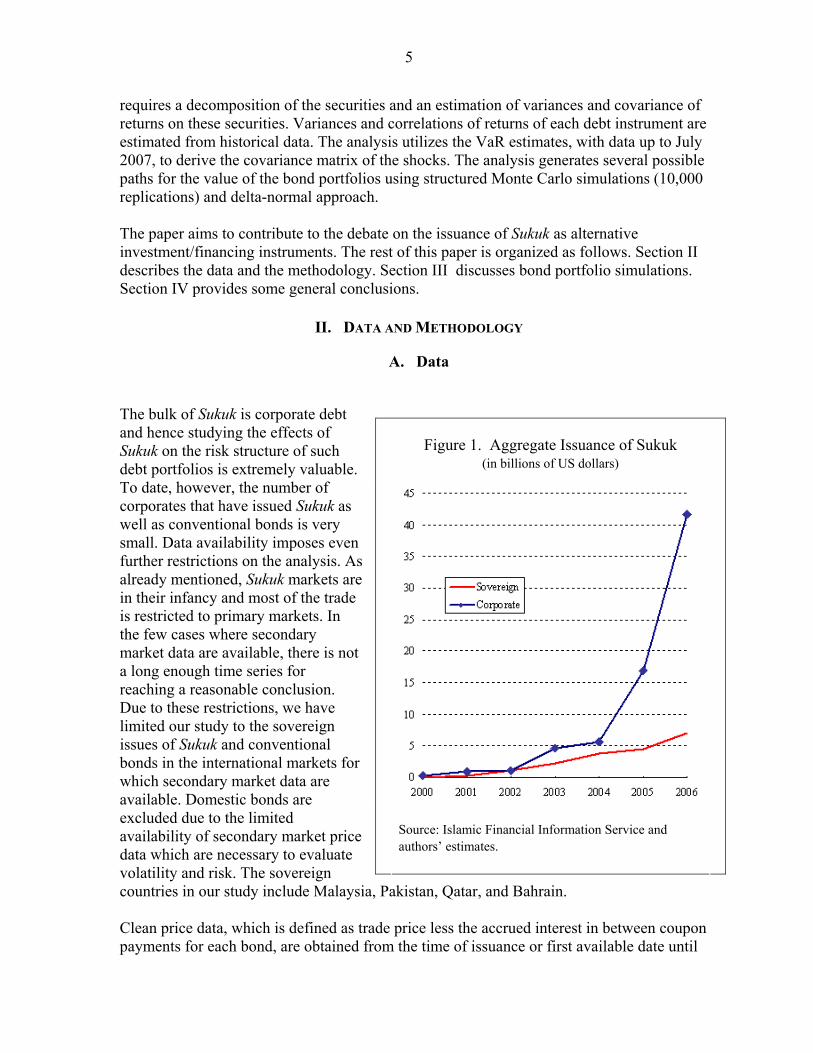
The bulk of Sukuk is corporate debt and hence studying the effects of Sukuk on the risk structure of such debt portfolios is extremely valuable. To date, however, the number of corporates that have issued Sukuk as well as conventional bonds is very small. Data availability imposes even further restrictions on the analysis. As already mentioned, Sukuk markets are in their infancy and most of the trade is restricted to primary markets. In the few cases where secondary market data are available, there is not a long enough time series for reaching a reasonable conclusion. Due to these restrictions, we have limited our study to the sovereign issues of Sukuk and conventional bonds in the international markets for which secondary market data are available. Domestic bonds are excluded due to the limited availability of secondary market price data which are necessary to evaluate volatility and risk. The sovereign countries in our study include Malaysia, Pakistan, Qatar, and Bahrain. Clean price data, which is defined as trade price less the accrued interest in between coupon payments for each bond, are obtained from the time of issuance or first available date until
Figure 1. Aggregate Issuance of Sukuk
(in billions of US dollars)
Source: Islamic Financial Information Service and authors’ estimates.
6
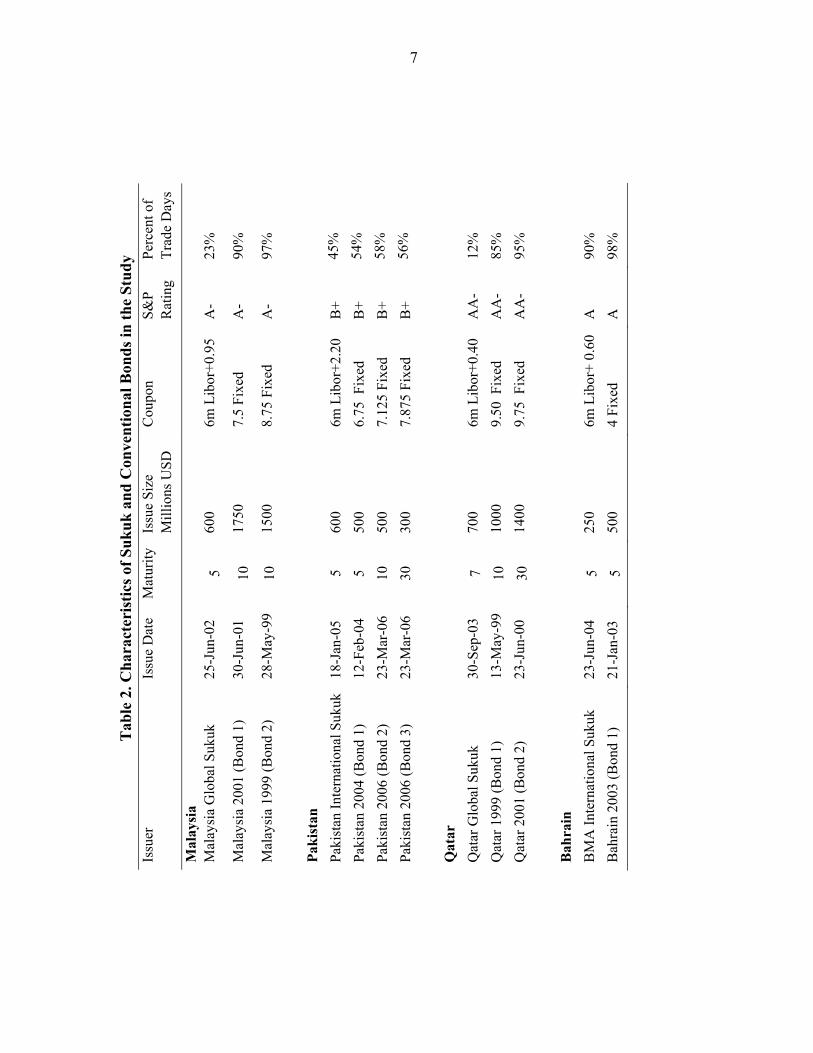
end-June 2007. From the clean price data, returns are calculated and used in the VaR calculations. The data originate from two different sources: weekly and daily prices are downloaded from DataStream for Malaysian, Pakistani, and Qatari bonds from the issue date through end-June 2007. The data for Bahrain is downloaded from Bloomberg; however, the data are available only from August 2006 rather than the original issue date. Table 2 lists the issue size, issue date, maturity, and coupon rate of each bond used in our calculations. Sukuk, at times contrary to other bonds by the same issuer, carry floating rate coupons which are indexed to Libor. Sukuk are smaller in size and have shorter maturities compared to Eurobonds issued by the same issuer. For each bond, the number of days in which a trade occurs as a fraction of total trading days is also reported. The numbers clearly show that Sukuk are traded less frequently compared to conventional bonds by the same issuer. The pattern is stronger for Malaysia and Qatar and less so for Pakistan and Bahrain.
7
Issu
er
Issu
e D
ate
Mat
urity
Issu
e Si
ze
Mill
ions
USD
C
oupo
n
S&P
R
atin
g Pe
rcen
t of
Trad
e D
ays
Mal
aysi
a
M
alay
sia
Glo
bal S
ukuk
25
-Jun
-02
5 60
0 6m
Lib
or+0
.95
A-
23%
Mal
aysi
a 20
01 (B
ond
1)
30-J
un-0
1 10
17
50
7.5
Fixe
d A
- 90
%
Mal
aysi
a 19
99 (B
ond
2)
28-M
ay-9
910
15
00
8.75
Fix
ed
A-
97%
Paki
stan
Paki
stan
Inte
rnat
iona
l Suk
uk
18-J
an-0
5 5
600
6m L
ibor
+2.2
0 B
+ 45
%
Paki
stan
200
4 (B
ond
1)
12-F
eb-0
4 5
500
6.75
Fix
ed
B+
54%
Paki
stan
200
6 (B
ond
2)
23-M
ar-0
6 10
50
0 7.
125
Fixe
d B
+ 58
%
Paki
stan
200
6 (B
ond
3)
23-M
ar-0
6 30
30
0 7.
875
Fixe
d B
+ 56
%
Q
atar
Q
atar
Glo
bal S
ukuk
30
-Sep
-03
7 70
0 6m
Lib
or+0
.40
A
A-
12%
Q
atar
199
9 (B
ond
1)
13-M
ay-9
910
10
00
9.50
Fix
ed
AA
- 85
%
Qat
ar 2
001
(Bon
d 2)
23
-Jun
-00
30
1400
9.
75 F
ixed
A
A-
95%
Bah
rain
B
MA
Inte
rnat
iona
l Suk
uk
23-J
un-0
4 5
250
6m L
ibor
+ 0.
60
A
90%
B
ahra
in 2
003
(Bon
d 1)
21
-Jan
-03
5 50
0 4
Fixe
d A
98
%
Tab
le 2
. Cha
ract
eris
tics o
f Suk
uk a
nd C
onve
ntio
nal B
onds
in th
e St
udy
8
B. Methodology
The Value-at-Risk method is used to test whether the introduction of Sukuk to bond portfolios creates any diversification benefits. Formally, VaR measures the worst expected loss of a portfolio over a certain holding period at a given confidence level, under normal market conditions (Jorion 2006). In other words, VaR is an expression of the portfolio’s market risk, representing the maximum amount which may be lost, during a holding period, in all but (say) one percent of cases. For example the VaR method can state with either one percent probability or a 99 percent confidence level that a certain amount of dollars will be lost in a given day, month, or year. Various methods, including simulation techniques are applied to estimate the distribution of future portfolio values and to calculate the possible losses by using historical data. VaR is based on the variance of the return on the portfolio:
'wwp Σ=σ (1)
Where =w vector of weights for the various securities in the portfolio,
'w = transposed vector of weights in the portfolio, and
=Σ variance-covariance matrix of returns on securities in the portfolio
The VaR of a portfolio can be constructed from a combination of the risks of underlying securities. In other words, it constitutes the envelope for the volatility of and correlation among various risk variables over time. Several methods can be used to calculate VaR. The variance-covariance approach, also called the delta-normal approach, is a commonly used method. The basic assumption in this method is that returns are jointly normally distributed. The normal curve conveniently enables us to determine where the worst 5% and 1% lie on the curve, depending on the confidence interval, mean and standard deviation. Hence we can calculate the portfolio value at risk by using equation (1):
VaRp = -(μp −α σpW) (2)
where α = standard normal deviate (e.g., 2.33 for the 99 percent confidence level),
μp = average return of the portfolio, and
W = initial portfolio value.
As is clear from the formula for the VaR of an asset, lower volatility implies a smaller VaR, which is desirable. In the case of a portfolio of assets, lower volatility is obtained if the returns of constituent assets have small or even negative correlations. Gains from
9
diversification arise by diversifying the portfolio to assets whose returns are not highly positively correlated. The normality assumption makes the VaR computation convenient although it has some drawbacks. Contrary to the symmetry embodied in normal distribution, asset returns diverge from symmetry in two common ways. Fat tails are common in asset returns, meaning that extraordinary losses may happen more frequently than a normal distribution predicts. Moreover asset returns are often negatively skewed, with more observations on the left hand side than on the right hand side.
In contrast to the delta-normal method, the Monte Carlo simulation approach requires less strong assumptions but is more computationally engaging. First, a stochastic data generating process for the price paths is specified and parameters such as risk and correlations are derived from data. Second, price paths are simulated for all variables of interest using computer generated random numbers. Each of these pseudo realizations are then used to form a distribution of returns, from which a VaR figure is measured. The estimated VaR, like any other estimation, is subject to estimation errors. Therefore any meaningful interpretation, comparison and application of the estimated VaRs should consider these limitations.
In the case of the Monte Carlo simulation method, the accuracy of any estimated parameter will be proportional to 1/√n where n is the number of iterations (in our case n=10000). The Monte Carlo simulation methods depend on the computer generated random numbers that are not truly random numbers and hence create some estimation error that decreases as n increases. However, there is no closed form representation available for the estimation errors and hence they are not provided in our analysis. However, there do exist closed-form formulas for the standard errors of estimation for the delta-normal method, and the numbers are provided for a more meaningful comparison of the two portfolio VaR estimates. We have chosen a geometric Brownian motion process to describe price evolution. Formal procedures and algorithms for the simulation of a single asset portfolio are described in Appendix I, as well as generalizing to a portfolio of many assets, accounting for correlations of asset returns and correlations of shocks to prices.
10
III. APPLICATION TO SUKUK AND EUROBONDS
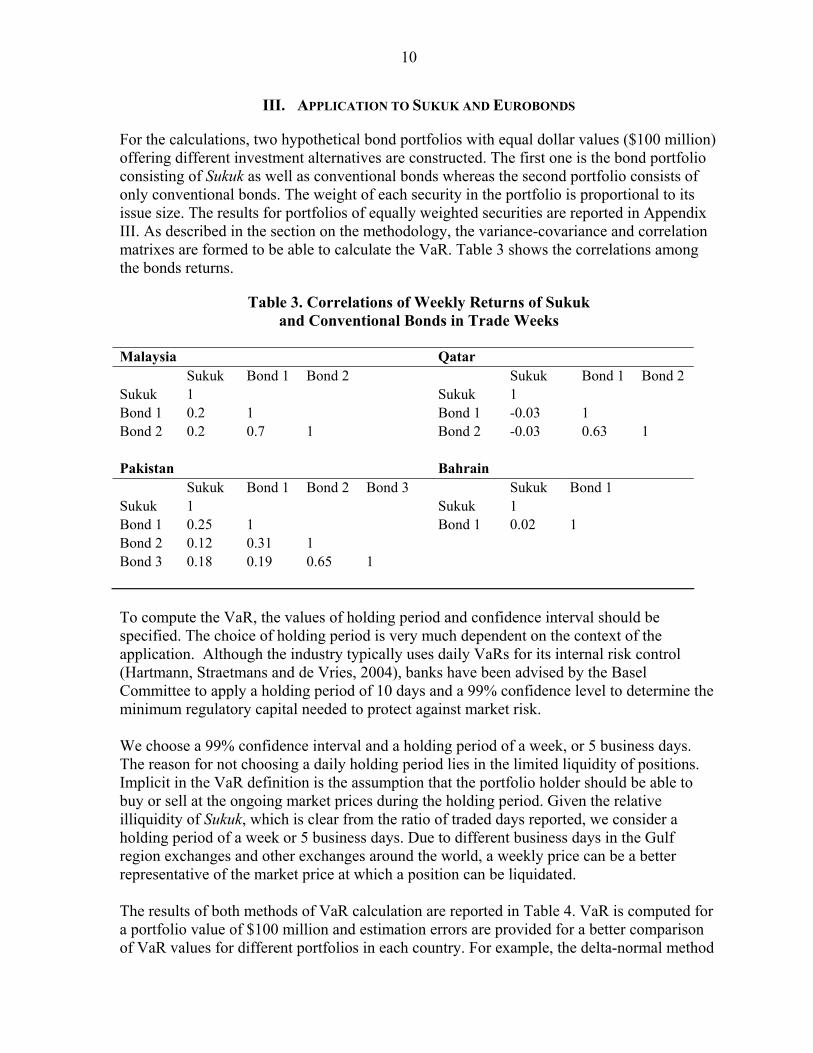
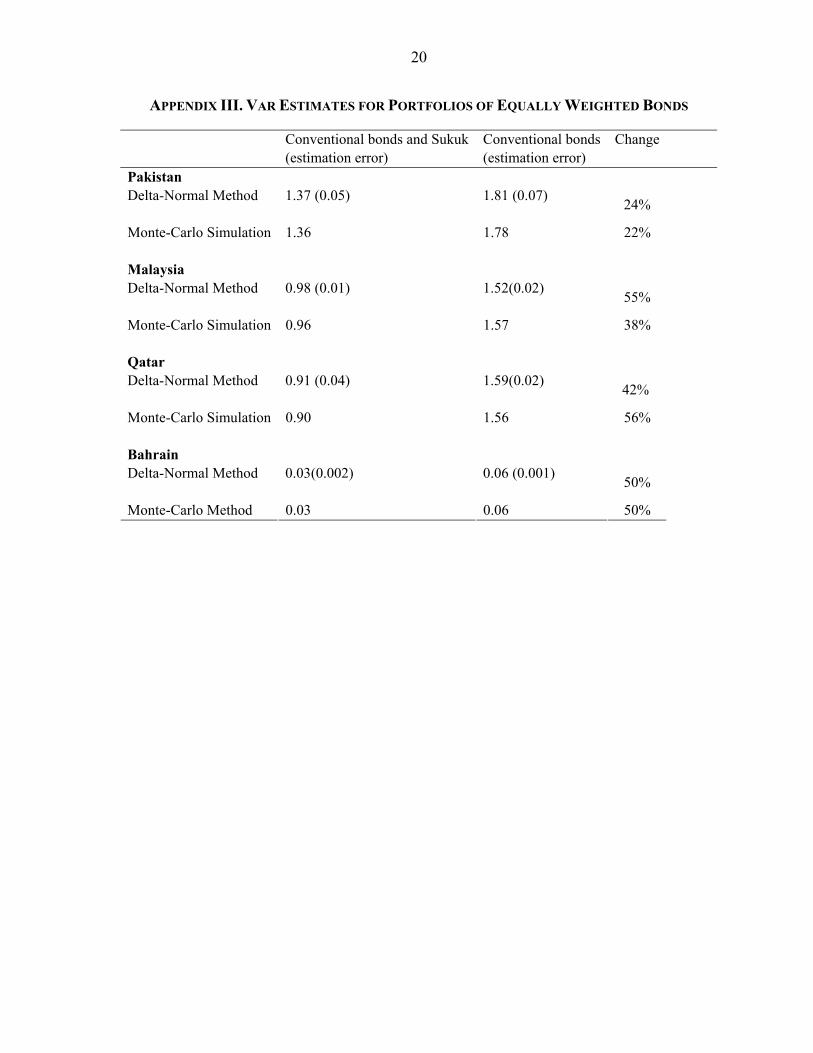
For the calculations, two hypothetical bond portfolios with equal dollar values ($100 million) offering different investment alternatives are constructed. The first one is the bond portfolio consisting of Sukuk as well as conventional bonds whereas the second portfolio consists of only conventional bonds. The weight of each security in the portfolio is proportional to its issue size. The results for portfolios of equally weighted securities are reported in Appendix III. As described in the section on the methodology, the variance-covariance and correlation matrixes are formed to be able to calculate the VaR. Table 3 shows the correlations among the bonds returns.
Table 3. Correlations of Weekly Returns of Sukuk and Conventional Bonds in Trade Weeks
To compute the VaR, the values of holding period and confidence interval should be specified. The choice of holding period is very much dependent on the context of the application. Although the industry typically uses daily VaRs for its internal risk control (Hartmann, Straetmans and de Vries, 2004), banks have been advised by the Basel Committee to apply a holding period of 10 days and a 99% confidence level to determine the minimum regulatory capital needed to protect against market risk. We choose a 99% confidence interval and a holding period of a week, or 5 business days. The reason for not choosing a daily holding period lies in the limited liquidity of positions. Implicit in the VaR definition is the assumption that the portfolio holder should be able to buy or sell at the ongoing market prices during the holding period. Given the relative illiquidity of Sukuk, which is clear from the ratio of traded days reported, we consider a holding period of a week or 5 business days. Due to different business days in the Gulf region exchanges and other exchanges around the world, a weekly price can be a better representative of the market price at which a position can be liquidated. The results of both methods of VaR calculation are reported in Table 4. VaR is computed for a portfolio value of $100 million and estimation errors are provided for a better comparison of VaR values for different portfolios in each country. For example, the delta-normal method
Malaysia Qatar Sukuk Bond 1 Bond 2 Sukuk Bond 1 Bond 2 Sukuk 1 Sukuk 1 Bond 1 0.2 1 Bond 1 -0.03 1 Bond 2 0.2 0.7 1 Bond 2 -0.03 0.63 1 Pakistan Bahrain Sukuk Bond 1 Bond 2 Bond 3 Sukuk Bond 1 Sukuk 1 Sukuk 1 Bond 1 0.25 1 Bond 1 0.02 1 Bond 2 0.12 0.31 1 Bond 3 0.18 0.19 0.65 1
11
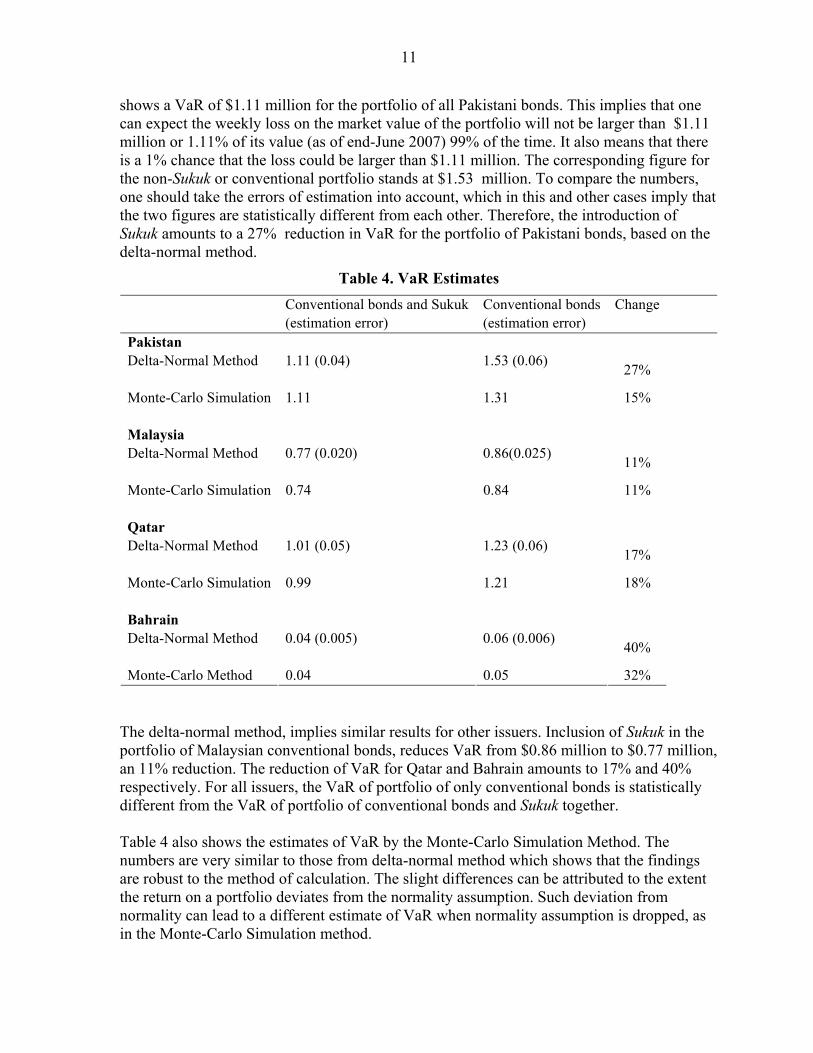
shows a VaR of $1.11 million for the portfolio of all Pakistani bonds. This implies that one can expect the weekly loss on the market value of the portfolio will not be larger than $1.11 million or 1.11% of its value (as of end-June 2007) 99% of the time. It also means that there is a 1% chance that the loss could be larger than $1.11 million. The corresponding figure for the non-Sukuk or conventional portfolio stands at $1.53 million. To compare the numbers, one should take the errors of estimation into account, which in this and other cases imply that the two figures are statistically different from each other. Therefore, the introduction of Sukuk amounts to a 27% reduction in VaR for the portfolio of Pakistani bonds, based on the delta-normal method.
Table 4. VaR Estimates Conventional bonds and Sukuk
(estimation error) Conventional bonds (estimation error)
Change
Pakistan Delta-Normal Method
1.11 (0.04) 1.53 (0.06) 27%
Monte-Carlo Simulation 1.11 1.31 15% Malaysia Delta-Normal Method
0.77 (0.020) 0.86(0.025) 11%
Monte-Carlo Simulation 0.74 0.84 11% Qatar Delta-Normal Method
1.01 (0.05) 1.23 (0.06) 17%
Monte-Carlo Simulation 0.99 1.21 18% Bahrain Delta-Normal Method
0.04 (0.005) 0.06 (0.006) 40%
Monte-Carlo Method 0.04 0.05 32%
The delta-normal method, implies similar results for other issuers. Inclusion of Sukuk in the portfolio of Malaysian conventional bonds, reduces VaR from $0.86 million to $0.77 million, an 11% reduction. The reduction of VaR for Qatar and Bahrain amounts to 17% and 40% respectively. For all issuers, the VaR of portfolio of only conventional bonds is statistically different from the VaR of portfolio of conventional bonds and Sukuk together. Table 4 also shows the estimates of VaR by the Monte-Carlo Simulation Method. The numbers are very similar to those from delta-normal method which shows that the findings are robust to the method of calculation. The slight differences can be attributed to the extent the return on a portfolio deviates from the normality assumption. Such deviation from normality can lead to a different estimate of VaR when normality assumption is dropped, as in the Monte-Carlo Simulation method.
12
Monte-Carlo Simulation estimates, also show that for each issuer, inclusion of Sukuk improves the VaR of portfolio significantly. The reductions in VaR stand at 11%, 15%, 18%, and 32% for portfolios of Malaysia, Pakistan, Qatar, and Bahrain respectively.
IV. CONCLUSION
This paper shows evidence that Sukuk—contrary to our priors—are different types of instruments than conventional bonds, as evidenced by their different price behavior. If an investor is ready to allocate certain amount of funds in the bonds of a certain issuer, diversification by including Sukuk in the investment portfolio could significantly reduce the portfolio’s VaR compared to a strategy of investing only in conventional bonds of that issuer. The results were broadly the same in both methods that were used in this analysis, namely the delta-normal approach and the Monte-Carlo simulation. Although international issues of Sukuk are similar to conventional bonds when it comes to such features as rating, issuance and redemption procedures, coupon payments, and default clauses, correlations of Sukuk returns with returns on conventional bonds are much smaller than the correlations of returns on conventional bonds with each other. If an instrument is not perfectly correlated with other assets in the portfolio, by definition one should expect some reduction in VaR. Indeed, part of the reduction in VaR in our study is due to the benefits gained from diversification through simply adding another instrument to the portfolio with a different duration. Nevertheless, the reduced VaR is not just due to the inclusion of an extra instrument in the portfolio but rather is a result of the very different behavior of Sukuk prices in the secondary market compared to conventional bonds. For example, in the case of Bahrain, where Sukuk and conventional bonds have similar durations, the correlation of returns is still close to zero. There are certain limitations to this study. Possible gains from diversification should be evaluated against the lower return and liquidity risk of Sukuk. Most of the time, possibly because of the segmented market structure, Sukuk offer lower returns compared to conventional bonds. Sukuk are also illiquid instruments compared to conventional bonds as evidenced by the lack of secondary market activity. Such illiquidity imposes more risks on the portfolio at times of volatility. We have tried to limit this effect on the analysis by working with weekly data; however, a more rigorous treatment of the effects of illiquidity on Sukuk prices and premium would be desirable. Moreover, the volatility in prices does reflect the volatility on the days that a trade took place, but does not reflect the actual volatility of prices. Given data limitations, rather than being conclusive, we hope that the paper constitutes a contribution to the debate on the issuance of Sukuk as alternative investment/financing instruments.
13
References Abdulkader, Thomas and Adam Nathif, 2004, “Islamic Bonds: Your Guide to Structuring,
Issuing and Investing in Sukuk.”, Economy Institutional Investor. Abdel-Khaleq, Ayman H. and Christopher F. Richarson, 2007, “New Horizons for Islamic
Securities: Emerging Trends in Sukuk Offerings,” Vinson & Elkins Ltd, Briefing. Al-Omar, Foad and Mohammad Abdel Haq, 1996, Islamic Banking, Theory, Practice and
Challenges (London: Oxford University). Archer, Simon and Rifaat A. A. Karim (eds.), 2002, Islamic Finance: Growth and Innovation
(London: Euromoney Books). Barnhill, Theodore and George Kopits, 2003, “Assessing Fiscal Sustainability Under
Uncertainty: Application of the Value-at-Risk Approach,” SSRN working paper. Choudry, Nurun N., and Abbas Mirakhor, 1997, “Indirect Instruments of Monetary Control
in an Islamic Financial System,” Islamic Economic Studies, Vol. 4, No. 2, pp. 27–66. Dowd, Kevin, 1999, Beyond Value at Risk (West Sussex: The Wiley Finance Series). Dowd, Kevin, 2005, Measuring Market Risk (West Sussex: John Wiley & Sons, Ltd). El-Gamal, Mahmoud, 2006, Islamic Finance: Law, Economics, and Practice (Cambridge:
Cambridge University Press). El-Gamal, Mahmoud, 2007, “Incoherent Pietism and Sharia Arbitrage,” Financial Times, 23
May. El-Hawary, Dahlia, Grais Wafik, and Zamir Iqbal, 2004, “Regulating Islamic Financial
Institutions: The Nature of the Regulated,” World Bank Policy Research Working Paper No. 3227, (25 February), Washington, D.C.
El-Qorchi, Mohammed, 2005, “Islamic Finance Gears Up,” Finance and Development,
(December), pp. 46–9 (Washington: International Monetary Fund). Gapen, Michael, Dale F. Gray, Cheng Hoon Lim and Yingbin Xiao, 2005, “Measuring and
Analyzing Sovereign Risk with Contingent Claims,” IMF Working Paper No. 05/155 (Washington: International Monetary Fund).
Hales, Alice, 2005, “Tapping Surplus Liquidity,” Risk Magazine, (Autumn), pp. 4–6. Hartmann, P , S. Straetmans and C. G. de Vries, 2004, “Asset Market Linkages in Crisis
Periods,” The Review of Economics and Statistics, Vol. 86, pp. 313-326.
14
Hassan, Mahir, 2007, “Banking Supervision Issues in Islamic Banking”, Seminar on Legal Aspects of Islamic Banking, International Monetary Fund (IMF), May 2007.
IFIS Sukuk Database, “Islamic Finance Information Service”. International Capital Markets Department (ICM), ”Global Financial Stability Report,”
Chapter IV, Development of Corporate Bond Markets in Emerging Market Countries. (September 2005), pp. 126–28.
Iqbal, Zamir and Abbas Mirakhor, 2006, An Introduction to Islamic Finance—Theory and
Practice (Hoboken, New Jersey: Wiley Finance Editions, John Wiley & Sons, Inc.). Iqbal, Zamir and Hiroshi Tsubota, 2006, “Emerging Islamic Capital Markets,” Islamic
Finance Review, Euromoney Handbook, and Euromoney Institutional Investor PLC, London, pp. 5–11.
Jorion, Philippe, 2006, Value at Risk (New York: McGraw-Hill). Kettell, Brian, 2003, “$US 150 million First Global Sukuk: Kumplan Guthrie Bhd, Case
Study,”, Islamic Banking Resources. Khan, Mohsin S. and Abbas Mirakhor, 1991, “Islamic Banking,” IMF working paper No.
91/88, (Washington: International Monetary Fund). Khan, Mohsin S. and Abbas Mirakhor, 2005, Theoretical Studies in Islamic Banking and
Finance (Teaneck, New Jersey: Islamic Publications International). Khan, Mohsin S. and Abbas Mirakhor, 1990, “Islamic Banking: Experiences in the Islamic
Republic of Iran and Pakistan,” Economic Development and Cultural Change, Vol. 38, No.2, pp. 353-75.
McFarlane, Benjamin, 2007, “London: The new Souk for Sukuk,” Financial Times, April
2007. Mirakhor, Abbas and Iqbal Zaidi ,1988, “Stabilization and Growth in an Open Islamic Economy,” IMF Working Paper No. 88/22, (Washington: International Monetary
Fund). Mirakhor, Abbas, 2006, “Islamic Finance and Globalization: A Convergence?”, Preliminary
draft. Mirakhor, Abbas and Nadeem Ul Haque, (1999), “The Design of Instruments For
Government Finance in an Islamic Economy,” Islamic Economic Studies, Vol. 6, No.2, pp 27-43.
Oakley, David, 2007, “No Interest-but bid Deposits of Ingenuity,” Financial Times, 23 May.
15
Seyed Ali, Salman, 2005, “Islamic Capital Market Products: Developments and Challenges,” IMF occasional paper No. 9, 1425H/2005 (Washington: International Monetary Fund).
Shaikh, Fiona, 2007, “British government mulls issuing Islamic bonds,” Reuters News, 23
April. Tariq, Ali Arslan, 2004, “Managing Financial Risks of Sukuk Structures,” Dissertation
Paper (Loughborough: Loughborough University). Telpner, Joel S., 2003, “A Securitization Primer for First Time Issuers,” Global
Securitization and Structured Finance 2003, Greenberg Traurig http://www.gtlaw.com/pub/articles/2003/telpner03a.pdf Tett, Gillian, 2007, “Innovation: Frenzied race to develop new ideas,” Financial Times, May
23. Thuronyi, Victor, 2007, “A Level Tax Playing Field for Islamic Finance,” (Presentation at
IMF). Uhlefder, Eric, 2007, “Islam is not the only driver for sukuk popularity,” Financial Times,
April 30. Usmani, Justice Taqi, 2006, “Instruments of Islamic Finance,” CITI Islamic Investment
Bank, Citigroup. Usmani, Justice Taqi, 2006, “Ijarah,” Islamic Finance Information Service. Warde, Ibrahim, 2000, Islamic Finance in the Global Economy (Edinburg: Edinburg
University Press).
16
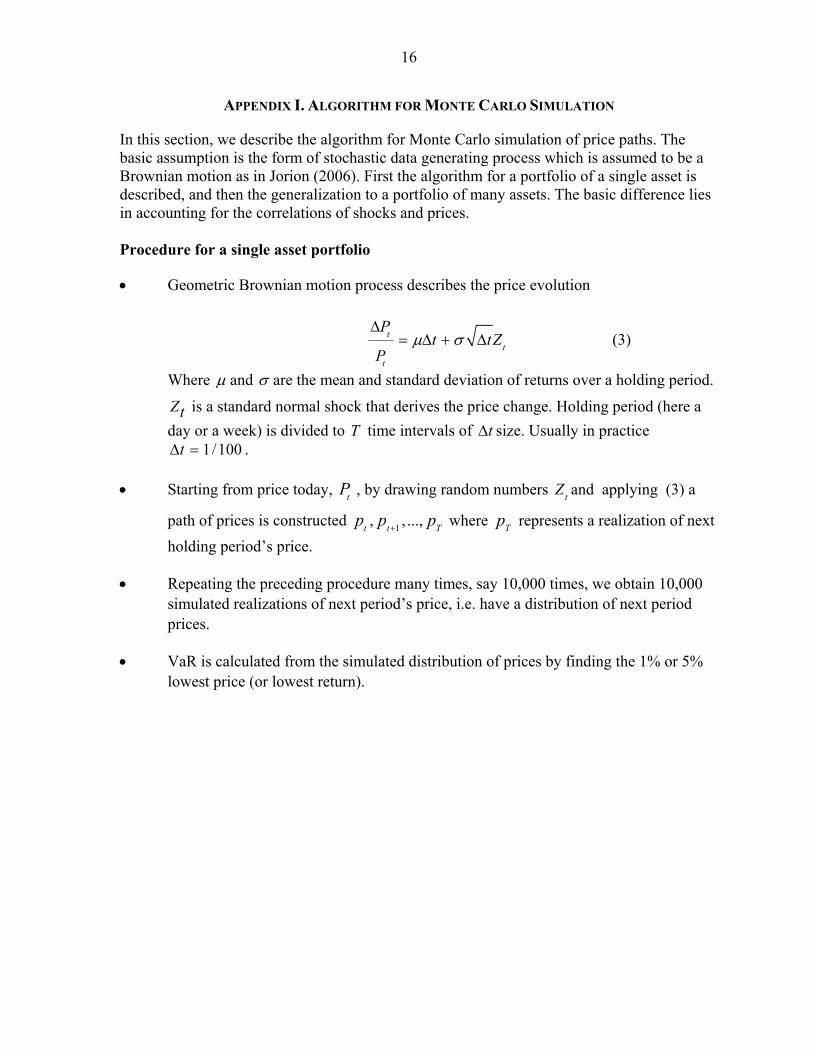
APPENDIX I. ALGORITHM FOR MONTE CARLO SIMULATION
In this section, we describe the algorithm for Monte Carlo simulation of price paths. The basic assumption is the form of stochastic data generating process which is assumed to be a Brownian motion as in Jorion (2006). First the algorithm for a portfolio of a single asset is described, and then the generalization to a portfolio of many assets. The basic difference lies in accounting for the correlations of shocks and prices. Procedure for a single asset portfolio
• Geometric Brownian motion process describes the price evolution
tt
t
Pt tZ
Pμ σ
Δ= Δ + Δ (3)
Where μ and σ are the mean and standard deviation of returns over a holding period.
Zt is a standard normal shock that derives the price change. Holding period (here a day or a week) is divided to T time intervals of tΔ size. Usually in practice
1/100tΔ = .
• Starting from price today, tP , by drawing random numbers tZ and applying (3) a
path of prices is constructed 1, , ...,t t Tp p p+ where Tp represents a realization of next holding period’s price.
• Repeating the preceding procedure many times, say 10,000 times, we obtain 10,000 simulated realizations of next period’s price, i.e. have a distribution of next period prices.
• VaR is calculated from the simulated distribution of prices by finding the 1% or 5% lowest price (or lowest return).
17
Procedure for a multiple asset portfolio
• Each asset price evolves based on a Brownian motion
1
1 1 1
1
2
2 2 2
2
tt
t
tt
t
N
N N NttN
t
Pt tZ
P
Pt tZ
P
Pt tZ
P
μ σ
μ σ
μ σ
Δ= Δ + Δ
Δ= Δ + Δ
Δ= Δ + Δ
M
(4)
• Random numbers 1 2, , ..., N
t t TZ Z Z are possibly correlated. Their correlation pattern
depends on correlation pattern of asset returns. It can be shown that correlation
matrix of i
tZ ’s is the same as correlation matrix of asset returns.
• One needs to construct random numbers tZ with a given correlation matrix. This is done through Cholesky factorization of variance-covariance matrix of asset returns. The Cholesky factorization procedure is available in many statistical and computational software4.
• Once appropriate random tZ ’s are drawn, path of asset prices are constructed using
(4) for all assets. A realization of next period prices is obtained as 1 2, , ..., N
T T Tp p p
which gives rise to a portfolio price as the weighted sum of individual assets.
• Repeat above procedure for 10,000 times to obtain a distribution of next period’s portfolio price.
4 In general, suppose we have a vector of N values Z which we want to display some correlation structure as
( ) ( ')V E= =Z ZZ R . As the matrix R is a symmetric real matrix, it can be decomposed to its Cholesky factors 'HH=R where H is a lower triangular matrix with zeros on the upper right corner. Then starting from an N vector η , consisting of iid variables with unit variance ( ( )V I=η ), one can construct the desired variable as H=Z η . It’s covariance matrix is R as desired since
( ) ( ' ') ( ') ' 'V E H H HE H HH= = = =Z ηη ηη R . See Appendix II for the variance-covariance matrix of bonds in the study.

18
• VaR is calculated from the simulated distribution as the 5% or 1% lowest price (or return)
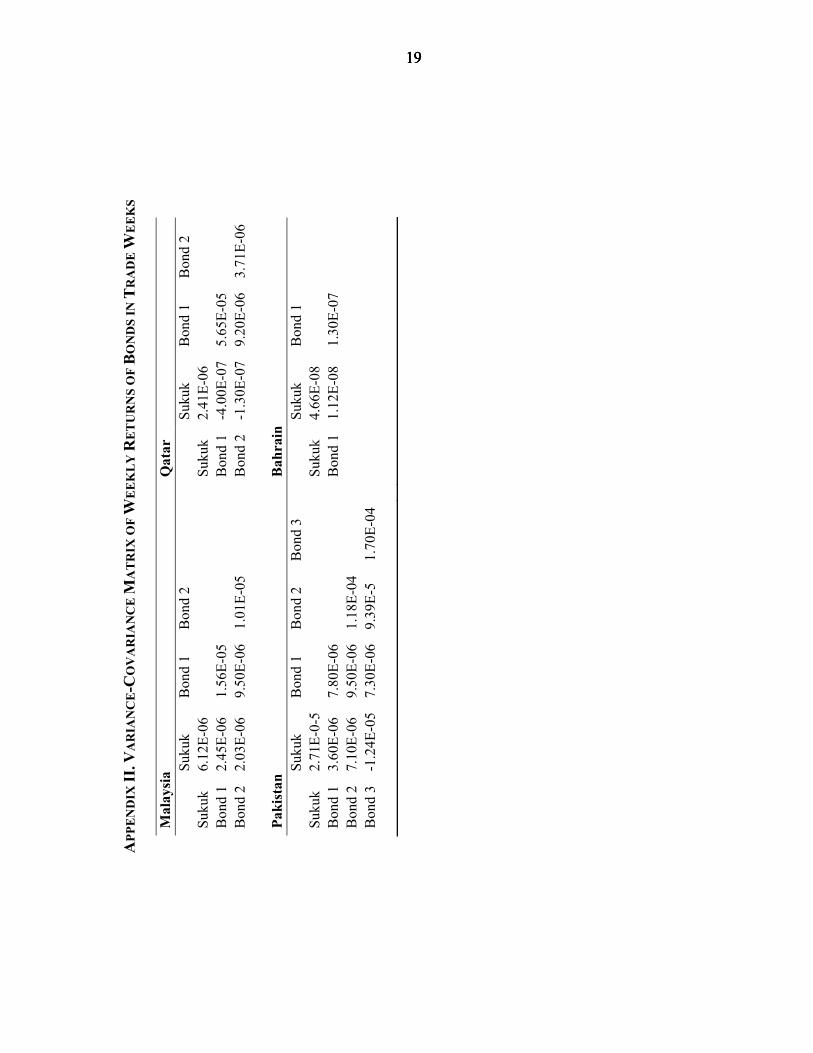
19 19 19 19
APP
EN
DIX
II. V
AR
IAN
CE
-CO
VA
RIA
NC
E M
AT
RIX
OF
WE
EK
LY
RE
TU
RN
S O
F B
ON
DS
IN T
RA
DE
WE
EK
S
Mal
aysi
a Q
atar
Suku
k B
ond
1 B
ond
2
Suku
k B
ond
1 B
ond
2 Su
kuk
6.12
E-06
Su
kuk
2.41
E-06
B
ond
1 2.
45E-
06
1.56
E-05
Bon
d 1
-4.0
0E-0
75.
65E-
05
Bon
d 2
2.03
E-06
9.
50E-
06
1.01
E-05
Bon
d 2
-1.3
0E-0
79.
20E-
063.
71E-
06
Paki
stan
B
ahra
in
Su
kuk
Bon
d 1
Bon
d 2
Bon
d 3
Suku
k B
ond
1 Su
kuk
2.71
E-0-
5
Su
kuk
4.66
E-08
Bon
d 1
3.60
E-06
7.
80E-
06
B
ond
1 1.
12E-
08
1.30
E-07
B
ond
2 7.
10E-
06
9.50
E-06
1.
18E-
04
Bon
d 3
-1.2
4E-0
57.
30E-
06
9.39
E-5
1.70
E-04
20
APPENDIX III. VAR ESTIMATES FOR PORTFOLIOS OF EQUALLY WEIGHTED BONDS
Conventional bonds and Sukuk (estimation error)
Conventional bonds (estimation error)
Change
Pakistan Delta-Normal Method
1.37 (0.05) 1.81 (0.07) 24%
Monte-Carlo Simulation 1.36 1.78 22% Malaysia Delta-Normal Method
0.98 (0.01) 1.52(0.02) 55%
Monte-Carlo Simulation 0.96 1.57 38% Qatar Delta-Normal Method
0.91 (0.04) 1.59(0.02) 42%
Monte-Carlo Simulation 0.90 1.56 56% Bahrain Delta-Normal Method
0.03(0.002) 0.06 (0.001) 50%
Monte-Carlo Method 0.03 0.06 50%