sulev and 'off-cycle' emissions benefits of a vacuum ... · word abstract of a proposed...
TRANSCRIPT
400 Commonwealth Drive, Warrendale, PA 15096-0001 U.S.A. Tel: (724) 776-4841 Fax: (724) 776-5760
SAE TECHNICALPAPER SERIES 1999-01-0461
SULEV and "Off-Cycle" Emissions Benefits ofa Vacuum-Insulated Catalytic Converter
Steven D. BurchNational Renewable Energy Laboratory
John P. BielBenteler Automotive Corp.
Reprinted From: Gas Direct injection Aftertreatment andExhaust Aftertreatment Modeling
(SP-1455)
International Congress and ExpositionDetroit, Michigan
March 1-4, 1999
The appearance of this ISSN code at the bottom of this page indicates SAE’s consent that copies of thepaper may be made for personal or internal use of specific clients. This consent is given on the condition,however, that the copier pay a $7.00 per article copy fee through the Copyright Clearance Center, Inc.Operations Center, 222 Rosewood Drive, Danvers, MA 01923 for copying beyond that permitted by Sec-tions 107 or 108 of the U.S. Copyright Law. This consent does not extend to other kinds of copying such ascopying for general distribution, for advertising or promotional purposes, for creating new collective works,or for resale.
SAE routinely stocks printed papers for a period of three years following date of publication. Direct yourorders to SAE Customer Sales and Satisfaction Department.
Quantity reprint rates can be obtained from the Customer Sales and Satisfaction Department.
To request permission to reprint a technical paper or permission to use copyrighted SAE publications inother works, contact the SAE Publications Group.
No part of this publication may be reproduced in any form, in an electronic retrieval system or otherwise, without the prior writtenpermission of the publisher.
ISSN 0148-7191Copyright 1999 Society of Automotive Engineers, Inc.
Positions and opinions advanced in this paper are those of the author(s) and not necessarily those of SAE. The author is solelyresponsible for the content of the paper. A process is available by which discussions will be printed with the paper if it is published inSAE Transactions. For permission to publish this paper in full or in part, contact the SAE Publications Group.
Persons wishing to submit papers to be considered for presentation or publication through SAE should send the manuscript or a 300word abstract of a proposed manuscript to: Secretary, Engineering Meetings Board, SAE.
Printed in USA
All SAE papers, standards, and selectedbooks are abstracted and indexed in theGlobal Mobility Database
1
1999-01-0461
SULEV and "Off-Cycle" Emissions Benefits of aVacuum-Insulated Catalytic Converter
Steven D. BurchNational Renewable Energy Laboratory
John P. BielBenteler Automotive Corp.
Copyright © 1999 Society of Automotive Engineers, Inc.
ABSTRACT
In previous SAE papers, the initial development and test-ing of a vacuum-insulated catalytic converter was pre-sented. This paper provides an update of the converterdevelopment and an analysis of potential off-cycle emis-sions savings. Hot vibration, cool-down, and 1975 Fed-eral Test Procedure (FTP-75) emissions test results areprovided to demonstrate the effectiveness of designimprovements in greatly increasing durability while retain-ing performance. Using standard drive cycles and "real-world" driving statistics with a vehicle simulator (ADVI-SOR), catalyst temperature and vehicle exhaust emis-sions of a sport utility vehicle (SUV) were predicted for 16days of driving (107 trips, 770 total miles). Compared tothe baseline vehicle with a conventional catalytic con-verter, the SUV with a vacuum-insulated converter pro-duced 66% less non-methane hydrocarbon (NMHC),65% less carbon monoxide (CO), and 60% less oxides ofnitrogen (NOx).
INTRODUCTION
In a series of previous SAE papers [1,2,3], the initialdesign, development, thermal performance, and FTP-75emissions performance of a vacuum-insulated catalyticconverter (VICC) was reported. This converter, nownamed BENCHMARC, was originally developed at theNational Renewable Energy Laboratory (NREL), a U.S.Department of Energy (DOE) national laboratory, and iscurrently being commercialized by Benteler AutomotiveCorporation. It features a thermal management systemto maintain the catalyst monolith at or above its lightofftemperature between trips so that most of a vehicle's"cold-start" emissions are avoided. For new vehicles withconventional converters, 60% to 80% of all NMHC andCO emissions occur in the first few minutes of FTP-75while the converter is warming up [4]. Decreasing these"cold-start" emissions is seen as key to meeting futureregulations.
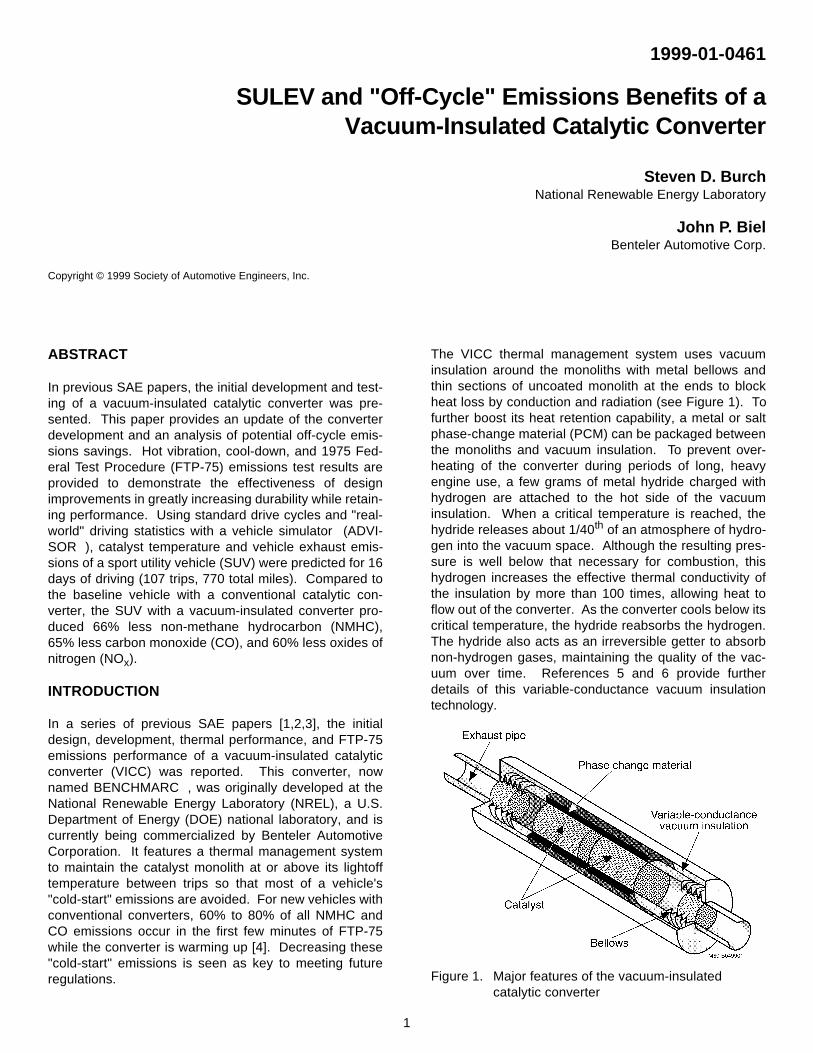
The VICC thermal management system uses vacuuminsulation around the monoliths with metal bellows andthin sections of uncoated monolith at the ends to blockheat loss by conduction and radiation (see Figure 1). Tofurther boost its heat retention capability, a metal or saltphase-change material (PCM) can be packaged betweenthe monoliths and vacuum insulation. To prevent over-heating of the converter during periods of long, heavyengine use, a few grams of metal hydride charged withhydrogen are attached to the hot side of the vacuuminsulation. When a critical temperature is reached, thehydride releases about 1/40th of an atmosphere of hydro-gen into the vacuum space. Although the resulting pres-sure is well below that necessary for combustion, thishydrogen increases the effective thermal conductivity ofthe insulation by more than 100 times, allowing heat toflow out of the converter. As the converter cools below itscritical temperature, the hydride reabsorbs the hydrogen.The hydride also acts as an irreversible getter to absorbnon-hydrogen gases, maintaining the quality of the vac-uum over time. References 5 and 6 provide furtherdetails of this variable-conductance vacuum insulationtechnology.
Figure 1. Major features of the vacuum-insulated catalytic converter
2
Early converter prototypes demonstrated the excellentheat retention capability of this approach, requiring 18 to24 hours to cool from 600°C to 250°C versus 20 to 30minutes for conventional converters. FTP-75 cycle test-ing of a Ford Taurus at Southwest Research Institute(SwRI) showed emission benefits in the range of 80% to90% for NMHC and CO, and 50% reduction in NOx for aconverter with fully-melted PCM following a 24-hour soak[1].
Although these preliminary results were very encourag-ing, a number of issues were identified for further devel-opment. Two of the primary issues are addressed in thispaper: durability and comparison of FTP-75 cycle resultswith off-cycle or real-world emission benefits.
DURABILITY
BACKGROUND – Automotive catalytic converters areexposed to severe heat, shock, and vibration. At thesame time, because of their critical role in emissions con-trol, they have some of the longest warranty periods ofany vehicle components. Previous federal regulationsspecified performance at 50,000 (50K) miles. New stan-dards are increasing that to 100K and 120K miles. As aresult, automakers expect converters to pass extremeaccelerated durability tests. One of the most severe(especially for the vacuum-insulated converter) is the hotvibration test. Table 1 summarizes the range of test con-ditions obtained from a number of automakers. Based onthis information, a representative set of test conditionswas chosen for VICC durability development.
INTERNAL SUPPORT OPTIMIZATION – Retaining heatin the converter relies on thermally isolating the interiormass (monolith, inlet/outlet cones, and PCM) from theexterior. Use of thin metal bellows at each end of theinterior is critical to reducing heat loss by conduction.Unfortunately, the bellows provide virtually no support ofthe interior mass. The converter needs structural sup-ports within the vacuum insulation. These supports mustbe strong enough to withstand the g-forces of the hotvibration test, yet not significantly diminish the system'soverall resistance to heat flow. The original supportswere simply a set of three wires (2.4 mm in diameter) ateach end of the converter running from the interior to theouter shell. This approach had minimal impact on heatflow (<10% increase at 400° C), but exhibited very poorhot vibration durability.
Significant design work was undertaken to develop andoptimize a new internal support. Finite-element analysis
(FEA) was used extensively to sort through a large num-ber of conceptual designs. This analysis included thetemperature distribution along the internal support andthe corresponding variation in material properties. Thethermal expansion of the inner converter geometry withrespect to the outer cylinder was also considered. If notproperly addressed, this expansion could contribute moreto the overall stress in the internal supports than thevibration load. Through a combination of geometry andmaterials optimization, an internal support design wasdeveloped that has increased hot vibration durability (30g's at 800°C and 100 Hz) from less than 1 hour to 50hours, representing approximately 100K miles of typicaldriving.
IMPACT OF DURABILITY DESIGN CHANGES ONTHERMAL AND EMISSIONS PERFORMANCE – Sev-eral on-vehicle tests were run to assess the impact of theinternal support design changes on the converter thermaland emissions performance. These tests consisted ofFTP-75 tests run on a vehicle dynamometer at SwRI aspart of a Manufacturers of Emission Controls Assoc.(MECA) study. After testing a stock 1997 Buick LeSabre(3.8 l engine, EPA Tier 1-certified), several changes weremade to the vehicle. Most significantly, the standard con-verter was replaced with a durable VICC. Table 2 showssome of the characteristics of the converter. Also, sec-ondary air injection was added and the stock exhaustmanifold was replaced with air-gap-insulated manifolds.The engine also was re-tuned. Full details of this MECAstudy are available in reference [7].
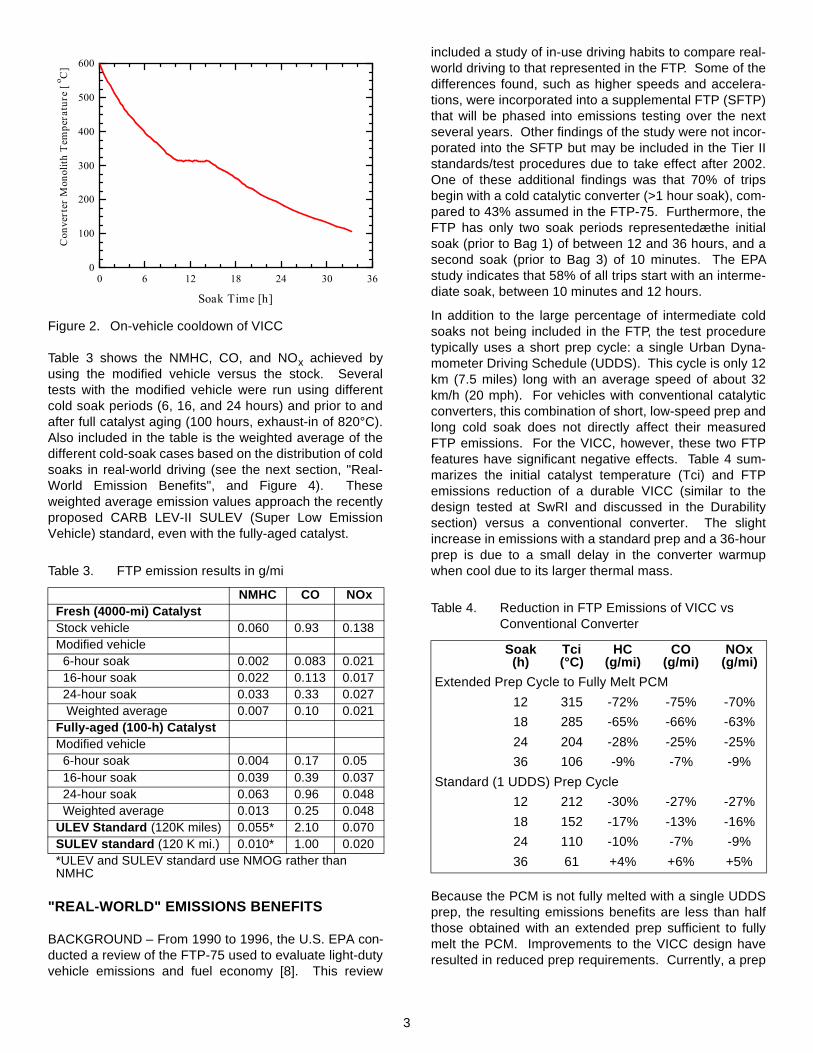
To fully melt the PCM, an extended FTP prep cycle con-sisting of approximately 10 minutes at 65 mph followedby an FTP-75 cycle was used. Figure 2 shows one of theresulting on-car cool-downs. Cool-down time from 600°Cto 250°C is 18.8 hours. This is nearly the same as the19.3 hours achieved with the non-durable prototypereported previously [1]. FTP-75 emission benefits of thenew durable converter are also similar to those reportedpreviously for the non-durable prototype, except that evengreater NOx reductions were observed in the most recentstudy.
Table 1. Converter Hot Vibration Test Parameters
Min. Max. SelectedEx. gas temperature (°C) 100 950 800Ex. gas flow rate (g/s) 20 130 40Vibration load (g's) 28 60 30Vibration frequency (Hz) 50 2500 100
Table 2. Design Characteristics of VICC
Converter Monolith (each of 2) Material Stainless Steel Diameter 118 mm Length 115 mm Cell Density 78 cells/cm2
Precious Metal Loading Density 5.4 g/lOverall Dimensions Length 580 mm Diameter 180 mm
3
Figure 2. On-vehicle cooldown of VICC
Table 3 shows the NMHC, CO, and NOx achieved byusing the modified vehicle versus the stock. Severaltests with the modified vehicle were run using differentcold soak periods (6, 16, and 24 hours) and prior to andafter full catalyst aging (100 hours, exhaust-in of 820°C).Also included in the table is the weighted average of thedifferent cold-soak cases based on the distribution of coldsoaks in real-world driving (see the next section, "Real-World Emission Benefits", and Figure 4). Theseweighted average emission values approach the recentlyproposed CARB LEV-II SULEV (Super Low EmissionVehicle) standard, even with the fully-aged catalyst.
"REAL-WORLD" EMISSIONS BENEFITS
BACKGROUND – From 1990 to 1996, the U.S. EPA con-ducted a review of the FTP-75 used to evaluate light-dutyvehicle emissions and fuel economy [8]. This review
included a study of in-use driving habits to compare real-world driving to that represented in the FTP. Some of thedifferences found, such as higher speeds and accelera-tions, were incorporated into a supplemental FTP (SFTP)that will be phased into emissions testing over the nextseveral years. Other findings of the study were not incor-porated into the SFTP but may be included in the Tier IIstandards/test procedures due to take effect after 2002.One of these additional findings was that 70% of tripsbegin with a cold catalytic converter (>1 hour soak), com-pared to 43% assumed in the FTP-75. Furthermore, theFTP has only two soak periods representedæthe initialsoak (prior to Bag 1) of between 12 and 36 hours, and asecond soak (prior to Bag 3) of 10 minutes. The EPAstudy indicates that 58% of all trips start with an interme-diate soak, between 10 minutes and 12 hours.
In addition to the large percentage of intermediate coldsoaks not being included in the FTP, the test proceduretypically uses a short prep cycle: a single Urban Dyna-mometer Driving Schedule (UDDS). This cycle is only 12km (7.5 miles) long with an average speed of about 32km/h (20 mph). For vehicles with conventional catalyticconverters, this combination of short, low-speed prep andlong cold soak does not directly affect their measuredFTP emissions. For the VICC, however, these two FTPfeatures have significant negative effects. Table 4 sum-marizes the initial catalyst temperature (Tci) and FTPemissions reduction of a durable VICC (similar to thedesign tested at SwRI and discussed in the Durabilitysection) versus a conventional converter. The slightincrease in emissions with a standard prep and a 36-hourprep is due to a small delay in the converter warmupwhen cool due to its larger thermal mass.
Because the PCM is not fully melted with a single UDDSprep, the resulting emissions benefits are less than halfthose obtained with an extended prep sufficient to fullymelt the PCM. Improvements to the VICC design haveresulted in reduced prep requirements. Currently, a prep
Table 3. FTP emission results in g/mi
NMHC CO NOxFresh (4000-mi) CatalystStock vehicle 0.060 0.93 0.138Modified vehicle 6-hour soak 0.002 0.083 0.021 16-hour soak 0.022 0.113 0.017 24-hour soak 0.033 0.33 0.027 Weighted average 0.007 0.10 0.021Fully-aged (100-h) CatalystModified vehicle 6-hour soak 0.004 0.17 0.05 16-hour soak 0.039 0.39 0.037 24-hour soak 0.063 0.96 0.048 Weighted average 0.013 0.25 0.048ULEV Standard (120K miles) 0.055* 2.10 0.070SULEV standard (120 K mi.) 0.010* 1.00 0.020*ULEV and SULEV standard use NMOG rather than NMHC
0 6 12 18 24 30 36
Soak Time [h]
0
100
200
300
400
500
Con
vert
er M
onol
ith T
empe
ratu
re [
o C] 600
Table 4. Reduction in FTP Emissions of VICC vs Conventional Converter
Soak(h)
Tci(°C)
HC(g/mi)
CO(g/mi)
NOx(g/mi)
Extended Prep Cycle to Fully Melt PCM
12 315 -72% -75% -70%
18 285 -65% -66% -63%
24 204 -28% -25% -25%
36 106 -9% -7% -9%
Standard (1 UDDS) Prep Cycle
12 212 -30% -27% -27%
18 152 -17% -13% -16%
24 110 -10% -7% -9%
36 61 +4% +6% +5%
4
of about 12 miles (16 minutes at 45 mph) is needed.Alternatively, the UDDS and SFTP (SC03 and US06)cycles (total of 19 miles) can be used. The question thenis: are these extended prep cycles appropriate? A recentstudy of real-world driving conducted by the California AirResources Board (CARB) concluded that vehicles in theLos Angeles area traveled an average of 46 miles per dayat an average speed of 43 mph. Also, less than 1% of alltrips started after a cold soak of more than 24 hours (<8% are >12 hours) [9]. However, these 46 miles per daywere spread over an average of 6.7 trips (and intermedi-ate cold soaks) per day. To use this real-world drivingbehavior to develop an appropriate alternative FTP prepcycle, a simulation of real-world driving was initiated atNREL.
DEFINITION OF REAL-WORLD DRIVING – The firsttask in simulating real-world vehicle emissions is todefine real-world driving behavior. Several studies havebeen performed in the past 10 years on this topic, includ-ing the 1995 National Personal Transportation Survey(NPTS) [10], the 1992 study performed for the EPA FTPreview [8], and the 1996 CARB study [9]. The CARBstudy was selected for the basis of the present study fortwo reasonsæit was the most recent, and it also provideda more complete set of applicable driving statistics thanthe NTPS. These driving statistics include distributionsof vehicle speed, acceleration, number of trips per day,distance per trip, and time between trips (cold-soakperiod).
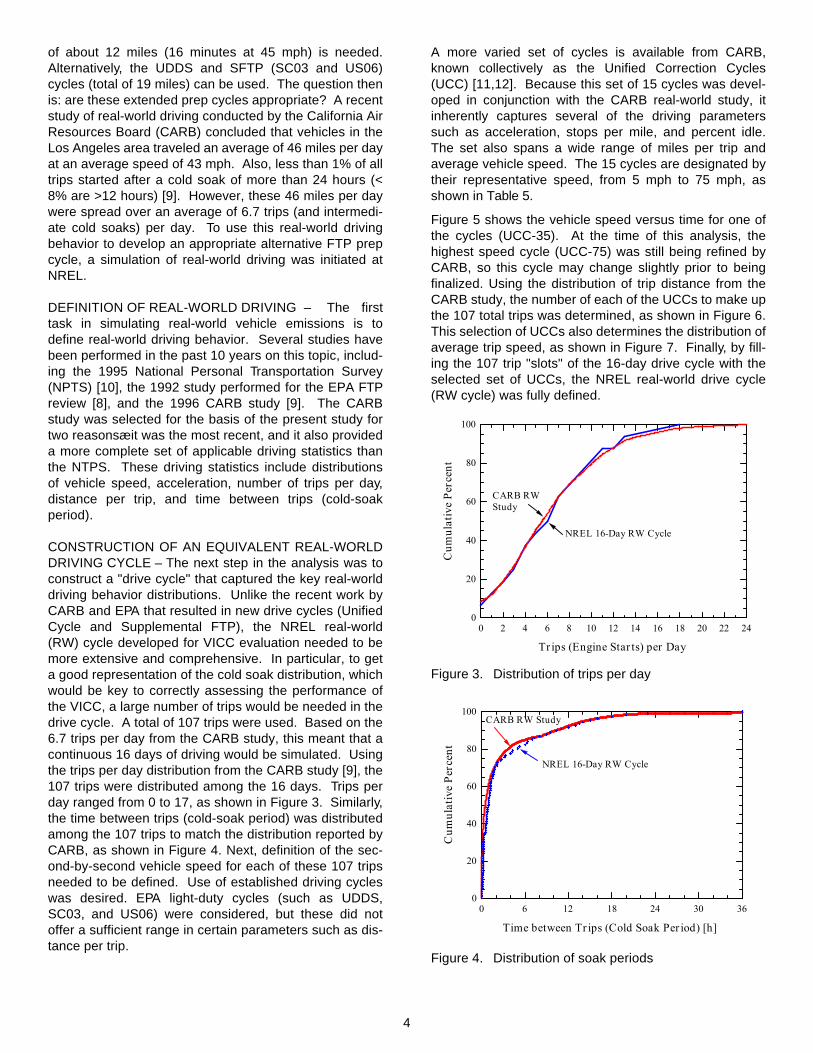
CONSTRUCTION OF AN EQUIVALENT REAL-WORLDDRIVING CYCLE – The next step in the analysis was toconstruct a "drive cycle" that captured the key real-worlddriving behavior distributions. Unlike the recent work byCARB and EPA that resulted in new drive cycles (UnifiedCycle and Supplemental FTP), the NREL real-world(RW) cycle developed for VICC evaluation needed to bemore extensive and comprehensive. In particular, to geta good representation of the cold soak distribution, whichwould be key to correctly assessing the performance ofthe VICC, a large number of trips would be needed in thedrive cycle. A total of 107 trips were used. Based on the6.7 trips per day from the CARB study, this meant that acontinuous 16 days of driving would be simulated. Usingthe trips per day distribution from the CARB study [9], the107 trips were distributed among the 16 days. Trips perday ranged from 0 to 17, as shown in Figure 3. Similarly,the time between trips (cold-soak period) was distributedamong the 107 trips to match the distribution reported byCARB, as shown in Figure 4. Next, definition of the sec-ond-by-second vehicle speed for each of these 107 tripsneeded to be defined. Use of established driving cycleswas desired. EPA light-duty cycles (such as UDDS,SC03, and US06) were considered, but these did notoffer a sufficient range in certain parameters such as dis-tance per trip.
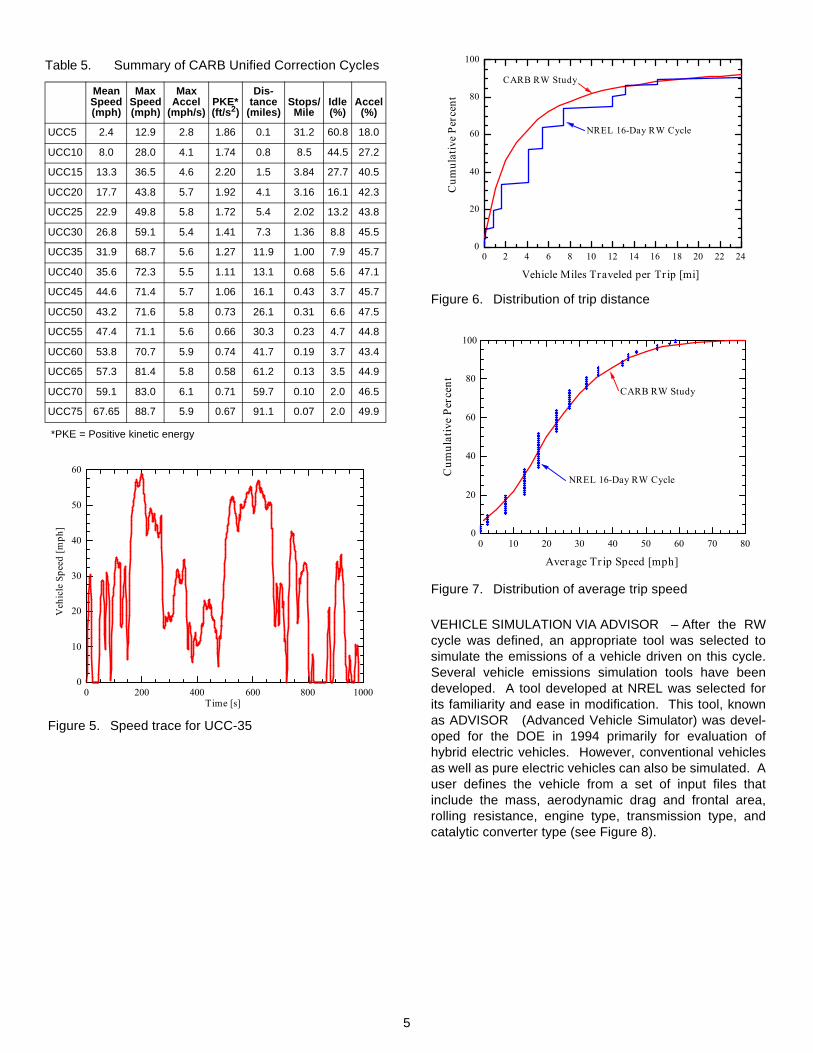
A more varied set of cycles is available from CARB,known collectively as the Unified Correction Cycles(UCC) [11,12]. Because this set of 15 cycles was devel-oped in conjunction with the CARB real-world study, itinherently captures several of the driving parameterssuch as acceleration, stops per mile, and percent idle.The set also spans a wide range of miles per trip andaverage vehicle speed. The 15 cycles are designated bytheir representative speed, from 5 mph to 75 mph, asshown in Table 5.
Figure 5 shows the vehicle speed versus time for one ofthe cycles (UCC-35). At the time of this analysis, thehighest speed cycle (UCC-75) was still being refined byCARB, so this cycle may change slightly prior to beingfinalized. Using the distribution of trip distance from theCARB study, the number of each of the UCCs to make upthe 107 total trips was determined, as shown in Figure 6.This selection of UCCs also determines the distribution ofaverage trip speed, as shown in Figure 7. Finally, by fill-ing the 107 trip "slots" of the 16-day drive cycle with theselected set of UCCs, the NREL real-world drive cycle(RW cycle) was fully defined.
Figure 3. Distribution of trips per day
Figure 4. Distribution of soak periods
NREL 16-Day RW Cycle
CARB RWStudy
0 2 4 6 8 10 12 14 16 18 20 22 24
Trips (Engine Starts) per Day
0
20
40
60
80
100
Cum
ulat
ive
Perc
ent
CARB RW Study
NREL 16-Day RW Cycle
0 6 12 18 24 30 36
Time between Trips (Cold Soak Period) [h]
0
20
40
60
80
100
Cum
ulat
ive
Perc
ent
5
Figure 5. Speed trace for UCC-35
Figure 6. Distribution of trip distance
Figure 7. Distribution of average trip speed
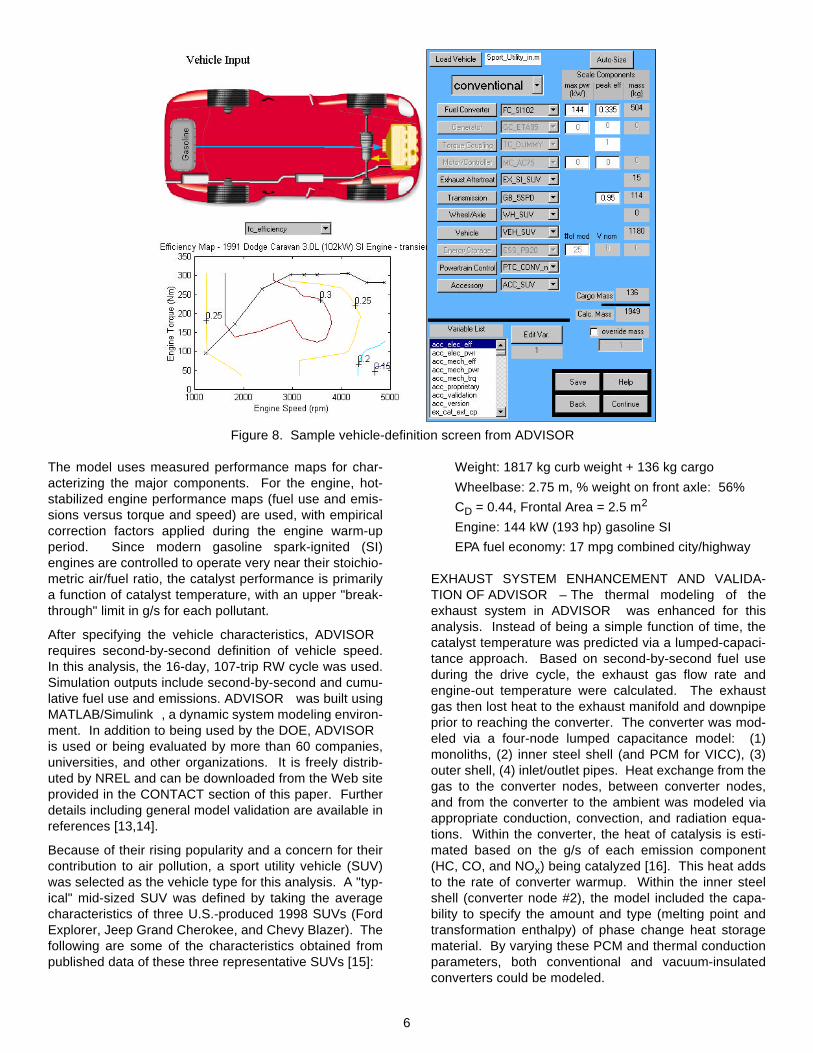
VEHICLE SIMULATION VIA ADVISOR – After the RWcycle was defined, an appropriate tool was selected tosimulate the emissions of a vehicle driven on this cycle.Several vehicle emissions simulation tools have beendeveloped. A tool developed at NREL was selected forits familiarity and ease in modification. This tool, knownas ADVISOR (Advanced Vehicle Simulator) was devel-oped for the DOE in 1994 primarily for evaluation ofhybrid electric vehicles. However, conventional vehiclesas well as pure electric vehicles can also be simulated. Auser defines the vehicle from a set of input files thatinclude the mass, aerodynamic drag and frontal area,rolling resistance, engine type, transmission type, andcatalytic converter type (see Figure 8).
Table 5. Summary of CARB Unified Correction Cycles
Mean Speed (mph)
Max Speed (mph)
Max Accel
(mph/s)PKE* (ft/s2)
Dis-tance
(miles)Stops/Mile
Idle (%)
Accel (%)
UCC5 2.4 12.9 2.8 1.86 0.1 31.2 60.8 18.0
UCC10 8.0 28.0 4.1 1.74 0.8 8.5 44.5 27.2
UCC15 13.3 36.5 4.6 2.20 1.5 3.84 27.7 40.5
UCC20 17.7 43.8 5.7 1.92 4.1 3.16 16.1 42.3
UCC25 22.9 49.8 5.8 1.72 5.4 2.02 13.2 43.8
UCC30 26.8 59.1 5.4 1.41 7.3 1.36 8.8 45.5
UCC35 31.9 68.7 5.6 1.27 11.9 1.00 7.9 45.7
UCC40 35.6 72.3 5.5 1.11 13.1 0.68 5.6 47.1
UCC45 44.6 71.4 5.7 1.06 16.1 0.43 3.7 45.7
UCC50 43.2 71.6 5.8 0.73 26.1 0.31 6.6 47.5
UCC55 47.4 71.1 5.6 0.66 30.3 0.23 4.7 44.8
UCC60 53.8 70.7 5.9 0.74 41.7 0.19 3.7 43.4
UCC65 57.3 81.4 5.8 0.58 61.2 0.13 3.5 44.9
UCC70 59.1 83.0 6.1 0.71 59.7 0.10 2.0 46.5
UCC75 67.65 88.7 5.9 0.67 91.1 0.07 2.0 49.9
*PKE = Positive kinetic energy
0 200 400 600 800 1000Time [s]
0
10
20
30
40
50
60
Veh
icle
Spe
ed [m
ph]
CARB RW Study
0
20
40
60
80
100
Cum
ulat
ive
Perc
ent
0 2 4 6 8 10 12 14 16 18 20 22 24
Vehicle Miles Traveled per Trip [mi]
NREL 16-Day RW Cycle
CARB RW Study
NREL 16-Day RW Cycle
0 10 20 30 40 50 60 70 80
Average Trip Speed [mph]
0
20
40
60
80
Cum
ulat
ive
Perc
ent
100
6
Figure 8. Sample vehicle-definition screen from ADVISOR
The model uses measured performance maps for char-acterizing the major components. For the engine, hot-stabilized engine performance maps (fuel use and emis-sions versus torque and speed) are used, with empiricalcorrection factors applied during the engine warm-upperiod. Since modern gasoline spark-ignited (SI)engines are controlled to operate very near their stoichio-metric air/fuel ratio, the catalyst performance is primarilya function of catalyst temperature, with an upper "break-through" limit in g/s for each pollutant.
After specifying the vehicle characteristics, ADVISOR
requires second-by-second definition of vehicle speed.In this analysis, the 16-day, 107-trip RW cycle was used.Simulation outputs include second-by-second and cumu-lative fuel use and emissions. ADVISOR was built usingMATLAB/Simulink, a dynamic system modeling environ-ment. In addition to being used by the DOE, ADVISOR
is used or being evaluated by more than 60 companies,universities, and other organizations. It is freely distrib-uted by NREL and can be downloaded from the Web siteprovided in the CONTACT section of this paper. Furtherdetails including general model validation are available inreferences [13,14].
Because of their rising popularity and a concern for theircontribution to air pollution, a sport utility vehicle (SUV)was selected as the vehicle type for this analysis. A "typ-ical" mid-sized SUV was defined by taking the averagecharacteristics of three U.S.-produced 1998 SUVs (FordExplorer, Jeep Grand Cherokee, and Chevy Blazer). Thefollowing are some of the characteristics obtained frompublished data of these three representative SUVs [15]:
Weight: 1817 kg curb weight + 136 kg cargo
Wheelbase: 2.75 m, % weight on front axle: 56%
CD = 0.44, Frontal Area = 2.5 m2
Engine: 144 kW (193 hp) gasoline SI
EPA fuel economy: 17 mpg combined city/highway
EXHAUST SYSTEM ENHANCEMENT AND VALIDA-TION OF ADVISOR – The thermal modeling of theexhaust system in ADVISOR was enhanced for thisanalysis. Instead of being a simple function of time, thecatalyst temperature was predicted via a lumped-capaci-tance approach. Based on second-by-second fuel useduring the drive cycle, the exhaust gas flow rate andengine-out temperature were calculated. The exhaustgas then lost heat to the exhaust manifold and downpipeprior to reaching the converter. The converter was mod-eled via a four-node lumped capacitance model: (1)monoliths, (2) inner steel shell (and PCM for VICC), (3)outer shell, (4) inlet/outlet pipes. Heat exchange from thegas to the converter nodes, between converter nodes,and from the converter to the ambient was modeled viaappropriate conduction, convection, and radiation equa-tions. Within the converter, the heat of catalysis is esti-mated based on the g/s of each emission component(HC, CO, and NOx) being catalyzed [16]. This heat addsto the rate of converter warmup. Within the inner steelshell (converter node #2), the model included the capa-bility to specify the amount and type (melting point andtransformation enthalpy) of phase change heat storagematerial. By varying these PCM and thermal conductionparameters, both conventional and vacuum-insulatedconverters could be modeled.
7
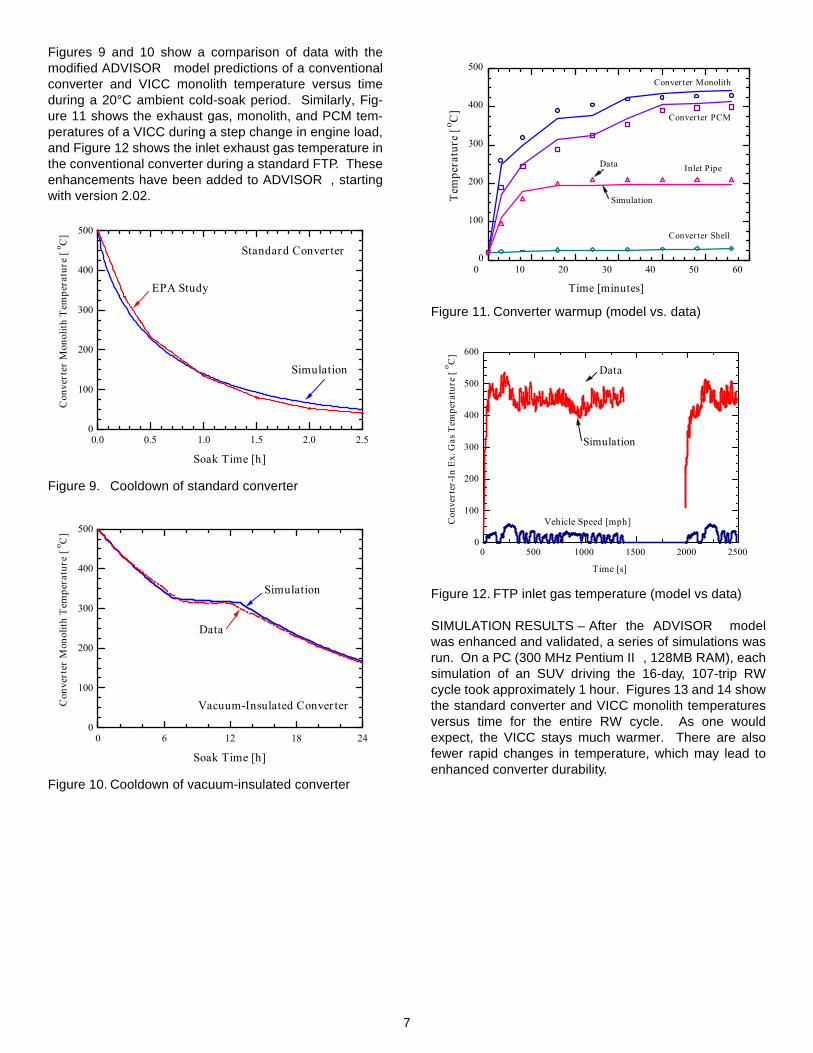
Figures 9 and 10 show a comparison of data with themodified ADVISOR model predictions of a conventionalconverter and VICC monolith temperature versus timeduring a 20°C ambient cold-soak period. Similarly, Fig-ure 11 shows the exhaust gas, monolith, and PCM tem-peratures of a VICC during a step change in engine load,and Figure 12 shows the inlet exhaust gas temperature inthe conventional converter during a standard FTP. Theseenhancements have been added to ADVISOR, startingwith version 2.02.
Figure 9. Cooldown of standard converter
Figure 10. Cooldown of vacuum-insulated converter
Figure 11. Converter warmup (model vs. data)
Figure 12. FTP inlet gas temperature (model vs data)
SIMULATION RESULTS – After the ADVISOR modelwas enhanced and validated, a series of simulations wasrun. On a PC (300 MHz Pentium II, 128MB RAM), eachsimulation of an SUV driving the 16-day, 107-trip RWcycle took approximately 1 hour. Figures 13 and 14 showthe standard converter and VICC monolith temperaturesversus time for the entire RW cycle. As one wouldexpect, the VICC stays much warmer. There are alsofewer rapid changes in temperature, which may lead toenhanced converter durability.
Simulation
EPA Study
0
100
200
300
400
500
Con
vert
er M
onol
ith T
empe
ratu
re [
o C]
0.0 0.5 1.0 1.5 2.0 2.5
Soak Time [h]
Standard Converter
Data
Simulation
Vacuum-Insulated Converter
0 6 12 18 24
Soak Time [h]
0
100
200
300
400
500
Con
vert
er M
onol
ith T
empe
ratu
re [
o C]
0 10 20 30 40
Time [minutes]
50 600
100
200
300
500
Tem
pera
ture
[o C
] 400
Data
Simulation
Converter Shell
Inlet Pipe
Converter PCM
Converter Monolith
0
100
200
300
400
500
600
Con
vert
er-I
n E
x. G
as T
empe
ratu
re [
o C]
0 500 1000 1500 2000 2500
Time [s]
Vehicle Speed [mph]
Data
Simulation
8
Figure 13. Standard converter temperature
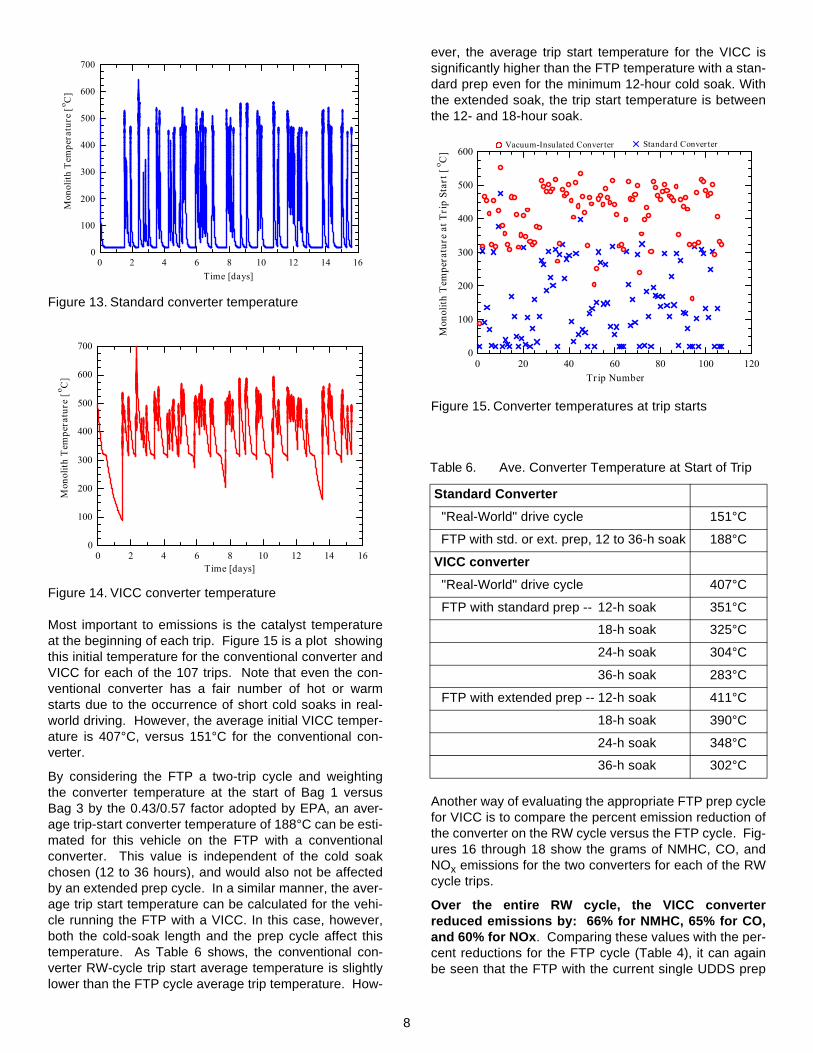
Figure 14. VICC converter temperature
Most important to emissions is the catalyst temperatureat the beginning of each trip. Figure 15 is a plot showingthis initial temperature for the conventional converter andVICC for each of the 107 trips. Note that even the con-ventional converter has a fair number of hot or warmstarts due to the occurrence of short cold soaks in real-world driving. However, the average initial VICC temper-ature is 407°C, versus 151°C for the conventional con-verter.
By considering the FTP a two-trip cycle and weightingthe converter temperature at the start of Bag 1 versusBag 3 by the 0.43/0.57 factor adopted by EPA, an aver-age trip-start converter temperature of 188°C can be esti-mated for this vehicle on the FTP with a conventionalconverter. This value is independent of the cold soakchosen (12 to 36 hours), and would also not be affectedby an extended prep cycle. In a similar manner, the aver-age trip start temperature can be calculated for the vehi-cle running the FTP with a VICC. In this case, however,both the cold-soak length and the prep cycle affect thistemperature. As Table 6 shows, the conventional con-verter RW-cycle trip start average temperature is slightlylower than the FTP cycle average trip temperature. How-
ever, the average trip start temperature for the VICC issignificantly higher than the FTP temperature with a stan-dard prep even for the minimum 12-hour cold soak. Withthe extended soak, the trip start temperature is betweenthe 12- and 18-hour soak.
Figure 15. Converter temperatures at trip starts
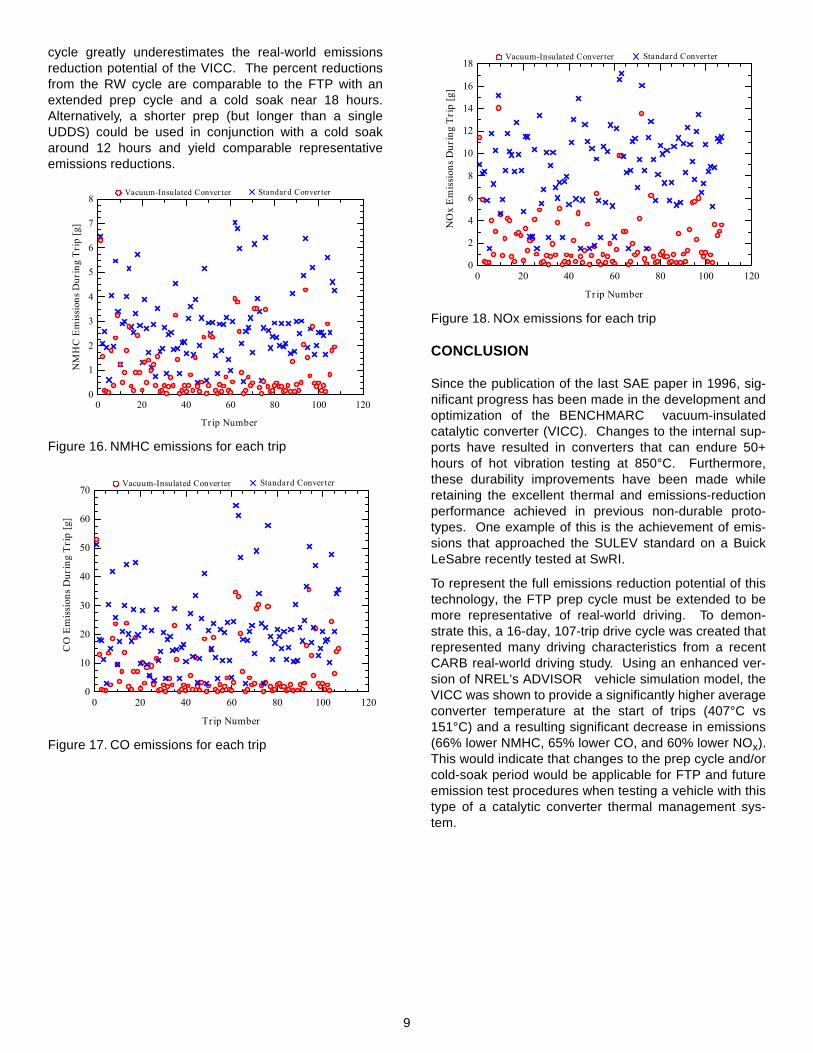
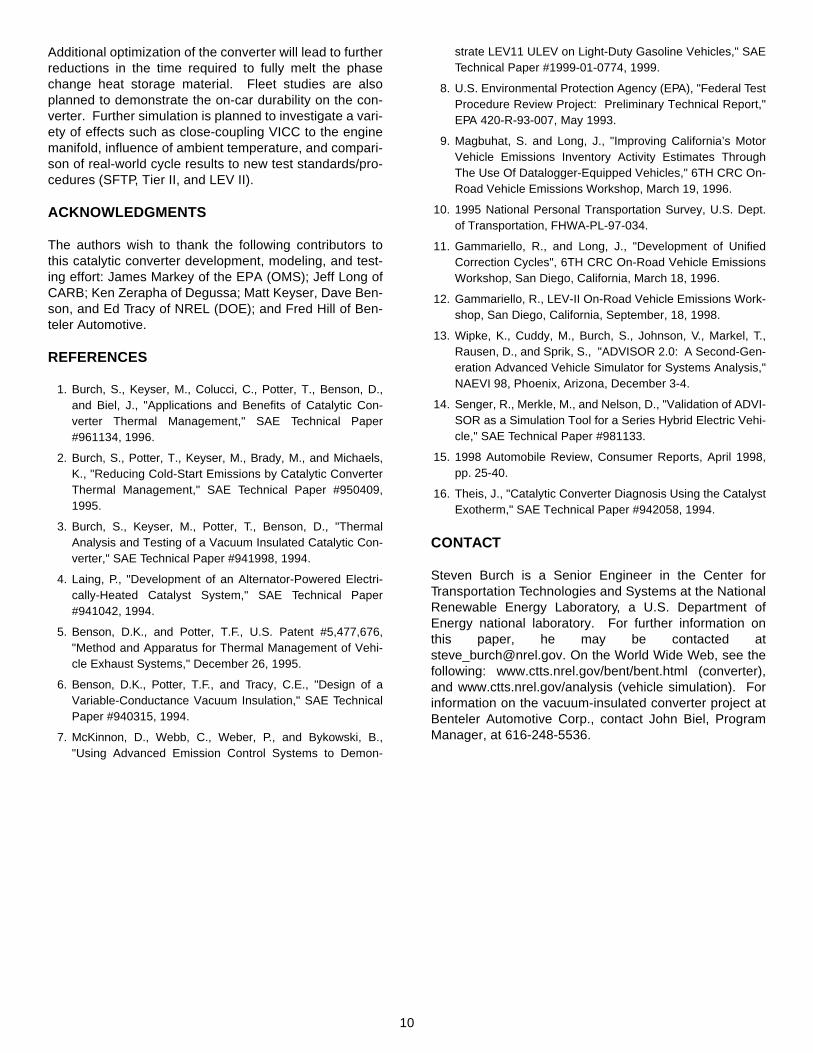
Another way of evaluating the appropriate FTP prep cyclefor VICC is to compare the percent emission reduction ofthe converter on the RW cycle versus the FTP cycle. Fig-ures 16 through 18 show the grams of NMHC, CO, andNOx emissions for the two converters for each of the RWcycle trips.
Over the entire RW cycle, the VICC converterreduced emissions by: 66% for NMHC, 65% for CO,and 60% for NOx. Comparing these values with the per-cent reductions for the FTP cycle (Table 4), it can againbe seen that the FTP with the current single UDDS prep
0
100
200
300
400
500
600
700M
onol
ith T
empe
ratu
re [
o C]
0 2 4 6 8 10 12 14 16Time [days]
0
100
200
300
400
500
600
700
Mon
olith
Tem
pera
ture
[o C
]
0 2 4 6 8 10 12 14 16Time [days]
Table 6. Ave. Converter Temperature at Start of Trip
Standard Converter
"Real-World" drive cycle 151°C
FTP with std. or ext. prep, 12 to 36-h soak 188°C
VICC converter
"Real-World" drive cycle 407°C
FTP with standard prep -- 12-h soak 351°C
18-h soak 325°C
24-h soak 304°C
36-h soak 283°C
FTP with extended prep -- 12-h soak 411°C
18-h soak 390°C
24-h soak 348°C
36-h soak 302°C
Vacuum-Insulated Converter Standard Converter
0 20 40 60 80 100 120Trip Number
0
100
200
300
400
500
600
Mon
olith
Tem
pera
ture
at T
rip
Star
t [o C
]
9
cycle greatly underestimates the real-world emissionsreduction potential of the VICC. The percent reductionsfrom the RW cycle are comparable to the FTP with anextended prep cycle and a cold soak near 18 hours.Alternatively, a shorter prep (but longer than a singleUDDS) could be used in conjunction with a cold soakaround 12 hours and yield comparable representativeemissions reductions.
Figure 16. NMHC emissions for each trip
Figure 17. CO emissions for each trip
Figure 18. NOx emissions for each trip
CONCLUSION
Since the publication of the last SAE paper in 1996, sig-nificant progress has been made in the development andoptimization of the BENCHMARC vacuum-insulatedcatalytic converter (VICC). Changes to the internal sup-ports have resulted in converters that can endure 50+hours of hot vibration testing at 850°C. Furthermore,these durability improvements have been made whileretaining the excellent thermal and emissions-reductionperformance achieved in previous non-durable proto-types. One example of this is the achievement of emis-sions that approached the SULEV standard on a BuickLeSabre recently tested at SwRI.
To represent the full emissions reduction potential of thistechnology, the FTP prep cycle must be extended to bemore representative of real-world driving. To demon-strate this, a 16-day, 107-trip drive cycle was created thatrepresented many driving characteristics from a recentCARB real-world driving study. Using an enhanced ver-sion of NREL's ADVISOR vehicle simulation model, theVICC was shown to provide a significantly higher averageconverter temperature at the start of trips (407°C vs151°C) and a resulting significant decrease in emissions(66% lower NMHC, 65% lower CO, and 60% lower NOx).This would indicate that changes to the prep cycle and/orcold-soak period would be applicable for FTP and futureemission test procedures when testing a vehicle with thistype of a catalytic converter thermal management sys-tem.
Vacuum-Insulated Converter Standard Converter
0 20 40 60 80 100 120
Trip Number
0
1
2
3
4
5
6
7
8
NM
HC
Em
issi
ons
Dur
ing
Tri
p [g
]
Vacuum-Insulated Converter Standard Converter
0
10
20
30
40
50
60
70
CO
Em
issi
ons
Dur
ing
Tri
p [g
]
0 20 40 60 80 100 120
Trip Number
Vacuum-Insulated Converter Standard Converter
0 20 40 60 80 100 120
Trip Number
0
2
4
6
8
10
12
14
16
18
NO
x E
mis
sion
s D
urin
g T
rip
[g]
10
Additional optimization of the converter will lead to furtherreductions in the time required to fully melt the phasechange heat storage material. Fleet studies are alsoplanned to demonstrate the on-car durability on the con-verter. Further simulation is planned to investigate a vari-ety of effects such as close-coupling VICC to the enginemanifold, influence of ambient temperature, and compari-son of real-world cycle results to new test standards/pro-cedures (SFTP, Tier II, and LEV II).
ACKNOWLEDGMENTS
The authors wish to thank the following contributors tothis catalytic converter development, modeling, and test-ing effort: James Markey of the EPA (OMS); Jeff Long ofCARB; Ken Zerapha of Degussa; Matt Keyser, Dave Ben-son, and Ed Tracy of NREL (DOE); and Fred Hill of Ben-teler Automotive.
REFERENCES
1. Burch, S., Keyser, M., Colucci, C., Potter, T., Benson, D.,and Biel, J., "Applications and Benefits of Catalytic Con-verter Thermal Management," SAE Technical Paper#961134, 1996.
2. Burch, S., Potter, T., Keyser, M., Brady, M., and Michaels,K., "Reducing Cold-Start Emissions by Catalytic ConverterThermal Management," SAE Technical Paper #950409,1995.
3. Burch, S., Keyser, M., Potter, T., Benson, D., "ThermalAnalysis and Testing of a Vacuum Insulated Catalytic Con-verter," SAE Technical Paper #941998, 1994.
4. Laing, P., "Development of an Alternator-Powered Electri-cally-Heated Catalyst System," SAE Technical Paper#941042, 1994.
5. Benson, D.K., and Potter, T.F., U.S. Patent #5,477,676,"Method and Apparatus for Thermal Management of Vehi-cle Exhaust Systems," December 26, 1995.
6. Benson, D.K., Potter, T.F., and Tracy, C.E., "Design of aVariable-Conductance Vacuum Insulation," SAE TechnicalPaper #940315, 1994.
7. McKinnon, D., Webb, C., Weber, P., and Bykowski, B.,"Using Advanced Emission Control Systems to Demon-
strate LEV11 ULEV on Light-Duty Gasoline Vehicles," SAETechnical Paper #1999-01-0774, 1999.
8. U.S. Environmental Protection Agency (EPA), "Federal TestProcedure Review Project: Preliminary Technical Report,"EPA 420-R-93-007, May 1993.
9. Magbuhat, S. and Long, J., "Improving California’s MotorVehicle Emissions Inventory Activity Estimates ThroughThe Use Of Datalogger-Equipped Vehicles," 6TH CRC On-Road Vehicle Emissions Workshop, March 19, 1996.
10. 1995 National Personal Transportation Survey, U.S. Dept.of Transportation, FHWA-PL-97-034.
11. Gammariello, R., and Long, J., "Development of UnifiedCorrection Cycles", 6TH CRC On-Road Vehicle EmissionsWorkshop, San Diego, California, March 18, 1996.
12. Gammariello, R., LEV-II On-Road Vehicle Emissions Work-shop, San Diego, California, September, 18, 1998.
13. Wipke, K., Cuddy, M., Burch, S., Johnson, V., Markel, T.,Rausen, D., and Sprik, S., "ADVISOR 2.0: A Second-Gen-eration Advanced Vehicle Simulator for Systems Analysis,"NAEVI 98, Phoenix, Arizona, December 3-4.
14. Senger, R., Merkle, M., and Nelson, D., "Validation of ADVI-SOR as a Simulation Tool for a Series Hybrid Electric Vehi-cle," SAE Technical Paper #981133.
15. 1998 Automobile Review, Consumer Reports, April 1998,pp. 25-40.
16. Theis, J., "Catalytic Converter Diagnosis Using the CatalystExotherm," SAE Technical Paper #942058, 1994.
CONTACT
Steven Burch is a Senior Engineer in the Center forTransportation Technologies and Systems at the NationalRenewable Energy Laboratory, a U.S. Department ofEnergy national laboratory. For further information onthis paper, he may be contacted [email protected]. On the World Wide Web, see thefollowing: www.ctts.nrel.gov/bent/bent.html (converter),and www.ctts.nrel.gov/analysis (vehicle simulation). Forinformation on the vacuum-insulated converter project atBenteler Automotive Corp., contact John Biel, ProgramManager, at 616-248-5536.