sulfide flux from cold seeps using an isus chemical sensor josh plant ken johnson luke coletti steve...
TRANSCRIPT
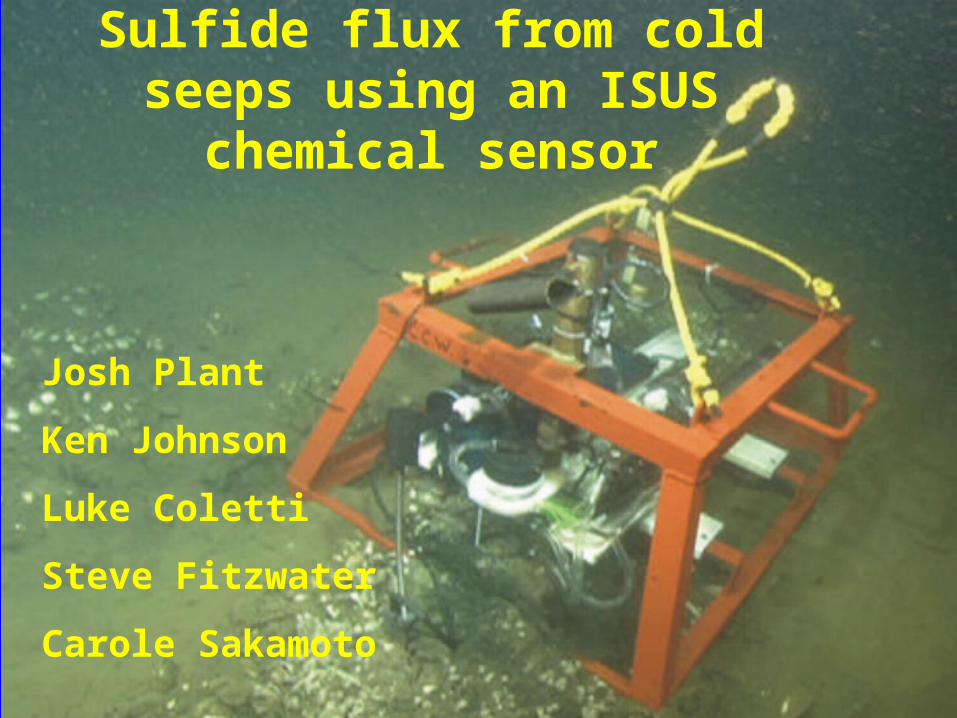
Sulfide flux from cold seeps using an ISUS chemical sensor
Josh Plant
Ken Johnson
Luke Coletti
Steve Fitzwater
Carole Sakamoto

Motivation
• Demonstrate optical measurements of HS- at depth over extended periods
• Chemical flux at cold seeps difficult to measure!
• Provide direct in situ measurements of chemical flux with enhanced temporal resolution

ISUSIn Situ Ultraviolet Spectrometer
Unique UV absorption spectrum allows direct measurement
Deconvolution of overlapping peaks enables determination of ion concentrations
Sample absorbance spectrum is sum of all absorbing species
HS- NO3- & Br- are the primary UV absorbers in seawater!
Change in spectrum is due to change in ion concentrations
Wavelength, nm200 230 260 290
Ab
sorb
ance
0
1
2
3
840 µM Br-
50 µM HS-
Sample spectrum
30 µM NO3-

HS- Standards in Seawater (mM)
Wavelength (nm)
200 220 240 260 280 300 320 340
Ab
sorb
ance
0
1
2
3
265 285
0.2
0.8
0 0.05
0.20
0.481.9
6.7
0.10
HS- is a strong UV absorber between 230 – 300 nm
Cold seep fluids high in HS-
Spectral deconvolution uses multiple wavelengths
Shift fit window to measure higher concentrations

RecircPump
ISUSHS-
FlushPump
pH
CTD
Sediment
RecircPump
ISUSHS-
CTD
pH
FlushPump
HS-
Tube of
100 m mesh
DeploymentRecirculationMeasureWaitRecirculationMeasureFlush
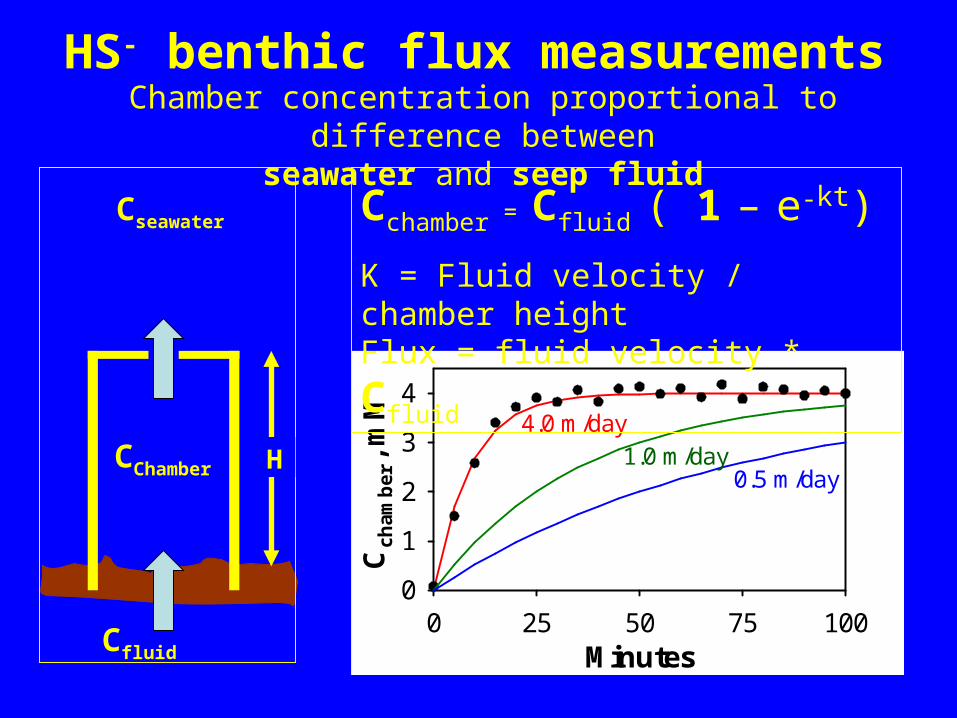
HS- benthic flux measurementsChamber concentration proportional to difference between
seawater and seep fluid
Cfluid
CChamber
Cseawater
Minutes0 25 50 75 100
Cch
amb
er ,
mM
0
1
2
3
4
0.5 m/day1.0 m/day
4.0 m/day
Cchamber = Cfluid ( 1 – e-kt)
K = Fluid velocity / chamber height
Flux = fluid velocity * Cfluid
H

Clams Barren Zone
Bacterial Mat
Most active seeps found in Monterey Bay
Very focused flow
Support chemosynthetic communities
960 meter depth
Extravert Cliff Seeps
2m x 1m


July 2006 Daily Velocity Calculations
Chamber flushed dailySampled hourly
Cfluid 2 – 4 mM HS-
Velocity 5 – 20 m day-1
Time , days0 2 4 6 8 10 12 14V
elo
cit
y,
m d
ay-1
0
10
20
Cfl
uid
, m
M
0
2
4
Hours0 2 4 6
HS
- mM
0
1
2
3Cfluid = 2.6 mM
3.0 m day-1

Time, days
2 4 6 8 10 12 14
Te
mp
, C
4
6
HS- ,
mM
0
2
4
July 2006 Flux Chamber data
Seep fills chamber in less than an hour!
Fluid Velocity an underestimate in high flow cases
Temperature and HS- correlated

959
960
961
HS
- , m
M
0
1
2
3
4
T1
T2 Tide
Time, days2 4 6 8 10
De
pth
, m
959
960
961
Te
mp
, C
4
5
6
7
September 2006 Flux Chamber dataFlush every 30 minutes
2 samples per cycle, Time 1 and Time 2
Chamber concentration related to tides

September 2006 Velocity Calculations
Strong tidal signal - highest flow at low tide!
Velocity similar to July data 5 to 30 m day-1
30 to 180 Liters day-1 through 8cm diameter chamber
Time, days2 4 6 8 10
Vel
oci
ty, m
day
-1
0
10
20
30
Dep
th, m
959
960
961Tide
Velocity

Temperature & HS- highly correlated
Relationship similar on July & Sept deployments
3 degrees above ambient
Warm sulfide rich source – a warm seep!!
HS-, mM0 1 2 3 4 5
Tem
per
atu
re, C
4
5
6
7
JULY
SEPT

Conclusions
ISUS effective for high resolutionHS- measurements
Fluid flow 100x faster than previous measurements in area
Enabled resolution of velocity response to tides
System adaptable

AcknowledgementsDavid and Lucile Packard Foundation
R / V Point Lobos crew and Ventana pilots
Shannnon Boedecker & Annette Gough