sulfur loading and energy density of flexible li-s ... · improved hummer’s method. typically,...
TRANSCRIPT

Supplementary information
A freestanding hierarchically structured cathode enables high
sulfur loading and energy density of flexible Li-S batteries
Jianpeng Liu,a,† Zhong Li,a,† Beibei Jia,a,†Juncheng Zhu,b,* Wenliang Zhu,c,* Jianping
Li,d Hao Pan,d Bowen Zheng,a Liangyin Chen,e Giuseppe Pezzotti,c and Jiliang Zhua*
aCollege of Materials Science and Engineering, Sichuan University, Chengdu 610064, China.bSchool of Chemistry and Materials, University of Science & Technology of China, Hefei, Anhui 230026, China.cCeramic Physics Laboratory, Kyoto Institute of Technology, Sakyo-ku, Matsugasaki, Kyoto 606-8585, Japan.dAutomotive & Transportation Engineering, Shenzhen Polytechnic, Shenzhen 518055, Guangdong, China.eInstitute for Industrial Internet Research (I3R), Sichuan University, Chengdu 610064, China†These authors contributed equally to this work. *Email address: [email protected] (JC Z), [email protected] (WL Z), [email protected] (JL Z)
Electronic Supplementary Material (ESI) for Journal of Materials Chemistry A.This journal is © The Royal Society of Chemistry 2020
Supplementary Methods
Method S1. Synthesis of graphene oxide (GO)
GO nanosheets were synthesized using pre-oxidized graphite powder via an
improved Hummer’s method. Typically, 7.5 g P2O5, 7.5 g K2S2O8 and 9 g graphite
powder were mixed in 55 mL concentrated sulfuric acid and stirred at 80℃ for 5 h.
The mixture was filtrated, washed with deionized water and dried overnight to obtain
pre-oxidized graphite powder.
The as-prepared pre-oxidized graphite powder, together with 4.5 g NaNO3 were
dispersed in 245 mL concentrated sulfuric acid in an ice bath. Then, 27.8 g KMnO4
was slowly added into the solution at a system temperature of below 5 ℃. After 4 hours
of ice bath, the mixture was transferred into a water bath of 35 ℃ and vigorously stirred
for 4 hours. Finally, the mixture was filtrated, washed with diluted HCl and deionized
water, respectively, and dried overnight to obtain GO films.
The investigated 3D graphene (3D-G) was obtained by adding ammonia and
hydrazine hydrate into a mixture of anhydrous ethanol and water with dispersed GO,
keeping the system at 100 ℃ for 2 h, and then drying up the filtrated cream in a freezer.
Method S2. Schematic illustration of soft-packaged cell assembly
Soft-packaged cells with different capacities were assembled in an Ar-filled glove
box. The anode was fabricated by rolling lithium foil (250 μm) onto Cu foil (9 μm).
Typically, the cathode and membrane were overlapped and folded into a U shape. Then
the anode was inserted into the “U”. The whole material was folded again and put into
an Al-laminated-film bag. Electrolyte was injected and the battery was vacuum-

packaged after 30 min. The same electrolyte as used in coin cell was utilized in the
soft-packaged cell. The ratio of electrolyte volume (μL) to the electrode material (S)
mass (mg) was 2.9:1 in all test cells. All the cells were packaged at minus ninety
kilopascals.

Supplementary Figures
Fig. S1 | SEM images and EDS spectra of HM-SiO2 (a,c) and CHM-SiO2 (b,d). (Pt was detected due to the sputtered Pt coating on the samples for SEM measurements)

Fig. S2 | (a) TEM image of CHM-SiO2. (b, c) HRTEM images of CHM-SiO2.
C
C

Fig. S3 | Microscopic characterization of 3D-G. (a) SEM image of 3D-G. (b) TEM image of 3D-G.

Fig. S4 | (a) Cross-sectional SEM image of 3D-GCSS. (b) TEM image of CHM-SiO2/S on 3D-G.

Fig. S5 | SEM images of CHM-SiO2 composited with (a) super P and (b) graphite.

Fig. S6 | Elemental mapping of (a) S, (b) Si and (c) O in the CHM-SiO2/S composite.

Fig. S7 | Variations of solution color with the addition of 3D-GCS, 3D-G and commercial SiO2 in an electrolyte solution of Li2S6. The yellow/brown Li2S6 solution quickly became transparent and colorless upon adding 3D-GCS demonstrating good affinity and strong capability for LiPS-adsorption of 3D-GCS.

Fig. S8 | (a) Electrical resistance of 3D-GCSS with different sulfur loading. (b,c) Cycling performance at (b) 0.7C and (c) 1C current rates.

Fig. S9 | Cycling performances of hollow-mesoporous SiO2/S (HM-SiO2/S), carbon-encapsulated hollow-mesoporous SiO2/S(CHM-SiO2/S), 3D-graphene/S (3D-G/S) and 3D-GCSS/Al.

Fig. S10 | (a,b) The 3D-GCSS electrode under force shows structural integrity and stability. (c,d) The optical images show a red LED lighted by a (c) flat and (d) bent Li–S soft-packaged cell.

Supplementary Figure 11 | The cross-sessional SEM image of the 3D-GCSS after cycling.
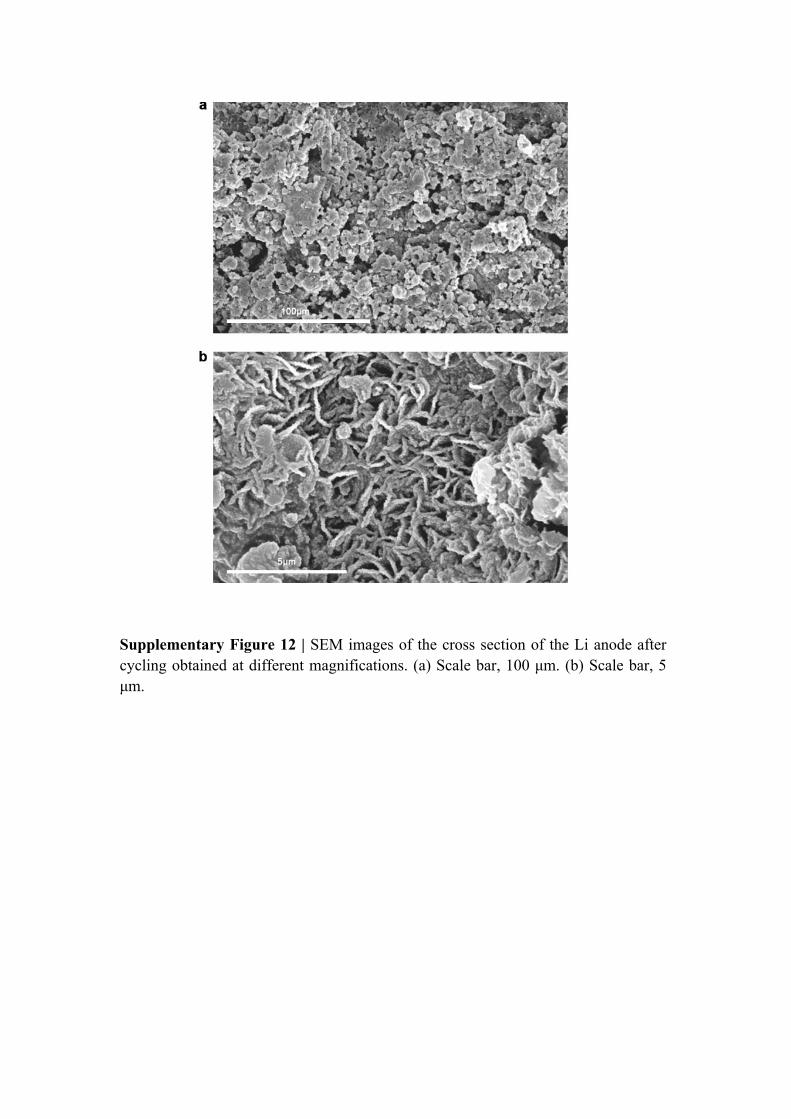
Supplementary Figure 12 | SEM images of the cross section of the Li anode after cycling obtained at different magnifications. (a) Scale bar, 100 μm. (b) Scale bar, 5 μm.

Supplementary Tables
Table S1 | EIS fitting results of 3D-GCSS and 3D-GCSS/Al.
Cathode RsRct
W-R W-T W-PCPE1-T
CPE1-P
Rct2CPE2-T
CPE2-P
3D-GCSS/Al
479.38
19.19 10.40.27566
1.5567E-
5
0.7768
25.14
9.2774E-
4
0.7343
3D-GCSS 2 5 2.6012.63
20.29552
1.8 E-4
0.706
0.251.45
43.288E-10

Table S2 | Cycling performance of HM-SiO2/S, CHM-SiO2/S and 3D-G/S.
5th Cycling 200th Cycling
Cathode Discharge Capacity (mAh/g)
Coulombic Efficiency
(%)
Discharge Capacity (mAh/g)
Coulombic Efficiency
(%)
Capacity Retention
(%)
3D-GCSS/Al 1250.0 99.2 772.4 96.1 61.8
HM-SiO2/S 650.3 99.8 484.5 97.3 74.5
3D-G/S 1241.0 96.5 51.2 82 4.1
CHM-SiO2/S 974.3 100.0 650.6 98.6 66.8

Table S3 | Comparisons of the references.
Coin CellRef.
Sulfur Loading
Cycles (Cycling Rate)Initial
CapacityCapacity Retention
5 6.2 mg/cm2100(0.5mA and 1 mA/cm2
before and after 5th)7.8 mAh/cm2 83%
6 5.4 mg/cm2 200(0.5C) 1105 mAh/g 799 mAh/g
8 56wt% 500(1C) 1036 mAh/g 681 mAh/g
11 9.6 mg/cm2 100 12.3 mAh/cm2 78%
12 1 mg/cm2 200(0.1C) 1670 mAh/g 1142 mAh/g
14 2.5 mg/cm2 100(0.2C) 983 mAh/g 858 mAh/g
15 70wt% 20(0.1C) 1400 mAh/gMore than
1000 mAh/g
16 1.1 mg/cm2 100(0.1C) 1264 mAh/g 866 mAh/g
17 2.9 mg/cm2 100(0.2C) 1396 mAh/g 844 mAh/g
18 14.36 mg/cm2 350(0.2C) 1000 mAh/g 645 mAh/g
192.0~3.0mg/cm2
1500(1C) 745 mAh/g 273 mAh/g
201.5~2.1 mg/cm2
50(0.3A/g) 1278 mAh/g 1150 mAh/g
21 3.9 mg/cm2 100(0.2C) 1360 mAh/g 940 mAh/g
22 1.5 mg/cm2 800(2C) 780 mAh/g 480 mAh/g
231.0~2.0 mg/cm2
200(0.2C) 1420 mAh/g 985 mAh/g
24 1~3 mg/cm2 100(0.1C) 1044 mAh/g 99%
250.4~0.6 mg/cm2
1000(0.5C) 1030 mAh/g 700 mAh/g
26 4.8 mg/cm2 100(0.5C) 1510 mAh/g 1267 mAh/g
27 9.3 mg/cm2 100(0.2C)More than
1000 mAh/g665 mAh/g

28 4 mg/cm2 100(0.2C) 600 mAh/g 570 mAh/g
29 4.7 mg/cm2 90(0.2C) 900 mAh/g 700 mAh/g
35 5 mg/cm2 400(0.34 A/g) 1500 mAh/g 841 mAh/g
37 1.3 mg/cm2 100(0.75 A/g) 1052 mAh/g 950 mAh/g
Soft-packaged CellRef.
Sulfur Loading
Cycles Capacity Energy Density
5 6.9 mg/cm2 11 1Ah level366 Wh/kg581 Wh/L
8 — 50 1187 mAh/g1416 Wh/kg
(For Cathode)
16 — 30985 mAh/g
(under bending condition)
N/A
250.4~0.6mg/cm2
Discharge for over 20 h 1110 mAh/g N/A
Cell performance of this work
Cell type Cell parameters Calculation item
Surfer load(mg/cm2
)
Current density (1 C=1672 mA/g)
Energy density (Wh/kg)
0.50 C 2050
0.70 C 1701 6
1.00 C 973
0.50 C 1880
0.70 C 1566 8
1.00 C 960
0.50 C 1549
0.70 C 1277
Coin
Cathode surface area: 1.1 cm2
2302 TYPE Cathode
10
1.00 C 534
Entire cell
20 0.75 mA/cm2 371 Soft-packaged Cell
Cathode: 160 cm2
Capacitance: 2.15 Ah
Size: 4 cm×5 cm×3 mm
Cathode 200.75 mA/cm2 1055

Cathode + Anode
20 0.75 mA/cm2 782
Pouch Cell
shown in the
movies
Cathode:27 cm2
Capacitance: 0.6 AhSize:
3 cm×9 cm×300 µm
Cathode 20(Fixed
bending)20(Continuous bending for 1000 cycles)
0.1 C 1616

Table S4 | The EIS fitting results of soft-packaged cell.
Cycling Condition
Rs Rct W-RW-T
W-PCPE1
-TCPE1-P
Rct2CPE2-T
CPE2-P
Before dischargin
g1.28 0.38 1.22 1
0.105
E-4 0.85 0.15 0.01 0.8
After 1st 1.4 1.09 0.7 8.6 0.25 1.9 E-4 0.78 0.15 0.01 0.9
After 5th 1.35 1.121.15
522 0.29 8E-5 0.87 0.15 0.01 0.9
After 15th 1.1 1.15 0.5 50.32
57E-5
0.879
0.54 0.2 0.32
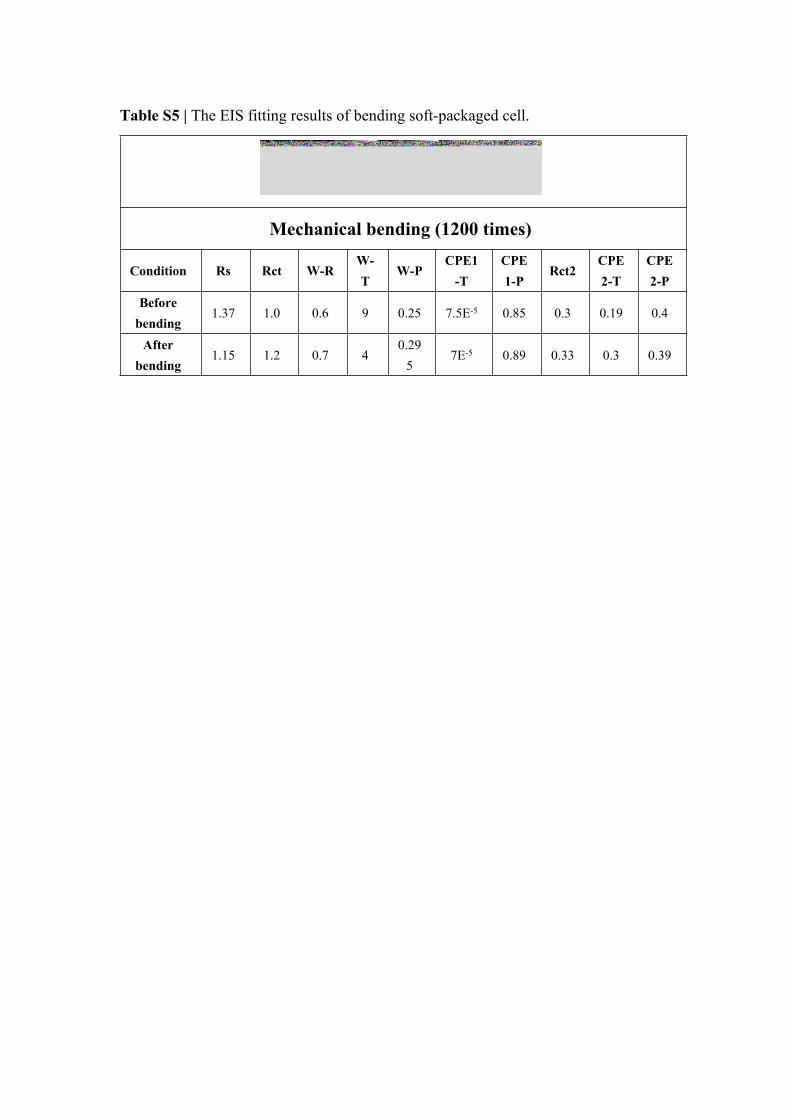
Table S5 | The EIS fitting results of bending soft-packaged cell.
Mechanical bending (1200 times)
Condition Rs Rct W-RW-T
W-PCPE1
-TCPE1-P
Rct2CPE2-T
CPE2-P
Before bending
1.37 1.0 0.6 9 0.25 7.5E-5 0.85 0.3 0.19 0.4
After bending
1.15 1.2 0.7 40.29
57E-5 0.89 0.33 0.3 0.39

Supplementary Movies
Movie S1 | Exhibition of the flexibility of the freestanding 3D GCSS.
Movie S2 | Exhibition of the constant bending and folding of the Li-S soft-
packaged battery.
Movie S3 | Exhibition of the dynamic bending experiment of the Li-S soft-
packaged battery.
Movie S4 | Exhibition of 180 degrees folded 1 Ah Li-S soft-packaged battery
attached on the small electric toy vehicle.
Movie S5 | Exhibition of the small electric toy vehicle driven by 1 Ah battery in a
circle with a diameter of 20 cm.