sumit k singhsumitsingh.yolasite.com/resources/indian automotive industry...maruti 18.26 25.58 22.93...
TRANSCRIPT

Sumit K Singh

IntroductionWhy automotive industry?
The industry has seen tremendous growth over last 5 years
Highly sensitive to demand and can be affected by external factors
Capital intensive industry
What are we doing?
Analyzing the financial ratios, financial statements to gauge the
health of three different companies
Sumit K Singh

Sumit K Singh

Liquidity Measurement Ratio
Ind. Ave. FY2009 FY2008 FY2007 FY2006 FY2005
Maruti 0.87 1.14 0.91 1.40 1.77 1.67
Tata 0.56 0.65 0.86 1.07 0.98
M&M 0.90 0.86 1.31 1.21 1.10
Current Ratio
Ind. Ave. FY2009 FY2008 FY2007 FY2006 Fy2005
Maruti 0.77 0.98 0.66 1.13 1.31 1.25
Tata 0.49 0.66 0.92 0.97 0.76
M&M 0.83 0.74 1.01 0.84 0.79
Quick Ratio
Sumit K Singh

Profitability Indicator Ratio
Ind. Ave. Fy2009 FY2008 FY2007 FY2006 FY2005
Maruti 5.20% 5.68% 9.34% 10.29% 9.53% 7.57%
Tata 3.90% 6.96% 6.94% 7.35% 7.02%
M&M 6.22% 9.45% 10.34% 10.28% 7.565
Net Profit Margin
Ind. Ave. FY2009 FY2008 FY2007 FY2006 Fy2005
Maruti 8.67% 11.95% 18.58% 20.87% 21.52% 18.21%
Tata 4.79% 14.37% 17.59% 18.04% 18.72%
M&M 9.00% 15.91% 20.59% 22.60% 16.73%
Return on Assets
Ind. Ave. FY2009 FY2008 Fy2007 Fy2006 Fy2005
Maruti 13.78% 17.31% 20.56% 22.79% 21.81% 19.49%
Tata 8.19% 25.98% 27.96% 27.74% 30.09%
M&M 16.03% 25.51% 30.18% 29.60% 25.66%
Return of Equity
Sumit K Singh

Debt Ratio
Ind. Ave. FY2009 Fy2008 Fy2007 Fy2006 Fy2005
Maruti 31.55% 6.85% 10.00% 8.00% 1.29% 6.56%
Tata 49.82% 44.00% 36.00% 34.66% 37.77%
M&M 44.00% 37.00% 32.00% 23.20% 34.30%
Debt Ratio
Ind. Ave. Fy2009 Fy2008 Fy2007 FY2006 Fy2005
Maruti 16.26 33.86 40.93 60.01 90.62 36.56
Tata 2.60 6.28 7.19 7.62 8.64
M&M 8.25 14.64 67.24 32.17 23.85
Interest Coverage Ratio
Sumit K Singh

Operating Performance Ratio
Ind. Ave. FY2009 Fy2008 Fy2007 FY2006 FY2005
Maruti 1.51 1.99 1.94 1.98 2.21 2.36
Tata 1.01 2.06 2.49 2.40 2.63
M&M 1.46 1.64 1.92 2.16 2.17
Total Assets Turnover
Ind. Ave. FY2009 FY2008 FY2007 FY2006 FY2005
Maruti 18.26 25.58 22.93 21.27 14.15 16.90
Tata 12.82 14.43 11.02 10.32 10.99
M&M 14.60 12.49 11.75 9.48 8.92
Inventory Turnover
Sumit K Singh

Cash Flow Indicator Ratios
Ind. Ave. FY2009 Fy2008 Fy2007 Fy2006 Fy2005
Maruti 8.06% 7.87% 10.13% 13.69% 10.00% 9.70%
Tata 5.04% 21.40% 8.29% -1.10% 7.27%
M&M 12.42% 7.30% 11.70% 8.00% 5.75%
Operating Cash Flow-to-Sales Ratio
Ind. Ave Fy2009 Fy2008 FY2007 Fy2006 Fy2005
Maruti 23.00% 8.29% 9.78% 9.72% 9.69% 7.73%
Tata 28.80% 32.51% 35.34% 37.13% 41.68%
M&M 37.29% 29.10% 30.39% 32.45% 33.54%
Dividend Payout Ratio
Sumit K Singh
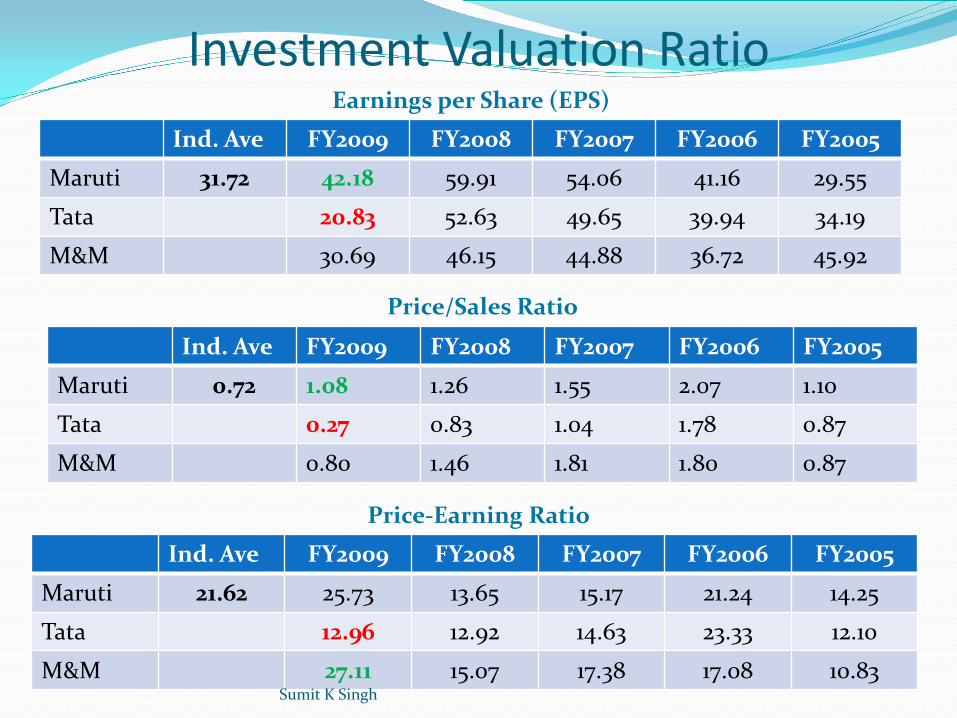
Investment Valuation Ratio
Ind. Ave FY2009 FY2008 FY2007 FY2006 FY2005
Maruti 31.72 42.18 59.91 54.06 41.16 29.55
Tata 20.83 52.63 49.65 39.94 34.19
M&M 30.69 46.15 44.88 36.72 45.92
Earnings per Share (EPS)
Ind. Ave FY2009 FY2008 FY2007 FY2006 FY2005
Maruti 0.72 1.08 1.26 1.55 2.07 1.10
Tata 0.27 0.83 1.04 1.78 0.87
M&M 0.80 1.46 1.81 1.80 0.87
Price/Sales Ratio
Ind. Ave FY2009 FY2008 FY2007 FY2006 FY2005
Maruti 21.62 25.73 13.65 15.17 21.24 14.25
Tata 12.96 12.92 14.63 23.33 12.10
M&M 27.11 15.07 17.38 17.08 10.83
Price-Earning Ratio
Sumit K Singh

Sumit K Singh

Trend Analysis
0.00
0.50
1.00
1.50
2.00
FY2005 FY2006 FY2007 FY2008
Liquidity ratios
CR
QR
0.00
5.00
10.00
15.00
20.00
25.00
FY2005 FY2006 FY2007 FY2008
Asset turnover
FA Turnover
TA Turnover
Inv Turnover
0.00%
20.00%
40.00%
60.00%
80.00%
100.00%
FY2005 FY2006 FY2007 FY2008
Leverage ratio
Debt Ratio
D/E Ratio
TIE
0.00%
10.00%
20.00%
30.00%
40.00%
FY05 FY06 FY07 FY08 FY09
Profitability ratios
Op Profit Margin
Net Profit Margin
ROA
ROE
BEP
Sumit K Singh

Trend Analysis
0
1
2
3
4
5
6
7
FY05 FY06 FY07 FY08 FY09
Investment valuation
EPS/10
Price/Book Value/10
PE Ratio/10
Price/Sales
Dividend Yield
Sumit K Singh

Sumit K Singh

Analysis –FY’04 to FY’08 Gradual increase in operating income over the years FY’08 operating income was 120% of that of FY’04
For FY’08 In FY ’08 Fixed asset turnover is 2.68( In FY’07---5.01) , Total asset turnover is 2.06 (relatively constant over 5 years) Current ratio has fallen to 0.65 from 0.86.
As Total asset turnover is constant, Current assets in terms of short term investments have fallen, investments in long terms assets have increased causing increase in total assets thereby causing decrease in ROA and Fixed asset turnover as assets have increased at higher rate than sales and net income
Factors causing negative impact Factors causing positive impactOther recurring income fell drastically to 389 crore against 887 crore in FY’07
Expenses capitalized was highest at -1,131 crore (reducing total expense)
Debt to equity ratio increased to 0.8 thus interest expense rose from 1.75% to 2%
Depreciation was lowest
Thus, due to higher interest and tax expense PAT was only 6.78% despite highest PBDIT
Quick ratio almost equal to current ratio at 0.66 and inventory turnover was highest at 14.63%
Sumit K Singh

For FY’07
Operating income was highest and had record growth of 32% YOY with operating income in FY’07 at 26,664 crore against 20,088 crore in FY’06
Factors causing negative impact Factors causing positive impactCost for material consumed was highest at 73.24% of operating income, more than in FY’08 which had comparative higher sales
Depreciating expenses was lowest
Declining other sources of income Improved recovery as write offs were 0.32% of operating income was better than that of previous years
Despite record YOY growth due to factors mentioned above, duel to factors mentioned above PAT was at 6.32% as compared to 6.78% in FY’06
Sumit K Singh

For FY’06
Adjusted PBDIT was 14.10% was highest
Factors causing negative impact Factors causing positive impactIncrease in dept financing caused interest expense to rise 1.74% of operating income highest over the years
Availability of cheap raw material-71.56% of operating
Higher Tax expense as compared to FY’05 and FY’07
Efficient operationsAdministrative expense lowest
Thus due to higher interest and tax expense PAT was only 6.78% despite highest PBDIT
Other recurring income was highest at 3.41% of operating income
Sumit K Singh

-1500
-1000
-500
0
500
1000
1500
2000
FY-04 FY-05 FY-06 FY-07 FY-08
PAT
Other source of income
Expense capitalization
0
0.2
0.4
0.6
0.8
1
1.2
1.4
FY-04 FY-05 FY-06 FY-07 FY-08
Debt to Equity
EPS normalised
Relation between PAT-Other source of income and expense capitalization
Relation between EPS and Debt to equity ratio
0.00%
5.00%
10.00%
15.00%
20.00%
25.00%
30.00%
35.00%
FY-04 FY-05 FY-06 FY-07 FY-08
SSGR
YOY growth
SSGR vs Growth rate
Sumit K Singh

Sumit K Singh

ROE and its decline: An analysis
2004 2005 2006 2007 2008
Sales/TA 1.31 1.35 1.24 1.09 0.93
NPM (%) 7.56 10.28 10.34 9.45 6.22
TA/CE 2.52 2.08 2.27 2.39 2.69
Sumit K Singh

DuPont Analysis
As observed, Net profit margin is reduced by a bigger margin
It can be concluded based on DuPont analysis that the decline in net profit margin (i.e. – operational efficiency) is a major contributor to the decline in ROE.
Sumit K Singh

Trend Analysis
86.50%87.00%87.50%88.00%88.50%89.00%89.50%90.00%90.50%91.00%91.50%92.00%
Mar ' 04 Mar ' 05 Mar ' 06 Mar ' 07 Mar ' 08
0%1%2%3%4%5%6%7%8%
Mar ' 04 Mar ' 05 Mar ' 06 Mar ' 07 Mar ' 08
0%
1%
2%
3%
4%
5%
6%
7%
8%
Mar ' 04 Mar ' 05 Mar ' 06 Mar ' 07 Mar ' 08
Expenses Financial Expenses
Administrative Expenses
Sumit K Singh

Altman Bankruptcy Prediction Model
Z 2004 2005 2006 2007 2008
Tata Motors 4.28 4.27 4.02 4.05 3.15
Maruti 3.39 3.68 4.10 4.01 3.68
M&M 3.32 3.35 3.13 2.56 2.13
Sumit K Singh

Conclusion
As per the analysis, Maruti Suzuki looks to be the best among the three in terms of financial risk
As per the FY2008 data and the annual report loss of 25 billion rupees, Tata motors shows signs of decline
M & M's operational inefficiencies are prime cause of concern for the company and a key driver for it to land into distress zone in Altman's prediction model
Sumit K Singh

Sumit K Singh