summary feasibility studies for selected sub sectors
TRANSCRIPT

2015
Ministry of
Industry
1/2/2015
Summary Feasibility Studies for Selected Sub sectors

ii
Table of Contents
I. FEASIBILITY STUDY FOR THE ESTABLISHMENT OF COFFEE PROCESSING PLANT ................................. 1
1.1 Introduction ................................................................................................................................... 2
1.2 Analysis of the Business Environment and Incentives for Investors ............................................ 2
1.1 Market Study ................................................................................................................................. 3
1.2.1 Product Description and Application ..................................................................................... 3
1.2.2 Local Market .......................................................................................................................... 3
1.2.3 Export Market ........................................................................................................................ 8
1.2.4 Plant Capacity and Production Program .............................................................................. 12
1.2 Technical Study .......................................................................................................................... 13
1.2.5 Materials and Inputs ............................................................................................................. 13
1.2.6 Location, Site and Environment ........................................................................................... 13
1.2.7 Technology and Engineering ............................................................................................... 14
1.2.8 Organization and Manpower ................................................................................................ 14
1.2.9 Implementation Schedule ..................................................................................................... 14
1.3 Financial and Economic Analysis ............................................................................................... 15
II. FEASIBILITY STUDY FOR THE ESTABLISHMENT OF CORN PROCESSING PLANT ....... 17
1. Introduction ................................................................................................................................... 18
1.1. Background .................................................................................................................................... 18
1.2. Market study ............................................................................................................................. 18
1.3. Plant Capacity and Production Program ................................................................................... 19
1.4. Materials and Inputs .................................................................................................................. 19
1.5. Location and Site ...................................................................................................................... 20
1.6. Technology and Engineering .................................................................................................... 20
1.7. Organization and human Resource ........................................................................................... 21
1.9. Financial and Economic Analysis ............................................................................................. 21
1.10. Summary and Conclusions.................................................................................................... 22
1.10.1 Highlights of the proposed corn starch manufacturing plant ................................................. 22
1.10.3. Highlights of glucose manufacturing plant ........................................................................... 23
III. FEASIBILITY STUDY FOR THE ESTABLISHMENT OF GARMENT ACCESSORIES MANUFACTURING
PLANT .................................................................................................................................................... 24
1.1.1. Analysis of the Business Environment ................................................................................... 25
1.1.2. Market Study ........................................................................................................................... 26

iii
a) Product Description and Application ........................................................................................ 26
b) Supply Trend ............................................................................................................................ 27
d) Factors that Affect the Local Demand for Garment Accessories ............................................. 31
e) Demand Projection.................................................................................................................... 31
f) Unsatisfied Demand/Demand – Supply Gap ............................................................................. 31
g) Market Share Analysis .............................................................................................................. 32
h) Marketing Mix Assessment ...................................................................................................... 33
3) Distribution ............................................................................................................................... 35
4) Marketing Strategy & Promotion ............................................................................................. 35
1.2. Technical Study ..................................................................................................................... 36
1.3. Financial and Economic Analysis .......................................................................................... 40
IV. FEASIBILITY STUDY FOR THE ESTABLISHMENT OF GLASS PACKAGING
MANUFACTURING PLANT .............................................................................................................. 42
1.1 Analysis of the Business Environment ....................................................................................... 43
1.2 Market Study ............................................................................................................................... 44
1.2.1 Product Description and Application ................................................................................... 44
1.2.2 Past Supply - Demand Trend ............................................................................................... 45
1.3 Technical Study .......................................................................................................................... 51
1.3.1 Raw Materials and Inputs .................................................................................................... 51
1.3.2 Location, Site and Environment ........................................................................................... 52
1.3.3 Technology and Engineering ............................................................................................... 53
1.3.4 Organization Structure and Human Resource ...................................................................... 55
1.3.5 Project Implementation ........................................................................................................ 55
1.4 Financial Analysis and Economic Benefits ................................................................................ 56
V. FEASIBILITY STUDY FOR THE ESTABLISHMENT OF LABELS MANUFACTURING
PLANT .................................................................................................................................................. 58
1.1 Analysis of the Business Environment ....................................................................................... 59
1.2 Market Study ............................................................................................................................... 60
1.2.1 Product Description and Application ................................................................................... 60
1.2.2 Past Supply Trend ................................................................................................................ 60
1.2.3 Present Effective Local Demand .......................................................................................... 61
1.2.4 Trend in Factors that Affect the Local Demand for the Products under Consideration ....... 62
1.2.5 Demand Projection ............................................................................................................... 62
1.2.6 Market Share ........................................................................................................................ 62
1.2.7 Marketing Mix ..................................................................................................................... 63

iv
1.2.8 Product mix, Plant Capacity and Production Program ......................................................... 63
1.2.9 Product Mix and Production Program ................................................................................. 64
1.3 Technical Study .......................................................................................................................... 64
1.3.1 Raw Materials and Inputs .................................................................................................... 64
1.3.2 Location, Site and Environment ........................................................................................... 65
1.3.3 Technology and Engineering ............................................................................................... 67
1.3.4 Organization Structure and Human Resource ...................................................................... 67
1.3.5 Project Implementation ........................................................................................................ 68
1.4 Financial and Economic Analysis ........................................................................................... 69
VI. FEASIBILITY STUDY FOR THE ESTABLISHMENT OF LEATHER ACCESSORIES
MANUFACTURING PLANT .............................................................................................................. 71
1.1 Background ................................................................................................................................. 72
a) Introduction ............................................................................................................................... 72
b) Methodology of Market Study .................................................................................................. 72
1.2 Analysis of the Business Environment and Incentives for Investors .......................................... 73
1.3 Market Study ............................................................................................................................... 74
a) Product Description and Application ........................................................................................ 74
b) Past Supply Trend ..................................................................................................................... 74
2) Buckles and Trimmings ............................................................................................................ 75
3) Toe Puff and Counter Stiffeners ............................................................................................... 75
4) Insole Board .............................................................................................................................. 76
5) Shoe Mould ............................................................................................................................... 76
6) Shoe Last .................................................................................................................................. 76
1.4 Materials and Inputs for Integrated Leather Accessories Mfg Plant ........................................... 83
1.5 Location, Site and Environment.................................................................................................. 84
1.6 Technology and Engineering ...................................................................................................... 84
1.7 Organization and Manpower ....................................................................................................... 85
1.8 Implementation Schedule ............................................................................................................ 85
1.9 Financial Analysis and Economic Analysis ................................................................................ 86
VII. FEASIBILITY STUDY FOR THE ESTABLISHMENT OF METAL PACKAGING
MANUFACTURING PLANT .............................................................................................................. 88
1.1 Analysis of the Business Environment ....................................................................................... 89
1.2 Market Study ............................................................................................................................... 90
1.2.1 Product Description and Application ................................................................................... 90
1.2.2 Past Supply Trend ................................................................................................................ 91

v
1.2.3 Present Effective Local Demand .......................................................................................... 93
1.2.4 Trend in Factors that Affect the Local Demand for the Products under Consideration ....... 93
1.2.5 Demand Projection ............................................................................................................... 94
1.2.6 Market Share ........................................................................................................................ 94
1.2.7 Marketing Mix ..................................................................................................................... 95
1.2.8 Product Mix ......................................................................................................................... 96
1.2.9 Plant Capacity ...................................................................................................................... 97
1.2.10 Production Program ........................................................................................................... 97
1.3 Technical Study .......................................................................................................................... 98
1.3.1 Raw Materials and Inputs .................................................................................................... 98
1.3.2 Location, Site and Environment ........................................................................................... 99
1.3.3 Technology and Engineering ............................................................................................. 101
1.3.4 Organization Structure and Human Resource .................................................................... 104
1.3.5 Project Implementation ...................................................................................................... 105
1.4 Financial and Economic Analysis ............................................................................................. 105
VIII. FEASIBILITY STUDY FOR THE ESTABLISHMENT OF PAPER PACKAGING
MANUFACTURING PLANT ............................................................................................................ 107
1.1 Analysis of the Business Environment ..................................................................................... 108
1.2 Market Study ............................................................................................................................. 109
1.2.1 Product Description and Application ................................................................................. 109
1.2.2 Past Supply - Demand Trend ............................................................................................. 110
1.2.3 Trend in Factors that Affect the Local Demand for the Products under Consideration ..... 111
1.2.4 Demand Projection ............................................................................................................. 112
1.2.5 Market Share ...................................................................................................................... 112
1.2.6 Marketing Mix ................................................................................................................... 113
1.2.7 Product mix, Plant Capacity and Production Program ....................................................... 113
1.2.8 Production Program ........................................................................................................... 114
1.3 Technical Study ........................................................................................................................ 114
1.3.1 Raw Materials and Inputs .................................................................................................. 114
1.3.2 Location, Site and Environment ......................................................................................... 115
1.3.3 Technology and Engineering ............................................................................................. 118
1.3.4 Organization Structure and Human Resource .................................................................... 119
1.3.5 Project Implementation ...................................................................................................... 119
1.4 Financial and Economic Analysis ............................................................................................. 120

vi
IX. FEASIBILITY STUDY FOR THE ESTABLISHMENT OF PLASTIC AND FLEXABLE
PACKAGING MANUFACTURING PLANT ................................................................................... 122
1.1 Analysis of the Business Environment ..................................................................................... 123
1.2 Market Study ............................................................................................................................. 124
1.2.1 Product Description and Application (Technology) .......................................................... 124
1.2.2 Application ......................................................................................................................... 125
1.2.3 Past Supply Trend .............................................................................................................. 127
1.2.4 Present Effective Local Demand ........................................................................................ 129
1.2.5 Trend in Factors that Affect the Local Demand for the Products under Consideration ..... 129
1.2.6 Demand Projection ............................................................................................................. 129
1.2.7 Supply Demand Gap .......................................................................................................... 130
1.2.8 Market Share ...................................................................................................................... 130
1.2.9 Marketing Mix ................................................................................................................... 130
1.2.10 Product Mix ..................................................................................................................... 131
1.2.11 Plant Capacity .................................................................................................................. 131
1.2.12 Production Program ......................................................................................................... 132
1.3 Technical Study ........................................................................................................................ 132
1.3.1 Raw Materials and Inputs .................................................................................................. 132
1.3.2 Location, Site and Environment ......................................................................................... 133
1.3.3 Technology and Engineering ............................................................................................. 136
1.3.4 Organization Structure and Human Resource .................................................................... 138
1.3.5 Project Implementation ...................................................................................................... 138
1.4 Financial Analysis ..................................................................................................................... 139
X. FEASIBILITY STUDY FOR ESTABLISHMENT OF SESAME PROCESSING PLANT ......... 141
1.1 Introduction ............................................................................................................................... 142
1.1 Analysis of the Business Environment and Incentives for Investors ........................................ 142
1.2 Market Study ............................................................................................................................. 143
1.2.1 Product Description............................................................................................................ 143
1.2.2 Local Market ...................................................................................................................... 144
1.2.3 Export Market .................................................................................................................... 147
1.2.4 Marketing Mix ................................................................................................................... 149
1.3 Technical Study .................................................................................................................... 150
1
MINISTRY OF INDUSTRY (MOI)
I. FEASIBILITY STUDY FOR THE ESTABLISHMENT OF COFFEE
PROCESSING PLANT

2
I. EXECUTIVE SUMMARY
1.1 Introduction
The Ministry of Industry (MOI) has commissioned Industrial Project Service (IPS) to prepare
a Feasibility Study for the Establishment of Coffee Processing (value adding) Plant. As per
the agreement between the two parties a Draft Report on Feasibility Study for the
Establishment of Coffee Processing Plant was submitted by IPS earlier. This Final Report is,
hence, prepared by IPS incorporating the comments of MOI and other stakeholders on the
Draft Report.
1.2 Analysis of the Business Environment and Incentives for Investors
As per the analysis carried out by different institutions on the political, economic, socio-
cultural and technological developments (PEST), Ethiopia offers a stable political and
economic environment as well as security; exceptional climate; almost complete absence of
routine corruption; continuously improving public service delivery which makes it potentially
an ideal destination for investment. The macro economic performance in the past seven years
has been very positive and the broad-based economic growth is expected to continue under
GTP II. Although the incentive packages that are currently given seem to be adequate the
government is planning to give additional incentives for the manufacturing sector,
particularly to export oriented and agro processing projects. Priorities will be given to the
manufacturing sector in support provision in the areas of licensing, land and finance
allocation, training and the like.
The expansion of Universities as well as Technical, Vocational Education and Training
(TVET) in all parts of the country provides good opportunity in the supply of skilled and
semi-skilled technical personnel. Health service provision and development of infrastructures
such as roads, energy and communication are also showing a rapid improvement in the
country. The advancement of science and technology in the world and the spread of same in
the country will favorably influence the smooth operation of the envisaged project. Moreover,
the strategic location of the country, which is near to the Middle East and Europe, has an
advantage in international trade. As part of the support provided by the government to the
agricultural sector, accesses to productive inputs, such as hybrid seed and fertilizer has been
expanded. The government has also established the Ethiopian Commodity Exchange (ECX),
which is a marketing institution established for creating and running the Ethiopian
commodity market in a transparent, fair and sustainable manner that would benefit all the
3
actors in the value chain and the country at large. Accordingly, it can be concluded that
Ethiopia is ideal for investment.
1.1 Market Study
1.2.1 Product Description and Application
In this study the value added coffee products considered include:-
ular and decaffeinated),
The description of each product is given hereunder.
Green Decaffeinated Coffee
The caffeine is extracted and removed while the coffee is in green raw form by using water
and/or chemicals to reduce the caffeine content to as low as 0.1% to 0.2%.
Roasted Coffee
Green Coffee is roasted at by action of heat (roasting) to develop characteristic flavor and
aroma and packed and supplied to market.
Roasted Ground Coffee
The Roasted Ground Coffee product is prepared by grinding and packing roasted coffee for
house hold consumption as well as for commercial centres like hotels and restaurants.
Liquid Coffee Extract
The Liquid Coffee Concentrate extracted from regular or decaffeinated coffee for house hold
consumption or industrial consumption purpose.
Instant Coffee
Instant Coffee is produced in two forms (spray dried agglomerated and freeze dried) based on
the type of production processes employed. The instant coffee product dissolves instantly in
hot water during consumption.
1.2.2 Local Market
a) Overview of the Performance of the Local Coffee Sub Sector
Ethiopia is endowed with a good production environment for growing coffee with a
combination of appropriate altitude, temperature, rainfall, soil type and pH. Ethiopia is the
center of origin for Coffee Arabica. The country possesses a diverse genetic base for Arabica
coffee with considerable heterogeneity. Ethiopia produces a range of distinctive Arabica

4
coffees and has considerable potential to produce number of specialty coffees. There are four
types of production systems in Ethiopia, forest coffee, semi- forest coffee, garden coffee and
plantation coffee. During the period 2004—2013, the land area cropped by coffee shows a
significant growth; increasing from 232,439 hectare to 528,751 hectares, registering an
average annual growth rate of 10.17%. Local production of coffee also exhibits a substantial
growth increasing from 225,362 tons in year 2001 to 373,941 in the year 2012, registering an
average annual growth rate of 5.44%. During the period 2000-2013, the maximum export of
coffee from Ethiopia was 211,981 tons in 2010, while the minimum was 89,220 tons in 2001;
however during the period under consideration, on average, the country was exporting about
155,785 tons of coffee per annum. During the period under consideration (2000-2013), export
of coffee has registered an average annual growth rate of 6.25%.
In terms of value, export of coffee has increased from Birr 2.09 billion in 2000 to Birr 11.39
billion in 2013, registering an average annual growth rate of 20.39%.
Although coffee is still the dominant foreign exchange earner to the Ethiopian economy,
considering the unique natural endowment and the special varieties of coffee produced in the
country, which are highly valued by importing countries, it can be concluded that the country
is not benefiting from its coffee resource potential. For example, during the period 2009-
2013, the average unit value of coffee exported by Switzerland is higher by nearly 10 fold as
compared to the average unit value of coffee exported from Ethiopia. In fact, West European
countries are not producers of coffee but they have specialized in import of the green coffee
from developing countries where the resource is available and then processing the product
(value adding) and re-exporting. Accordingly, in order to fully exploit the country‘s coffee
resource potential, developing local value addition capability is indispensable.
b) Past Supply Trend
The local demand for roasted and milled coffee is supplied through local production and
import. On the other hand the local market for decaffeinated coffee; extracts and concentrates
of coffee and soluble or instant coffee is largely met through import. The finding on the trend
in the past supply of the products under consideration is summarized below.

5
1) Decaffeinated Green Coffee
Ethiopia produces a small amount of decaffeinated green coffee; which is exclusively
targeted at export market. On the other hand, the country imports insignificant amount of the
product. During the period 2002—2007, the average annual import was about 1.47 tons
valued at Birr 29,997. However, during the recent six years (2008--2013), import of
decaffeinated green coffee has increased to7.15 tons in average per annum; valued at Birr
794,335.
2) Roasted and Milled Coffee
Roasted and Milled Coffee not Decaffeinated: The apparent consumption or total supply of
not decaffeinated, roasted and milled coffee consists of local production plus import minus
export. Local production of not decaffeinated, roasted and milled coffee, excluding year
2006, which is exceptionally high, exhibits two distinct trends. During 2000--2008 local
production, except for years 2003 and 2004, has shown a year to year growth increasing from
only 28 tons in 2000 to 2,767 tons in 2008. Beginning from 2009, local production exhibits a
declining trend. However, the volume of local production in the recent seven years (2007--
2013) is much higher than the volume of production during the initial years (2000-2005).
During the period 2000--2005, the average annual local production was 237 tons, which has
increased to an average annual of 1,746 tons during the period 2007--2013. Hence, between
the two periods local production has increased by more than seven folds. Import of not
decaffeinated, roasted and milled coffee fluctuates from year to year without any noticeable
trend. Import ranges from 1.78 tons in 2000 to 94.45 tons in 2007. Nevertheless, when
average import of the product during the initial seven years (2000--2006) is compared with
the average import of the subsequently seven years a growth in import can be noticed. The
average annual import during the initial period was 5.43 tons, which has increased to an
annual average of 40.13 tons during the period 2007--2013. Since the great majority of the
local demand for not decaffeinated, roasted and milled coffee is met through local production
(accounting on average for 98.93% of the total supply during the period 2000--2013, total
supply or apparent consumption of the product exhibits similar trend to local production, i.e.
an increasing and decreasing trend during the periods 2000--2008 and 2009--2013,
respectively, in terms of year to year growth but yet a much higher volume of supply during
the recent period as compared to the initial period.
Decaffeinated, Roasted and Milled Coffee: The country imports a small quantity of
decaffeinated, roasted and milled coffee. During the period 2000—2013, the maximum
import was 28.29 tons in 2010 valued at Birr 1.83 million, while the minimum was 0.01 tons

6
in 2004 valued at Birr 802. During the period 2000--2013 on average, the country has
imported 4.03 tons of decaffeinated, roasted and milled coffee valued at Birr 242,555.
However, if only the recent four years (2010--2013) are considered the average annual import
increased to 10.06 tons.
3) Instant Coffee
During the period 2000--2013 on average, the country has imported 6.17 tons of instant
coffee valued at Birr 324,573 annually. Import of the product fluctuates from year to year,
however, a general growth can be observed. For example, if only the recent five years (2009--
2013) are considered, the average annual import will increases to 10.68 tons and Birr 744,918
in terms of volume and value, respectively.
4) Coffee Extracts and Concentrates
The local demand for coffee extracts and concentrates is met through import. During the
period 2000--2013 on average, the country has imported 7.28 tons of coffee extracts and
concentrates valued at Birr 213,921. However, if only the recent four years (2010--2013) are
considered, the average annual import increased to 12.31 tons valued at Birr 391,992.
c) Present Effective Local Demand
In order to estimate the current effective local demand for value added coffee products in
Ethiopia, the following methods were applied:
- parameter double exponential smoothing; and
Based on the results of test statistics for decaffeinated green coffee, roasted and milled coffee
(not decaffeinated) and instant coffee, the forecast based on Holt‘s two parameter method and
for roasted and milled coffee (decaffeinated) and coffee extracts and concentrates the
forecasts based on time trend extrapolation are found to be the most appropriate.
Accordingly, the estimated present effective domestic demand for each product is given
below.
o Not decaffeinated……………..2,977.00 ton ,

7
o Decaffeinated………………….…10.73 ton,
d) Trend in Factors that Affect the Local Demand for the Products under Consideration
The variables that are essential in determining the magnitude and trend of demand for the
product under consideration are:
population; and
d development level of the hotel industry.
Accordingly, a thorough assessment of the current status and future prospect of these factors
indicates that there is a progressively growing local demand for value added coffee products.
e) Demand Projection
Urbanization and income are found to be the major determinants of the future demand for
value added coffee products. Hence, a growth rate of 5%, which is slightly higher than the
urban population growth rate and much lower than income growth rate, is taken to forecast
the future demand. Accordingly, the local demand for decaffeinated green coffee is projected
to increase from 10.24 tons in 2015 to 13.07 tons and 16.69 tons by the years 2020 and 2025,
respectively. Moreover, by year 2030 the demand is projected to reach at 21.30 tons. The
local demand for non decaffeinated roasted and milled coffee is projected to increase from
3,126 tons in 2015 to 3,990 tons, 5,092 tons and 6,499 tons by the years 2020, 2025 and 2030
respectively. Likewise, the demand for decaffeinated roasted and milled coffee is projected to
increase from 11.27 tons in 2015 to 14.38 tons, 18.36 tons and 23.43 tons by the years 2020,
2025 and 2030, respectively. The local demand for instant coffee is projected to increase
from 13.17 tons in 2015 to 16.81 tons and 21.46 tons by the years 2020 and 2025
respectively. Moreover, by year 2030 the demand is projected to reach 27.39 tons. Similarly,
the local demand for coffee extracts and consecrates is projected to increase from 12.12 tons
in 2015 to 15.46 tons, 19.73 tons and 25.19 tons by the years 2020, 2025 and 2030,
respectively.

8
1.2.3 Export Market
a) Trend in Global Import and Export
1) Green Coffee
During the period 2008-2012, global production of coffee has increased from 7.71 million
tons to 9 million tons. The major coffee producers in the world are Brazil on average
accounting for 37% of the total world production followed by Vietnam (15%), Indonesia
(7%) and Columbia (6%). Ethiopia is ranked fifth with an average share of 4%. Global total
export of coffee (in all forms), during the period 2004--2013, has increased from 5.7 million
tons valued at 9.17 billion USD to 8.18 million tons valued at 28.61 billion USD, registering
an average annual growth rate of about 4.15% and 15.27% in terms of volume and value,
respectively. During the period 2004--2013, Brazil followed by Vietnam, Colombia and
Germany were the leading exporters of coffee.
2) Decaffeinated Green Coffee
Global export of decaffeinated green coffee has increased from 168,058 tons in 2004 valued
at USD 347.93 million to 240,447 tons in 2013 valued at Birr 914.16 million, registering an
average annual growth rate of 4.37% and 13.82% in terms of volume and value, respectively.
Germany followed by Mexico, Spain, Canada and France are the leading decaffeinated green
coffee exporters. USA is the leading importer of decaffeinated green coffee. During the
period 2004—2013, USA on average, accounts for 58.91% of the total global import of
decaffeinated green coffee. The other major importers of the product include: Spain, Italy and
Belgium.
3) Roasted and Milled Coffee
During the period 2004—2013, global export of roasted and milled coffee (both non-
decaffeinated and decaffeinated) exhibits a consistent year to year growth, increasing from
473,861 tons valued at USD 2 billion to 909,072 tons valued at USD 9.26 billion, registering
an average annual growth rate of 7.60% and 19.25% in terms of volume and value,
respectively. From the total global export of roasted and milled coffee, on average, the great
majority, i.e. 95.06% and 93.37% in terms of volume and value, respectively is accounted by
non-decaffeinated roasted and milled coffee. Germany, Italy and USA are the leading
exporters of non- decaffeinated roasted and milled coffee while Germany, Italy and Canada
are the leading exporters of decaffeinated roasted and milled coffee. France followed by
Canada, Germany, USA, Netherlands and Austria are the leading importers of non
decaffeinated roasted and milled coffee. Regarding decaffeinated roasted and milled coffee
9
the leading importers were USA, Canada and France. The other important importers include
Spain, Belgium and Netherlands.
4) Instant Coffee
During the period 2004--2013 global export of instant coffee, though slightly fluctuate in
some years, exhibits a general growth, increasing from 372,031 tons to 740,104 tons in terms
of volume and from USD 2.09 billion to USD 5.22 billion in terms of value, registering an
average annual growth rate of 8.43% and 11.35% in terms of volume and value, respectively.
Brazil, Germany and India are the leading exporters of instant coffee. During the same period
Tunisia, Spain, Indonesia Singapore, UK and Malaysia were also major exporters of instant
coffee. During the period 2004--2013, on average from the total global import of instant
coffee the highest share is accounted by Russia, USA, Germany and UK. The other important
importers of instant coffee include Libya, Philippines, Ukraine, Poland and Japan.
5) Coffee Concentrate and Extract
During the period 2004--2013, global export of coffee concentrates and extracts has increased
from 147,461 tons valued at USD 428.77 million to 325,044 tons valued at USD 1.52 billion,
registering an average annual growth rate of 9.90% and 16.09% in terms of volume and value
respectively. During the same period Thailand was the leading coffee concentrates and
extracts exporter followed by Malaysia, USA, China, South Korea and Hungary. b) Present
and Projected Global Demand The present (2014) global demand for decaffeinated green
coffee is estimated at 250,955 tons, which is projected to reach at 324,376 tons and 401,724
tons in years 2020 and 2025, respectively. Moreover, by year 2030 the global demand is
projected to reach at 497,515 tons. The present global demand for non decaffeinated roasted
and milled coffee is estimated at 939,462 tons. The global demand for non decaffeinated
roasted and milled coffee is projected to increase from 1.47 million tons in 2020 to 2.15
million tons and 3.13 million tons by the years 2025 and 2030, respectively. Likewise, the
global demand for decaffeinated roasted and milled coffee is projected to increase from the
present 39,247 tons to 48,947 tons, 58,840 tons and 70,731 tons by the years 2020, 2025 and
2030, respectively. The present (2014) global demand for instant coffee is estimated at
802,495 tons, which is projected to reach 1.3 million tons and 1.95 million tons in years 2020
and 2025 respectively. Moreover, by year 2030 the global demand is projected to reach 2.92
million tons. Similarly, the global demand for coffee extracts and consecrates is projected to

10
increase from the present 357,223 tons to 629,399 tons, one million tons and 1.61 million
tons by the years 2020, 2025 and 2030, respectively.
c) Estimated Market Share for Locally Produced Value Added Coffee Products The
present (2014) export demand for locally produced decaffeinated green coffee is estimated at
2,150 tons, which is projected to reach 3,244 tons and 4,017 tons in years 2020 and 2025
respectively. Moreover, by year 2030 the global demand for Ethiopian decaffeinated green
coffee is projected to reach 4,975 tons. The present export demand for locally produced non
decaffeinated roasted and milled coffee is estimated at 9,395 tons. The export demand for
locally produced non decaffeinated roasted and milled coffee is projected to increase from
14,768 tons in 2020 to 21,529 tons and 31,384 tons by the years 2025 and 2030 respectively.
Likewise, the export demand for locally produced decaffeinated roasted and milled coffee is
projected to increase from the present 392 tons in the to 489 tons, 588 tons and 707 tons by
the years 2020, 2025 and 2030, respectively. The present (2014) export demand for locally
produced instant coffee is estimated at 8,025 tons, which is projected to reach 13,042 tons
and 19,547 tons in years 2020 and 2025 respectively. Moreover, by year 2030 the export
demand for instant coffee produced locally is projected to reach 29,298 tons. Similarly,
export demand for locally produced coffee extracts and consecrates is projected to increase
from the present 3,572 tons to 6,294 tons, 10,091 tons and 16,177 tons by the years 2020,
2025 and 2030, respectively.
d) Total Projected Demand (Local Plus Export)
The total demand for locally produced decaffeinated green coffee is projected to increase
from 2,629 tons in 2015 to 3,257 tons and 4,034 tons by the years 2020 and 2025
respectively. Moreover, by year 2030 the total demand is projected to reach 4,996 tons. The
total demand for locally produced non decaffeinated roasted and milled coffee is projected to
increase from 13,256 tons in 2015 to 18,758 tons, 26,621 tons and 37,883 tons by the years
2020, 2025 and 2030, respectively. Likewise, the total demand for decaffeinated roasted and
milled coffee is projected to increase from 418 tons in 2015 to 503 tons, 606 tons and 730
tons by the years 2020, 2025 and 2030, respectively. The total demand for locally produced
instant coffee is projected to increase from 8,714 tons in 2015 to 13,059 tons and 19,568 tons
by the years 2020 and 2025, respectively. Moreover, by year 2030 the demand is projected to
reach 29,325 tons. Similarly, the total demand for locally produced coffee extracts and
consecrates is projected to increase from 3,938 tons in 2015 to 6,309 tons, 10,111 tons and
16,202 tons by the years 2020, 2025 and 2030, respectively.

11
e) Marketing Mix
Product quality is one of the basic and most important marketing mixes that affect the success
of a product. The quality of value added coffee products is mainly dependent on the quality
of the raw material used. Accordingly, in order to insure the quality of the incoming raw
material the envisaged project needs to set up an effective raw material quality control
mechanism. Achieving this form of quality control requires the establishment of a test
laboratory. Moreover, the quality of value added coffee products should be assessed at
various points throughout the manufacturing process.
EU markets and the USA market demand a severe quality control. Implementation of
HACCP and tracking & tracing is necessary for access to these markets. The EU has also set
legal requirements for coffee extracts. The legislation mainly relates to the composition and
characteristics of coffee extracts. Coffee extracts that do not comply will be rejected from the
EU market. Moreover, in the global market for value added coffee taste is important but there
is also growing interest in the conditions in which products were made. Hence, product
quality has increasingly begun to include criteria related to environmental and socio-
economic sustainability. This request can be clearly identified by looking at market trends in
Western countries. There are several organizations that are promoting fair trade. Accordingly,
getting certified by such institution is also important. Roasted and ground coffee may be
packaged in several different formats to achieve the technical objectives of protecting against
oxidation, moisture gain, and aroma loss. Although vacuum steel cans have been traditional
used, flexible laminated packing materials have gained some favor due to better economics.
The disadvantages of flexible laminated packing materials i.e. absence of re-closure, may be
overcome by combining a re-closable injection-molded polypropylene lid to offer a re-
closable canister. Instant coffee has long been packaged in metal cans. However, recently,
PET in conjunction with aluminum foil and metalizing has taken a substantial portion of the
instant coffee-packaging market. Other types of packaging material recently developed
include three-ply foil-based bags. The multi-laminate of the packaging material is made up of
polyester and foil while the seal is made from polyethylene. Based on the assessment of the
trend in the global price of the products under consideration, the recommended factory gate
price is shown below.

12
o Not decaffeinated………………….Birr 168,461/ton.
o Decaffeinated………………………Birr 192,176/ton.
Due to the very high upfront branding investment required for advertisement and promotion,
for a new entrant from developing country like Ethiopia, attempting to penetrate the market
for value added coffee products in developed countries own brand will not be realistic.
Accordingly, the alternative for manufacturers from developing counties is supplying product
for:
However, if the envisaged project decides to develop own brand, agents or distributors are
required in each major consumption market. The envisaged project should consider
exhibiting at relevant international coffee expos in order to establish contacts with buyers or
to investigate the possibility of securing a business arrangement with a suitable importing and
distribution company or broke. The envisaged project is also recommended to develop a
website. Since, a well designed website can help the envisaged projects‘ export venture in
many ways, from promotion to customer service. The envisaged project should also advertise
in international magazines specialized in coffee such as Tea and Coffee Trade Journal, Fresh
Cup, Coffee Universe, Coffee Bean and Coffee Explorer.
1.2.4 Plant Capacity and Production Program
Based on analysis of market demand project for different coffee value added products,
availability and supply of material and inputs and technology the proposed annual production
of the plant is:
– 2,000 tons/year;
Coffee (out of which 10% decaffeinated) – 5,400 tons/year ;
– 1,800 tons/year;
– 1,875 tons/year;

13
ut of which 10% decaffeinated) – 1,875 tons/year; and
- 1,300 tons/year.
The Proposed production program the plant is to start production at 70% of the production
program during the first year of production, increase it to 85% during the second year and
finally reach 100% at the third year of operation of the plant.
1.2 Technical Study
1.2.5 Materials and Inputs
The main raw material for coffee processing plant is pre-cleaned green coffee. The major
producing regions are Oromia and SNNP Region of the country. The plant receives pre-
cleaned green coffee from cooperatives of primary producers. The pre-cleaned coffee is
processed in to value added products to be exported and consumed locally. The annual plant
green coffee consumption is 28,439.57 tons of un-cleaned coffee. The unite price of un-
cleaned coffee is Birr 103,125.00 (One hundred three thousand one hundred twenty five Birr)
and the total annual raw material cost of the coffee processing plant is Birr 2,932,830,446.60
(Two billion nine hundred thirty two thousand four hundred forty six Birr and sixty cents).
The auxiliary materials required by the plant are chemicals used for coffee decaffeination
process and packaging materials. The other inputs of the plant are electricity, water and
lubricant oils. The annual packaging material is Birr 16,139,000. The utilities used by the
envisaged plant is electricity, cost of utility is Birr 71,097,478.00 (Seventy one thousand
ninety seventy thousand four hundred seventy eighty), out of which USD 29,661.58 (Twenty
nine thousand six hundred sixty one USD and fifty eight cents).
1.2.6 Location, Site and Environment
Location of the envisaged Integrated Coffee Processing Plant is selected based on a two stage
location and site selection procedures. The first stage involved identifying potential project
locations, and prioritizing and selection of appropriate one based on critical project selection
criteria. The project location determining factors considered in the study are supply of raw
materials and inputs, access to market, availability of skilled and unskilled labor,
infrastructure such as road, electricity and telephone line, availabilities of social amenities –
hospitals, schools, training centres and residence housing , etc. The second stage of project
location and site selection procedure involved – identifying alternative project locations
within the selected project location and selection of the optimum project site from the
proposed sites. Accordingly, the country is divided in to three regions based on source and

14
supply of green coffee and Addis Ababa town and the surrounding towns is included as
fourth region due to its location - a market centre for all three regions. These four regions are
considered as potential project. Then different weights are assigned to the project selection to
compare the proposed locations. Accordingly, from the four proposed potential location
candidates Addis Ababa and its surrounding towns was selected as an optimal project site.
Then, alternative project sites were identified from Addis Ababa town and the surrounding
Oromia towns. The proposed candidate project sites were Bole Lemi and Qilinto Industrial
Zones from Addis Ababa region, Gelan, Dukkam, Burayyu, Sululta, and Lega Tafo from the
Oromia town surrounding Addis Ababa. Finally, Galan town was selected as the appropriate
project site for establishment of the integrated coffee processing plant project.
1.2.7 Technology and Engineering
The major process of value added coffee processing plants are: coffee cleaning, roasting,
grinding, coffee extract and instant coffee processing. Accordingly, the major technology and
machinery required for the envisaged plant is coffee pre-cleaning and storage, coffee roasting
and grinding, coffee extraction and instant coffee plant and utility equipment. The total cost
of process plant machinery and equipment including utility equipment, mechanical and
electrical workshops, vehicles, and lab equipment is Birr 674,744,259.65, 9,450,000.00,
13,500,000.00 & 269,897.70, respectively.
The total cost of building and civil work and office furniture and equipment is Birr
90,768,925.00 and Birr 2,109,830, respectively.
1.2.8 Organization and Manpower
The organizational structure of the envisaged plant is constructed considering the extent of
the industry. The plant structure follows the functional organizational structure approach to
achieve operational efficiencies within a group. The plant has four functional departments
and two services. The functional departments are namely: production and technique
departments, commercial department, finance department and human resource and
administration departments. The two services are Planning and IT services and Internal Audit
service. The project will have 122 employees with annual cost of salary at full capacity
operation is estimated to be Birr 17,135,348.00, including training expenses of Birr
1,173,654.00.
1.2.9 Implementation Schedule
The implementation schedule covers the activities starting from the project evaluation and
approval up to and including the trial-run and commissioning. The complete implementation

15
program for the envisaged sesame processing plant is planned to take a total of 24 months.
The project operation starts with the assignment of the project manager and establishment of
the project office. It ends when detailed engineering design is completed by the
supplier/suppliers. During this phase, HRD department manager is hired to get adapted to the
processes of the project. Other department heads are also hired during this phase to facilitate
preparatory works for later smooth operation of the envisaged project. They shall be the core
members of the project implementation team who shall recruit and select other employees
and also work as counter parts with all consultants. Then the tender document will be floated
for the civil works to be conducted by local contractors. Orders will be placed for machinery
and equipment procurement by giving priority to those items that have to be manufactured
based on the detailed design. The total cost of project implementation is Birr 71,151,363.92
out of which Birr 68,872,763.92 is for engineering design, erection supervision, and
machinery and equipment erection, Birr 6,330,000.00 is for salary of the project implantation
team, and the rest is for office equipment and furniture and running the project office.
1.3 Financial and Economic Analysis
The financial analysis of the project (benefits and costs) is computed over seventeen years
assuming 24 months implementation period and 15 years of operation. In addition
depreciation and amortization, customs duty and income tax, repair and maintenance costs,
terminal (salvage) values well as working capital have been worked out based on the existing
laws of the country and standard assumptions. Accordingly, the major findings of the
financial analyses are given below. The total investment cost of the project is estimated at
Birr 1.35 billion. From the total investment cost the highest share Birr 790.84 million
(58.53%) is accounted by fixed investment cost followed by initial working capital Birr
417.87 million (30.93%) and pre operation cost Birr 142.42 million (10.54%). The total
annual cost of production and revenue at 100% capacity utilization (year 4) is estimated at
Birr 2.274 billion and Birr 2.575 billion respectively. The project will generate a profit
throughout its operation life. Annual net profit after tax will increase from Birr 187 million
during first year of operation to Birr 301.10 million during the last year of the project life.
The projected cash flow of the envisaged project shows that the project would generate
positive net cash flows throughout the operation years. Based on a 10% discount rate the
Internal Rate of Return (IRR) and Net Present Value (NPV) are computed to be 24.06% and
Birr 1.150 billion respectively, indicating the viability of the project. The initial investment
cost of the project will be fully recovered within six years, which is a reasonably short period

16
of time. Other measures of profitability net profit as a % of sales revenue, net profit to equity
and net profit to total investment are also attractive.
The efficiency ratios like current assets to current liabilities and net cash flow to sales
calculated from the balance sheet show that the project is highly liquid with sound financial
performance. The breakeven point for sales and capacity utilization is computed at Birr
914.06 million and 41% which are reasonable. Moreover, the sensitivity analysis carried out
indicates that the project could be viable at adverse conditions i.e. either a decrease of 11% in
sales price or increase of 14% in production cost or an increase of above 50% in investment
cost. In addition to its financial viability the project has a number of economic and social
benefits. The establishment of the project has a foreign currency earning effect to the country
by exporting its products to the international market. Moreover, as a profitable venture it will
contribute to the increase of Regional and Federal government revenue through corporate,
payroll and other taxes.
The project will create direct employment opportunities for about 134 persons. Furthermore,
it creates a conducive environment for the rapid growth of service and trade sectors around
the project site which in turn create employment opportunity for a substantial number of
persons. Moreover, the project will also create backward linkages with the agricultural sector.

17
MINISTRY OF INDUSTRY (MoI)
II. FEASIBILITY STUDY FOR THE ESTABLISHMENT OF CORN PROCESSING
PLANT

18
II. EXECUTIVE SUMMARY
1. Introduction
The key success and risk factors for a manufacturer in the corn starch and allied products
industry are raw material costs, plant location, manufacturing efficiency, secure supply of
corn, quality standards, access to suitable human resources, infrastructure facilities, adequate
distribution, macroeconomic environment, currency fluctuations, government regulations and
policies, etc.
1.1. Background
This final report on techno- economic feasibility study for the establishment of corn
processing plant is prepared as per the consultancy agreement concluded between Ministry of
Industry, FDRE and the Addis Ababa Institute of Technology, Addis Ababa University
incorporating the comments of the client on the draft report.
1.2.Market study
Driven by a continuously increasing demand in the food and non-food sector, the global
starch production reached 77.4 million Tons in 2013. This represents a compound annual
growth rate (CAGR) of 3.4% during 2006-2013. The United States accounts for the largest
share (52.1%) of the global starch production. The United States is followed by Europe,
which accounted for 15.0% of the global starch production. Starch has a broad range of
applications both in the food and non-food sectors, whether in its natural form or in the form
of modified starch. Sweeteners with a share of 36% currently represent the biggest end-use
segment for starch.
Starch can be extracted from a wide variety of agricultural products. These include cassava,
corn, potatoes and in a lesser amount from rice, barley, sorghum, sago, etc. Corn currently
represents the most popular feedstock for starch production accounting for 80% of the total
output in 2013.
During 2006-2013, the global market for corn starch grew at a CAGR 3.7% reaching volumes
worth 62 Million Tons. The US represents the world’s largest producer of corn starch
accounting for 60% of the global production in 2013, followed by China (25%) and Europe
19
(8%). In 2013, Cargill represented the world’s biggest corn starch manufacturer accounting
for 10% of the total global production. Cargill was followed by Ingredion (8%), ADM (6%),
Tate & Lyle (5%) and Roquette (4%). In Ethiopia, industrial starch is primarily produced
from cassava with quantity not more than a ton a day. As there are not more than three
industries producing starch and related products, most of the starch and related products from
corn are supplied from abroad. It is forecasted the demand for starch and allied products is
increasing.
1.3. Plant Capacity and Production Program
The capacity of corn processing plant complex is determined by considering different
technical and financial factors such as market demand, raw material availability and supply
reliability, technology and availability of machinery and equipment in the world market with
the proposed capacity (economies of scale), investment and skilled labor requirement. The
complex consisted of the main starch and related products (animal feed and gluten) facility
integrated with subsidiary plants for corn oil, glucose and modification starches. Based on the
analysis of the above factors affecting capacity determination, the proposed annual capacity
of the corn processing plant is
30,000 tons of main product (starch), 45% of which is a raw material for the glucose plant;
with remaining divided between production of dextrin and modified starches (35%), glues
(10%) and the remaining sold as native starches. The plant is expected to operate at 60% of
its rated full capacity at the beginning and will grow by 5% each year considering the market
penetration traits and consumer perception for local products.
1.4. Materials and Inputs
The whole facility has four distinct plants namely corn starch manufacturing, corn oil
extraction and refining, starch and dextrin modification, and glucose production. The
materials and inputs required by these four sections of the integrated plant comprise basic raw
materials, auxiliary raw materials and utilities. The basic raw material is corn grain which can
be made readily available from the market through cooperatives or farmers. Other sources of
starch include wheat, cassava, potato, rice and so on. The basic raw materials for the
production of glucose of different DE include food grade starch and enzymes. The basic
materials for corn oil extraction and refining are dry germ from the main line and hexane.
The auxiliary raw materials required by the corn starch plant include sulphur and lime. The
auxiliary raw materials required by the glucose plant are HCl, soda ash and activated carbon.

20
The utilities required by the envisaged corn processing are water, electricity, compressed air,
and steam (fuel oil). The total annual cost of materials and inputs for the envisaged integrated
plant at full capacity operation is estimated at about Birr 525,299,690, out of which the Birr
78,794,954 is required in foreign currency.
1.5. Location and Site
As the raw material is a key factor in the success of this business, major corn growing zones
covering West Gojjam, Jimma, East Wollega, Wes Shoa, Illubabor and East Shoa has been
selected as possible potential locations of the envisaged project by assessing the availability
of critical project requirements such as raw material availability, utilities (mainly water and
electricity), transport infrastructure, labour, social infrastructure(health center, schools,
financial institutions, postal and telecommunication service) and proximity to market centre
qualitatively.
It has been found West Gojjam can be a better option. Further considering key technical and
financial factors in the selected location, sites of major towns in West Gojjam such as
Bahirdar, Bure, Adet, Dembecha and Fenoteselam has been evaluted. Therefore based on the
qualitative and quantitative stage of location and site selection processes, the consultant
proposes Burie which also hosts a proposed industrial park as the site for the envisaged Corn
Processing Plant.
The site for installing the envisaged plant is in the agro industrial park prepared with access
to all infrastructures required by similar industries, which is about 420 km from Addis Ababa.
The site is inside the major producer of corn at the national level that will supply the main
raw material sustainably without endangering the local food security with access to the basic
infrastructure such as electricity, health center, schools for the plant under study. It is also
relatively close to supply markets from Wollega, Shoa and South Gondar.
1.6.Technology and Engineering
The technology selection for the main product starch compared two front-end fractionation
technologies: dry and wet processes. In general, wet fractionation tends to be relatively costly
, however, produces higher-valued co products and has less starch loss than dry fractionation.
Cleaning, steeping, fiber separation, gluten separation, germ separation and the final starch
washing and drying are the major processes of the selected technology. Similarly,
modification of the manufactured starch can be done in two process alternatives, namely,
enzymatic and acid modification. The plant considers the dry acid process as a primary route

21
for certain applications while the other approach is mainly product and enzyme specific. In a
two step process, the dry starch is acid treated and heated to produce dextrins which have
different physical properties than raw starch.
Glucose plant processes are based on a common, yet modern, approach of enzymatic
hydrolysis and evaporation to get dried product.
Corn oil extraction technologies are mainly catagorized as mechanical expression, solvent
extraction and supercritical fluid extraction of which the second is adopted for in this specific
plant after a thorough cost benefit analysis. The total cost of machinery and equipment for the
envisaged corn processing plant is estimated at Birr 403,206,218, out of which about Birr
262,084,042 is required in foreign currency. The total cost of vehicle required for
transportation of raw material and finished product, workers service, and performing the day
to day operation of the envisaged plant is estimated at Birr 62,125,000. The total cost of
office furniture and equipment required by the envisaged project is estimated at Birr
2,712,911. The total estimated cost of buildings and civil for the project is estimated at Birr
61,890,000 all of which is required in local currency.
1.7. Organization and human Resource
The selection of structure of the envisaged project is made based on the existing structure of
manufacturing plants operating in the country, the capacity, complexity and technology mix
of the plant and assuming that the company shall be managed by the Ethiopian government
for some period till it is privatized. Organizational structure principles such as specialization,
coordination, and departmentalization are also considered for design of structure that best
suits the envisaged project.
1.8. Implementation Schedule
The implementation schedule covers the activities starting from the project evaluation and
approval up to and including the trial-run and commissioning. It is envisaged that the
complete implementation program requires a total of 36 months from the date of approval of
the project and financial arrangement.
The total cost of project follow up and office running cost for the whole project
implementation period is estimated at Birr 10,738,410.
1.9. Financial and Economic Analysis
According to the projected income statement, the project will start generating profit in the
first year of operation. Important ratios such as profit to total sales, net profit to equity

22
(Return on equity) and net profit plus interest on total investment (return on total investment)
show an increasing trend during the life-time of the project. The income statement and the
other indicators of profitability show that the project is viable. The project can create
employment for 636 persons. In addition to supply of the domestic needs, the project will
generate Birr more than 23 million in the first year of operation in terms of tax revenue. The
establishment of such factory will have a foreign exchange saving effect to the country by
substituting the current imports and future potential of export of the products.
1.10. Summary and Conclusions
1.10.1 Highlights of the proposed corn starch manufacturing plant
The total land required for the proposed plant having a capacity to manufacture 100 Tons of
corn starch per day is around 1.5 hectar.
The total capital costs for such a plant will be around ETB 338,202,120.
The plant is expected to provide an employment to 63 people with an annual labour cost of
ETB 6,153,943.
To produce 100 Tons of corn starch, the plant would require 154 Tons of corn grains.
Apart from corn starch, the plant also produces co-products - corn gluten (15.4 Tons), corn
oil (6.2 Tons) and corn fiber (3.8 Tons).
From an income of around ETB 392 Million in the first year of operation, we expect the total
income of the plant to reach 604 Million by the six year of operation.
Corn grains will account for 36% of the total production costs.
Average after tax profits during the first five years for the plant are expected to be around
20%. The plant is financially viable with an internal rate of return (IRR) of 15 % and a net
present value (NPV) of Birr 712 million discounted at 5%.
1.10.2. Highlights of the corn oil extraction and refining plant
The total land required for the proposed plant having a capacity to manufacture 6 Tons of
corn oil per day is around 1 hectar.
The total capital costs for such a plant will be around ETB 38,004,098.
The plant is expected to provide an employment to 45 people with an annual labour cost of
ETB 5, 129,657.
To produce corn oil (6.2 Tons), the plant would require Tons of corn germ.
From an income of around ETB 392 Million in the first year of operation, we expect the total
income of the plant to reach 604 Million by the six year of operation.

23
Corn grains will account for 36% of the total production costs.
Average after tax profits during the first five years for the plant are expected to be around
20%.
1.10.3. Highlights of glucose manufacturing plant
The total investment is estimated at 189,750,000 Birr.
The total land required for the proposed plant having a capacity to manufacture 6 Tons of
corn oil per day is around 0.75 hectar.
The plant is expected to provide an employment to 68 people with an annual labour cost of
ETB 6, 456,657.
To produce corn oil (6.2 Tons), the plant would require 13 tons of corn germ.
From an income of around ETB 392 Million in the first year of operation, we expect the total
income of the plant to reach 604 Million by the six year of operation.
Average after tax profits during the first five years for the plant are expected to be around
28%.
The project is financially viable with an internal rate of return (IRR) of 29 % and a net
present value (NPV) of Birr 235,377,692 Birr discounted at 5%.

24
MINISTRY OF INDUSTRY (MoI)
III. FEASIBILITY STUDY FOR THE ESTABLISHMENT OF GARMENT
ACCESSORIES MANUFACTURING PLANT

25
III. EXECUTIVE SUMMARY
1.1. Background
This Draft Report on Feasibility Study for the Establishment of Garment Accessories
Manufacturing Plant is prepared by the Industrial Projects Service (IPS), the Consultant, as
per the consultancy agreement concluded with the Ministry of Industry (MoI), the Client.
The report consists of market, technical and financial analyses components on the feasibility
study of the envisaged plant. The next section provides synoptic summary of the findings
under each component.
1.1.1. Analysis of the Business Environment
Both external and internal business environment may affect the operations of the envisaged
project. Since the plant is yet to be established, only the external environment under which
the envisaged project operates are analyzed. Under external environment the opportunities
identified are supportive government policy in the form of the industrial sector policy,
incentives granted, existence of abundant labor resource and land resource, and trade
agreements.
As a result of the government’s focus in supporting the growth of the manufacturing sector,
the possibility of success by the envisaged plant will be enhanced. Moreover, to encourage
and promote private investment various incentives are granted to investors including
reduction in customs import duty, exemption from payment of export customs duties, income
tax holiday, loss carried forward, guarantees to investors, repatriation of capital and profits,
and guarantee against expropriation. The existence of cheap and abundant labor resource and
land resource suitable for cotton cultivation is another opportunity for textile, garment and
garment accessories producing companies. Ethiopia has also trade agreements with a number
of countries which give it quota and duty free market access. These enable enterprises run
profitably in the country which is opportunity for the envisaged project directly or indirectly.
The threats to the project include low custom duty on finished garment accessories and
relatively high duty on inputs, lack of strong coordination among stakeholders, negative
impacts of the continuously increasing production cost, i.e., fuel, spare parts and raw
materials are identified.

26
Some of these threats have already been recognized by relevant stakeholders and mitigation
measures are being considered and the rest can be addressed through adaptive measure of the
upcoming project.
Therefore, the external opportunities of the project and incentives that exist indicate future
success and reliability of the investment.
1.1.2. Market Study
a) Product Description and Application
Garment accessories are various type of manufactured items used as inputs to garment
industries. These are very essential items that include products such as sewing thread,
buttons, zippers, and elastics, etc.
Sewing Thread is a tightly twisted strand of two or more plies of yarn that are circular when
cut in cross section used for sewing. Ninety-five percent of thread manufactured is used in
commercial and industrial sewing. Thread is also used for hand sewing and in home sewing
machines.
Buttons are small fasteners most often attached to women’s, men’s and children’s wear and
serves to secure two pieces of fabric together by slipping through a fabric or thread loop, or
by sliding through a buttonhole. Buttons may also be sewn onto garments for purposes of
ornamentation.
A zipper, zip, fly or zip fastener, formerly known as a clasp locker, is a commonly used
device for binding the edges of an opening of fabric or other flexible material, as on a
garment or a bag based on interlocking teeth. It is used in clothing (e.g., jackets and jeans),
luggage and other bags, sporting goods, camping gear (e.g. tents and sleeping bags), and
other items.
Elastic tapes are required for the purpose of holding the garments tightly when it is worn by
the persons. In addition to providing comfort, it also increases the life of the garments.
Generally, the elastic tapes are used in undergarments like briefs, panties, brassiers, baggies,
children's dress etc. It is also used in suitcases for inside straps for better grip holding and in
car seats for safety driving etc.
27
b) Supply Trend
1) Sewing Thread
The Ethiopian market for sewing thread has been served through local production and import.
The country also exported a small amount of sewing thread.
There was some local production of sewing thread up to year 2011. However, local
production has stopped after 2011. During the period 2000--2011 local production of sewing
thread was fluctuating extremely from year to year without a trend. Despite the fluctuation
the yearly average level of local of production during the period 2000--2011 was about 368
tons.
Ethiopia imports both cotton and synthetic sewing thread. In the past 14 years i.e. 2000--
2013, import of sewing thread has generally shown an increasing trend. Import of sewing
thread which was about 207 tons in the year 2000 has increased to about 626 tons and about
1,821 tons by year 2006 and year 2013, respectively. The average share of cotton and
synthetic sewing thread import during the period 2000--2013 was 0.44% and 99.56%,
respectively.
Ethiopia`s expenditure for importing sewing thread has shown a large increase in the past
fourteen years. The yearly average level of expenditure for importing the product has
increased from Birr 4.8 million during the years 2001--2003 to Birr 141.7 million by the year
2013.
Ethiopia has been exporting sewing thread during the period 2000--2013 although the
quantity is insignificant and highly fluctuating from year to year. The yearly average quantity
exported during the period 2000--2013 was about 13 tons
Total supply or apparent consumption is the sum of local production and import minus
export. Total supply has shown an increasing trend during the study period with the exception
of some years relatively compared to their preceding years. Total supply was about 208 tons
in the year 2000 and it increased to about 650 tons and 1,821 tons in 2006 and 2013,
respectively.

28
2) Buttons
The country`s demand for buttons is met both from domestic production and import. There
are only two button manufacturing plants in the country. The total annual attainable capacity
of the existing local factories in a single shift and 300 a working day per annum is 109 tons.
Ethiopia imports metal, plastic and other types of buttons. Import of buttons during the period
2000--2013 had a general increasing trend although it is characterized by fluctuations. The
yearly average imported quantity which was about 42 tons during the period 2000--2006 has
increased to a yearly average of 84 tons during the period 2007--2013. The average share of
metal, plastic and other types of buttons imported during the period 2000--2013 was 12.6%,
30.0%, and 57.4%, respectively.
There was a small amount of button export in some of the years starting from year 2006.
Export of buttons stood at 410 kgs in 2006 and increased to one ton the following year. There
was almost no export during 2008--2012. Finally, in 2013 the country managed to export 200
kgs of buttons.
Total supply or apparent consumption of buttons had been generally rising during the past
fourteen years although it was characterized by fluctuations. Initially total supply increased
for four consecutive years and reached a peak in 2004 i.e. from 33.2 tons in the year 2000 to
93.6 tons in year 2004. This was followed by decline for consecutive two years (2005--2006)
with annual average of about 59 tons. Then after, total supply increased for two more
consecutive years and attained the maximum amount (347 tons) of the whole period in 2008.
The total supply/ apparent consumption during the period 2009--2013 was relatively stable,
ranging from the lowest 111 tons (year 2011) to the highest 149 tons (year 2013).
3) Zipper
The source of supply for zipper is entirely imported. Import of zipper has been generally
increasing from 2000--2013, with fluctuations in some years. Import of zipper which was
60.39 tons in the year 2000 has increased to 354.77 tons by the year 2013. The estimated
share of plastic (polyester), nylon, and metal zipper import is 70%, 20% and 10%,
respectively.

29
Ethiopia`s expenditure for importing Zipper has shown significant increment in the past
fourteen years. The yearly average level of expenditure for importing the product has
increased from Birr 1.8 million during the years 2000--2002 to Birr 17.5 million during 2012-
-2013.
4) Elastic tape
The demand for elastic tape in Ethiopia is being met through import and domestic production.
There are two elastic tapes manufacturing plants in the country. The total annual attainable
capacity of the existing factories in the country in a single shift and 300 working days per
annum is 1,209 tons.
Import of elastic tape had a fluctuating trend for the first 8 years i.e. from 2000--2007. The
annual import during this period amounted about 14 tons. From year 2008 to year 2011
imported quantity consistently increased. Imported quantity which was about 17 tons in 2008
has reached at about 103 tons in 2011. However, it fell to about 74 tons in 2012 and rose
again to about 135 tons in 2013.
In the past 14 years there was a small amount of export sporadically. The average annual
export during the period 2000--2013 was only 2.3 tons.
Total supply/apparent consumption of elastic tape had a fluctuating trend for the first 8 years
i.e. from 2000--2007. The average total supply during this period was about 138 tons. From
2008 to 2013 the trend in the total supply or apparent consumption is upward. The total
quantity supplied or consumed was about 23 tons in 2008 and has reached at about 141 tons
in 2013.
c) Present Effective Demand
1) Sewing Thread
The present effective demand for sewing thread is estimated based on three different methods
namely; Time trend extrapolation; Growth rate method, and Moving average.
After analyzing the appropriateness of each method, growth rate method is selected as the
most plausible method of estimating the present effective demand for sewing thread.
Accordingly, the present effective demand for sewing thread is estimated at 2,185.454 tons.
Assuming 1% and 99% from the total estimated demand is cotton and synthetic thread,
respectively, the estimated demand for both types of products is shown below.

30
2) Buttons
The present effective demand for buttons is estimated based on three alternatives namely;
Time trend extrapolation; Growth rate method, and Moving Average
After analyzing the appropriateness of each method the moving average of order 3 methods is
selected. Accordingly, the present effective demand for buttons is estimated at 144.852 tons.
By taking past demand share of each type the estimated demand for the different types of
buttons is shown below.
3) Zipper
The present effective demand for zipper is estimated based on Time trend extrapolation;
Growth rate method, and Moving Average
After analyzing the appropriateness of each method the Time trend extrapolation method is
selected. Accordingly, the present effective demand for zipper is estimated at 282.3 tons.
Assuming 70%, 20% and 10% from the total estimated demand is plastic (polyester), nylon,
and metal zipper, respectively the estimated demand for the types of products is shown
below.
r)...................... 197.61 tons
4) Elastic Tape
In order to estimate the current effective demand for elastic tape in Ethiopia, three different
methods, namely: Time trend extrapolation; Growth rate method, and Moving Average are
applied.
After analyzing the appropriateness of each method, growth rate is found to be most
appropriate approach. Accordingly, the current effective demand for elastic tape is estimated
at 155.06 tons.

31
d) Factors that Affect the Local Demand for Garment Accessories
The major factors that affect the demand for Garment Accessories are; Performance of the
National Economy, Performance of the Manufacturing Sector, Performance of the local
textile and garment products manufacturing sub sector; and Population growth and
urbanization. Accordingly, assessment of these factors reveals that there is progressively
growing local demand for Garment Accessories.
e) Demand Projection
1) Sewing Thread
The demand for sewing thread is projected to reach at 2,491.42 tons, 4,797.02 tons, and
9,236.27 tons for the year 2015, 2020, and 2025, respectively.
2) Buttons
The annual local demand for buttons will increase from about 164.471 tons in the year 2015
to 316.675 tons and 792.407 tons for the year 2020 and 2027, respectively.
3) Zipper
The demand for zipper is projected to reach at 304.93 tons, 442.27 tons and 739.07 tons by
the years 2015, 2020 and 2027, respectively.
4) Elastic Tapes
The demand for elastic tapes is projected to reach 176.77 tons, 340.35 tons, and 851.65 tons
for the year 2015, 2020, and 2027, respectively.
f) Unsatisfied Demand/Demand – Supply Gap
1) Sewing Thread
Sewing Thread is currently being wholly imported. Therefore, the projected demand has been
considered as the unsatisfied demand. Hence, unsatisfied demand/demand–supply gap of
sewing thread is 176.77 tons, 340.35 tons and 851.65 tons for the year 2015 year 2020 and
year 2027, respectively.

32
2) Buttons
Buttons are currently supplied from local production and import. The total unsatisfied
demand / demand–supply gap of buttons will increase from 84.1 tons in the year 2015 to
218.7 tons in the year 2020. Furthermore, the total unsatisfied demand will reach to more
than 500 tons by the year 2025.
The unsatisfied demand/demand–supply gap for metal buttons will increase from 11.6 tons in
the year 2015 to 22.3 tons in the year 2020. Furthermore the unsatisfied demand for metal
buttons will reach about 55.7 tons by the year 2025.
The unsatisfied demand/demand–supply gap for plastic buttons will increase from 18.6 tons
in the year 2015 to 59.1 tons in the year 2020. Furthermore the unsatisfied demand of plastic
buttons will reach about 213.5 tons by the year 2025.
The unsatisfied demand/demand–supply gap for other types of buttons will increase from
54.0 tons in the year 2015 to 106.1 tons in the year 2020. Furthermore the unsatisfied demand
of other types of buttons will reach about 271.3 tons by the year 2025.
3) Zippers
Zipper is currently being wholly imported. By considering the projected demand as the
unsatisfied demand, the supply demand gap is estimated at 304.93 tons, 442.27 tons and
739.07 tons by the years 2015, 2020 and 2027, respectively.
4) Elastic Tape
There is excess local capacity of Elastic Tape i.e. existing local capacity is higher than
projected demand. Therefore, the demand deficit/excess capacity will decrease from 633.26
tons in the year 2015 to 469.68 tons in the year 2020. Furthermore, the demand supply gap
reaches positive territory that is 41.62 tons by the year 2027.
g) Market Share Analysis
1) Sewing Thread
Assuming that the envisaged project will produce quality products that compete with
imported ones, undertake well-coordinated marketing efforts and be price competitive with
import, it is assumed that the envisaged projects to be established in the country can capture
33
about 50% of the projected demand during the first three years of operation. After three years
of operation the market share of locally produced sewing thread is assumed to increase
annually by 10% until it reaches 80% in the sixth year of operation.
2) Buttons
Anticipating superior marketing activities by upcoming factory, and assuming that the
envisaged factory will produce good quality products, which are comparable to imported
products and that the products will be appropriately priced; the market share from the
unsatisfied demand is taken as 30% for import and 70% for upcoming factory.
3) Zipper
Assuming that the envisaged project will produce quality products that compete with
imported ones, undertake well-coordinated marketing efforts and be price competitive with
import, it is assumed that the envisaged projects to be established in the country capture about
50% of the projected demand during the first three years of the operation. After three years of
operation the market share of locally produced zipper is assumed to increase annually by 10%
until it reaches 80% in the sixth year of operation.
4) Elastic Tapes
Since there is excess local capacity by the projects which have become operational recently,
there is no market share to be captured in the domestic market.
h) Marketing Mix Assessment
1) Product Quality
The result of rapid assessment shows that until recently there had been problems with respect
to quality of garment accessories (issue of strength and durability). It also shows that
potential customers have quality requirement when it comes to preferences. It is
recommended that the garment accessories be free from quality weaknesses (be of
impeccable quality) and be endowed with sufficient strength. It is also important to heed the
quality requirements of customers.
34
2) Pricing
In order to propose the factory gate price of the upcoming projects of garment accessories,
data on the current prices are collected from existing producers, importers and end users of
the product. Accordingly, after making the necessary analysis a price level that makes the
project competitive in the market are recommended. The proposed factory gate prices of
garment accessories are as follows:
(a) Sewing Thread, Size 40/2 (100% Polyester)
o Birr 25.45 per cone for 5,000 yard
o Birr 60 per dozen for 1,000 yard
(b) Buttons
Button size number Proposed price per
gross (144 pieces)
single face double face
30 33.65 36.31
23 19.70 -
18 11.29 -
25 25.39 29.40
32 37.94 46.08
36 56.18 56.18
40 66.64 -
44 77.09 -
(c) Zipper
o 8 cm for Birr = 0.65
o 9 for Birr = 0.70
o 10 for Birr = 0.74
o 11 for Birr = 0.78
o 17 for Birr = 1.17
o 18 for Birr = 1.22
o 19 cm for Birr = 1.52
o 20 cm for Birr = 1.77

35
o 32 for Birr = 2.61
o 72 for Birr = 6.21
o 8 cm for Birr = 0.91
o 9 cm for Birr = 0.96
o 10 for Birr = 1.04
o 11 cm for Birr = 1.13
o 17 cm for Birr = 1.48
o 18 cm for Birr = 1.61
o 19 cm for Birr = 1.78
o 20 cm for Birr = 2.21
o 32 cm for Birr = 3.04
o 72 cm for Birr = 6.64
3) Distribution
Currently, sewing thread and zipper are imported and sold by importers directly to end users
or is channeled to retailers who in turn sale it to end users. With respect to button, existing
producers’ sale buttons at factory gate for both end users and intermediaries. Imported
buttons are on the other hand sold by importers themselves or passed to retailers who in turn
sell to end users. The current arrangement has limitation with regard to availability of
different colors. This has got to do with the majority of the accessories being imported and
hence their color determined in advance (not with orders).
The upcoming project is recommended to maintain both directly selling to end users in
particular to garment factories and distributing through wholesalers and retailers for small
amount buyers.
4) Marketing Strategy & Promotion
As a new entrant into the market, the envisaged plant has to penetrate the market first and
create awareness. Accordingly, the envisaged plant will pursue an appropriate promotion
policy. The objective is to gain a foot hold in the market, curve out a sizable market share and
to sustain a reasonable profitability. Promotional measures particularly Aggressive Promotion
Campaign and Providing Promotional Incentives (Sales Promotion Tool) are recommended.

36
i) Plant Capacity Determination
Analyzing the factors that affect capacity determination such as the demand for products
under consideration, raw material availability for the project life, technology and availability
of machinery and equipment in the world market with the proposed capacity, etc, the
envisaged project is proposed to have a total annual capacity of 40 tons, 3000 tons and 275
tons for polyester button, sewing thread, and zipper, respectively. This capacity is proposed
to be achieved generally on the basis of 300 working days per annum and single shifts of 8
hours each per day.
The plant is expected to start production at 75 % of its full capacity that will grow to 85 % in
the second year and 95% in third year. In fourth year and then after, the envisaged plant will
attain 100 % of its full capacity.
1.2. Technical Study
1.2.1. Material and Input
The materials and inputs required for the manufacture of garment accessories comprising
polyester button, polyester sewing thread, nylon and polyester zipper and elastic band include
basic raw materials, auxiliary materials, and utilities.
a) Polyester Button
The basic raw materials for the production of polyester button are polyester resin, accelerant,
curing agent, pearl concentrate (white), pearl concentrate (colorized), and pigment. All these
basic raw materials are imported.
Talc powder, polishing powder, polishing stone, polishing oil, and brightener are auxiliary
material used for polishing the polyester button. In addition, plastic bag and carton are
auxiliary material used for packaging of buttons.
Water, compressed air, and electricity are the utilities required for the production of polyester
button.
The total annual cost of material and input for the polyester button production line is
estimated at Birr 3,248,716, out of which Birr 2,561,198 is required in foreign currency.
b) Polyester Sewing Thread
The basic raw materials for the production of polyester sewing thread are single ply polyester
yarn, dyes stuff and chemical.

37
The dyed thread is wound on smaller spools/cons for industrial or home use, and the
spools/cones are packed with polyethylene film and packed into boxes for shipment. Hence,
spools, cons, polyethylene film and carton box are the auxiliary raw materials required for the
production of polyester thread.
Water, electricity, and compressed air are the utilities required for the production of polyester
sewing thread. The total annual cost of material and input for the polyester thread production
line is estimated at Birr 101,281,220 out of which Birr 51,706.05 is required in foreign
currency.
1.2.2. Polyester and Nylon Zipper
The basic raw materials for the production of polyester and nylon zipper are polyester resin
and nylon monofilament yarn for making the stringer; fabric tape; zinc alloy plate for the
upper and lower stopper, slider, the box and pin; sewing thread for sewing the stringer on the
tape and nylon film to strengthen the tape end. These raw materials are all imported.
The other materials required by polyester and nylon zipper manufacturing plant include
plastic bag, carton and scotch tape which are all locally available.
Utilities to polyester and nylon zippers manufacturing plant include electricity and water.
The total annual cost of material and input for the polyester and nylon zipper production lines
is estimated at Birr 174,072,540, out of which Birr 129,672,600 is required in foreign
currency.
1.2.3. Location, Site and Environment
A two stage selection process of location for the envisaged garment accessories
manufacturing plant was carried out by the consultant. The first stage is selection of potential
alternative geographical locations based on the assessment of critical project requirements
and proximity to market centre. This stage of location analysis was done based on qualitative
data. The second stage involves selection of best location among the potential alternative
locations identified in the first stage based on quantitative data analysis.
The critical project requirements of the envisaged project comprise raw materials, utilities,
transport infrastructure, skilled and semi skilled labour, land, and other necessary
infrastructures.
The major consumers of the products of the envisaged plant are located in and around Addis
Ababa and hence Addis Ababa is taken as a market center for the products of the envisaged
plant.
38
Considering the above two qualitative factors i.e. availability of critical project requirements
and proximity to the market sector, three alternative locations are identified along the route
from Djibouti to Addis, namely, Nazreth, Modjo and in the vicinity of Addis Ababa.
The plant hence can be located in the stretch of land from Addis Ababa to Nazreth preferably
in the industrial zone of Addis Ababa (Lebu site) where most of the large scale garment
industries are located and the basic infrastructure is available.
1.2.4. Technology and Engineering
a) Button
The technology selected for button making is sheet and rod mold casting. In this technology,
the mixture of polyester resin, wax, catalyst, colorants and other chemicals are casted in sheet
or rod form by using a rotating cylinder and rods respectively and then further formed into
the desired button shape, size and finish by passing through different unit operations such as
cutting, holing, polishing, washing and drying.
The total investment cost for plant machinery and equipment for button manufacturing is
estimated to be Birr 2,564,730, out of which Birr 2,386,314 is required in foreign currency.
b) Sewing Thread
The technology selected for the production of sewing thread is importing gray yarn with
40/1ply count and then carrying out the downstream processing comprising twist into 40/2ply
sewing thread, dying, hydro extraction, drying, inspection and packing.
The total cost of machinery and equipment for sewing thread is estimated at Birr 21,511,210
out of which Birr 20,014,778 is required in foreign currency.
c) Zipper
Semi-automatic and singly–operated line technology is selected for the production of zipper
since this technology is suitable for lower capacities.
The manufacturing process for polyester zipper mainly involves accessories manufacturing,
assembly, inspection and packaging The total cost of machinery and equipment for zipper
manufacturing is estimated at Birr 10,760,320, out of which Birr 10,011,776 is required in
foreign currency.

39
1.2.5. Organization and Manpower
The selection of organizational structure of the envisaged project is made based on similar
public industries operating in the country, the capacity of the plant, complexity and
technology mix of the plant. Organizational structure principles such as specialization,
coordination, and departmentalization are also considered for design of structure that best
suits the envisaged project.
There will be three services and seven functional departments subdivided in to divisions and
sections. The services are plan and performance follow up, management information system
and internal audit; and the departments are Administration and HRD, Finance, marketing,
Production, Technical, Quality assurance, research and development, and Purchasing and
Property administration. All the departments will have two divisions. This arrangement is
made based on the nature of each process and number of human resource requirement. Each
service, department and division will be headed by qualified and experienced professional.
The total number of permanent human resource required for the operation of the envisaged
garment accessories manufacturing plant is estimated at 150.
Salary payment of Birr 15,500 per month for the highest job position and Birr 900 for the
lowest job position is considered as a base to determine monthly and annual salary expense of
the project. Accordingly, the total annual labour cost for the envisaged garment accessories
manufacturing Plant is estimated at Birr 9,480,000. Furthermore, the cost of training project
personnel to smoothly and effectively operate the plant is estimated at Birr 600,000.
1.2.6. Project Implementation
The project implementation schedule covers the activities starting from the feasibility study
evaluation and approval up to and including the trial-run and commissioning. It is envisaged
that the complete implementation program requires a total of 22 months starting from the
feasibility study approval. The implementation management cost of the envisaged project
comprises project office running and follow-up expenses, and erection and commissioning
costs.
The total cost of project follow up and office running cost for the whole project
implementation period is estimated at Birr 1,556,200, out of which Birr 220,000 is cost of
stationery and communication during the project implementation period.
The total cost of implementation management is estimated at Birr 4,049,041, which is totally
required in local currency.

40
1.3. Financial and Economic Analysis
The financial analysis of the project (benefits and costs) is computed over seventeen years
assuming 24 months implementation period and 15 years of operation. In addition
depreciation and amortization, customs duty and income tax, repair and maintenance costs,
terminal (salvage) values well as working capital have been worked out based on the existing
laws of the country and standard assumptions. Accordingly, the major findings of the
financial analyses are given below.
The total investment cost of the project is estimated at Birr 1.351 billion. From the total
investment cost the highest share (Birr 790.84 million or 58.53%) is accounted by fixed
investment cost followed by initial working capital (Birr 417.87 million or 30.93%) and pre
operation cost (Birr 142.42 million or 10.54%).
The total annual cost of production and revenue at 100% capacity utilization (year 4) is
estimated at Birr 2.274 billion and Birr 2.575 billion respectively.
The project will generate a profit throughout its operation life. Annual net profit after tax
will increase from Birr 187 million during first year of operation to Birr 301.10 million
during the last year of the project life.
The projected cash flow of the envisaged project shows that the project would generate
positive net cash flows throughout the operation years. Based on a 10% discount rate the
Internal Rate of Return (IRR) and Net Present Value (NPV) are computed to be 24.06% and
Birr 1.150 billion respectively, indicating the viability of the project.
The initial investment cost of the project will be fully recovered within six years, which is a
reasonably short period of time. Other measures of profitability net profit as a % of sales
revenue, net profit to equity and net profit to total investment are also attractive.
The efficiency ratios like current assets to current liabilities and net cash flow to sales
calculated from the balance sheet show that the project is highly liquid with sound financial
performance.
The breakeven point for sales and capacity utilization is computed at Birr 914.06 million and
41% which are reasonable. Moreover, the sensitivity analysis carried out indicates that the
project could be viable at adverse conditions i.e. either a decrease of 11% in sales price or
increase of 14% in production cost or an increase of abocve 50% in investment cost.
In addition to its financial viability the project has a number of economic and social benefits.
The establishment of the project has a foreign currency earning effect to the country by
exporting its products to the international market. Moreover, as a profitable venture it will

41
contribute to the increase of Regional and Federal government revenue through corporate,
payroll and other taxes.
The project will create direct employment opportunities for about 134 persons. Furthermore,
it creates a conducive environment for the rapid growth of service and trade sectors around
the project site which in turn create employment opportunity for a substantial number of
persons. Moreover, the project will also create backward linkages with the agricultural sector.

42
MINISTRY OF INDUSTRY
IV. FEASIBILITY STUDY FOR THE ESTABLISHMENT OF GLASS PACKAGING
MANUFACTURING PLANT

43
IV. EXCUTIVE SUMMARY
This Draft Report on Feasibility Study for the Establishment of glass packaging
manufacturing plant is prepared by the Industrial Projects Service (IPS), the Consultant, as
per the consultancy agreement concluded with the Ministry of Industry (MoI), the Client.
The report consists of market, technical and financial analyses components on the feasibility
study of the envisaged plant. The next section provides synoptic summary of the findings
under each component.
1.1 Analysis of the Business Environment
As per the analysis carried out by different institutions on the political, economic, socio-
cultural and technological developments (PEST), Ethiopia offers a stable political and
economic environment as well as security; exceptional climate; almost complete absence of
routine corruption; continuously improving public service delivery which makes it potentially
an ideal destination for investment.
The macro economic performance in the past seven years has been very positive and the GTP
indicates a very good prospect, with a minimum of 11% GDP growth per annum, for the
future. Although the incentive packages that are currently given seem to be adequate, the
government is planning to give additional incentives for the manufacturing sector,
particularly to export -oriented and import substituting projects. Priorities will be given to the
manufacturing sector in support of provision in the areas of licensing, land and finance
allocation, training and the like.
The expansion of Universities as well as Technical, Vocational Education and Training
(TVET) in all parts of the country provides good opportunity in the supply of skilled and
semi-skilled technical personnel. Health service provision and development of infrastructures
such as roads, energy and communication are also showing a rapid improvement in the
country. The advancement of science and technology in the world and the spread of same in
the country will favourably influence the smooth operation of the envisaged project.
To encourage investment a number of incentives are granted to investors which include:
exemption of customs duty for importing capital goods and spare parts for investment and
raw materials for production of export goods, income tax holidays and the permission of
losses to carry forward during tax holiday period. Ethiopia also provides different guarantees
with respect to repatriation of capital, profit and against expropriation and nationalization.
Accordingly, it can be concluded that Ethiopia is ideal for investment.

44
1.2 Market Study
1.2.1 Product Description and Application
a) Description
Glass is the trusted and proven packaging for health, taste and the environment. Container
glass is made from a basic soda lime formulation and is melted in a fossil fuel fired or, an
electrically heated furnace. The molten glass is generally formed into the products by
automated individual section (IS) machines by blowing and pressing techniques. Where
appropriate coloring agents are added to the glass and surface coatings are applied to the
finished products.
The main advantages of glass are ease of cleaning and reuse recyclability, transparency,
chemical inertness, and perceived quality for premium products.
It is impermeable to gases and vapor, so it maintains product freshness for long period of
time without impairing taste or flavor. The ability to withstand high temperature processing
makes glass useful for heat sterilization of both low acid and high acid foods. Glass is rigid,
provides good insulation, and can be produced in numerous different shapes. The
transparency of glass allows consumers to see the product, yet variations in glass color can
protect light sensitive contents. Finally glass packaging benefits the environment because it is
reusable and recyclable.
The most important products of the container glass sector are bottles for beer, wine, spirits,
soft drinks etc, and wide neck jars for the food industry. These products are generally
considered as commodity items, but another important part of the sector is the production of
higher value containers for the pharmaceutical and perfume industries. The majority of
production is sold to customer industries, which then sell their packaged products into
markets. The relative importance of the various customer industries varies considerably. This
is reflected in the great diversity of markets for glass containers and the products they require,
particularly color, shape, size and design.
b) Product Applications
There are three broad customer industry sectors. The beverage sector accounts the major
share of glass packaging containers. This includes still and sparkling wines, fortified wines,
spirits, beer, soft drinks, fruit juices and mineral waters. The food sector is another consumer
industry (mostly jars). This covers a wide range of products, such as: wet and dry preserves,

45
milk and milk products, jams and spreads, sauces and dressings, oil, vinegar, etc. The other
consumer industry is Perfumery and pharmaceutical containers, generally small bottles.
1.2.2 Past Supply - Demand Trend
The Ethiopian market for glass packing materials is met both from import and domestic
production. The major end-users of glass packing materials are beverage bottlers, food
packers, cosmetics & personal care manufacturers, and pharmaceutical plants.
a) Import
Import of glass packing materials during the period 2003--2013 is characterized by a growth
trend. The yearly average imported quantity during the period 2003--2005 was 5,197 tons.
This has increased to a yearly average of 9,871 tons during the period 2006--2008, which is
an increase of about 90% as compared to the previous three years average. Similarly, the
yearly average level of import during the period 2009--2011 has reached 10,680 tons, which
is an increase of by more than 8% compared to the yearly average of 2006--2008. A huge
increase of import is registered during year 2012--2013, which reached to a level of 20,219
tons, and indicates an increase of about 89.3% as compared to the yearly average of the
period 2009--2011. Generally, during the period 2003--2013 the yearly average growth rate
of the imported quantity was about 26%.
The amount of expenditure for importing glass packing materials during the past eleven years
has grown substantially. The yearly average CIF value which was about Birr 23.7 million
during the period 2003--2005 has increased to about Birr 59 million during the years 2006--
2008. The yearly average expenditure during the years 2009--2011 and year 2012--2013 has
reached to more than Birr 114 million and Birr 275 million, respectively.
The sources or origins of import for glass packing material are numerous countries. However,
during the last five recent years, .i.e. 2009--2013, more than 78% is supplied by two
countries, namely China (44%) and United Arab Emirates (34%).
b) Local Production
Currently Ethiopia has two glass containers producers which are located in Addis Ababa. Up
to the year 2009 Addis Ababa Bottle and Glass S.C was the only producer of glass containers.
In 2010 the second manufacturer namely Daylight Applied Technologies Plc has entered in to
glass container production. Actual production of glass containers during the period 2003--
2012 ranged from the lowest 5,040 tons (year 2004) to the highest 9,779 tons (year 2011). In

46
the year 2013 actual local production has reached to 11,341 tons due to increase of
production by the two companies.
c) Total Supply (Apparent Consumption)
Apparent consumption is defined as local production + import – export. The apparent
consumption of glass packing materials in the country has grown by more than three fold in
the past eleven years. The average apparent consumption which was about 10.3 thousand tons
during the years 2003--2004 has increased to 16.7 thousand tons in the year 2007. Apparent
consumption has increased to about 22.9 thousand tons and 25.5 thousand tons by the year
2011 and 2012, respectively. A huge increase (30.1% rise compared to year 2012
consumption) is observed during year 2013, which stood at 33.2 thousand tons. Generally,
the annual average growth of apparent consumption during the past eleven years was 15.2%.
During the period 2003--2006 the average market share of local production and import was
57% and 43%, respectively. But the situation changed dramatically since 2007. Accordingly,
the average share of import from the total consumption has reached 69.4% by the year 2013
while that local share decreased to 30.6%. This indicates that local production is losing its
market share during the recent years even after the establishment of one additional plant in
the country. This is because demand has been rising as a result of the expansion of beverage
and other industries while local production of glass packing materials was not matching
proportionally with the growth of demand.
d) Present Effective Demand
The present effective demand for glass packing material is estimated based on five different
methods namely; Simple growth rate, least square method, Moving average; Exponential
smoothing and End use method
After analyzing the appropriateness of each method, growth rate method is selected as the
most plausible method of estimating the present effective demand for glass packing material.
Accordingly, the present (year 2014) effective demand for glass packing material is estimated
at 38,000 tons.

47
e) Factors that Influence the Demand for Glass Containers and Demand Projection
1) Factors that Influence the Demand for Glass Containers
The demand for glass packing materials depends on the development of the national economy
in general and specifically on the growth of the manufacturing sector; the level and value of
new manufacturing investment; performance of the food & beverage manufacturing sub
sector; performance of the pharmaceutical manufacturing sub sector; cosmetics and personal
health care manufacturing sub sector; rate of population growth and urbanization; and
presence of substitutes.
Accordingly, the above factors are critically analyzed. The assessment carried out on the
demand influencing factors for glass packing materials reveals a positive trend. The expected
economic growth in general and particularly the manufacturing sector; the massive
investment projects underway by the private sector in the beverage, food, pharmaceuticals
and personal health care products will create a large demand for glass packing materials
2) Demand Projection
Having seen the growth trend in the past apparent consumption of glass packing materials
(local production and import); the trend in the performance of the end user industries and
prospects for future; investments underway in the end user industries as well as the past and
future performance of the national economy; the demand for glass packing materials is
forecasted.
Accordingly, the demand for glass packing materials is assumed to grow by 18% for the
period 2015--2020, 12% for the period 2021--2025; and 8% for the period 2026 –2030.
Based on the above reasonable assumptions and taking year 2014 estimated effective present
demand as a base, which is 38,000 tons, the demand for glass packing materials will grow
from 44,480 tons in the year 2015 to 102,583 tons by the year 2020. The demand will further
increase to 180,786 tons and 265,635 tons by the year 2025 and year 2030, respectively. This
indicates the existence of large local market at present and in the future for glass packing
materials.

48
f) Unsatisfied Demand /Demand - Supply Gap
In order to estimate the unsatisfied demand of glass packing materials up to year 2030, the
existing supply from local production as well as projects that are expected to be operational
in the near future are considered.
The analysis carried out reveals that there is huge unsatisfied demand at present and in the
future. The unsatisfied demand, which is 33,540 tons in the year 2015, will increase to about
49.6 thousand tons by the year 2021 even after assuming entry of two new local producers or
an additional 54 thousand tones capacity per annum. The unsatisfied demand will further
increase to 115,486 tons and 200,335 tons by the year 2025 and year 2030, respectively. This
indicates that a number of medium to large scale manufacturing plants have to be established
to fulfill the growing unsatisfied demand.
g) Market Share Analysis
Considering the difficulty of importing glass containers from abroad due to heaviness of the
product and high cost of transportation new entrants that produce glass packing materials
locally are believed to be highly competitive with import as long as they produce quality
products. However, new entrants might not produce some type of specialized glass packing
materials that are required for some purposes. Therefore, in order to be in the safe side, the
market share of new entrants from the unsatisfied demand for the products under
consideration is assumed to be 95%.
Accordingly, the market share that could be captured by local producers will increase from
about 31.9 thousand tons in the year 2015 to about 110 thousand tons in the year 2025.
Similarly, the market share to be covered by local producers will reach 190,318 tons by the
year 2030.
Considering the past experience of the existing producers and the demand of end user
industries for the future the product mix recommended in this study is 70% for amber and
30% for flint glass.
h) Marketing Mix Assessment
The marketing mix referred as 4P’s, product, price, place and promotion, involves creating a
unique blend of the right product, sold at the right price, in the right place, using the most

49
suitable methods of promotion. For a successful marketing effort all the 4P’s should be
maintained rightly and balanced.
1) Product
In order to meet its business objectives the new project has to find out what consumers
require and then identify the best way in which it can satisfy these needs and wants.
Therefore, the glass container to be produced by the new project should meet customers’
expectations in terms of attractiveness; appearance, shape and maintaining lighter weight
without reducing container strength. The new project has to offer the Ethiopian glass
containers market with attractive glass bottles and jars to the expectations of a world
standard. Hence, studying of the beer, soft drinks, food and cosmetics market regarding their
packaging is of crucial importance for product improvement.
2) Distribution
Getting the right product to the right place at the right time involves the distribution system.
The present practice of bottling companies collecting glass bottles from producer should be
changed to a more favorable atmosphere of attracting customers. Thus, upon receiving orders
from bottling plants delivering the products of the new project directly to end users premises
will be a further incentive to the end using factories.
3) Price
Price is the value that is put to a product and is the result of a complex set of calculations,
research and understanding and risk taking ability. A pricing strategy takes into account
segments, ability to pay, market conditions, competitor actions, trade margins and input costs,
amongst others.
In order to recommend the appropriate price for the product of the upcoming project various
approaches of setting price are examined in addition to the data and information collected on
the pricing mechanism adopted by AABG S.C. The pricing mechanism adopted by
AABGSCo is cost plus. As far as the current gap between local supply and demand
continuous, it is possible to maintain the same price level without competing with the existing
supplier. However, as a new entrant to the market and in view of discouraging challenging
future competing products an average 20% less factory gate price is recommended for each
product line. Thus the recommended factory gate price for the new project understudy is Birr

50
13,273 per ton with a product mix of 70% amber type colored bottles and 30% mineral water
and cosmetics bottles.
4) Promotion
Promotion is about effectively communicating with customers so that they are encouraged to
buy a product. As a key marketing element, promotion comprises communications tactics
used to educate consumers, increase demand, and differentiate brands.
Advertising is just one element of the marketing communication arsenal, which can be
divided into sales promotion, public relations and digital marketing. Sales promotion is
related with price related communications, while public relations refer to press launches, PR
events and press releases.
Website is an integral part of below-the-line promotion. A further below-the-line method is
public relations. Effective public and media relations help to create positive press exposure
with seasonal promotional messages. Events, which often generate publicity, can serve long-
term objectives for building partnerships with external stakeholders, strengthening customer
loyalty and enhancing industry credibility.
The promotional effort should strive to know as much as possible about each end user
industry. To achieve objectives of increasing market share, the new project has to ensure its
promotional activity demonstrating the balance of its marketing mix. The main focus
therefore should be to increase demand for glass bottles. The appropriate method for
promotion of an industrial product like glass containers is below the line promotion targeting
specific companies, which offer a greater control of communication including targeted e-
mails to customers’ public relations and media relations. As a new entrant the new project
will promote to both the existing and prospective buyers. Promotion shall target those areas
where glass retains a winning edge as a premium product, playing on glass’ image as being
more trendy and prestigious than plastic packaging. The new project is recommended to
participate in major national and regional exhibitions and trade fairs as well as sponsoring
public events in particular those related with environment for public awareness and image
building.
i) Product mix, Plant Capacity and Production Program
While selecting the feasible plant capacity for the envisaged container glass manufacturing
plant different technical and financial factors including demand for the product, raw material

51
availability for the project life, and technology and availability of machinery and equipment
in the world market with the proposed capacity.
Considering all the above factors, the capacity of the plant is selected to be 26,828
tons/annum. This capacity is proposed to be achieved generally on the basis of 353 working
days per annum and three shifts of 8 hours each per day.
Regarding the product mix, 80% of the total production volume of the glass product is amber
and 20% is flint.
The plant starts its production at 85% of its full capacity and grows to 90% and 95% in the
second and third year and then after respectively. Due to the nature of the glass production
process the maximum capacity to be achieved is 95% of the total design capacity. Such a
gradual increase of capacity utilization is chosen taking into consideration the time needed by
the production and technical personnel to acquire adequate experience in the operation and
maintenance of machineries as well as time requirement for market penetration for its
products since the market is dominated by import and local producers who have been in the
business for long period of time.
1.3 Technical Study
1.3.1 Raw Materials and Inputs
The materials and inputs required for the manufacture of glass wares include major raw
materials, additives, auxiliary raw materials and utilities. The major raw materials required
for the production of soda lime glass are silica sand, soda ash, marble/lime stone, and cullet
which are locally available except soda ash which is imported partially.
The basic raw materials required for the production of glass container are silica sand, soda
ash, marble/lime stone, and cullet. All these basic raw materials are available in sufficient
quantity locally. The envisaged plant will get sand and lime stone from Mugher Cement
Enterprise, dolomite marble from MBI, soda ash from Abijata Soda Ash Share Company, and
cullet from own source, domestic solid waste collection system and major consumer.
Additives include selenium oxide, cobalt oxide, iron pyrite, iron chromites, sodium nitrate,
sodium sulphate and bagas ash etc., all of which are to be imported except bagas ash.
Auxiliary raw materials required by the envisaged container glass manufacturing plant are
enamel for decoration of bottles and packing materials. Different types of enamels (yellow,
white, green, red, blue, etc) are used to screen print different logos on the bottles to be
produced.

52
Bottles shall be palletized and shrink wrapped and hence the packing materials used for
bottles are sheet carton, pallet and polyethylene. Jam jar will be packed in a carton (each
carton shall contain 48 pcs).
Accordingly the annual cost of direct raw materials for the envisaged plant at full capacity
operation is estimated at about Birr 89,554,030.00 Out of which 55 %% in foreign currency
The annual cost of Auxiliary materials, inputs and factory supplies for the envisaged plant at
full capacity operation is estimated to be Birr 14,926,600.00 Out of which 15 % in foreign
currency. The annual utilities consumption for the envisaged plant at full capacity operation
is estimated at about Birr 53,723,750.
1.3.2 Location, Site and Environment
A two stage selection process of location for the envisaged glass packaging production plant
is followed by the consultant. The first stage is selection of potential geographical locations
based on the assessment of critical project requirements and proximity to market centre. This
stage of location analysis bases on qualitative data. The second stage involves selection of
best location among the potential locations identified in the first stage based on quantitative
data analysis.
The critical project requirements of the envisaged project comprise raw materials, utilities,
transport infrastructure, skilled and semi skilled labor, land, and other necessary
infrastructures.
The major consumers of the products of the envisaged plant are located in and around Addis
Ababa and hence Addis Ababa is taken as a market center for the products of the envisaged
plant. Considering the above two qualitative factors i.e. availability of critical project
requirements and proximity to the market sector; six towns comprising Gelan, Sululta,
Chancho, Legetafo, and Alemgena has been selected as possible potential locations of the
envisaged project.
These selected potential location are further quantitatively evaluated based on the
transportation model method of location selection which involves in determination of the best
pattern of transportation from several points of supply (source) to several points of demand
(destination) so as to minimize total production and transportation costs.
Based on the transportation model of location analysis the best location is either Alemgena or
Legetafo which are both 19km from the market center-Addis Ababa followed by Sululta,
Gelan and Chancho in sequence.

53
1.3.3 Technology and Engineering
Prior to selecting the appropriate technology for the production of glass wares in the
Ethiopian condition, alternative technologies for the main production steps i.e. raw material
preparation, melting and forming operations were assessed.
The major raw materials sand, limestone/marble and cullet undergo the following preparation
operations before going into the melting operation.
-cyclone
and drying using a rotary kiln Drier.
and wet rod mill as a secondary size reduction and drying using a rotary kiln Drier.
ce shall be crushed using jaw crusher and washed.
The raw material silos are fitted with level transmitters, pressure switches and over pressure
flaps that are all mounted and controlled by the control System. The silos will have a series of
de-dusting units that help in trapping the excess dust, which tends to rise as the silos get filled
up. These de-dusting units comprise of dust collectors and blower fans. At every stage
magnetic separators will prevent iron impurities finding their way into silos.
Dosing into the weigh cell from the respective silos is through screw conveyor. The time and
sequenced dosing of the raw material is completely controlled by PLC. The mixer shall be
equipped with automatic batch moisture control and de-dusting system.
The furnace recommended for the envisaged project is that of electrical type furnace. The
electrical heating shall be supported with fuel firing during the amber color glass production
to balance redox reaction within the furnace. This simply involves firing flames over the
surface of the batch material to add heat to the materials and aid melting. The technique is
sometimes referred to as over-firing and is often used to overcome some of the operational
difficulties encountered with 100 % electric melting.
Blow and blow and press and blow forming technologies together shall be used by the
envisaged glass packaging manufacturing plant so as to be flexible for the production of
different products i.e. narrow mouth containers like bottles by blow-blow and wide mouth
containers like jam jar by press and blow.
The production process of glass ware involves raw material preparation and batching,
melting, forming, annealing, decoration, re-annealing, inspection and packing.

54
Quality assurance is a crucial issue that should be addressed in any glass ware production
plant so that visual inspections, chemical analysis, and physical test need to be conducted on
the raw materials, intermediate products and finished products at planned interval. Polari
scopes, thermal shock resistance, weight consistency, capacity, pressure test, perpendicularity
are among the physical tests and density, alkalinity and chemical analysis using the atomic
absorption techniques are the chemical tests to be conducted in addition to the 100%
inspection of the finished product for assuring quality glass ware product manufacturing.
The total investment costs of plant machinery and equipments is estimated to be Birr
186,825,500.00 out of which 86% required in foreign currency , and the investment costs of
plant utility equipments , tools and devices is estimated to be Birr 121,77, 260.00 out of
which 87% is require in foreign currency
In addition the investment cost of transportation facilities for material handling and public
transport service is estimated to be Birr 21,400,000.00 required in local currency ; similarly
investment cost of plant office furniture and equipments is Birr 1,635,000.00 in local
currency.
The total area of the envisaged glass manufacturing plant is 43,500 m2 (4.35 hectare) with a
length of 300 m and width of 145 m. Of the envisaged total area, the building area including
the main production buildings (the factory), batch house, office and canteen building, soda
ash and additive store, Packing material storage, finished product store all covers about9456
m2 or 21.74% .
Similarly water station, cullet storage shed, silica sand shed & limestone storage shed covers
about 1720 m2 or 3.95 %. The open air accommodations area including cullet preparation
line, silica sand preparation line, slime pond, unprocessed material yard and power sub-
station area covers about 2356 m2 or 5.42 %.
Roads, parking areas and, walk ways account for 6525 m2 or 15% and the greenery accounts
8700 m2 or 20 % also the vacant (extra open area between accommodations) cover about
14,742.5 m2 or 33.89 %.
The project site is expected to be an ideal rectangular site reserved for industries, and with
arterial primary and secondary roads. The site should also have internal roads which connect
the different blocks of the plant and loading and unloading deck.
Accordingly, assuming a land lease cost of Birr 11.00 per m2 the total land lease cost is
estimated at Birr 19,140,000.00 of which 10 % of the total or Birr 1,191,400.00 will be paid
in advance and the remaining balance will be paid in equal installments within the lease
period of 40 years
55
The cost of the construction works for the envisaged plant was calculated on the basis of the
above proposed civil engineering design assumptions. The cost was calculated assuming that
a square meter of a covered area of an industrial pre- engineered buildings erection and
construction of blocks with local material like hollow concrete block and concrete work on
the current average market.
Accordingly, the total estimated cost of building, civil work and infrastructures is estimated
to be Birr-64,411,655.00.
1.3.4 Organization Structure and Human Resource
The project will have 203 employees with an initial total salary of about Birr 798,350 per
month when it commence operation. The factory management should arrange for on- job
training with the machinery suppliers before and during the installation & commissioning of
the machineries at the premises of the supplier for about one month. Similarly maintenance
and quality assurance personnel should be given a practical training on their respective fields
of engagement. Training should also be given to machine operators & visual quality control
workers on the various types of container glass defects and their remedies in the production
process. The duration of such training shall be 6-8 weeks long. As a result all key production
personnel will have the opportunity for being familiar with the operation of machineries and
the technology.
The total cost of training is estimated at Birr 4,000,000, out of which Birr 120,000 is required
in local currency. Similarly the annual cost of employee’s benefit is Birr 2,618,590.00
1.3.5 Project Implementation
The project implementation schedule covers the activities starting from the project evaluation
and approval up to and including the trial-run and commissioning. It is envisaged that the
complete implementation program requires a total of 24 months starting from the project
approval. The implementation cost of the envisaged project comprises project office running
and follow-up expenses, and erection and commissioning costs.
Project implementation costs include project follow up and office running cost, cost of
design, manufacturing, erection, and commissioning of the plant, and cost of design and
supervision of building and civil works of the plant. The total cost implementation including
project follow up and office running cost, cost of stationery and communication, cost of
design, manufacturing, erection, and commissioning estimated to be Birr 31,322,240.00 out
of which 88 % is required in foreign currency specifically for design, manufacturing, erection
and commissioning activities.

56
1.4 Financial Analysis and Economic Benefits
The financial analysis of the project (benefits and costs) is computed over seventeen years
assuming two year implementation period and 15 years of operation. In addition depreciation
and amortization, customs duty and income tax, repair and maintenance costs, terminal
(salvage) values well as working capital have been worked out based on the existing laws of
the country and standard assumptions. Accordingly, the major findings of the financial
analyses are given below.
The total investment cost of the project is estimated at Birr 489.63 million. From the total
investment cost the highest share (Birr 396.04 million or 80.89%) is accounted by fixed
investment cost followed by pre operation cost (Birr 64.78 million or 13.23%) and initial
working capital (Birr 28.80 million or 5.88%).
The total annual cost of production and revenue at 100% capacity utilization is estimated at
Birr 255.55 million and Birr 356.08 million respectively.
The project will generate a profit through out its operation life. Annual net profit after tax
will increase from Birr 72.86 million during first year of operation to Birr 113.85 million
during the last year of the project life.
The projected cash flow of the envisaged project shows that the project would generate
positive net cash flows throughout the operation years. Based on a 10% discount rate, the
Internal Rate of Return (IRR) and Net Present Value (NPV) are computed to be 30.37% and
Birr 521.63 million respectively, indicating the viability of the project.
The initial investment cost of the project will be fully recovered within five years, which is a
reasonably short period of time. Other measures of profitability net profit as a % of sales
revenue, net profit to equity and net profit to total investment are also attractive.
The efficiency ratios like current assets to current liabilities and net cash flow to sales
calculated from the balance sheet show that the project is highly liquid with sound financial
performance.
The break even point for sales and capacity utilization is computed at Birr 156.52 million and
44% which are reasonable. Moreover, the sensitivity analysis carried out indicates that the
project could be viable at adverse conditions i.e. either a decrease of 22% in sales price or
increase of 25% in production cost or an increase of 40% in investment cost.
In addition to its financial viability the project has a number of economic and social benefits.
The establishment of the project has a foreign exchange saving effect to the economy.
Moreover, as a profitable venture it will contribute to the increase of Regional and Federal
government revenue through corporate, payroll and other taxes.

57
The project will create direct employment opportunities for about 203 persons. Furthermore,
it creates a conducive environment for the rapid growth of service and trade sectors around
the project site which in turn create employment opportunity for a substantial number of
persons.
Moreover, the project will also create forward and backward linkages with the local
manufacturing sub sector and mining sector, respectively.

58
MINISTRY OF INDUSTRY
V. FEASIBILITY STUDY FOR THE ESTABLISHMENT OF LABELS
MANUFACTURING PLANT
59
V. EXCUTIVE SUMMARY
This Draft Report on Feasibility Study for the Establishment of Labels Manufacturing Plant
is prepared by the Industrial Projects Service (IPS), the Consultant, as per the consultancy
agreement concluded with the Ministry of Industry (MoI), the Client.
The report consists of market, technical and financial analyses components on the feasibility
study of the envisaged plant. The next section provides synoptic summary of the findings
under each component.
1.1 Analysis of the Business Environment
As per the analysis carried out by different institutions on the political, economic, socio-
cultural and technological developments (PEST), Ethiopia offers a stable political and
economic environment as well as security; exceptional climate; almost complete absence of
routine corruption; continuously improving public service delivery which makes it potentially
an ideal destination for investment.
The macro economic performance in the past seven years has been very positive and the GTP
indicates a very good prospect, with a minimum of 11% GDP growth per annum, for the
future. Although the incentive packages that are currently given seem to be adequate, the
government is planning to give additional incentives for the manufacturing sector,
particularly to export oriented and import substituting projects. Priorities will be given to the
manufacturing sector in support provision in the areas of licensing, land and finance
allocation, training and the like.
The expansion of Universities as well as Technical, Vocational Education and Training
(TVET) in all parts of the country provides good opportunity in the supply of skilled and
semi-skilled technical personnel. Health service provision and development of infrastructures
such as roads, energy and communication are also showing a rapid improvement in the
country. The advancement of science and technology in the world and the spread of same in
the country will favorably influence the smooth operation of the envisaged project.
To encourage investment a number of incentives are granted to investors which include;
exemption of customs duty for importing capital goods and spare parts for investment and
raw materials for production of export goods, income tax holidays and the permission of
losses to carry forward during tax holiday period. Ethiopia also provides different guarantees
with respect to repatriation of capital, profit and against expropriation and nationalization.
Accordingly, it can be concluded that Ethiopia is ideal for investment.

60
1.2 Market Study
1.2.1 Product Description and Application
A label is a piece of paper, polymer, cloth, metal, plastic or other material affixed to a
container or product, on which is printed various information about the product that may
serve different purposes. Labels have many applications including:-
-life and disposal,
perating products,
There are various types of labels some of the commonly used types are stickers, Permanent
Labels, Temporary Labels, Printed Packaging, Textile Labels, Security Labels, Fold-Out
Labels, Specialized Labels, and Hangtags
1.2.2 Past Supply Trend
The local demand for labels is mainly supplied through import. Accordingly, the major
findings of the trend in past supply of plastic packing materials are summarized below.
a) Paper Labels
During the period 2000--2013 import of paper labels in terms of volume has exhibited a year
to year growth, increasing from 121 tons to 1,099 tons, registering an average annual growth
rate of 9.23%.
b) Plastic Labels
Apparent consumption of plastic labels during the period 2001--2013 has shown a noticeable
increasing trend. During the first five years of the data set i.e. 2001--2005 the average annual
apparent consumption of plastic labels was 14.59 million pieces or 33 tons. However, during
the subsequent 5 years (2006--2010) apparent consumption has increased to an average of
140.04 million pieces or 315 tons. Furthermore, during the recent three years (2011--2013)

61
apparent consumption of plastic labels has escalated to an average of 335.22 million pieces or
754 tons.
c) Textile Labels
Import of textiles labels during the period 2000 – 2013 has shown a general increasing trend
although it is characterized by some fluctuations. The yearly average imported quantity
which was about 6 tons during the period 2000--2005 has increased to a yearly average of
11.3 tons during the period 2006--2008. Similarly yearly average imported quantity increased
to 21.68 tons and 33.68 tons during the period 2009--2011 and 2012--2013, respectively.
d) Hangtags
Apparent consumption of hangtags exhibits a substantial growth, especially during the recent
two years i.e. 2012--2013. The average annual apparent consumption which was 2.4 million
pieces (12 tons) during the period 2004--2011 has increased to an average of 13.02 million
pieces (65 tons) during the period 2012--2013. Between the two periods (2004-2011 and
2012-2013) apparent consumption of hangtags has increased by five fold.
1.2.3 Present Effective Local Demand
In order to estimate the current effective local demand for labels, the following methods were
applied:
- parameter double exponential smoothing;
Based on the strength and weakness of each method the end use method is found to be the
most appropriate for all the products under consideration. Accordingly, the estimated present
effective demand for each product is given below.
tons

62
1.2.4 Trend in Factors that Affect the Local Demand for the Products under
Consideration
Almost all manufactured goods require some type of labels. Hence past performance and
future prospect of the manufacturing sector determines the magnitude of the demand for
labels. Accordingly, a thorough assessment of the manufacturing sector indicates that there is
a progressively growing local demand for labels.
1.2.5 Demand Projection
The local demand for paper labels is projected to increase from 2,254 tons in 2015 to 4,534
tons and 9,119 tons by the years 2020 and 2025, respectively. Moreover, by year 2030 the
demand is projected to reach 18,341 tons.
The local demand for plastic labels is projected to increase from 1,454 in 2015 to 2,924 tons
and 5,881 tons by the years 2020 and 2025 respectively. Moreover, by year 2030 the demand
is projected to reach 11,828 tons.
Similarly, the local demand for textile labels is projected to increase from 99 tons in 2015 to
199 tons, 400 tons and 805 tons by the years 2020, 2025 and 2030, respectively.
The local demand for hangtags is projected to increase from 101 in 2015 to 204 tons and 409
tons by the years 2020 and 2025 respectively. Moreover, by year 2030 the demand is
projected to reach 823 tons.
1.2.6 Market Share
The market share of the envisaged project for paper labels is projected to increase from 1,127
tons in 2015 to 2,267 tons and 4,559 tons by the years 2020 and 2025 respectively. Moreover,
by year 2030 the market share is projected to reach 9,170 tons.
The market share of the envisaged project for plastic labels is projected to increase from 727
tons in 2015 to 1,462 tons, 2,940 tons and 5,914 tons by the years 2020, 2025 and 2030
respectively.
Likewise, the market share of the envisaged project for textile labels is projected to increase
from 49 tons in 2015 to 99 tons, 200 tons and 402 tons by the years 2020, 2025 and 2030,
respectively.
The market share of the envisaged project for hangtag is projected to increase from 51 tons in
2015 to 102 tons and 205 tons by the years 2020 and 2025 respectively. Moreover, by year
2030 the market share is projected to reach 412 tons.

63
1.2.7 Marketing Mix
A proper quality control system considerably minimizes waste or the rejection of end
products and thereby avoids complaint by customers. It also reduces the envisaged factory’s
operating costs as it facilitates timely corrective measures. Accordingly, quality control
should be given top priority by the envisaged project.
Based on the data collected from end users the recommended factory gate price is shown
below.
ton
Labels are normally made on order basis. Hence, distribution does not conform to the
conventional whole sale and retail structures. The product will be collected by Customers
from the premises of the envisaged project or they are delivered directly to the client using
own vehicles. What is required in such kind of business (order basis) is to respect the delivery
time to build confidence by customers.
The envisaged factory is recommended to aggressively advertise its product by distributing
calendars, pamphlets as well as by participating in exhibitions and bazaars. Moreover, in a
competitive market, trade promotion should be made to persuade or to make a product
attractive for end users. The envisaged factory is recommended to offer discounts with the
volume of product bought and credit for one to two weeks.
1.2.8 Product mix, Plant Capacity and Production Program
The technology to be applied in the project and technology know - how is important factor in
determining the plant capacity. Specific technologies/processes are often related to certain
levels of production or become technically and economically feasible only at such levels
(minimum economies of scale).
The nature of technology choice and usage constitutes a key factor in the determination of
plant capacity. When we come to the printing technology, it is a much diversified industry,
owing to the multiplicity of printing technologies utilized, the size of the plant machinery,
and the products it produces.
64
It can be operated at small scale level however as the capacity is lower, it becomes labor
intensive, less capital intensive and lower the print quality. Label manufacturing of different
kinds is an already established market especially in the west and Asia resulting in the
abundant existence of reputable companies offering various machinery and technologies with
all kinds of capacity and options for label manufacturers. To this end, the technology mix
selection considers industrial development strategy of the country, product mix, quality
requirement of potential customers of the plant, flexibility of the production system, available
technology in the world and skill requirement for operation and maintenance of machinery.
Therefore, for the envisaged project it is assumed annually 300 production days, 8 working
hour per day, one shift operation, and capacity utilization rate of 85 % is considered.
Accordingly the proposed capacity of the envisaged plant is 800 ton of paper and plastic
based labels
1.2.9 Product Mix and Production Program
As it is indicated in the product description and the market study the product mix to be
produced by the envisaged plant includes the types of labels which are paper and plastic
based commonly for food, beverages pharmaceuticals and Textiles to be used as temporary
and permanent applications.
The selected label products (i.e. paper and plastic labels) are essentially printed on Paper or
Plastic substrates and the envisaged plant is planned to use technology or machinery that will
allow manufacturing of labels products using both the substrates. Therefore the proposed
envisaged plant product mix is 40% for paper based labels and 60 % plastic based labels
The envisaged plant will operate at 75% capacity utilization rate at first, 85 % at second year
of production and followed by rich experience of technical, financial, marketing and sales
factors of the environment, the envisaged plant will operate at full capacity utilization (100%
) in the third year and then after.
1.3 Technical Study
1.3.1 Raw Materials and Inputs
The raw materials and inputs required for the label manufacturing process can be
preliminarily categorized as direct and indirect raw materials, auxiliary materials and inputs
and utilities.
Raw materials required in manufacturing process of labels can substantially differ both in
amount and type based on the following major factors such as label type required, technology

65
used for production i.e. printing technology, customer’s requirements for additional features
such as laminates.
Irrespective of the above factors any label manufacturing requires two direct raw materials,
namely substrates such as paper, plastics or synthetic, metallic foils, inks, colorants and
binders. More over auxiliary raw materials such as Plate: adhesives, laminating and coating
materials: can also be considered as auxiliary raw materials all printing technologies, in
which are all direct and auxiliary raw materials are available and supplied from international
market and reliable suppliers
In addition factory inputs and supplies for packaging such as cardboard (Cartoon) and
polyethylene sheet, oil, grease and consumables are required and can be supplied from the
local market
Accordingly the annual cost of direct raw materials for the envisaged plant at full capacity
operation is estimated at about Birr 37,895,940.00 in foreign currency
The annual cost of Auxiliary materials, inputs and factory supplies for the envisaged plant at
full capacity operation is estimated to be Birr 9,156,470.00 out of which in foreign
currency.43% in foreign currency
The annual utilities consumption for plant at full capacity operation is estimated at about Birr
300,910.00 in local currencies.
1.3.2 Location, Site and Environment
Location: In process of the project location selection, the Consultant has adopted two stage
selection processes for the envisaged plant. The first stage is the identification of potential
geographical locations based on the assessment of critical project requirements. The second
stage involved selection of the best location from the potential locations identified using
different selection criteria and as well as established rating scale.
The potential market to the products of the envisaged plant is food and beverage producing
plants, bottled water production plants, canned food production plants and other plants in
various sectors that make use of paper or plastic based labels for their products.
Most of these plants import their labels from abroad this shows there is a very high demand
for printed plastic and paper labels in the country.
A relatively high number of factories are located either in Addis Abeba or the surrounding
areas marked for industrial zones like Dukam and Adama. To this end based on access to
potential market Addis Abeba takes a commanding position

66
All the basic raw materials and inputs required for the envisaged plant are obtained fully from
abroad. Therefore assuming the raw materials and inputs are imported using land
transportation the nearest potential source of raw material would be the Mojo dry port, which
fortunately is located in close proximity to Addis Ababa.
Moreover the industrial clustering program has identified cities/town for industrial zones
development for various industry types based on the resource potential, market potential for
industrial products, availability of basic infrastructure, etc.
Based on this classification we shall consider the sites classified for a similar sector as label
manufacturing which is printing, publishing and packaging industries. We shall also consider
industrial zone sites identified for industries that could serve as potential suppliers of raw
materials for labels which are pulp and paper production, rubber and plastic production
Adama, Dukam and Bushoftu are identified for industrial zones for printing and packaging
industries on the other hand Adama, Sebeta, Legatafo and Sululta are identified as industrial
zones for paper and plastic production which may serve as potential raw material suppliers
for the label plant in the future.
Accordingly Addis Ababa, Adama, Dukam and Mojo towns are selected as candidate
location for the envisaged plant considering the market, raw material source and industrial
clustering programs
Based on the evaluation of the three proposed location of the envisaged plant Addis Abeba is
found to be the best location for the envisaged Label manufacturing plant followed by Adama
,Dukam and Mojo towns.
Site: is a plot of land within the selected location sufficient and suitable for installation and
operation of the plant. Accordingly the site of the envisaged project will be in one of the
industrial zone in and around Addis Ababa reserved for industrial zone considering the
following major points:
lity of Water and Electricity

67
1.3.3 Technology and Engineering
The selected technology for the envisaged plant is flexographic printing technology
accordingly the typical label production process using print technology can be classified into
majorly pre- press, press and post press operation ,
In view of the selected technology complete set of engineering facility is selected considering
also proposed operational capacity. Accordingly the investment costs of plant machinery and
equipments is estimated to be Birr 79,304,820.00 out of which 86% required in foreign
currency ,and the investment costs of plant utility equipments , tools and devices is estimated
to be Birr 17,052,780.00 out of which 87% is require in foreign currency
In addition the investment cost of transportation facilities for material handling and public
transport service is estimated to be Birr 9,145,000.00 required in local currency. Similarly
investment cost of plant office furniture and equipments is Birr 959,000 in local currency.
More over the envisaged plant requires land for production hall, raw materials and finished
item storage , open air storage yard, offices & canteen block , electrical power substation,
internal roads and path ways, greenery and open space, utilities , water circulation and
adequate land for future expansion.
Based on this the total area of the envisaged label manufacturing plant is 8,000 m2 with a
length of 100 m and width of 80m. Of the envisaged total area, the building area including
the main production buildings, administration office building and canteen covers about
2688.00 m2 or 33.6%
Accordingly, assuming a land lease cost of Birr 11.00 per m2 the total land lease cost is
estimated at Birr 1,182,720.00 of which 10 % of the total or Birr 118,272.00 will be paid in
advance and the remaining balance will be paid in equal installments within the lease period
of 40 years.
The cost of the construction works for the envisaged plant was calculated on the basis of the
above proposed civil engineering preliminary design assumptions. The cost is calculated
assuming that a square meter of a covered area buildings construction of blocks with local
material like hollow concrete block and concrete work on the current average market.
Accordingly, the total estimated cost of building, civil work and infrastructures is estimated
to be Birr-20,449,610.00 .
1.3.4 Organization Structure and Human Resource
The envisaged plant operations and activities will be assigned to organizational units
represented by managerial staff, supervisors and workforce to attain the objectives of the

68
factory. The activities include planning, directing, coordinating and controlling of the factory
operations at the required level of quality and specified time.
The highest management body of the factory, the Board of Directors, is responsible for
handling policy issues, approving strategic plans, and follow-up the activities of the General
Manager. The General Manager is accountable to the Board of Directors. He is responsible
for planning, executing, monitoring and controlling the whole operational activities of the
company.
There are four line departments and three services under the general manager. The line
departments are: production and maintenance departments, procurement and supply
department, human resource and administration department and finance department.
The summary and the detail of manning plan of the envisaged Label Manufacturing plant is
indicated below based on the determined organization structure The total personnel
requirement of the plant is estimated to be 98, skilled, semi skilled and unskilled.
The project will have employees with an initial total annual salary of Birr 4,658,400.00 when
it commence operation.
More over the envisaged Label printing plant is recommended to be equipped with the latest
machinery and equipment as indicated in the technology and engineering part of this study in
order to meet the objective of making the plant highly productive and produce quality product
that meets the requirement of the market.
Accordingly two stage training is recommended by the consultant. The first stage covers
training of key personnel of the envisaged plant comprising Production director, Marketing
director, Quality Control Expert and Planning & Follow-up Expert to be held at the
machinery suppliers and actual operating Label printing plant premise for one month each
(should be held before the start of erection and commissioning of the plant).
In view of this the number of trainees and the training type with the associated costs is
estimated to be Bi 677,000.00 .
1.3.5 Project Implementation
The project implementation schedule covers the activities starting from the project evaluation
and approval up to and including the trial-run and commissioning. It is envisaged that the
complete implementation program requires a total of 16 months starting from the project
approval.
69
Project implementation costs are pre-operation expenses which include costs of project
management, detailed engineering of equipment and civil works, erection and
commissioning, consultancy services, and personnel training.
The project implementation cost which comprises cost of implementation is the sum of
project follow up and office running cost and design, erection and commissioning is
estimated to be birr 3,892,200.00.
1.4 Financial and Economic Analysis
The financial analysis of the project (benefits and costs) is computed over seventeen years
assuming 17 months implementation period and 15 years of operation. In addition
depreciation and amortization, customs duty and income tax, repair and maintenance costs,
terminal (salvage) values well as working capital have been worked out based on the existing
laws of the country and standard assumptions. Accordingly, the major findings of the
financial analyses are given below.
The total investment cost of the project is estimated at Birr 153.56 million. From the total
investment cost the highest share (Birr 126.91 million or 82.65%) is accounted by fixed
investment cost followed by pre-operation cost (Birr 17.73 million or 11.55%) and initial
working capital (Birr 8.91 million or 5.81%).
The total annual cost of production and revenue at 100% capacity utilization (year 4) is
estimated at Birr 74.02 million and Birr 121.90 million respectively.
The project will generate a profit throughout its operation life. Annual net profit after tax will
increase from Birr 19.69 million during first year of operation to Birr 45.65 million during
the last year of the project life.
The projected cash flow of the envisaged project shows that the project would generate
positive net cash flows throughout the operation years. Based on a 10% discount rate the
Internal Rate of Return (IRR) and Net Present Value (NPV) are computed to be 30.86% and
Birr 209.98 million respectively, indicating the viability of the project.
The initial investment cost of the project will be fully recovered within five years, which is a
reasonably short period of time. Other measures of profitability net profit as a % of sales
revenue, net profit to equity and net profit to total investment are also attractive.
The efficiency ratios like current assets to current liabilities and net cash flow to sales
calculated from the balance sheet show that the project is highly liquid with sound financial
performance.

70
The breakeven point for sales and capacity utilization is computed at Birr 41.76 million and
45% which are reasonable. Moreover, the sensitivity analysis carried out indicates that the
project could be viable at adverse conditions i.e. either a decrease of 25% in sales price or
increase of 30% in production cost or an increase of 50% in investment cost.
In addition to its financial viability the project has a number of economic and social benefits.
The establishment of the project has a foreign exchange saving effect to the economy.
Moreover, as a profitable venture it will contribute to the increase of Regional and Federal
government revenue through corporate, payroll and other taxes.
The project will create direct employment opportunities for about 98 persons. Furthermore, it
creates a conducive environment for the rapid growth of service and trade sectors around the
project site which in turn create employment opportunity for a substantial number of persons.
Moreover, the project will also create forward linkage with the manufacturing sector.

71
MINISTRY OF INDUSTRY (MoI)
VI. FEASIBILITY STUDY FOR THE ESTABLISHMENT OF LEATHER
ACCESSORIES MANUFACTURING PLANT
72
VI. SUMMARY AND CONCLUSION
1.1 Background
a) Introduction
This Draft Report on Leather Accessories Manufacturing Plant is prepared based on the
agreement signed, June 30, 2014, between Ministry of Industry, hereinafter referred to as “the
Client” and Industrial Project Services (IPS), hereinafter referred to as “the Consultant”, to
conducted feasibility studies for the establishment of:
t Accessories Manufacturing Plant;
Leather Accessories Manufacturing Plant;
Leather Accessories Manufacturing Plant is comprised of six manufacturing lines: Outer sole,
Buckles and Trimmings, Insole Board, Toe Puff & Counter Stiffeners, Mold, and Shoe Last.
The Feasibility study covers Market, Technical and Financial analyses of the envisaged
project. The market study aspect contains product description and application, supply trend;
present demand, factors that affect local demand, demand projection, demand-supply gap,
market share analysis, and market mix assessment, while the technical and financial study
consists of Material Input, Location, Site and Environment, Technology and Engineering,
Organizational Structure and Human Resource, Implementation Plan and Financial and
Economic Study components.
b) Methodology of Market Study
In order to attain the objectives of the study appropriate data collection instrument has been
developed for both primary and secondary data / information. The market study employed
both primary and secondary data. For the collection of secondary and primary data checklists
for different government and private organizations has been prepared.

73
The sources of secondary data are mainly the Ethiopian Revenue and Customs Authority, the
Central Statistics Agency, the National Bank of Ethiopia, Leather Industry Development
Institute, Ministry of Finance and Economic Development, Ministry of Industry, Ethiopian
Investment Agency, and FAO.
The source of primary data includes major end user industries, producers, Leather Industries
Producers Association and others. The primary data collected are mainly qualitative in nature
and followed opinion survey method.
The methodology employed in undertaking the technical study was literature review (online
material and library books, and previously conducted similar studies), visiting existing shoe
factories - Hujean Shoe Factory and Tikur-Abay Shoe Factories. Conducting assessments on
raw materials and inputs availability as their supply, and assessment of project location, site
and environment. Finally, collection of quotations from machinery suppliers for machinery
and equipment cost estimation.
1.2 Analysis of the Business Environment and Incentives for Investors
The major external factors that affect the envisaged project - the political, socio – economic/
socio-cultural and technological development (PEST), and availability of infrastructure is
found smooth.
The macro economic performance over the past ten years has been very positive and the GTP
indicates a very good prospect, with a minimum of 11% GDP growth per annum, for the
future. The extensive capacity building programs carried out, the implementation of a series
of reforms, the existence of stable political and economic environment and a wide market,
availability of abundant labour force at a very competitive cost make Ethiopia an ideal
destination for investment.
In the past 10 - 15 years Ethiopia has greatly improved its social and economic infrastructures
such as education and health facilities; road, air and shipping transport; energy supply;
telecommunications and financial services which are vital for smooth run of any kind of
investment.
There are also attractive investment incentive packages available for the manufacturing
sector, particularly to export oriented and import substituting projects. Among the incentives
provided are exemptions from customs import and export duty, income tax holidays, loss
carried forward and guarantees to investors
Hence, the external factors support the future success and reliability of the envisaged project.
74
1.3 Market Study
a) Product Description and Application
Outer sole is the exterior part of layer of a shoe that is in direct contact with the ground.
Buckle is a device used for fastening two loose ends, with one end attached to it and the other
held by a catch in a secure but adjustable manner in another. Trimmings are devices attached
as decoration to leather products. Trimmings & buckles are used in leather garment, leather
goods, and shoes.
Toe puff is a material used to provide shape to the forepart of the shoe, and to give protection
to the foot of the wearer. Counter stiffener is a material molded to shape of the last back part
or alternatively inserted flat and molded during subsequent processes.
Insole is a layer of material shaped to the bottom of the last and sandwiched between the
outer sole and the sole of the foot inside the shoe. The insole covers the join between the
upper and the sole in most methods of construction.
Mould is a device used to shape materials like PU/ PVC / Rubber/ TPR etc to produce mid
sole or outer sole in respect to shoe production.
Shoe Last is a foot model with dimension and shape similar to anatomical foot.
b) Past Supply Trend
1) Outer Sole
The source of supply for outer sole is both domestic production and import. The domestic
production of outer sole of the country has increased from 1.76 million pairs to about 3
million pairs during the period 2000--2013 although it is characterized by fluctuations in
some years.
Import of outer soles and heels during the period 2000--2013 has exhibited two distinct
trends. Imported quantity has increased consistently from 227 tons in the year 2000 to 1,004
tons in the year 2006. But in 2007 it declined to 646 tons and further it declined to an annual
average of about 100 tons during the period 2011--2013.
The yearly average expenditure for outer sole was Birr 7.58 million for the period 2000--
2004 and has increased to a yearly average of Birr 12.9 million during the period 2005--2009.
However, it declined to a yearly average of Birr 5.2 million and Birr 10.3 million for the
period 2010--2011 and 2012--2013, respectively.
Of the total quantity of outer sole imported to Ethiopia in the last five years, China with an
average share of about 59% was the main supplier and 19.4%, 11.8%, and 2.4% share was
from Italy, Denmark and Turkey respectively.

75
During the period 2006--2013, the yearly average quantity and value of outer soles exported
from Ethiopia was only 1.5 tons and Birr 161.5 thousand. Apparent consumption of outer
sole during the past fourteen years has shown a general increasing trend from 2.1 million
pairs in 2000 to 3.3 million pairs although it is characterized by some fluctuations especially
after 2005. In general, the annual average growth rate of apparent consumption during the
past 14 years was 8.8%.
2) Buckles and Trimmings
The source of supply for buckles and trimmings is entirely imported. Import of buckles and
trimmings has been generally rising from year to year in the past thirteen years. Imported
quantity which was around 71 tons in the year 2001 has reached 362 tons in the year 2013.
The annual average growth rate of import during the past thirteen years was about 17%.
The annual expenditure for buckles and trimmings which was Birr 1.9 million in 2001 has
reached Birr 75.8 million in 2013.
Of the total imported quantity in the past thirteen years the highest share is accounted by
clasps & buckles which was 88.6%, while that of ornamental trimmings and beads &
spangles was 9.88% and 1.46%, respectively.
For the last five years, on the average 75.67% of ornamental trimmings are imported from
china followed by India which accounted for about 10.43%. The remaining 14% is accounted
by countries such as Egypt, Italy and other European and Asian countries.
With regard to beads & spangles and clasps & buckles, almost all imports during the recent
five years have originated from China. On the average the share of China for beads &
spangles and clasps & buckles was 98.55% and 96.4%, respectively.
3) Toe Puff and Counter Stiffeners
The source of supply for toe puff and counter stiffener is entirely imported. Import of toe puff
and counter stiffeners has been consistently rising from year to year in the past fourteen years
i.e. 2000--2013.The imported quantity, which was 12 tons in the year 2000, has reached 78.3
tons in the year 2013. The annual average growth of import during the past fourteen years
was about 16.54%.
The yearly expenditure for importing the products has increased from about Birr 275.7
thousand in 2000 to about Birr 4.5 million in 2013.
In 2010 alone, China’s share from the total quantity of toe puff and counter stiffeners
imported is about 90.35%. Italy appears to be the next major supplier having a share of 9.3%
for the same period.
76
4) Insole Board
The source of supply for insole board is entirely imported. Imported quantity of insole board
has been generally rising in the past fourteen years. The imported quantity of insole board,
which was around 62 tons in the year 2000, has reached more than 460 tons by the year 2013.
Generally, import of insole board during the period 2000--2013 has shown a yearly average
growth rate of 25.44%.
With respect to the expenditure for importing the products it has increased from about Birr
663.9 thousand in the year 2000 to about Birr 14.5 million in years 2013.
China is the main supplier of insole board to the Ethiopian market; where 93.5% of insole
board is imported from China in year 2010 alone.
5) Shoe Mould
So far, the source of supply for shoe mould was entirely imported. Very recently, one factory
which is engaged in the manufacture of foot wears (Huijan Shoe Factory) has started
production of shoe mould in the country and does not have past production data.
Import of moulds by Ethiopia has been generally rising in the past fourteen years. Imported
quantity which was around 134 tons in the year 2000 has reached more than 665 tons by the
year 2013. Generally, import of rubber and plastic moulds with and without injection/
comprehension type during the period 2000--2013 has shown a yearly average growth rate of
29%. The yearly expenditure for importing mould has generally increased from about Birr
16.8 million in the year 2000 to about Birr 140.1 million in 2013.
Of the total quantity of moulds imported during the period 2009--2013, on the average more
than 62% have originated from China. The other major suppliers are Taiwan and India, which
accounted for about 9.9% and 6.8%, respectively.
6) Shoe Last
The total supply (apparent consumption) of shoe last is composed of mainly import and a
smaller share of local production.
Currently, there are four shoe last producers in Ethiopia. The local production of shoe last
was estimated to be 18 ton per annum for the last fourteen years.
Import of shoe lasts been fluctuating from year to year without any visible trend in the past
twelve years. During the past 12 years the annual average imported quantity was 41.24 tons
of which about 90% is accounted by shoe lasts of plastic and the remaining 10% by shoe lasts

77
of wood. However, if only the recent three years (2011--2013) are considered the annual
average level of import is about 72 tons.
In terms of CIF value the annual average expenditure during the recent three years is Birr
4.62 million.
Main supplier of shoe last to the Ethiopian market is China on the average which accounted
for 44.5 % during the recent five years. Other major suppliers of shoe last to the Ethiopian
market are Italy (25.16%), Switzerland (24.37%), and others (6%).
c) Present Effective Demand
The present effective demand for leather accessories (Outer Sole; Buckles and Trimmings;
Toe Puff and Counter Stiffeners; Insole Board; Mould, and Shoe Last) has been estimated
using the following all or some of them depending on the accessory type studied.
Naïve Method
Moving Average Method
Time Trend Extrapolation
End Use Method.
After analyzing the appropriateness of each method, the most plausible method of estimating
the present effective demand for each leather accessory is selected.
Accordingly, the present (2014) effective demand for outer sole was estimated at 7,222,644
pairs.
The present (2014) effective demand for buckles and trimmings is estimated at 331 tones. Of
the total demand estimated, the major share i.e. 89% is allotted for clasps and buckles and
10% and 1% for ornamental trimmings and beads & spangles, respectively.
The present (2014) effective demand for toe puff and counter stiffeners is estimated at 83,416
kilo gram. Out the total demand estimated for toe puff and counter stiffeners, of the total
projected demand 22% is the share of chemical sheets solvent activated / celluloid and the
rest 88 per cent are thermoplastic/heat activated.
The present (2014) effective demand for insole board is estimated at 357.15 tons, out of
which 1.52% is allotted for insole made of plastic materials, 61.21% for paper materials,
4.21% and 33.06% for non-woven and other materials, respectively.
The current (2014) effective demand for rubber and plastic moulds with and without
injection/ comprehension and shoe last is estimated at 635.94 tons and 129 tons, respectively.

78
d) Factors that Influence the Market for Leather Accessories
The demand for leather accessories depends mainly on the performance of its end-user. The
end users of the products under consideration are mainly the footwear, leather goods and
garment which shows increasing trend. On the other hand the performance of the end users of
leather accessories is dependent on a number of inter-related variables. Accordingly, the
variables that are essential in determining the magnitude and trend of demand for the
products include:
- Performance of the national economy;
- Performance of the manufacturing sector in general and end users of the products in
particular i.e. the footwear, leather goods and garment;
- Size and rate of population and urbanization growth.
Therefore, the large population size and the rapidly growing population coupled with
urbanization and the existing favorable conditions for economic development in the country
are expected to induce greater market opportunity for leather and leather products.
Consequently, the demand for leather accessories is expected to grow by the end user
industries.
e) Demand Projection for Leather Accessories
1) Outer Sole
The local demand for outer sole is projected to increase from 7.9 million pairs in 2015 to
about 12.8 pairs in 2020. Furthermore, demand is forecasted to increase to 24.9 million pairs
in 2027.
2) Buckles and Trimmings
The demand for buckles, trimmings and beads will increase from 364 tons in the year 2015 to
586 tons by the year 2020. Demand is forecasted to reach near to one thousand tons by the
year 2025. Of the total projected demand 89% is the share of buckles. Trimmings and beads
will have a share of 10% and 1%, respectively.
3) Toe Puff and Counter Stiffeners
The total demand for toe puff and counter stiffeners will increase from 91,758 kilo gram in
the year 2015 to 148 thousand kilo grams by the year 2020. Demand is forecasted to reach
288 thousand by the year 2027. Of the total projected demand 22% is the share of chemical
sheets solvent activated / celluloid and the rest 78 per cent are thermoplastic/heat activated.

79
4) Insole Board
The total demand for insole board will increase from 392.87 tons in the year 2015 to 632.72
tons by the year 2020. Demand is forecasted to reach 1,233 tons by the year 2027. Of the
total projected demand 61.21% is the share of insole made of paper materials. Insole made of
plastic, non-woven and other materials will have a share of 1.52%, 4.21% and 33.06%,
respectively.
5) Shoe Mould
The local demand for rubber and plastic moulds with and without injection/ comprehension
type is projected to increase from about 700 tons in 2015 to about 1,126 tons in 2020.
Furthermore, demand is forecasted to increase to 2195 tons in 2027.
6) Shoe Last
The local demand for shoe last is projected to increase from about 142 tons in 2015 to about
229 tons in 2020. Furthermore, demand is forecasted to increase to about 445 tons in 2027.
f) Demand-Supply Gap
In order to determine the unsatisfied demand, primarily the capacity of the existing outer sole,
mould, and last producers is determined. Since, the remaining accessories-buckles and
trimmings, toe puff and counter stiffeners, and insole board are entirely imported, the
unsatisfied demand is the projected demand.
1) Outer Sole
By considering the existing local producers of outer sole, the unsatisfied demand for the
future is expected to increase from 3.4 million pairs in 2015 to 4.9 million pairs and 7.2
million pairs in years 2020 and 2027 respectively.
2) Buckles and Trimmings
Buckles and Trimmings are currently imported. Therefore, the projected demand has been
considered as the unsatisfied demand. Accordingly, the unsatisfied demand for buckles and
trimmings will increase from 364 tons in the year 2015 to 586 tons and 1,143 tons in the year
2020 and year 2027 respectively.
3) Toe Puff and Counter Stiffeners
Toe Puff and Counter Stiffeners are entirely imported. Hence, the projected demand has been
considered as the unsatisfied demand. Accordingly, the unsatisfied demand for toe puff and
80
counter stiffeners will increase from 91.76 thousand kilograms in the year 2015 to 147.7
thousand kilo grams and 287.9 thousand kilograms in the year 2020 and year 2027
respectively.
4) Insole Board
Currently insole board is entirely imported. Hence, the unsatisfied demand for insole board
will increase from 392.87 tons in the year 2015 to 632.72 tons by the year 2020. Unsatisfied
demand is forecasted to reach 1,233 tons by the year 2027.
5) Shoe Mould
By considering the production capacity of a new project which becomes operational recently,
the unsatisfied demand for shoe mould is expected to increase from about 696 tons in 2015 to
1,121 tons and 2,190 tons in years 2020 and 2027 respectively.
6) Shoe Last
At present, there are four producers of shoe last in the country. By considering the production
capacity of the existing four local producers, the unsatisfied demand for shoe last is projected
to increase from about 58 tons in 2015 to 145 tons and 361 tons in years 2020 and 2027
respectively.
g) Market Share Analysis
1) Outer Sole
Considering the competition to face from import and lack of ability to produce all types of
outer soles required by end users the market of share of new entrants from the estimated
unsatisfied demand is assumed to be 90%. Accordingly, the market share for the new entrants
will grow from 3 million pairs of soles in 2015 to 6.4 million pairs of outer sole in 2027.
2) Buckles and Trimmings
New entrants are assumed to capture 50% of the projected demand during the first five years
of operation and 75% then after. Accordingly, the market share to be captured for buckles
will increase from 162 tons in the year 2015 to 391 tons and 763 tons by the year 2020 and
2025, respectively. Similarly, the market share for trimmings is forecasted to increase from
18 tons in the year 2015 to 44 tons and 86 tons by the year 2020 and year 2025, respectively.
For beads it is forecasted to increase from 1.8 tons in the year 2015 to 4.4 tons 8.6 tons by the
year 2020 and year 2025, respectively.

81
3) Toe Puff and Counter Stiffeners
New entrants are assumed to capture 50% of the projected demand during the first five years
of operation and 75% then after. Accordingly, the market share to be captured for toe puff
and counter stiffeners will increase from 45,879 tons in the year 2015 to 110,832 tons and
215,981 tons by the year 2020 and 2025, respectively.
4) Insole Board
New entrants are assumed to capture 50% of the projected demand during the first five years
of operation and 75% then after. Therefore, the market share for the new entrants will
increase from 193 ton in 2015 to 467 tons and 911 tons of insole board in the year 2020 and
year 2027, respectively.
5) Shoe Mould
Considering the recent new entrant in mould production, competition from import and lack of
ability to produce some sophisticated designs the market share of new entrants from the
unsatisfied demand is estimated to be 80%. Accordingly the share of new entrants will
increase from 557 tons in the year 2015 to 898 tons and 1,753 tons in the year 2020 and year
2027, respectively.
6) Shoe Last
The market share of the new entrants from the unsatisfied demand for shoe last is assumed to
be 90%. Accordingly, the estimated market share for the new entrants will increase from 52
tons in the year 2015 to 131 ton and 325 tons by the year 2020 and 2027, respectively.
h) Market Mix Assessment
1) Product
It is recommended that the selected leather accessories (outer sole, toe puff and counter
stiffeners, insole board, buckles, mould and last) should possess the standard quality,
reasonable warranties and after sales service, etc.
2) Price
As a new entrant to the market and in view of discouraging challenging future competing
products, an average 10% less the current price when sold at ex-works is recommended for
each product. Accordingly, the recommended factory gate price for each of the leather
accessories are given below.
Outer sole
o TPR Sole Birr 38-41 per pair

82
o Rubber Birr 84 per pair
o PU Birr 35 per pair
o PVC Birr 72 per pair
Toe puff and counter stiffeners (length 1.50 meter X width 1 meter)
o Chemical sheet solvent activated (celluloid) with thickness 2 mm Birr 140.85
o Heat activated (thermoplastic) with thickness 1 mm Birr 177.55.
Insole Board of paper (length 1.50 meter X width 1 meter) with thickness 1.75 mm Birr 96.
Buckles and Ornamental Trimmings
o Eyelets Birr 41 per 1000 pieces
o Hook Metals Birr 0.55 per piece
o Rivets Birr 0.18 per piece
o Ornamental trimmings (1 meter X 1 meter) Birr 70-90
Mould Birr 18,200--27,300 per pair
Last Birr 255-273 per pair
3) Distribution
The proposed distribution mechanism to be adopted for the leather accessories project is the
distribution of its products directly to the end user industries without involving
intermediaries.
4) Promotion
Since most of the end user industries of leather accessories are localized in Addis Ababa area
and their number is few, the proposed promotional mixes for the envisaged project are sales
promotion and personal selling. These promotional mixes are practiced by direct
communication with the end user industries which also help to know the buying habits of
each industry.
5) Conclusion
The findings of the market study indicate that there is a big and progressively growing market
for leather accessories. Currently, demand for most of the products is entirely met through
import. Although there are some enterprises that have started producing moulds such as
Huijan Shoe factory and others engaged in the production of shoe lasts their capacity is very
83
low compared to the current and future demand. Hence, implementation of the projects in
view of the market aspect is highly justified.
1.4 Materials and Inputs for Integrated Leather Accessories Mfg Plant
The raw materials types and their annually required quantities of for each production line of
the leather accessories plant their cost is as described as follows:
or the shoe outsole manufacturing plant is 1,012 ton of
TPR granule, 7 ton of paint, and 50 sets of molds. The total annual cost of these raw materials
is estimated to be Birr 74,215,785.
ine is 850 ton of HDPE
granule, 650,000 sets of hinges, and 15,000 m2 of steel plate. The total annual cost of these
raw materials is estimated to be Birr 29,815,087.50
blocks, and the total annual cost of the raw material is estimated at Birr 4,098,600.00.
teel-alloy coil
and wires and the total annual cost of these raw materials is estimated to be Birr 6,504,300.
Wood Pulp, 30 ton Unbleached cotton pulp, 120 ton Recycled waste paper and 10 ton of
Latex and the total annual cost these raw materials is estimated at Birr 2,514,847.
of Non-woven fabric, 20 ton of hot melt thermo plastic adhesive, 10 ton of polystyrene resins
and 10 ton of Toluene and the total annual cost of these raw materials is estimated to be Birr
3,363,525.00.
The envisaged leather accessories manufacturing plant is intended to be implemented as an
integrated plant. All of the raw material required for the different production lines is imported
items and the total annual cost of the raw materials for the integrated leather accessories
manufacturing plant is Birr 154,991,760.00 which is equivalent to USD 7,380,560.00.
The required auxiliary materials are packaging materials and furnace fuel which can be found
on the local market and the total cost of the auxiliary materials of the integrated leather
accessories plant is Birr 7,313,350.

84
The utilities required by the integrated leather accessories are electric power and compressed
air. The total annual electric power cost of the integrated plant is 4,755,450.00.
1.5 Location, Site and Environment
Selection of location for the envisaged project is carried out at two stages. The first stage
involved identification of potential geographical locations and selection of the appropriate
one based on assessment of critical project requirements. These critical project requirements
are availability and supply materials and inputs (basic raw materials, utilities - electric power,
water, etc), availability of labor (skilled and unskilled), availability of basic infrastructure,
social amenities, labor; and plan of the regional government and development plan.
Accordingly, four potential locations (Adama, Modjo, Dukem, and Addis Ababa) were
identified as candidate project locations. Then these four locations were evaluated and
compared to identify the best location. As a result, Addis Ababa stood first and Dukem
become the second.
The second stage of the project site and location selection involved assessment of potential
sites and selection of the best one from the identified ones. Accordingly, different potential
project sites were assessed within the selected location of Addis Ababa. Then selection of the
project site involved evaluation of the identified potential sites against critical selection
criteria by rating each with established rating scale.
Finally, it is proposed that the Bole Lemi Industrial zone prepared by Addis Ababa city
mainly for the priority sectors was identified as the best project site.
1.6 Technology and Engineering
The total acquisition cost of plant machinery and equipment for all production lines including
auxiliary and utility equipment is estimated
is estimated at Birr 4,400,000and Birr 193,000; respectively.
estimated at Birr 4,400,000 and Birr 131,000; respectively.
nd office furniture and equipment is
estimated at Birr 4,400,000 and Birr 126,000; respectively
is estimated at Birr 6,400,000 and Birr 126,000; respectively

85
nsole board Plant Birr 20,970,000; the total cost of vehicles and office furniture and
equipment is estimated at Birr 6,350,000 and Birr 178,000; respectively
furniture and equipment is estimated at Birr 4,400,000 and Birr 178,000; respectively
The total area of land required for the project 19,260.00 m2. The total built-up area is
7,780.00 m2. The main building and civil works includes production hall, offices, raw
material and finished product stores.
1.7 Organization and Manpower
The organizational structure of the envisaged Leather accessories plant is developed by
considering objectives the plant, the types of its products, and size & complexity of
operations.
The organizational structure of the envisaged plant comprises of 6 line departments and four
support services. The two operation department of production and technique is lead by deputy
manager. The other four support department will be directly accountable by the general
manager. The Mold, Insole board, Toe-puff & Counter Stiffener, Shoe Last, and Buckle and
Trimmings manufacturing lines are organized at division level under the Production
department. The technique department has workshop and utility division and electrical and
mechanical maintenance division under it.
The four support departments: Finance, HR administration and Training, Sales and
Promotion, and Purchase and Supply are directly accountable to the General Manager. The
four services are
QCA service, Planning Service, Information Management System, R&D Services, and Audit
Services.
The total labor cost is estimated to be Birr 26, 348,656. The Plant will create an employment
opportunity for 363 permanent employees.
1.8 Implementation Schedule
It is envisaged that the implementation program of the project will take 18 months. The
implementation schedule for the envisaged Leather accessories plant will cover a large
number of activities starting from the project approval up to and the startup of operation.
The overall implementation cost of the envisaged project is estimated at Birr 20,100,960 out
of which Birr 7,423,047 is required in foreign currency.
86
1.9 Financial Analysis and Economic Analysis
The financial analysis of the project (benefits and costs) is computed over seventeen years
assuming 18 months implementation period and. In addition depreciation and amortization,
customs duty and income tax, repair and maintenance costs, terminal (salvage) values well as
working capital have been worked out based on the existing laws of the country and standard
assumptions. Accordingly, the major findings of the financial analyses are given below.
The total investment cost of the project is estimated at Birr 338.70 million. From the total
investment cost the highest share (Birr 254.34 million or 75.09%) is accounted by fixed
investment cost followed by initial working capital (Birr 42.50 million or 12.55%) and pre
operation cost (Birr 41.84 million or 12.36%).
The total annual cost of production and revenue at 100% capacity utilization (year 3) is
estimated at Birr 243.92 million and Birr 351.13 million respectively.
The project will generate a profit throughout its operation life. Annual net profit after tax
ranges from 53.23 million to Birr 113.36 million.
The projected cash flow of the envisaged project shows that the project would generate
positive net cash flows throughout the operation years. Based on a 10% discount rate the
Internal Rate of Return (IRR) and Net Present Value (NPV) are computed to be 31.60% and
Birr 485.81 million respectively, indicating the viability of the project.
The initial investment cost of the project will be fully recovered within six years, which is a
reasonably short period of time. Other measures of profitability net profit as a % of sales
revenue, net profit to equity and net profit to total investment are also attractive.
The efficiency ratios like current assets to current liabilities and net cash flow to sales
calculated from the balance sheet show that the project is highly liquid with sound financial
performance.
The breakeven point for sales and capacity utilization is computed at Birr 121.76 million and
36% which are reasonable. Moreover, the sensitivity analysis carried out indicates that the
project could be viable at adverse conditions i.e. either a decrease of 28% in sales price or
increase of 32% in production cost or an increase of 40% in investment cost.
In addition to its financial viability the project has a number of economic and social benefits.
The establishment of the project has a foreign exchange saving effect to the economy.
Moreover, as a profitable venture it will contribute to the increase of Regional and Federal
government revenue through corporate, payroll and other taxes.
The project will create direct employment opportunities for about 356 persons. Furthermore,
it creates a conducive environment for the rapid growth of service and trade sectors around

87
the project site, which in turn create employment opportunity for a substantial number of
persons. Moreover, the project will also create forward linkage with the manufacturing
sector.

88
MINISTRY OF INDUSTRY
VII. FEASIBILITY STUDY FOR THE ESTABLISHMENT OF METAL
PACKAGING MANUFACTURING PLANT

89
VII. EXCUTIVE SUMMARY
This Draft Report on Feasibility Study for the Establishment of Metal Packaging
Manufacturing Plant is prepared by the Industrial Projects Service (IPS), the Consultant, as
per the consultancy agreement concluded with the Ministry of Industry (MoI), the Client.
The report consists of market, technical and financial analyses components on the feasibility
study of the envisaged plant. The next section provides synoptic summary of the findings
under each component.
1.1 Analysis of the Business Environment
As per the analysis carried out by different institutions on the political, economic, socio-
cultural and technological developments (PEST), Ethiopia offers a stable political and
economic environment as well as security; exceptional climate; almost complete absence of
routine corruption; continuously improving public service delivery which makes it potentially
an ideal destination for investment.
The macro economic performance in the past seven years has been very positive and the GTP
indicates a very good prospect, with a minimum of 11% GDP growth per annum, for the
future. Although the incentive packages that are currently given seem to be adequate, the
government is planning to give additional incentives for the manufacturing sector,
particularly to export oriented and import substituting projects. Priorities will be given to the
manufacturing sector in support provision in the areas of licensing, land and finance
allocation, training and the like.
The expansion of Universities as well as Technical, Vocational Education and Training
(TVET) in all parts of the country provides good opportunity in the supply of skilled and
semi-skilled technical personnel. Health service provision and development of infrastructures
such as roads, energy and communication are also showing a rapid improvement in the
country. The advancement of science and technology in the world and the spread of same in
the country will favorably influence the smooth operation of the envisaged project.
To encourage investment a number of incentives are granted to investors which include;
exemption of customs duty for importing capital goods and spare parts for investment and
raw materials for production of export goods, income tax holidays and the permission of
losses to carry forward during tax holiday period. Ethiopia also provides different guarantees
with respect to repatriation of capital, profit and against expropriation and nationalization.
Accordingly, it can be concluded that Ethiopia is ideal for investment.

90
1.2 Market Study
1.2.1 Product Description and Application
Packaging is an essential element in the success of industrial products. Not only must it be
durable enough to withstand aggressive chemical formulations and protect products from
outside influences, but industry changes increasingly require packaging to serve as a
marketing vehicle for building brand recognition and loyalty.
Metal packaging has always been a popular choice for industrial products due to its durability
and versatility. Thanks to new technology advancements, metal packaging can maintain these
core benefits while also incorporating value-added features that enhance consumer
convenience and boost visual appeal. These technologies are vital for industrial products to
utilize packaging as a brand-building tool capable of delivering a decisive competitive edge.
The three metals commonly used in packaging are aluminum, steel and tin. The different
types of metal packaging include:
Cans: Cans consist of either two or three separate components (“two-piece cans” and “three-
piece cans”); while three-piece cans are composed of a cylinder, a top and a bottom end, two-
piece cans have the wall and bottom formed out of one piece and a separate top and their
sizes range from very small (a few grams) to catering pack sizes (typically for contents of 2–
10 kg).
This is the first stage of the deformation to make a can and these cans are differentiated by
the method used to form them:
-ironed (DWI)
Drums and Pails: Drums and pails are in essence large three-piece steel cans. They are
supplied empty, with bungs in the “lid” for the customer to fill and they are not subjected to

91
any processing when filled. Drums tend to refer to larger volume containers of typically 100–
220 liters whilst pails normally refer to 5–25 liters containers. There are different grades of
drums depending upon the intended contents and method of transportation
Aerosols: Aerosol cans are mainly used for non-food applications, such as cosmetics, body
care products, insecticides and lubricants. Only a few foodstuffs, such as canned whipping
cream, are packaged in an aerosol. Aerosol cans are either three-piece or two-piece. In
essence, the principles of two- or three-piece can manufacture apply, whilst the ends differ
and are fitted as a unit. All three-piece aerosols are made from steel.
The main difference between aerosol and can manufacturing is with the two-piece aerosol,
known as a mono bloc. The aerosol container is manufactured of aluminum by impact
extrusion and the diameter of the open end is reduced (swaging) to receive the spray nozzle
and an internal lacquer is spray applied.
Tubes: Metallic tubes are extruded from a slug of metal (mostly aluminum). Not all tubes are
internally lacquered, particularly toothpaste tubes. Many tubes are no longer based on metal.
Only those tubes with contents necessitating minimal interaction with oxygen are metal
based.
Trays and Foils: Rigid and semi-rigid aluminum trays for food application are based on
rolled aluminum (with different alloys) of a thickness in the range 70–300 μm. In some cases,
containers with polyolefin laminate structures together with polyurethane adhesives are used
for the food contact side of the tray to provide retort resistance.
1.2.2 Past Supply Trend
The local demand for metal packing materials except for crown cork and non food grade cans
and drums is met through import. Accordingly, the major findings of the trend in past supply
of metal packing materials are summarized below.
a) Crown Cork
Local Production
Local production of crown cork during the period 2000-2013 exhibits a growth trend,
increasing from 3.70 million gross in 2000 to 13.39 million gross in 2013, registering an
average annual growth rate of 15.44%.

92
Import
During the period 2000--2013, import of crown cork exhibits a substantial growth. In the year
2000 import was only 232 tons and Birr 4.5 million in terms of volume and value,
respectively. By 2013 import has increased to 3,093 tons and Birr 150.92 million in terms of
volume and value, respectively. During the period under consideration, import of crown cork
has registered an average annual growth rate of 23.39% and 31.38% in terms of volume and
value, respectively.
Apparent Consumption
During the period under consideration (2000--2013) total supply or apparent consumption of
crown cork has increased from 1,490 tons to 7,646 tons registering an average annual growth
rate of 15.28%.
b) Metal Stoppers, Caps and Lids
The demand for metal stoppers, caps and lids is entirely met through import. Import or total
supply of metal stoppers, caps and lids during the past fourteen years has shown a general
increasing trend although it is characterized by some fluctuations. The yearly average
imported quantity, which was about 41 tons during the period 2000--2005, has increased to a
yearly average of 78 tons during the period 2006--2008. Similarly, yearly average imported
quantity increased to 110 tons and 155 tons during the period 2009--2011 and 2012--2013,
respectively.
c) Metal Cans and Drums
The local demand for different types of metal cans and drums is met mainly through import
since local production is extremely low. Import of metal cans and drums exhibits a
substantial growth, increasing from 359 tons and Birr 5.06 million in 2000, in terms of
volume and value, respectively to 1,959 tons and Birr 144.64 million in 2013 in terms of
volume and value respectively, registering an average annual growth rate of 14% in terms of
volume and 33% in terms of value.
d) Aluminum Foil
During the period 2000--2013 import of aluminum foil has increased from 113 tons to 802
tons registering an average annual growth rate of 21.97%.
e) Metal Containers for Compressed or Liquefied Gas
Import of metal containers for compressed or liquefied gas during the past fourteen years has
shown a general increasing trend although it is characterized by fluctuations. The yearly

93
average imported quantity which was about 234 tons during the period 2000--2005 has
increased to a yearly average of 378 tons during the period 2006--2009. Similarly yearly
average imported quantity increased to 686 tons during the period 2010--2013
f) Collapsible Tubular Metal Container
Import of collapsible tubular metal containers is characterized by a general growth trend,
though with fluctuations from year to year. For example the average annual import of
collapsible tubular metal containers during the period 2000--2014 was 4.04 tons. However,
during the next four years (2005--2008) the annual average import has increased to 9.41 tons.
Moreover, during the recent five years (2009--2013) the average annual import has further
increased to 14.41 tons.
1.2.3 Present Effective Local Demand
In order to estimate the current effective local demand for metal packing materials in
Ethiopia, the following methods were applied:
- parameter double exponential smoothing; and
extrapolation
Based on the results of test statistics the time trend extrapolation method is found to be the
most appropriate for all the products under consideration. Accordingly, the estimated present
effective demand for each product is given below.
18 ton
1.2.4 Trend in Factors that Affect the Local Demand for the Products under
Consideration
The variables that are essential in determining the magnitude and trend of demand for the
product under consideration are:

94
investment;
chemical manufacturing sub sectors; and
Accordingly, a thorough assessment of current status and future prospect of these factors
indicates that there is a progressively growing local demand for metal packing materials.
1.2.5 Demand Projection
The local demand for crown cork is projected to increase from 9,911 tons in 2015 to 23,566
tons and 51.030 tons by the years 2020 and 2025 respectively. Moreover, by year 2030 the
demand is projected to reach 106,270 tons.
The local demand for stoppers, caps and lids is projected to increase from 220 tons in 2015 to
512 tons, 1,098 tons and 2,278 tons by the years 2020, 2025 and 2030 respectively.
Likewise, the demand for cans and drums is projected to increase from 2,327 tons in 2015 to
5,474 tons, 11,806 tons and 24,541 tons by the years 2020, 2025 and 2030, respectively.
The local demand for foil is projected to increase from 774 tons in 2015 to 2,269 tons and
4,874 tons by the years 2020 and 2025 respectively. Moreover, by year 2030 the demand is
projected to reach 10,112 tons.
Similarly, the local demand for containers for compressed or liquefied gas is projected to
increase from 1,009 tons in 2015 to 2,271 tons, 4,810 tons and 9,915 tons by the years 2020,
2025 and 2030, respectively.
On the other hand the local demand for collapsible tubular containers is projected to increase
from 25 tons in 2015 to 59 tons and 126 tons by the years 2020 and 2025 respectively.
Moreover, by year 2030 the demand is projected to reach 262 tons
1.2.6 Market Share
The market share of the envisaged project for crown cork is projected to increase from 1,752
tons in 2015 to 13,359 tons and 36,703 tons by the years 2020 and 2025 respectively.
Moreover, by year 2030 the total demand is projected to reach 83,657 tons. The market share
of the envisaged project for stoppers, caps and lids is projected to increase from 187 tons in
2015 to 235 tons, 381 tons and 606 tons by the years 2020, 2025 and 2030 respectively.
Likewise, the market share of the envisaged project for cans and drums is projected to
increase from 1,128 tons in 2015 to 2,461 tons, 4,000 tons and 6,385 tons by the years 2020,
2025 and 2030, respectively.
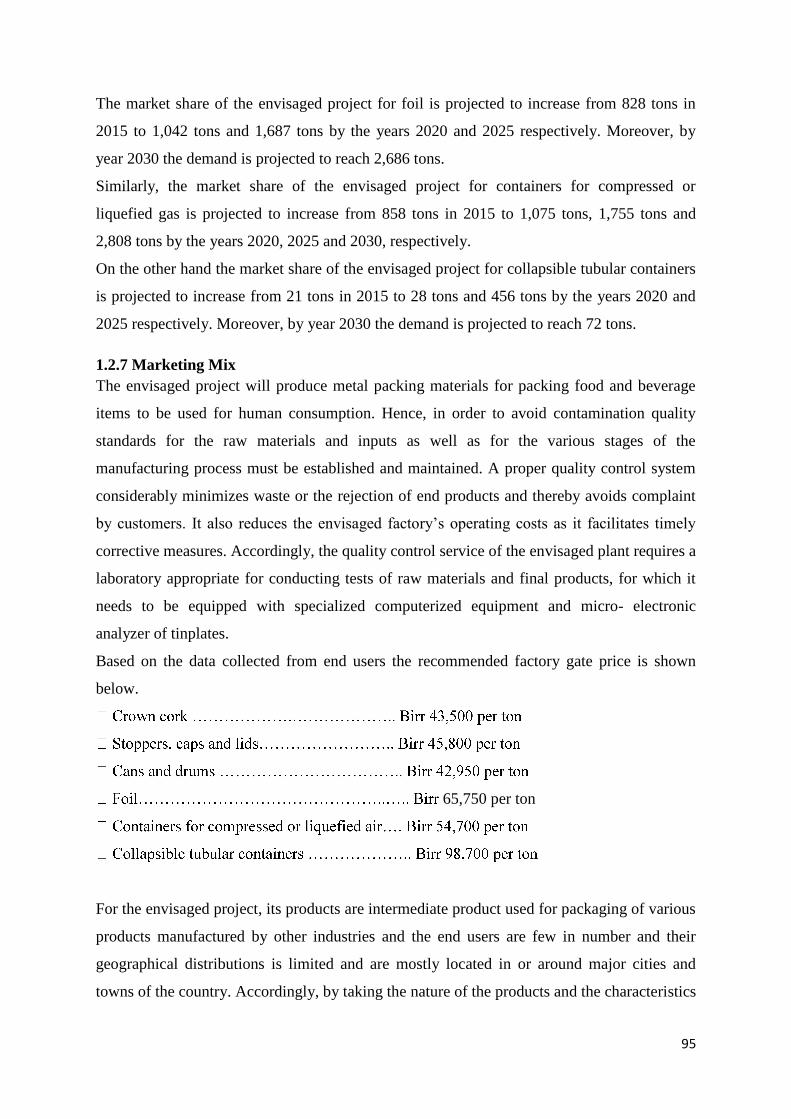
95
The market share of the envisaged project for foil is projected to increase from 828 tons in
2015 to 1,042 tons and 1,687 tons by the years 2020 and 2025 respectively. Moreover, by
year 2030 the demand is projected to reach 2,686 tons.
Similarly, the market share of the envisaged project for containers for compressed or
liquefied gas is projected to increase from 858 tons in 2015 to 1,075 tons, 1,755 tons and
2,808 tons by the years 2020, 2025 and 2030, respectively.
On the other hand the market share of the envisaged project for collapsible tubular containers
is projected to increase from 21 tons in 2015 to 28 tons and 456 tons by the years 2020 and
2025 respectively. Moreover, by year 2030 the demand is projected to reach 72 tons.
1.2.7 Marketing Mix
The envisaged project will produce metal packing materials for packing food and beverage
items to be used for human consumption. Hence, in order to avoid contamination quality
standards for the raw materials and inputs as well as for the various stages of the
manufacturing process must be established and maintained. A proper quality control system
considerably minimizes waste or the rejection of end products and thereby avoids complaint
by customers. It also reduces the envisaged factory’s operating costs as it facilitates timely
corrective measures. Accordingly, the quality control service of the envisaged plant requires a
laboratory appropriate for conducting tests of raw materials and final products, for which it
needs to be equipped with specialized computerized equipment and micro- electronic
analyzer of tinplates.
Based on the data collected from end users the recommended factory gate price is shown
below.
65,750 per ton
For the envisaged project, its products are intermediate product used for packaging of various
products manufactured by other industries and the end users are few in number and their
geographical distributions is limited and are mostly located in or around major cities and
towns of the country. Accordingly, by taking the nature of the products and the characteristics

96
of the end users direct distribution to end users is selected as the most appropriate distribution
channel.
The envisaged factory is recommended to aggressively advertise its product by distributing
calendars, pamphlets as well as by participating in exhibitions and bazaars. Moreover, in a
competitive market, trade promotion should be made to persuade or to make a product
attractive for end users. Such trade promotional tools include; credit and discount with the
volume of products sold etc. The envisaged factory is recommended to offer discounts with
the volume of product bought and credit for one to two weeks.
1.2.8 Product Mix
The technical study has considered crown cork, screw cap from stoppers, cap and lids
category, different size three piece cans, DRD two piece cans, and aluminum beverage cans
from cans and drums category to be the proposed product mixes of the envisaged plant.
Aluminum foil is produced by two basic processes namely:
minum slabs, ingots or thick plates
into a narrow gauge aluminum web stock using heavy rolling mills
-strip casting (similar to an extrusion process) which takes
place immediately after the aluminum has left the furnace.
The most economical means of manufacturing reroll stock, however, is via continuous
casting. A typical continuous-casting production line runs directly from the furnace to a
winding reel. The system continuously feeds, casts, chills and coils the reroll stock. Since it is
heated during production, continuous-cast reroll.
However for viable and economical scale of the conventional aluminum foil making
technology operation the quantity of the projected demand is very low hence aluminum foil is
not considered to be part of the envisaged metal packaging plant. However it is considered in
combination with other plastic materials in flexible packaging technology study proposal
Aluminum for, air Containers for compressed or liquefied, Collapsible tubular containers are
not included as product for envisaged metal packaging industry due to the following
technical reasons. Focusing on the production of the aluminum tube, the basic material is a
round piece of aluminum, with the size of a coin. In most cases, the production of tubes is
handled in one giant machine, starting with giving it the characteristically shape and ending
with the printing process. Mostly the aerosol cans are used in cosmetic industry which is now
relatively is infant in Ethiopia. Based on the development of the cosmetic industry it will be

97
possible to produce aerosol cans using two pieces can line with minimal additional
investment
Therefore it is proposed that from the metallic closures crown cap and screw cap and also
from the metallic containers three piece can, two pieces can and aluminum beverage can to be
the product mixes of the envisaged metal packaging plant.
1.2.9 Plant Capacity
Although the market demand of the envisaged products mixes serves as the basic information
for estimation of plant capacity but other factors like working capital and raw material supply
and availability constraints, economies of scale of production technology, availability
auxiliary materials and inputs, management capacity, machine utilization rate, number
working hours or days per year and supply of utility are also taken in to consideration
Considering projected demand and supply gab analysis in the market study, optimum
economic scale of operational technology and working shifts within 300 days per year the
capacity of the envisaged plant for the proposed product mixes is estimated and proposed to
be:
on
1.2.10 Production Program
Production program is formulated in the context of the projected demand share to be captured
by the selected plant capacity and it will serves as a basis for projecting and quantifying the
direct and indirect raw material, inputs, supplies and consumables of the project annual
operation.
With those points consideration the factory will start operation initially by hiring skilled labor
prior to installation and commissioning and organizing a system that will enable the skilled
labors to get experience in basic technical operation during commissioning through
technology and knowhow transfer program delivered by the technology supplier.
The envisaged plant will operate at different average capacity utilization rate from the first
year namely from 72 % , 83% in the second year , 97 in the third year and followed by rich
98
experience of technical, financial, marketing and sales factors of the environment, the
envisaged plant will operate at full capacity utilization 100 % then after.
1.3 Technical Study
1.3.1 Raw Materials and Inputs
The raw materials and inputs required for the mettle packaging manufacturing plant mainly
for the production of metallic closures and metallic containers can be preliminarily
categorized as direct and indirect raw materials, auxiliary materials and inputs and utilities
The direct raw material of the envisaged metal packaging plant are categorized based on the
product mix proposed to be produced namely crown cap, screw cap, two & three piece can
and aluminum beverage can.
Accordingly direct raw material such as ETPS and TFS sheets are used as major direct raw
material for crown cap,2 piece food and beverage can and 3 piece food and beverage can
Aluminum sheet is used as major direct raw material for Screw cap and Aluminum beverage
can.PVC free material (Granular), PVC material and dry blended thermo plastic material is
used as liner for Crown cap and Plastic liner for screw cap
And for the printing operation of envisaged plant the following, coating coloring and
decorating materials are required namely Aluminum size, white base coating, Printing inks
different color, varnish ,lacquers gold varnish, thinner
More over auxiliary raw materials are also required for the operation of the envisaged plant
namely copper wire, printing plate, and food grade wax
In addition to direct raw material some auxiliary inputs and factory supplies are required
which are to be consumed and used during intermediate operation of the production process.
These raw materials required by the envisaged plant are packaging materials, oil and grease
maintenance consumables.
Utilities are another important category of inputs required for the envisaged production
process which mainly includes electric power, compressed air, LPG, water, and gas oil.
The major raw materials of the envisaged plant such as tin free steel sheet (TFS), electrolytic
tin plated steel (ETPS), aluminum sheets and PVC/ PVC free dry blended granules, can end
lining material and auxiliary raw materials such as coloring & decorating raw materials,
copper wire, printing plate, food grade wax are all imported from foreign market directly
from the producers or from secondary sources (suppliers) depending on the optimum cost and
quality requirements of the project.
99
These direct raw materials for the envisaged plant such as steel sheets, aluminum sheets, PVC
/PVC free plastic materials are products of steel rolling and petroleum refinery processes
respectively and can be supplied from well-known producing countries in the metal and
plastic manufacturing sector such as Turkey, China, India, Italy, South Korea, Germany,
Japan, Saudi Arabia etc.
The tin free steel sheet is supplied in rectangular standard sheet size of 1037mmx890
mmx0.23mm for 27 punches or 0.23mmX1016mmX712mm for 15 punches to be slitter to
0.23mmX508mmX712mm.
However, the raw material of metallic containers will be ordered based on the calculated
development area considering all components of the can and scrape allowance. However the
raw, material for the aluminum beverage is supplied in coil in different width of the can
which is related to the height of the can.
And 1200 pieces of steel sheets of either type will be packed together covered by metal cap
and striped by metal band in one pile of sheets. Similarly the PVC free dry blend granules are
supplied in 25 kg plastic bags and 35 bags weighting total of 875 kg per pallet.
Similarly Gas oil and LPG will be supplied from the multinational supplier companies
operating local on the petroleum products.
Accordingly the annual cost of direct raw materials for the envisaged plant at full capacity
operation is estimated at about Birr 745,609,830.00 out of which 87 % will be required in
foreign
The annual cost of auxiliary materials, inputs and factory supplies at full capacity operation is
estimated at about Birr 11,987,750.00 out of which only 2 % will be required in foreign
currency.
The annual cost of utilities at full capacity operation is estimated at about Birr 15,840,100 in
local currency.
1.3.2 Location, Site and Environment
Location: In process of the project location selection, the Consultant has adopted two stage
selection processes for the envisaged plant. The first stage is the identification of potential
geographical locations based on the assessment of critical project requirements. The second
stage involved selection of the best location from the potential locations identified using
different selection criteria and as well as established rating scale.
In process of the project location selection, the Consultant has adopted two stage selection
processes for the envisaged plant. The first stage is the identification of potential

100
geographical locations based on the assessment of critical project requirements. The second
stage involved selection of the best location from the potential locations identified using
different selection criteria and as well as established rating scale.
More over the Oromia Regional Government has identified cities/town for industrial zones
development based on the resource potential, market potential for industrial products,
availability of basic infrastructure, etc. The towns identified by the regional government
industry clustering program for industrial zone development are Adama, Dukem, Gelan,
Bushoftu, Lagatafo, Sebeta, Assela, Jimma, Nekemte, Sash mane, and Sululta.
Out of these cities and towns Adama, Gelan, and Dukem have been selected as a candidate
for envisaged metal packaging manufacturing plant considering Adama clustered as a
packaging material manufacturing city of the regional state, Gelan and Dukem as metal and
steel industrial zone.
Based on the evaluation of the three proposed location of the envisaged plant Gelan town is
found to be the best location for the envisaged metal packaging manufacturing plant followed
by Dukem and Adama respectively.
Even though there is minimal difference in the evaluation result of the candidate locations for
the envisaged plant, but due to availability of dry port in Gelan and its shortest distance from
Addis Ababa where the beverage and food industries are concentrated will influence to give
more weight for Gelan as a best location for the envisaged metal packaging plant.
Site: Site is a plot of land within the selected location sufficient and suitable for installation
and operation of the plant. In our case, Gelan which is located 25 Km away from Addis
Ababa is selected as the location of the project. The characteristics of the plant site strongly
influence the technical and economic feasibility of the project and the site itself has to be
selected with up most care using certain site selection criteria.
Accordingly the site of the envisaged project will be in one of the industrial zone on the
proposed location reserved for industrial zone considering the following major points:
Environmental Impact: There are two major categories of metal packaging used in food and
beverage industries, the so called ‘cans’ and ‘closures’.

101
The production methods for both types of metal packaging have insignificant environmental
burdens especially during mechanical production process but significant pollution during
decorating and coating process. Both product categories are similar in their overall process,
decorating (printing and coating), punching and forming are the major operation in the
production process.
The majority of HAP emissions from metal can surface coating facilities are from the coating
application and curing processes. Other potential sources of HAP emissions are coating
equipment cleaning operations, coating mixing and thinning operations, storage of coatings
and solvents, and can washing operations.
The major source of wastewater from can manufacturing is washing operations at draw-and-
iron can manufacturing facilities. If hydrofluoric acid is used in can washing, these streams
may contain very low concentrations of hydrofluoric acid; however they are not expected to
be large sources of emissions.
The solid wastes generated from the metal packaging production unit are from cleaning of
industry premises, gardens and packing materials as well as some scraps. These kinds of
wastes are classified in to general waste category and they can be collected in a central
collection or storage tank inside the premises of the company.
Generally the metal packaging manufacturing plant is a typical medium level processing
industry that discharges insignificant in solid significant waste in liquid and gaseous forms.
In-built pollution prevention and appropriate waste management systems shall be
incorporated in the equipments of the plant. Investments on environment as well as
environmental management system are recommended with the necessary operating and
overhead costs to manage and comply with both national and international standards.
1.3.3 Technology and Engineering
The technology for both metallic closures and metallic containers is reviewed accordingly,
Metallic Closures
Crown cap: From the two types of crown cork/caps it is the pry off type of crown cork/cap
that will be manufactured in the envisaged plant for the supply of local brewery, soft drink
and cosmetics industry.
The available technologies for a crown cap manufacturing mainly varies on the type/form of
lining / sealing material used and on the process of making the liner on the cork/cap surface
namely as dry blended PVC free granules injection technology and liquid PVC /PVC free
102
compound cold punching technology . In dry blend injection technology, the lining is carried
out by injecting a batch of warmed compound PVC or PVC free granulates into crown cork
inner surface followed by punching/ embossing under heat. The granulate material is thermo
plastically extruded; the compound pellet is punched at lower temperature in order to solidify
the compound.
The liquid PVC blended compound used in this technology has a very limited shelf life and
losses substantial portion of the service life during transportation and transit where the lead
time for imports could extend up to six months
And preparation of the liquid compound in integral with the crown forming needs
compounding machine which is an additional investment and this operation releases volatile
organic compounds (VOC) which can affect the environment significantly.
More over the technology will not offer high productivity and now days the appropriated
technology dry blending technology has been developed where the lining plastic material is
supplied in the form of PVC or non PVC granules with prolonged shelf life than that of the
liquid compound.
Screw Cap: Similarly screw Cap forming is deep drawing operation and in drawing
operation, metal flows from one place to another to give the required shape. When a metal
blank is drawn into a die, a change in its shape is brought about by forcing the metal to flow
into a space parallel to the die face with the result that its thickness and surface area remain
about the same as the blank.
There are two types of screw cap namely roll-on pilfer proof caps and composite closure and
a composite closure comprises the aluminum body of a roll-on closure with a plastic molded
insert which is pressed in to give a tight fit between the two components. The low density
polyethylene plastic insert has internal threads molded into the side walls and is designed to
accept a standard wad liner.
A composite closure provides two additional features to the standard ROPP closure and the
thread of the closure is internal and provided by the insert, so that the external side wall of the
closure has no threads in evidence after it has been sealed onto the bottle. This closure is used
to improve the external appearance of the filled package.
As the internal thread of the closure is made from molded plastic, it is more suitable for use
with products which have high sugar content, such as liqueurs. When an all aluminum closure
is used with these products, there is a tendency for the sugar, which remains on the thread
after the bottle has been used for the first time, to form a sticky deposit between the

103
aluminum and glass threads which makes the bottle difficult to re-open where as when one of
the thread components is made of plastic, this problem does not occur.
Metallic Containers
Metal cans are mostly constructed by one of the following two basic methods and these two
basic systems are
Three-piece can – comprising a cylindrical body rolled from flat rectangular sheet with the
side seams overlapped and joined using electric resistance welding and two ends
mechanically joined to produce a closed container.
Two-piece can – comprising a seamless cylindrical can body with one integral end (base)
shaped from a flat disc and the other end mechanically joined to produce a closed container.
Based on the selected technology a complete engineering facility that is required for both
metallic closures and metallic containers manufacturing is proposed .Accordingly The
investment costs of plant machinery and equipments is estimated to be Birr 173,043,260.00
out of which 87 % required in foreign currency, and the investment costs of plant utility
equipments, tools and devices is estimated to be Birr 31,468,790.00 out of which 80% is
required in foreign currency In addition the investment cost of transportation facilities for
material handling and public transport service is estimated to be Birr 14,400,000.00 is
required in local currency. Similarly investment cost of plant office furniture and equipments
is Birr 1,559,000.00 in local currency.
More over the project under study is planned requires land for factory block including space
for raw material storage, space for printing process, space for finished goods storage, space
for technical staffs office, space for workshops & others and for administrative office block,
for utilities .
Based on this the total area of the envisaged metal packaging plant is 22,400 m2 (2.24
hectare) with a length of 160 m and of 140 m width. Of the envisaged total area, the building
area including the main production area , technical staffs accommodation area, raw materials
storage area, intermediate storage area & finished items storage area all covers about 7581.46
m2 or 33.84%.
Power house, utility house and guard house cover about 241 m2 or 1.07%. Roads, parking
areas for (staff vehicles & trucks) and, walk ways account for 6689.00 m2 or 29.86 %, open
space accounts for 1752.22 m2 or 7.82%. The greenery accounts 6136.32 m2 or 27.39 %.
Accordingly, assuming a land lease cost of Birr 11birr per m2 the total land lease cost is
estimated at Birr 9,856,000.00 of which 10 % of the total or Birr 98,560.00 will be paid in
advance and the remaining balance will be paid in equal installments within 40 years.
104
The cost of the construction works for the envisaged plant was calculated on the basis of the
above proposed civil engineering preliminary design assumptions. The cost is calculated
assuming that a square meter of a covered area buildings construction of blocks with local
material like hollow concrete block and concrete work on the current average market.
Accordingly, the total estimated cost of building, civil work and infrastructures is estimated
to be Birr-52,441,240.00 .
1.3.4 Organization Structure and Human Resource
The envisaged plant operations and activities will be assigned to organizational units
represented by managerial staff, supervisors and workforce to attain the objectives of the
factory. The activities include planning, directing, coordinating and controlling of the factory
operations at the required level of quality and specified time.
The organization structure will be staffed with eligible personnel with the corresponding
authority and responsibility for the achievement of the goals and objectives of the firm.
The highest management body of the factory, the Board of Directors, is responsible for
handling policy issues, approving strategic plans, and follow-up the activities of the General
Manager.
There are four line departments and four services under the general manager. The line
departments are: production and technique departments, commercial department,
administration department and finance department.
The manpower planning is conducted considering job complexity, number and arrangement
of machinery, volume of work to be covered by each employee depending on the type of
work and working environment it involves, span of control, and the size and flow of work for
the envisaged plant.
The determination of the number of workers required for handling a certain volume of work
in each functions of the plant is also considered. The summary and the detail of manning plan
of the envisaged plant is indicated below based on the proposed organization structure.
Accordingly the total personnel requirement of the plant is estimated to be 223 skilled, semi-
skilled and unskilled. The project will have employees with an initial total annual salary of
Birr 9,061,840.00 when it commences operation.
The envisaged metal packaging plant is recommended to be equipped with the machinery and
equipment as indicated in the study and in order to meet the objective of making the plant
highly productive and produce quality product that meets the requirement of the market there
should be a continues raining to enhance the skill and knowledge of the employees

105
Accordingly the type of training trainings with their estimated duration and training cost is
estimated to be birr 662,500.00
More over Legal recruitment of employee demands coverage of some employees benefits
such as pension contribution, medical allowance, and employee insurance that are protected
by the local labor law. The company is required to cover those packages to employees and
the basic employee benefits are considered in this envisaged project with their related annual
cost is estimated to be Birr 3,383,000.00
1.3.5 Project Implementation
The project implementation schedule covers the activities starting from the project evaluation
and approval up to and including the trial-run and commissioning. It is envisaged that the
complete implementation program requires a total of 19 months starting from the project
approval.
Project implementation costs are pre-operation expenses which include costs of project
management, detailed engineering of equipment and civil works, erection and
commissioning, consultancy services, and personnel training.
The project implementation cost which comprises cost of implementation is the sum of
project follow up and office running cost and design, erection and commissioning is
estimated to be birr 6,955,800.00
1.4 Financial and Economic Analysis
The financial analysis of the project (benefits and costs) is computed over seventeen years
assuming 22 months implementation period and 15 years of operation. In addition
depreciation and amortization, customs duty and income tax, repair and maintenance costs,
terminal (salvage) values well as working capital have been worked out based on the existing
laws of the country and standard assumptions. Accordingly, the major findings of the
financial analyses are given below.
The total investment cost of the project is estimated at Birr 459.98 million. From the total
investment cost the highest share (Birr 272.91 million or 59.33%) is accounted by fixed
investment cost followed by initial working capital (Birr 159.50 million or 34.68%) and pre
operation cost (Birr 27.56 million or 5.99%).
The total annual cost of production and revenue at 100% capacity utilization (year 4) is
estimated at Birr 832.31 million and Birr 909.58 million respectively.

106
The project will generate a profit throughout its operation life. Annual net profit after tax will
increase from 29.72 million during first year of operation to Birr 81.68 million during the last
year of the project life.
The projected cash flow of the envisaged project shows that the project would generate
positive net cash flows throughout the operation years. Based on a 10% discount rate the
Internal Rate of Return (IRR) and Net Present Value (NPV) are computed to be 19.47% and
Birr 259.63 million respectively, indicating the viability of the project.
The initial investment cost of the project will be fully recovered within six years, which is a
reasonably short period of time. Other measures of profitability net profit as a % of sales
revenue, net profit to equity and net profit to total investment are also attractive.
The efficiency ratios like current assets to current liabilities and net cash flow to sales
calculated from the balance sheet show that the project is highly liquid with sound financial
performance. The breakeven point for sales and capacity utilization is computed at Birr
437.68 million and 40% which are reasonable. Moreover, the sensitivity analysis carried out
indicates that the project could be viable at adverse conditions i.e. either a decrease of 12% in
sales price or increase of 15% in production cost or an increase of 40% in investment cost.
In addition to its financial viability the project has a number of economic and social benefits.
The establishment of the project has a foreign exchange saving effect to the economy.
Moreover, as a profitable venture it will contribute to the increase of Regional and Federal
Government revenue through corporate, payroll and other taxes.
The project will create direct employment opportunities for about 223 persons. Furthermore,
it creates a conducive environment for the rapid growth of service and trade sectors around
the project site which in turn create employment opportunity for a substantial number of
persons. Moreover, the project will also create forward linkage with the manufacturing
sector.

107
MINISTRY OF INDUSTRY
VIII. FEASIBILITY STUDY FOR THE ESTABLISHMENT OF PAPER
PACKAGING MANUFACTURING PLANT

108
VIII. EXCUTIVE SUMMARY
This Draft Report on Feasibility Study for the Establishment Paper Packaging Manufacturing
Plant is prepared by the Industrial Projects Service (IPS), the Consultant, as per the
consultancy agreement concluded with the Ministry of Industry (MoI), the Client.
The report consists of market, technical and financial analyses components on the feasibility
study of the envisaged plant. The next section provides synoptic summary of the findings
under each component.
1.1 Analysis of the Business Environment
As per the analysis carried out by different institutions on the political, economic, socio-
cultural and technological developments (PEST), Ethiopia offers a stable political and
economic environment as well as security; exceptional climate; almost complete absence of
routine corruption; continuously improving public service delivery which makes it potentially
an ideal destination for investment.
The macro economic performance in the past seven years has been very positive and the GTP
indicates a very good prospect, with a minimum of 11% GDP growth per annum, for the
future. Although the incentive packages that are currently given seem to be adequate, the
government is planning to give additional incentives for the manufacturing sector,
particularly to export oriented and import substituting projects. Priorities will be given to the
manufacturing sector in support provision in the areas of licensing, land and finance
allocation, training and the like.
The expansion of Universities as well as Technical, Vocational Education and Training
(TVET) in all parts of the country provides good opportunity in the supply of skilled and
semi-skilled technical personnel. Health service provision and development of infrastructures
such as roads, energy and communication are also showing a rapid improvement in the
country. The advancement of science and technology in the world and the spread of same in
the country will favorably influence the smooth operation of the envisaged project.
To encourage investment a number of incentives are granted to investors which include;
exemption of customs duty for importing capital goods and spare parts for investment and
raw materials for production of export goods, income tax holidays and the permission of
losses to carry forward during tax holiday period. Ethiopia also provides different guarantees
with respect to repatriation of capital, profit and against expropriation and nationalization.
Accordingly, it can be concluded that Ethiopia is ideal for investment.

109
1.2 Market Study
1.2.1 Product Description and Application
Packaging is the industrial and marketing technique for containing, protecting, identifying
and facilitating the sale and distribution of agricultural, industrial and consumer products.
Virtually all manufactured and processed goods require packaging during some phase of their
production and distribution. The most popular paper products used for packaging purpose
today are corrugated paper box, paperboard and paper sack and bag.
Corrugated Paper Box or Carton: Corrugating is defined as the imparting of wave-like
shape to a paper. Kraft paper or fluting medium paper is passed through heated corrugated
rolls to obtain continuous rolling, wave-like shape. These are called flutes. Observed
vertically, they form a row of columns, a basic structural form capable of supporting great
weight.
Fluted paper, when stuck to another flat sheet of paper gets converted into 2-ply corrugated
paper box. 3-ply corrugated paper box has one fluted paper and two flat papers. Similarly, 5-
ply, 7-ply and 9-ply corrugated boards are manufactured by converting multiples of flat
papers and fluting media papers.
Major industries which use corrugated packaging are: food; textile, pharmaceutical;
electrical; engineering; consumer durables; soaps and cosmetics; cigarettes; glass etc. There
is perhaps no product that cannot be effectively packed in corrugated box. From small, fragile
and delicate products like crockery and large products like washing machines, refrigerators...
to perishables like fruits and vegetables, almost all products can be effectively and
economically packed in a corrugated box.
Paperboard: Paperboard is the general name given to a variety of different types of
materials that are used to make boxes and cartons. They can be used as shipping (outer)
containers or as consumer packs. Paperboards are produced in the same way as paper but it is
made thicker and often in multiple layers, to protect products from mechanical damage
(crushing, puncturing, and vibration).
There is a large range of paperboard types for different applications as consumer packs or
shipping containers. Cartons or boxes are printed (if necessary), cut out to the appropriate
size and shape and creased. The flat carton (or 'blank') may then be glued and assembled by
the board manufacturer or alternatively delivered to end users for assembly on site.

110
Paper Sack and Bag: A paper bag or paper sack is a preformed container made of paper,
usually with an opening at one end. It can be one layer of paper or multiple layers of paper
and other flexible materials. Paper bags are used for packaging and/or carrying items.
Paper shopping bags, brown paper bags, grocery bags, paper bread bags and other light duty
bags have a single layer of paper. A variety of constructions and designs are available. Many
are printed with the names of stores and brands. Paper bags are not waterproof. Types of
paper bag are: laminated, twisted, flat tap. The laminated bag, whilst not totally waterproof,
has a laminate that protects contents to some degree.
Multiwall (or multi-wall) paper sacks or shipping sacks are often used as shipping containers
for materials such as fertilizer, animal feed, sand, dry chemicals, flour and cement. Many
have several layers of sack papers, printed external layer and inner plies. Some paper sacks
have a polyethylene foil or polyethylene coated paper layer in between as a water-repellant
barrier.
1.2.2 Past Supply - Demand Trend
The local demand for corrugated paper box is met through both local production and import,
while the demand paper board and paper sacks & bags is met through only import.
Accordingly, the major findings of the trend in past supply of paper packing materials are
summarized below.
1) Local Production
Local production of corrugated paper box during the period 2000--2013 exhibits a growth
trend, increasing from 2,136 tons in 2000 to 23,535 tons in 2013, registering an average
annual growth rate of 19.53%.
2) Import
During the period 2000--2013, import of paper packing materials (corrugated paper box,
paper board and paper sacks & bags) exhibits a substantial growth. In the year 2000 import
was only 5,005 tons and Birr 36.79 million in terms of volume and value, respectively. By
2013 import has increased to 7,528 tons and Birr 202.89 million in terms of volume and
value, respectively. During the period under consideration, import of corrugated paper box,
paper board and paper sacks & bags has registered an average annual growth rate of 15.26%
and 25.07% in terms of volume and value, respectively.

111
During the recent five years (2009--2013), from the total import of paper packing materials
the highest share (on average, 61% in terms of volume and 52% in terms of value) is
accounted by paperboard followed by paper bags and sacks (21% in terms of volume and
29% in terms of value). The remaining 18% in terms of volume and 19% in terms of value is
accounted by corrugated paper box.
3) Apparent Consumption
During the period 2000--2013 total supply or apparent consumption of paper packing
materials (corrugated paper box, paper board and paper sacks & bags) has increased from
7,141 tons to 31,063 tons registering an average annual growth rate of 17.38%.
4) Present Effective Local Demand
In order to estimate the current effective local demand for paper packing materials in
Ethiopia, the following methods were applied:
- parameter double exponential smoothing; and
Based on the results of test statistics the Holt’s two parameters exponential smoothing is
found to be the most appropriate for all the products under consideration. Accordingly, the
estimated present effective demand for each product is given below.
rrugated paper box ------- 25,713 tons
-------------------- 4,849 tons
--------- 1,700 tons
Total ………………………. 32,262 tons
1.2.3 Trend in Factors that Affect the Local Demand for the Products under
Consideration
The variables that are essential in determining the magnitude and trend of demand for the
product under consideration are:
;

112
;
Accordingly, a thorough assessment of current status and future prospect of these factors
indicates that there is a progressively growing local demand for paper packing materials.
1.2.4 Demand Projection
The local demand for paper packing materials (corrugated paper box, paper board and paper
sacks & bags) is projected to increase from 43,716 tons in 2015 to 99,302 tons and 206,282
tons by the years 2020 and 2025 respectively. Moreover, by year 2030 the demand is
projected to reach 411,409 tons.
Regarding by type of product, the local demand for corrugated paper box is projected to
increase from 34,842tons in 2015 to 79,144 tons, 164,407 tons and 327,893 tons by the years
2020, 2025 and 2030 respectively.
Likewise, the demand for paper board is projected to increase from 6,571 tons in 2015 to
14,925 tons, 31,004 tons and 61,835 tons by the years 2020, 2025 and 2030, respectively.
The local demand for paper sacks and bags is projected to increase from 2,304 tons in 2015 to
5,233 tons and 10,871 tons by the years 2020 and 2025 respectively. Moreover, by year 2030
the demand is projected to reach 21,681 tons.
1.2.5 Market Share
The market share of the envisaged project for corrugated paper box is projected to increase
from 1,192 tons in 2015 to 21,495 tons and 68,686 tons by the years 2020 and 2025
respectively. Moreover, by year 2030 the demand is projected to reach 207,649 tons.
The market share of the envisaged project for paper board is projected to increase from 5,585
tons in 2015 to 12,686 tons, 26,354 tons and 52,560 tons by the years 2020, 2025 and 2030
respectively.
Likewise, the market share of the envisaged project for paper sacks and bags is projected to
increase from 1,958 tons in 2015 to 4,448 tons, 9,240 tons and 18,429 tons by the years 2020,
2025 and 2030, respectively.

113
1.2.6 Marketing Mix
The raw materials used for the production of paper packing materials are the cornerstones of
high quality final products. Accordingly, different mechanical/physical testing procedures has
to be performed on the incoming materials to insure the quality of the final products. The
tests include determination of ring crush resistance, flat crush resistance of lab-fluted
corrugating medium, bursting strength and determination of water absorption. Moreover, the
final products have to undergo many tests to prove that the transported goods are protected to
the maximum. The tests include drop, compression, stacking and vibration tests. Hence, the
quality control service of the envisaged plant requires a laboratory appropriate for conducting
tests on raw materials and final products.
Based on the data collected from end users the recommended factory gate price is shown
below.
For the envisaged project, its products are intermediate product used for packaging of various
products manufactured by other industries and the end users are few in number and their
geographical distributions is limited and are mostly located in or around major cities and
towns of the country. Accordingly, by taking the nature of the products and the characteristics
of the end users direct distribution to end users is selected as the most appropriate distribution
channel.
The envisaged factory is recommended to aggressively advertise its product by distributing
calendars, pamphlets as well as by participating in exhibitions and bazaars. Moreover, in a
competitive market, trade promotion should be made to persuade or to make a product
attractive for end users. Therefore, the envisaged factory is recommended to offer discounts
with the volume of product bought and credit for one to two weeks.
1.2.7 Product mix, Plant Capacity and Production Program
a) Product Mix
The market study has identified and proposed corrugated paper board, duplex paper board
and paper bag to the product mix of paper packaging materials to be produced by of the
envisaged plant. However most of the packaging industries that used the paper bag as an
input for their packaging material have conversion machinery that will convert the standard

114
paper for packaging to paper bags of different size according to the weight and type of
product mostly dry processed products. More over the value addition of the process is very
low relative to the corrugated paper board and duplex paper board. In view of this only
corrugated paper board and duplex paper board are proposed to be produced by the envisaged
plant.
b) Plant Capacity
For the capacity determination the demand projections worked current supply and cost of
investment accordingly both low and high estimate of the projections have been compared on
average with current and potential supply in the future.
Economic scale of corrugated paper board technology ranges from the 3500-4000 ton /year
for small scale, 8000-8500 ton/year for medium scale and 15000-16000 tone / year and above
for large scale of production.
So, considering projected demand and supply gab analysis in the market study and optimum
economic scale of operational technology the middle level of plant capacity 8000 tons/year
for paper board production and 500 ton/year for the duplex paper board is recommended for
envisaged plant working one shift and 300 days per year
1.2.8 Production Program
The envisaged plant will operate at 65% capacity utilization rate at first, 75 % at second year,
85% at the third year of production and followed by rich experience of technical, financial,
marketing and sales factors of the environment, the envisaged plant will operate at full
capacity utilization (100%) in the fourth year and then after
1.3 Technical Study
1.3.1 Raw Materials and Inputs
The direct raw material of the envisaged plant for the corrugated board manufacturing
includes different grades of paper namely Kraft liner of different GSM mainly from120 to
160 GSM, Tesliner of different GSM mainly from 112 to 170 GSM and Semi-chemical
fluting/medium fluting of different GSM mainly from 105 to 150 GSM. Similarly the direct
raw material for duplex board making is flat type duplex board at different GSM mainly from
150 to 400 GSM depending on the customer order for packing their product types
Similarly some ingredients and additives are required in the production process which
includes materials used for gluing, printing and closure application in which the proportion of

115
those raw materials vary according to the designed quality of corrugated paper board and
employed in the process technology namely Corn Starch ,Sodium borate ,Caustic soda
,Stitching wire ,Vinavil glue ,Printing ink
Similarly for duplex paper board oil based printing ink, are glue substance; chrome plated
printing plate, plate developer, plywood and different size steel rules.
In addition to direct raw materials and ingredients some auxiliary material inputs and factory
supplies are required which are to be consumed and used during intermediate operation of the
production process. These include packaging materials, oil and grease, maintenance
consumables.
Utilities are another important category of inputs required for the envisaged process which
mainly includes electric power, compressed air, furnace oil, gasoil and water with different
consumption rate at different operational points of the process. The Sources of the major raw
materials are both the local and foreign markets for the corrugated paper board production.
However Indonesia, and South Africa are viable for a competitive price; and also it is also
advisable to form purchase contacts from local producers namely from Wonji paper and pulp
factory and from the newly established Indian investors company located around Ambo town
in which both of them recycle paper from used paper boxes and other paper waste with some
percentage mix of imported virgin pulp for the production of semi-chemical fluting and test
liner papers
Accordingly the annual cost of direct and indirect raw materials for the envisaged plant at full
capacity operation is estimated at to be Birr 196,177,760.00 in foreign currency
The annual cost of annual inputs and factory supplies for the envisaged plant at full capacity
operation is estimated to be Birr 586,200.00 out f which 96 % in local currency
The annual utilities consumption for plant at full capacity operation is estimated at about Birr
9,861,280.00 in local currency.
1.3.2 Location, Site and Environment
a) Location
In process of the project location selection, the Consultant has adopted two stage selection
processes for the envisaged plant. The first stage is the identification of potential
geographical locations based on the assessment of critical project requirements. The second
stage involved selection of the best location from the potential locations identified using
different selection criteria and as well as established rating scale.

116
Accordingly the candidate towns for industrial clustering program and their associated
planned industries by type and sector which are relatively associated with the envisaged
project are list below:
-packaging industry
–printing industry
Accordingly the candidate locations are evaluated generally with respect to the major factors
of the plant location determination and it is found that:
located near to the center where the markets are available. This implies the area where high
product consumers are located. It is also located along the main road and this gives better
opportunities to import the required inputs from abroad.
-established infrastructures such as telecommunication, electricity
and water supply contributes to smooth operation of the project. The environment of the area
is also proved to be appropriate to the project.
cle used paper boxes and other paper waste into
the production process and produce semi-chemical fluting and test liner papers. It is advisable
to think on the subject therefore the plant location should consider the availability of enough
area for the expansion.
The plant, therefore, has to identify initially the major beneficiaries and also check the
availability of the required space. In fact about 80% of the users are in and around Addis
Ababa especially in the east side of the city.
Based on the above requirement of the plant, the following towns are proposed to be the
alternative potential location of the plant:

117
As per the evaluation made on these alternative locations, Dukem town which is 30 km south
east of Addis Ababa on the road to Djibouti is found to be the most suitable one followed by
Bisheftu, Sululta and Adama.
b) Site
Site is a plot of land within the selected location sufficient and suitable for installation and
operation of the plant. The project site is near the vicinity of Addis Ababa where
infrastructure facilities like supply of power, water, Road transport, Communication services,
banking etc. are better organized and available for smooth operation of the plant. Moreover,
almost all beneficiaries of the product are located in and around Addis Ababa which is a short
distance from the project site.
Future own raw material development is also farsighted in this project. For collecting waste
papers (damaged cartons and related products) from different industries for reusing this waste
paper and carton, therefore the plant location is also appropriate for collecting the raw
material.
c) Environmental Impact Analysis
In general in paper packaging environment solid waste could consist of the following, scrap
paper produced, at end cutter of board making process at flap cutter of printing process and at
die cutting process of packet production. In addition to scrap papers damaged products, bad
printing or spoilage, outdated materials, damaged plates and test production are the main
source of solid wastes.
Wastewaters from paper packaging production operations may contain waste ink, cleanup
solvents, photographic chemicals, acids, alkaline and plate coatings, and glue waste during
single facer cleaning and glue preparation.
Printing operations in packaging industries produce volatile organic compound (VOC)
emissions from the use of cleaning solvents and inks as well as alcohols and other wetting
agents.
Generally the envisaged plant is a typical medium level environmental friendly process that
discharges insignificant waste in solid and gaseous form and investments on environment as
well as environmental management system are recommended with the necessary operating
and overhead costs to manage and comply with both national and international standards.
118
1.3.3 Technology and Engineering
Technology selected for the envisaged project for the production of corrugated paper board is
a C and B flute double board (5-layer) production process technology. The production output
is either single board or double board depending on the customer order.
The technology selection is mainly done based on international trained and the main products
required by the customers in the current development stage of the country. 99 % of the
manufacturers in Ethiopia needs C–flute single wall corrugated box or C&B combination
double wall corrugated box; therefore, the technology employed for manufacturing this
products is a double board production process technology with flexo graphic printing
The manufacturing process of the project under consideration includes the fundamental
process namely , Corrugating, gluing and laminating ,Creasing and cutting, Printing Rotary
splitting, creasing and corner cutting , Stitching and Gluing
Similarly duplex Paper board can be made on multi-ply paperboard machines and the higher
thicknesses are made by lamination machine which takes reels of board, usually up to six
reels in line, glue laminates them and cuts them into sheets at the end.The typical weight of
PE applied in this way is 15 g/m², in addition white lined folding boxboards and solid
bleached (white) boards can also be used as required. Depending on the quality required,
printing on the paper board is carried out on sheets by letter press, offset litho or flexo
followed by Cutting and creasing
Based on the technology selected the investment costs of plant machinery and equipments is
estimated to be Birr 81,035,400.00 out of which 86% required in foreign currency , and the
investment costs of plant utility equipments , tools and devices is estimated to be Birr
33,108,050.00 out of which 87% is require in foreign currency
In addition the investment cost of transportation facilities for material handling and public
transport service is estimated to be Birr 11,120,000.00 required in local currency; similarly
investment cost of plant office furniture and equipments is Birr 896,000.00 in local currency.
This envisaged plant requires land for factory block including space for corrugation process,
space for printing process, space for administrative & technical staffs, for raw materials
storage for finished item storage , for internal roads and path ways, greenery and, utilities ,
water circulation and adequate land for future expansion.
The total area of the envisaged paper packaging plant estimated to be is 30,000 m2 (3.00
hectare) with a length of 200 m and of 150 m width. Of the envisaged total area, the building
area including the main production area, administrative staff accommodation area, raw
materials storage area, finished items storage area all covers about 8276.85 m2 or 27.58 %.

119
Generator, furnace house, guard house and water reservoir cover about 280 m2 or 0.93%.
Roads, parking areas and, walk ways account for 9659 m2 or 32.20 %. Open space accounts
for 5119 m2 or 17.06 %. The greenery accounts 6670 m2 or 22.23 %.
Accordingly, assuming a land lease cost of Birr 11birr per m2 the total land lease cost is
estimated at Birr 13,200,000 of which 10 % of the total or Birr 1 ,320,000 be paid in advance
and the remaining balance will be paid in equal installments.
The total estimated cost of the civil engineering works amounts to Birr 58,551,690.00 of the
total amount Birr 37,245,825.00 or 63.61 % of the total is expected to be incurred for the
construction of Factory building including administrative & technical offices, raw material &
finished items storage.
1.3.4 Organization Structure and Human Resource
The total personnel requirement of the plant is estimated to be 214 skilled, Smi-skilled and
unskilled. The project will have employees with an initial total annual salary of about Birr
6,613,200.00. The factory management should arrange for on job training with the machinery
suppliers before and during the installation & commissioning of the machineries at the
premises of the supplier for about one month.
However it should be emphasized that training should be viewed as ongoing activity of the
factory and not just one-time affair. Accordingly the estimated training cost is summarized to
be birr 661,000.00 Similarly legal recruitment of employee demands coverage of some
employees benefits such as pension contribution, medical allowance, and employee insurance
that are protected by the local labor law. Accordingly the estimated employees annual benefit
cost is summarized to be birr 2,469,000.00
1.3.5 Project Implementation
The project implementation schedule covers the activities starting from the project evaluation
and approval up to and including the trial-run and commissioning. It is envisaged that the
complete implementation program requires a total of 18 months starting from the project
approval. The implementation cost of the envisaged project comprises project office running
and follow-up expenses, and erection and commissioning costs.
Project implementation costs include project follow up and office running cost, cost of
design, manufacturing, erection, and commissioning of the plant, and cost of design and
supervision of building and civil works of the plant. The total cost implementation including
project follow up and office running cost, cost of stationery and communication, cost of
120
design, manufacturing, erection, and commissioning estimated to be Birr 3,892,200.00 in
local currency
1.4 Financial and Economic Analysis
The financial analysis of the project (benefits and costs) is computed over seventeen years
assuming 18 months implementation period and 15 years of operation. In addition
depreciation and amortization, customs duty and income tax, repair and maintenance costs,
terminal (salvage) values well as working capital have been worked out based on the existing
laws of the country and standard assumptions. Accordingly, the major findings of the
financial analyses are given below.
The total investment cost of the project is estimated at Birr 242.07 million. From the total
investment cost the highest share (Birr 184.70 million or 76.30%) is accounted by fixed
investment cost followed by initial working capital (Birr 37.55 million or 15.51%) and pre
operation cost (Birr 19.81 million or 8.19%). The total annual cost of production and revenue
at 100% capacity utilization (year 4) is estimated at Birr 242.46 million and Birr 305.62
million respectively.
The project will generate a profit throughout its operation life. Annual net profit after tax will
increase from 24.70 million during first year of operation to Birr 60.32 million during the last
year of the project life.
The projected cash flow of the envisaged project shows that the project would generate
positive net cash flows throughout the operation years. Based on a 10% discount rate the
Internal Rate of Return (IRR) and Net Present Value (NPV) are computed to be 26.53% and
Birr 249.84 million respectively, indicating the viability of the project.
The initial investment cost of the project will be fully recovered within six years, which is a
reasonably short period of time. Other measures of profitability net profit as a % of sales
revenue, net profit to equity and net profit to total investment are also attractive.
The efficiency ratios like current assets to current liabilities and net cash flow to sales
calculated from the balance sheet show that the project is highly liquid with sound financial
performance. The breakeven point for sales and capacity utilization is computed at Birr
108.60 million and 47% which are reasonable. Moreover, the sensitivity analysis carried out
indicates that the project could be viable at adverse conditions i.e. either a decrease of 16% in
sales price or increase of 22% in production cost or an increase of 40% in investment cost.
In addition to its financial viability the project has a number of economic and social benefits.
The establishment of the project has a foreign exchange saving effect to the economy.

121
Moreover, as a profitable venture it will contribute to the increase of Regional and Federal
government revenue through corporate, payroll and other taxes.
The project will create direct employment opportunities for about 222 persons. Furthermore,
it creates a conducive environment for the rapid growth of service and trade sectors around
the project site which in turn create employment opportunity for a substantial number of
persons. Moreover, the project will also create forward linkage with the manufacturing
sector.
122
MINISTRY OF INDUSTRY
IX. FEASIBILITY STUDY FOR THE ESTABLISHMENT OF PLASTIC
AND FLEXABLE PACKAGING MANUFACTURING PLANT

123
IX. EXCUTIVE SUMMARY
This Draft Report on Feasibility Study for the Establishment of plastic and flexible packaging
manufacturing plant is prepared by the Industrial Projects Service (IPS), the Consultant as per
the consultancy agreement concluded with the Ministry Of Industry (MoI), the Client. The
report consists of market, technical and financial analyses components on the feasibility study
of the envisaged plant. The next section provides synoptic summary of the findings under
each component.
1.1 Analysis of the Business Environment
As per the analysis carried out by different institutions on the political, economic, socio-
cultural and technological developments (PEST), Ethiopia offers a stable political and
economic environment as well as security; exceptional climate; almost complete absence of
routine corruption; continuously improving public service delivery which makes it potentially
an ideal destination for investment. The macro economic performance in the past seven years
has been very positive and the GTP indicates a very good prospect, with a minimum of 11%
GDP growth per annum, for the future. Although the incentive packages that are currently
given seem to be adequate, the government is planning to give additional incentives for the
manufacturing sector, particularly to export oriented and import substituting projects.
Priorities will be given to the manufacturing sector in support provision in the areas of
licensing, land and finance allocation, training and the like.
The expansion of Universities as well as Technical, Vocational Education and Training
(TVET) in all parts of the country provides good opportunity in the supply of skilled and
semi-skilled technical personnel. Health service provision and development of infrastructures
such as roads, energy and communication are also showing a rapid improvement in the
country. The advancement of science and technology in the world and the spread of same in
the country will favorably influence the smooth operation of the envisaged project. To
encourage investment a number of incentives are granted to investors which include;
exemption of customs duty for importing capital goods and spare parts for investment and
raw materials for production of export goods, income tax holidays and the permission of
losses to carry forward during tax holiday period. Ethiopia also provides different guarantees
with respect to repatriation of capital, profit and against expropriation and nationalization.
Accordingly, it can be concluded that Ethiopia is ideal for investment.
124
1.2 Market Study
1.2.1 Product Description and Application (Technology)
a) Flexible Plastic Packing Materials (Plastic Film and Sheet)
Generally, films less than 100μm thick is used to wrap product, to overwrap packaging(single
packs, groups of packs, palletized loads), to make sachets, bags and pouches, and is
combined with other plastics and other materials in laminates, which in turn are converted
into packaging. Plastic sheets in thicknesses up to 200 μm are used to produce semi-rigid
packaging such as pots, tubs and trays. The properties of plastic films and sheets are
dependent on the plastic(s) used and the method of film manufacture together with any
coating or lamination. In film and sheet manufacture, there are two distinct methods of
processing the molten plastic which is extruded from the extruder die. In the cast film
process, the molten plastic is extruded through a straight slot die onto a cooled cylinder,
known as the chill roll.
b) Rigid Plastic Packaging Materials
Bottles are made by extrusion blow molding. A thick tube of plastic is extruded into a bottle
mould which closes around the tube, resulting in the characteristic jointed seal at the base of
the container. Air pressure is then used to force the plastic into the shape of the mould. After
cooling, the mould is opened and the item removed. It is possible to apply co extrusion to
extrusion blow molding so that multilayered plastic containers can be made with a sandwich
of various plastics. An example would be where high oxygen barrier, but moisture sensitive
and this construction will provide for a 12–18 month shelf life for oxygen-sensitive products
such as tomato ketchup, mayonnaise and sauces. A variation of injection and extrusion blow
molding is to stretch the pre-form after softening it at the second stage and then stretching it
in the direction of the long axis using a rod and the stretched pre-form is then blow molded
which results in biaxial orientation of the polymer molecules, thereby increasing strength,
clarity, gloss and gas barrier. Injection stretch blow molding is used to make PET bottles for
carbonated beverages. Screw cap and pressure fit closures with accurate profiles are made by
injection molding Wide mouth tubs and boxes are also made by injection molding. There are
many food applications for rigid and semi-rigid thermoformed containers. Examples include
a wide range of dairy products, yoghurts etc. in single portion pots, fresh sandwich packs,
compartmented trays to segregate assortments of chocolate confectionery and trays for

125
biscuits. Thermoforming can be combined with packing on in-line thermoform, fill and seal
machines.
c) Laminated Plastic Packing Materials
Plastic films may be combined with other plastics by co extrusion, blending, lamination and
coating to achieve properties which the components could not provide alone. Co extrusion is
a process which combines layers of two or more plastics together at the point of extrusion.
Lamination is a process which combines two or more layers of plastics together with the use
of adhesives and different plastic granules can be blended together prior to extrusion. Several
types of coating process are available to apply plastic coatings by extrusion, deposition from
either solvent or aqueous mixtures or by vacuum deposition. Plastics are also used as coatings
and in laminations with other materials such as regenerated cellulose film (RCF), aluminum
foil, paper and paperboard to extend the range of properties which can be achieved.
1.2.2 Application
About 50% of Europe‟s food is packed in plastic packaging (British Plastics Federation,
BPF). Plastic has properties of strength and toughness and specific plastics can meet the
needs of a wide temperature range, from deep-frozen food processing (−40°C) and storage
(−20°C) to the high temperatures of retort sterilization (121°C), and reheating of packaged
food products by microwave (100°C) and radiant heat ( 200°C). Most packaging plastics are
thermoplastic, which means that they can be repeatedly softened and melted when heated.
Plastics are used in the packaging of food because they offer a wide range of appearance and
performance properties which are derived from the inherent features of the individual plastic
material and how it is processed and used.
The main reasons why plastics are used in food packaging are that they protect food from
spoilage, can be integrated with food processing technology, do not interact with food, are
relatively light in weight, are not prone to breakage, do not result in splintering and are
available in a wide range of packaging structures, shapes and designs which present food
products cost effectively, conveniently and attractively. Plastics are used as containers,
container components and flexible packaging and by weight; they are the second most widely
used type of packaging and first in terms of value. Examples are as follows:
-sealable flexible
lidding materials

126
to withstand compression is required
and the wadding used in such closures
in multipacks, e.g. Hi-cone ring for cans of beer,
trays for jars of sugar preserves etc.
s of coatings, adhesives and inks.
Plastics can be colored, printed, decorated or labeled in several ways, depending on the type
of packaging concerned. Alternatively, some plastics are glass clear, others have various
levels of transparency, and their surfaces can be glossy or matte. Plastics are also used to
store and distribute food in bulk, in the form of drums, intermediate bulk containers (IBCs),
crates, tote bins, fresh produce trays and plastic sacks, and are used for returnable pallets, as
an alternative to wood. Some applications of plastics and flexible packaging include
–warp film
-Cutter box film
- case ready film
Pasta and macaroni packing-film
-food pouches and bags
-PET bottle
-PET bottles and soft drink pouches
-PET bottle and pouches
-souvenir drink cups, disposable cups, clear drink cups
127
1.2.3 Past Supply Trend
The local demand for flexible (plastic sheet and film) and rigid plastic packaging materials is
met through both local production and import, while the demand for laminated plastic
packing materials is entirely met through import. Accordingly, the major findings of the trend
in past supply of plastic packing materials are summarized below.
a) Local Production
During the period 2001--2013, local production of plastic packing materials has increased
from 8,931 tons to 19,956 tons, registering an average annual growth rate of 8.44%. During
the recent five years (2009--2013) from the total local production of plastic packing materials
the majority is accounted by rigid plastic packaging materials (53.57%). The remaining
46.43% is accounted by flexible plastic packaging materials.
b) Import
1) Flexible Plastic Packing Materials
Import of flexible plastic packing materials which was 1,913 tons in 2001 has increased to
12,146 tons in 2013, registering an average annual growth rate of 8.44%. During the same
period, the value of imported flexible plastic packing materials has increased from Birr 32.32
million to Birr 590.14 million, registering an average annual growth rate of 20.87%.
2) Rigid Plastic Packing Materials
During the period 2001--2013 import of rigid plastic packing materials exhibits a significant
growth. In 2002, import was only 73 tons and Birr 2.08 million in terms of volume and value,
respectively. However, in 2013 import has increased to 7,293 tons and Birr 342.59 million in
terms of volume and value respectively.

128
During the recent five years (2009--2013), in terms of volume, from the total import of rigid
plastic packing materials the great majority (on average 75.74%) is accounted by bottle
preforms, followed by boxes, cases, creates and similar articles (16.34%), stoppers, lids, caps
and other closures of plastic (4.97%) and carboys, bottles, flasks and similar articles (2.95%).
3) Laminated Plastic Packing Materials
The country imports two types of laminated plastic packing materials i.e. plastic laminated
with paper and aluminum foil. Import or total supply of laminated plastic packing materials
during the period 2001--2013 has shown a noticeable increasing trend although there were
fluctuations in some years. During period 2001--2006 the average import of laminated plastic
packing materials was 169 tons. However, during the subsequent four years (2007--2010)
import has increased to an average of 272 tons. Furthermore, during the recent three years
(2011--2013) import of laminated plastic packing materials has escalated to an average of
423 tons. During the past 14 years import of the product has increased by 26.62% annually.
The amount of expenditure for importing laminated plastic packing materials has shown a
huge growth during the period 2001--2013, increasing from Birr 2.60 million to Birr 35.77
million.
c) Total Supply or Apparent Consumption
1) Flexible Plastic Packing Materials
Total supply of flexible plastic packing materials which was 6,059 tons in 2001 has increased
to 21,411 tons in 2013, registering an average annual growth rate of 16.97%. On average
during the period under consideration (2001--2013) the share of local production was
46.70%, which implies that the great majority (53.30%) of the local demand for flexible
plastic packing materials is met through import.
2) Rigid Plastic Packing Materials
Total supply or apparent consumption of rigid plastic packing materials exhibits a year to
year growth. The yearly average apparent consumption, which was about 4,600 tons during
the period 2001--2003, has increased to a yearly average of about 17,300 tons during the
period 2012--2013. During the period under consideration (2001--2013) total supply of rigid
plastic packing material has registered an average annual growth rate of 12.79%.

129
3) Laminated Plastic Packing Materials
Apparent consumption of laminated plastic packing materials has increased from a yearly
average of 106 tons in the year 2001--2006 to a yearly average of 423 tons during the period
2011--2013, with a yearly average growth rate of 26.62%.
1.2.4 Present Effective Local Demand
In order to estimate the current effective local demand for plastic packing materials in
Ethiopia, the following methods were applied:
- parameter double exponential smoothing; and
Based on the results of test statistics the time trend extrapolation method is found to be the
most appropriate for all the products under consideration. Accordingly, the estimated present
effective demand for each product is given below.
cking material…………………… 17,874 ton
1.2.5 Trend in Factors that Affect the Local Demand for the Products under
Consideration
The demand for plastic packing materials depends on the performance of the end users.
Plastic packing materials are extensively used by food, beverage and chemical manufacturers.
Moreover, the products are also used by other sub sectors of the manufacturing sector such as
textile, leather, and paper etc products as a primary protective packing material. Hence, past
performance and future prospect of the manufacturing sector determines the magnitude of the
demand for plastic packing materials. Accordingly, a thorough assessment of the
manufacturing sector indicates that there is a progressively growing local demand for plastic
packing materials.
1.2.6 Demand Projection
The local demand for flexible plastic packing materials is projected to increase from 24,562
tons in 2015 to 49,430 tons and 99,448 tons by the years 2020 and 2025 respectively.
Moreover, by year 2030 the demand is projected to reach 200,052 tons. The local demand for
rigid plastic packing materials is projected to increase from 19,077 tons in 2015 to 41,127
tons and 85,479 tons by the years 2020 and 2025 respectively. Moreover, by year 2030 the

130
demand is projected to reach 174,686 tons. Similarly, the local demand for laminated plastic
packing materials projected to increase from 594 tons in 2015 to 1,316 tons, 2,768 tons and
5,690 tons by the years 2020, 2025 and 2030, respectively.
1.2.7 Supply Demand Gap
The unsatisfied demand for flexible plastic packing material will increase from 14,834 tons in
the year 2015 to 37,014 tons by the year 2020. Furthermore, the unsatisfied demand is
projected to reach 85,759 tons and 186,363 tons by the year 2025 and 2030, respectively.
Similarly, the unsatisfied demand for rigid plastic packing material will increase from 7,852
tons in the year 2015 to 26,802 tons by the year 2020. Furthermore, the unsatisfied demand is
projected to reach 69,685 tons and 158,892 tons by the year 2025 and 2030, respectively.
Since laminated plastic packing materials is entirely imported from abroad, the unsatisfied
demand is equal to the projected demand. Accordingly, the unsatisfied demand is projected to
increase from 594 tons in the year 2015 to 1,316 tons and 2,768 tons by the year 2020 and
2025, respectively. By the year 2030 the unsatisfied demand is forecasted to reach at 5,690
tons.
1.2.8 Market Share
The market share that could be captured by the envisage project is estimated by considering
the unsatisfied demand, capacity of existing factories engaged in the production of similar
items and competition from import. Accordingly the market share of the envisaged project for
flexible plastic packing materials is projected to increase from 11,125 tons in 2015 to 27,760
tons and 64,319 tons by the years 2020 and 2025 respectively. Moreover, by year 2030 the
market share is projected to reach 139,772 tons. The market share of the envisaged project for
rigid plastic packing materials is projected to increase from 5,889 tons in 2015 to 20,101 tons,
52,264 tons and 119,169 tons by the years 2020, 2025 and 2030 respectively. Likewise, the
market share of the envisaged project for laminated plastic packing materials is projected to
increase from 445 tons in 2015 to 987 tons, 2,076 tons and 4,268 tons by the years 2020,
2025 and 2030, respectively.
1.2.9 Marketing Mix
A proper quality control system considerably minimizes waste or the rejection of end
products and thereby avoids complaint by customers. It also reduces the envisaged factory‟s
operating costs as it facilitates timely corrective measures. Accordingly, the quality control
service of the envisaged plant requires a laboratory appropriate for conducting tests of raw

131
materials and final products. Based on the data collected from end users the recommended
factory gate price is shown below.
king materials.………………. Birr 53,200 per ton
For the envisaged project, its products are intermediate product used for packaging of various
products manufactured by other industries and the end users are few in number and their
geographical distributions is limited and are mostly located in or around major cities and
towns of the country. Accordingly, by taking the nature of the products and the characteristics
of the end users direct distribution to end users is selected as the most appropriate distribution
channel.
The envisaged factory is recommended to aggressively advertise its product by distributing
calendars, pamphlets as well as by participating in exhibitions and bazaars. Moreover, in a
competitive market, trade promotion should be made to persuade or to make a product
attractive for end users. The envisaged factory is recommended to offer discounts with the
volume of product bought and credit for one to two weeks.
1.2.10 Product Mix
The type of flexible packaging films used for packaging majorly food and beverage are
identified and found to be BOPET Film, BOPP Film LDPE Film, PVC Film and CPP Film.
The envisaged plant is planned to produce the above listed flexible packaging films to be
laminated in combination with each other or with other substrates such as aluminum and
paper followed by printing operation according to the customer specification. Similarly for
the rigid plastic containers the plastic containers used for beverage packing is majorly made
of plastic material known as PET and also plastic containers made of LDPE /HDPE plastic
materials used for beverage and food packaging. Accordingly the envisaged plant will
produce pre-form of plastic containers and bottles of different type as a finished final and to
be blown to the final shape and size by the food and beverage packers.
1.2.11 Plant Capacity
The economic scale of the technology is assessed relative to the projected demand gap of
both rigid and flexible packaging materials and it is found that for rigid plastic containers
used for packaging the economic scale of the technology is much lower than the demand gap
projected and considering 300 days of operation, 3 shift operation, and 90 % of capacity
utilization optimum capacity is recommended namely Beverage containers/PET bottles/pre-

132
form: annual capacity 3203.8 ton per annum and associated closures capacity of 269.42 ton
per annum Plastic jars and containers with closures annual capacity 450 ton per annum and
associated closures capacity of 60.75 ton per annum. From the above capacity breakdown the
aggregated plant capacity of flexible plastic films of the envisaged plant will 47,061 ton per
annum operating at full capacity considering five LDPE and three PVC film making line to
achieve and balance the output of BOPP, BOPET and CPP film production. However the
projected demand gap of the flexible packaging materials as seen from the market study will
reach 49,430 ton per annum to the envisaged plant capacity at the year of 2020.
Even though the demand gap is lower than the minimum plant capacity to produce majority
of flexible packaging materials to be used for the food and beverage packaging all the
flexible films types listed are recommended and advice produced. The realization of the
envisaged flexible film plant considers industrial development strategy of the country,
product mix, quality requirement of potential customers of the plant, flexibility of the
production system, available technology in the world and skill requirement for operation and
maintenance of machinery. Therefore, for the envisaged project it is assumed annually 300
production days, 8 working hour per day, three shift operations, and capacity utilization rate
of 90 % is considered and the proposed capacity of the envisaged plant for the flexible plastic
film is 47,061 ton per annum in which the plant will reach full capacity utilization at the
fourth year of production after implementation period of two and half year.
1.2.12 Production Program
For the rigid plastic container production: The envisaged plant will operate at 75% capacity
utilization rate at first, 85 % at second year of production and followed by rich experience of
technical, financial, marketing and sales factors of the environment, the envisaged plant will
operate at full capacity utilization (100% ) in the third year and then after. For the flexible
film: envisaged plant will operate at 65% capacity utilization rate at first, 75 % at second
year. 85 % at second year of production and when the market demand gap reaches equivalent
level with the plant full capacity and also building capability technical, financial, marketing
and sales factors of the environment, the envisaged plant will operate at full capacity
utilization (100% ) in the fourth year and then after
1.3 Technical Study
1.3.1 Raw Materials and Inputs
The raw materials and inputs required for the flexible and rigid plastic packaging material
manufacturing process can be preliminarily categorized as direct and indirect raw materials,

133
auxiliary materials and inputs and utilities. Accordingly the direct raw materials used for the
rigid plastic packaging material manufacturing are PET, HDPE, LDPE, PP granules and
coloring Pigments. Similarly for that of flexible Packaging BOPP Resin, BOPET Resin, CPP
Resin, LDPE Resin, PVC Resin, additives, slip agent, anti block and anti-static agent are used
in different proportions according to the type of flexible packaging film required which in
turn depends on the type of product to be packed. In addition factory inputs and supplies for
packaging such as cardboard (Cartoon) and polyethylene sheet, oil, grease and consumables
are required and can be supplied from the local finished product market however envisaged
plant will produce the polyethylene sheet for its own packing of the for the delivery. The
annual cost of direct raw materials for the envisaged plant at full capacity operation is
estimated at about Birr 2,217,486,000.00 in and out of which in 87 % is required in foreign
currency. The annual cost of Auxiliary materials, inputs and factory supplies for the
envisaged plant at full capacity operation is estimated to be Birr 22,574,110 out of which 98
% is required in local currency. The annual utilities consumption for plant at full capacity
operation is estimated to be Birr 80, 975, 380 in local currency.
1.3.2 Location, Site and Environment
Location: The potential market to the products of the envisaged plant is food and beverage
producing plants, bottled water production plants, canned food production plants and other
plants in various sectors that make use of flexible and rigid packaging materials for packing
their products. To this end most of customers of the envisaged plant are food and beverage
processing and packaging plants which are found majorly in and around Addis Ababa namely
Sululta ,Bisheftu ,Dukam , Adama,Sebeta ,Waleta ,Gelan ,Mojo. Since the raw materials and
inputs are imported using land transportation the nearest potential source of raw material
would be the Mojo dry port, which fortunately is located in close proximity to Addis Abeba
and some other envisaged locations such as Bisheftu ,Dukam , Adama, ,Gelan and ,Mojo
.Therefore, a potential location for the envisaged plant in this criterion is could be the towns
located nearby. Accordingly, Mojo, Adama, Bisheftu ,Dukam and Gelan respectively could
be identified as potential locations based on proximity to the source of raw materials. The
industrial clustering program has identified cities/town for industrial zones development for
various industry types based on the resource potential, market potential for industrial
products, availability of basic infrastructure, etc. The cities identified by the regional
government Clustering Program are Lagatafo, Sebata, Sululta, Dukam,Galane,Bishoftu,
Adama, Asella, Shashimane, Jimma and Nekemte. Based on this classification we shall

134
consider the sites classified for a similar sector as packaging material production, food and
beverage processing industries. Also industries that could serve as potential suppliers of raw
materials for flexible packaging mainly plastic, paper and inks should be considered in the
proposed locations. But from the data of Oromia clustering program potential locations for
the envisaged flexible packaging manufacturing plant are proposed to be around Addis Ababa
which should be near to the user (consumer) of the product. Accordingly, Adama, Sebeta,
Sululta, Asella and Nekemte are identified as potential location for the envisaged flexible
packaging manufacturing plant due to the planned industrial clustering program as described
below:
Adama town : where Agro-processing, Packaging materials, Paper and Paper Products
manufacturing industries planned to be clustered
Sebata town : where Textile and garment, High tech PVC, Rubber and Plastic
manufacturing industries planed to be clustered
Sululta town: where Pharmaceutical and medical equipment, Candy Food industry, Wool
textile, Paper and paper products, Animal feed, Wood industry, Essential oil and cosmetics
industry are planned to be clustered
The above towns are selected due to the clustering program however Adama town is planned
specifically for Packaging materials industries. More over Sebeta, and Sululta are identified
as industrial zones for paper and plastic production which may serve as potential raw material
suppliers for the envisaged plant in the future. The development potential of the cities is
expressed in terms of resource potential, suitable climate, presence/future plan of road
network, market access for its products, etc. Based on the evaluation of the three proposed
location of the envisaged plant as indicated above Adama town is found to be the best
location for the envisaged flexible and plastic packaging g plant followed by Sulelta and
Sebeta equally to the second alternative location in equivalent rank. Site: Site is a plot of land
within the selected location sufficient and suitable for installation and operation of the plant.
Accordingly the site of the envisaged project will be in one of the industrial zone in Adama
town reserved for industrial zone clustering program considering the following major points
such as lower land cost, sufficient space for future expansion of the plant availability of water
and electricity, proximity to market access and raw material Source and adequate road access.
Environment impact: Generally the flexible and plastic packaging manufacturing plant
discharges insignificant in solid, significant waste in liquid and gaseous forms namely: Air

135
Emissions: The expected air emission from the production process the envisaged flexible film
and injected rigid container producing plant are mainly the following:
The emission rate is very insignificant and the major sources are plastic granules
warming/melting, additives (coloring pigments) paints and solvents, oil vapors, odors, gases
from different operations and could be easily mitigated through installation of efficient
ventilation system; workers wear suitable masks when needed, sustainable maintenance for
all machinery and continuous surveillance. More over from the printing operation and
cleaning different parts of the printing facility solvents such as ethanol has been the most
common additive used in fountain solutions and one of the main contributors to VOC
emissions. Between 90 and 100% of used IPA is emitted to the air as fugitive emissions.
Solid waste: The solid wastes generated from the flexible and plastic packaging production
unit are from cleaning of industry premises, gardens and packing materials as well as some
process scraps from the extrusion and injection operation These kinds of wastes are classified
in to general waste category and they can be collected in a central collection or storage tank
inside the premises of the company and can be sold to external or be recycled for different
application and grades of plastic products .
Wastewater: In contrary to many other industries plastic industry do not consume much
water except the major wastewater in this flexible packaging will be waste water from the
cooling of the machines, personnel daily household uses and cleaning. More over used
fountain solution and waste water are often discharged to the sewage system when cleaning
the dampening system. The waste water from cleaning can contain alkali, fungicides, and
solvents. The nitrification inhibiting of damping solutions causes problems for water
treatment plants that have this type of cleaning step for reducing the nitrification. All
wastewater will be collected and for the water for the cooling will be recycled continuously
for longer time and that from the cleaning and sanitation will be collected in sewage tanks
once filled and disposed according to the acting municipality regulations and handling
wastewater will prevent any seepage of bad water to the ground aquifer Noise pollution and
mitigation plan: Noise pollution is one of the expected pollution type in metal packaging
industry especially in the pressing unit. Noise pollution is expected to generate from
machineries like injection, converting and workshop machinery .The noise protection for the

136
manufacturing unit shall implement an effective hearing conservation program. If employee
noise exposures are at or above an eight-hour, time-weighted average of 85 db every
employee is expected to wear a hearing protection device. Generally it is recommended that
in-built pollution prevention and appropriate waste management systems to be incorporated
in the equipments of the plant. Investments on environment as well as environmental
management system are recommended with the necessary operating and overhead costs to
manage and comply with both national and international standards. The solid waste to be
generated shall be properly collected, properly damaged to avoid any possible retrieval and
finally either recycled or incinerated a specially prepared incinerator while the liquid waste
shall be collected and treated properly before discharge.
1.3.3 Technology and Engineering
The manufacturing technology for the flexible packaging involves production of the different
plastic films followed by lamination either with substrates namely paper or aluminum
finished, with each other or with different combination depending on the product to be
packed. According to the technology alternative review for the production of flexible films
recommended technology for the envisaged plant is selected namely:
− Linear Motor Simultaneous Stretching Technology: BOPET and BOPP films production,
− Casting technology : for CPP film production,
− Multi layer blowing technology : LDPE film production,
− Film blown process : for the PVC film production
Moreover for the semi converting process such as printing and lamination the technology
selected includes
− Gravure printing
− Wet lamination
Similarly for the rigid plastic containers manufacturing technology for producing the
complete rigid plastic bottle and cap packaging product involves technology of producing:
− Bottle pre-form through injection
− Bottle cap by compression molding
The envisaged plant will supply the plastic bottle pre-form and caps as the final product
However, the final shaping of the plastic container namely blowing will be done by the
packer.
Accordingly the investment costs of plant machinery and equipments is estimated to be Birr
1,790,670,370.00 out of which 87% is required in foreign currency , and the investment costs
137
of plant utility equipments , tools and devices is estimated to be Birr 119,809,960.00 out of
which 87% is required in foreign currency. In addition the investment cost of transportation
facilities for material handling and public transport service is estimated to be Birr 20,290,000
is required in local currency. Similarly investment cost of plant office furniture and
equipments is Birr 1,223,000 is required in local currency. The envisaged plant requires land
for production hall namely BOPP, PVC, LDPE, CPP, BOPET film production and for
conversion, lamination and injection also for raw material storage , for finished goods
storage, space for administrative offices block , for utilities including water reservoir, for
power house, for vehicular parking, internal roads and path ways, and for greenery. The space
requirement of the plant is determined by the total area each production equipment occupy,
adequate space required in between the equipment‟s/machineries, space required for the
workers and that needed to handle work in progress. Sufficient building space is also required
to accommodate the storage of raw materials that will be enough for three month production.
Finished product store will also have enough space to store a minimum of one month finished
products. Based on this the total area of the envisaged plastic factory is 46,200 m2 (4.62
hectare) with a length of 300 m and of 154 m width. Of the envisaged total area, the factory
building area including BOPP stretching block, conversion block, PVC, LDPE, CPP blowing
block, BOPET stretching block and injection block all covers about 7,825 m2 or 16.9%.
Office block covers about 417.6 m2 or 0.9 %.
Raw materials storage area, & finished items storage area all covers about 1,200 M² or 2.6 %.
Power house, utility house and guard house cover about 545.0 m2 or 1.18 %. Roads, parking
areas for (staff vehicles & trucks) and, walk ways account for 15,200.00 m2 or 32.9 %. Open
space accounts for 12,455.2 M² or 26.96 %. The greenery accounts 8,766 m2 or 18.97. The
site is considered as an ideal rectangular site reserved for industries, on the master plan of the
town and with arterial primary and secondary roads. The site also is considered to have
internal roads which connect the different blocks of the plant and loading and unloading
deck. Since this project is policy based government supported project, we assume that the
land for the project will be obtained at lower lease rate so that the cost reduction will have a
significant figure on the viability of the project. In the same area cost of land is rated per
meter square of Birr 11.00. Accordingly, assuming a land lease cost of Birr 11 birr per m2 the
total land lease cost is estimated at Birr 18, 972,800.00 of which 10 % of the total or Birr
1,897,280.00 will be paid in advance and the remaining balance will be paid in equal
installments within 40 years The cost of the construction works for the envisaged plant was
calculated on the basis of the above proposed civil engineering preliminary design

138
assumptions. The cost is calculated assuming that a square meter of a covered area buildings
construction of blocks with local material like hollow concrete block and concrete work on
the current average market. Accordingly, the total estimated cost of building, civil work and
infrastructures is estimated to be Birr 91,665,337.50.
1.3.4 Organization Structure and Human Resource
The envisaged plant operations and activities will be assigned to organizational units
represented by managerial staff, supervisors and workforce to attain the objectives of the
factory. The activities include planning, directing, coordinating and controlling of the factory
operations at the required level of quality and specified time. The organization structure will
be staffed with eligible personnel with the corresponding authority and responsibility for the
achievement of the goals and objectives of the firm. The highest management body of the
factory, the Board of Directors, is responsible for handling policy issues, approving strategic
plans, and follow-up the activities of the General Manager. The General Manager is
accountable to the Board of Directors. He is responsible for planning, executing, monitoring
and controlling the whole operational activities of the company. There are four line
departments and three services under the general manager. The line departments are:
production and maintenance departments, commercial and property administration,
administration and finance department, and marketing and sales department. The summary
and the detail of manning plan of the envisaged plant are worked out based on the determined
organization structure. Accordingly the total personnel requirement of the plant is estimated
to be 222, skilled, semi skilled and unskilled. The project will have employees with an initial
total annual salary of Birr 9,490,000 when it commences operation. In addition machine
operators and quality supervisors need to be fully trained the standard manufacturing practice
and quality standard characteristics of the envisaged products. In view of this the number of
trainees and the training type with the associated costs is estimated to be Birr 949,000.00.
1.3.5 Project Implementation
The project implementation schedule covers the activities starting from the project evaluation
and approval up to and including the trial-run and commissioning. It is envisaged that the
complete implementation program requires a total of 28 months starting from the project
approval. Project implementation costs are pre-operation expenses which include costs of
project management, detailed engineering of equipment and civil works, erection and
commissioning, consultancy services, and personnel training. The project implementation

139
cost which comprises cost of implementation is the sum of project follow up and office
running cost and design, erection and commissioning is estimated to be birr 19,084,000.00
1.4 Financial Analysis
The financial analysis of the project (benefits and costs) is computed over seventeen years
assuming 24 months implementation period and 15 years of operation. In addition
depreciation and amortization, customs duty and income tax, repair and maintenance costs,
terminal (salvage) values well as working capital have been worked out based on the existing
laws of the country and standard assumptions. Accordingly, the major findings of the
financial analyses are given below. The total investment cost of the project is estimated at
Birr 2.633 billion. From the total investment cost the highest share (Birr 2.023 billion or
76.84%) is accounted by fixed investment cost followed by initial working capital (Birr
459.33 million or 17.44%) and pre operation cost (Birr 150.47 million or 5.71%). The total
annual cost of production and revenue at 100% capacity utilization (year 5) is estimated at
Birr 2.615 billion and Birr 3.006 billion respectively. The project will generate a profit
throughout its operation life. Annual net profit after tax increases from Birr 138.96 million to
Birr 493.71 million. The projected cash flow of the envisaged project shows that the project
would generate positive net cash flows throughout the operation years. Based on a 10%
discount rate the Internal Rate of Return (IRR) and Net Present Value (NPV) are computed to
be 21.85% and Birr 1.639 billion respectively, indicating the viability of the project.
The initial investment cost of the project will be fully recovered within six years, which is a
reasonably short period of time. Other measures of profitability net profit as a % of sales
revenue, net profit to equity and net profit to total investment are also attractive. The
efficiency ratios like current assets to current liabilities and net cash flow to sales calculated
from the balance sheet show that the project is highly liquid with sound financial
performance. The breakeven point for sales and capacity utilization is computed at Birr 1.103
billion and 36% which are reasonable. Moreover, the sensitivity analysis carried out indicates
that the project could be viable at adverse conditions i.e. either a decrease of 18% in sales
price or increase of 23% in production cost or an increase of 40% in investment cost. In
addition to its financial viability the project has a number of economic and social benefits.
The establishment of the project has a foreign exchange saving effect to the economy through
import substitution. Moreover, as a profitable venture it will contribute to the increase of
Regional and Federal government revenue through corporate, payroll and other taxes. The
project will create direct employment opportunities for about 222 persons. Furthermore, it

140
creates a conducive environment for the rapid growth of service and trade sectors around the
project site, which in turn create employment opportunity for a substantial number of
persons. Moreover, the project will also create forward linkage with the manufacturing
sector.

141
MINISTRY OF INDUSTRY (MoI)
X. FEASIBILITY STUDY FOR ESTABLISHMENT OF
SESAME PROCESSING PLANT

142
X. EXECUTIVE SUMMARY
1.1 Introduction
The Ministry of Industry (MoI), has commissioned Industrial Project Service (IPS) to prepare
a Feasibility Study for the Establishment of Sesame Processing (value adding) Plant. As per
the agreement between the two parties a Draft Report on Feasibility Study for the
Establishment of Sesame Processing Plant was submitted by IPS earlier. This Final Report is,
hence, prepared by IPS incorporating the comments of MOI and other stakeholders on the
Draft Report.
1.1 Analysis of the Business Environment and Incentives for Investors
As per the analysis carried out by different institutions on the political, economic, socio-
cultural and technological developments (PEST), Ethiopia offers a stable political and
economic environment as well as security; exceptional climate; almost complete absence of
routine corruption; continuously improving public service delivery which makes it potentially
an ideal destination for investment. The macro economic performance in the past seven years
has been very positive and the broad-based economic growth is expected to continue under
GTP II. Although the incentive packages that are currently given seem to be adequate the
government is planning to give additional incentives for the manufacturing sector,
particularly to export oriented and import substituting projects. Priorities will be given to the
manufacturing sector in support of provision in the areas of licensing, land and finance
allocation, training and the like.
The expansion of Universities as well as Technical, Vocational Education and Training
(TVET) in all parts of the country provides good opportunity in the supply of skilled and
semi-skilled technical personnel. Health service provision and development of infrastructures
such as roads, energy and communication are also showing a rapid improvement in the
country. advancement of science and technology in the world and the spread of same in the
country will favorably influence the smooth operation of the envisaged project. As part of the
support provided by the government to the agricultural sector, accesses to productive inputs,
such as hybrid seed and fertilizer has been expanded. The government has also established
the Ethiopian Commodity Exchange (ECX) which is a marketing institution established for
creating and running the Ethiopian commodity market in a transparent, fair and sustainable
manner that would benefit all the actors in the value chain and the country at large.
Accordingly, it can be concluded that Ethiopia is ideal for investment.

143
1.2 Market Study
1.2.1 Product Description
Sesame seed is rich in fat protein, carbohydrates, fiber and some minerals. The aroma and
taste of the seed are mild and delicious. It has nut-like slightly sweet flavor. I t is used mainly
as a food ingredient in whole, broken, crushed, shelled, powdered and paste forms. The oil is
extracted from sesame seeds is very precious and stable. It has high oil content, normally its
oil content ranges from 50 to 60 percent. The main value added products intended to be
produced from Sesame seed are:-
a) Hulled Sesame Seed
Hulled sesame is the dried, cleaned, and hulled; color sorted inner part of the seed with
consistent appearance. It is rich in fat protein, carbohydrates, fiber and some minerals. It also
has the highest oil contents of any seed. Sesame seed is rich nutty flavor, a common
ingredient in cuisines across the world. Sesame seeds are commonly added to bakery,
including bagels and the tops of hamburgers and creative confectionery across the world.
b) Hulled and Roasted Sesame Seed
Hulled and Roasted Sesame seed is produced by roasting hulled sesame seed by a
temperature 115-140 °C. It is golden color with purity of 99.97%. Hulled sesame seed is
mainly used to add texture, taste and aesthetic value to a variety of bakery products like
bread, bread sticks, cookies, sesame bars etc; and also as an additive to cereal mixes and
crackers.
c) Sesame Oil
The oil is extracted from sesame seeds is very precious and stable. It has high oil content,
normally its oil content ranges from 50 to 60 percent. Sesame oil is a stable product because
of a natural antioxidants sesamol and sesamolinol that reduce the rate of oxidation. This
character makes it preferable vegetable oil. Sesame oil is sometimes used as cooking oil in
different parts of the world, though different forms have different characteristics for high-
temperature frying. The "toasted" form of the oil (as distinguished from the "cold-pressed"

144
form) has a distinctive pleasant aroma and taste, and is used as table condiment in some
regions, especially in East Asia. Toasted sesame oil is also added to flavor soups and other
hot dishes, usually just before serving, to avoid dissipating the volatile scents too rapidly.
d) Tahini
Tahini a paste made from ground, hulled sesame seeds. Tahini is served as a dip on its own or
as a major component of hummus, baba ghanoush, and halva. Tahini-based sauces used as a
side dish or as a garnish, usually including lemon juice, salt and garlic. Tahini sauce is also a
popular topping for meat and vegetables. It is also used as a spread on bread either alone or
topped with honey or jam.
1.2.2 Local Market
a) Overview of the Performance of the Local Sesame Sub Sector
Ethiopia is one of the 51 major sesame-producing countries in the world. Ranked in terms of
the land coverage of sesame, India, Sudan, Myanmar, China, Uganda, Nigeria, Tanzania, and
Ethiopia lead the world. Based on production; India, China, Sudan, Myanmar, Uganda,
Nigeria, Ethiopia and Tanzania took the rank from the highest to the lowest. These eight
countries have produced 81.4% of the world sesame production. During the period 2002–
2012 local production of sesame shows a huge increase both in land area cropped and annual
production registering an average annual growth rate of 19.26% and 22.24% in terms of land
area covered and annual production respectively. A large number of sesame seed varieties
exist in Ethiopia. However, in the international trade, three varieties are well known: Humera,
Gondar and Wellega. The three main export varieties have their own characteristics such as
colour, oil content, and taste. Recently, sesame has become an important export commodity
of the country and has helped to derive foreign currency. Export of sesame seed during the
period 2002– 2013 exhibits a substantial growth, the average annual export which was 71,147
tons during the period 2002--2004 has increased to an average of 155,748 tons and 256,073
tons during the period 2005--2008 and 2009–2013 respectively. During the period under
consideration (2002–2013) annual export of sesame seeds has registered at an average growth
rate of 21.04% In terms of value during the period 2002--2013 export of sesame seeds has
registered an average annual growth rate of 43.02%. As a result of the exhibited concurrent
growth by 2013 the value of the country‘s sesame export has reached an all time high of Birr
8.44 billion.
145
Ethiopian sesame is among the highest quality in the world. Nevertheless, it can be concluded
that the country is not benefiting from its sesame resource potential. During the period 2009--
2013 the average unit value of sesame exported by the listed West European countries (USD
2,676/ ton) is higher by about USD 1,332/ ton or 99.07% compared to the average unit value
of sesame exported from Ethiopia (USD1,344/ton). In fact, the West European countries are
not producers of sesame. However, the West European countries have specialized in
importing raw sesame from developing countries such as Ethiopia, where the resource is
available and then processing the product (value adding) and re-exporting.
The majority of Ethiopian sesame is exported as raw seed. Accordingly, it can be concluded
that although blessed with favorable agro-climatic conditions as well as abundant land for
sesame production, currently Ethiopia is losing out on the opportunity to increase foreign
currency earnings by mainly exporting sesame seeds raw due to very limited domestic
sesame processing capacity. Therefore, developing hulling facilities and other value addition
facilities will position the country to grow its sesame market and better establish its
international market position.
1) Past Supply Trend
Hulled Sesame and Hulled and Roasted Sesame
The local demand for hulled and roasted sesame is supplied through local production. Local
production or apparent consumption of hulled sesame seed and hulled and roasted sesame
seed has increased from 1,469 tons and 163 tons in 2002, respectively to 7,346 tons and 816
tons in 2012 respectively.
Sesame Oil
Local production of sesame oil during the period 2002– 2013 exhibits a substantial growth,
the average annual local production which was 71 tons during the period 2002--2004 has
increased to an average of 175 tons and 254 tons during the period 2005-2008 and 2009–
2012 respectively. The country imports sesame seed oil from various countries. During the
period 2002--2013 import of sesame seed oil fluctuates from year to year with out any
noticeable trend. In terms of volume import ranges from the highest 841.82 tons in 2006 to
the lowest 2.32 tons in 2005. However, during the period under consideration on average the
country was importing 180 tons of sesame seed oil annually. During the same period in terms
of value the country‘s import of sesame seed oil ranges from Birr 7.33 million to Birr 48.21
thousand with a yearly average of Birr 1.20 million

146
Apparent consumption of sesame seed oil during the period 2002--2013 has increased from
47 tons to 256 tons registering an average annual growth rate of 28.02%.
3) Present Effective Local Demand
In order to estimate the current effective local demand for value added sesame products in
Ethiopia, the following methods were applied:
- parameter double exponential smoothing; and
Based on the results of test statistics the Holt‘s two parameter method is found to be the most
appropriate for all the products. Accordingly, the estimated present effective domestic
demand for each product is given below.
n
4) Trend in Factors that Affect the Local Demand for Value Added Sesame Products
The variables that are essential in determining the magnitude and trend of demand for the
product under consideration are:
population and
Accordingly, a thorough assessment of the current status and future prospect of these factors
indicates that there is a progressively growing local demand for value added sesame products.
5) Demand Projection
The local demand for hulled sesame seed is projected to increase from 12,365 tons in 2015 to
15,781 tons and 20,141 tons by the years 2020 and 2025 respectively. Moreover, by year
2030 the local demand is projected to reach 25,705 tons. The local demand for hulled and
roasted sesame seed is projected to increase from 1,374 tons in 2015 to 1,753 tons, 2,237 tons
and 2,855 tons by the years 2020, 2025 and 2030 respectively. Likewise, the local demand

147
for sesame oil is projected to increase from 454 tons in 2015 to 579 tons, 739 tons and 944
tons by the years 2020, 2025 and 2030, respectively.
1.2.3 Export Market
a) Trend in Global Production, Import and Export
During the period 2004--2013, globally, the land area cropped by sesame has increased from
7.39 million hectares to 9.38 million hectares, registering an average annual growth rate of
2.94%. During the same period on average from the total land area cropped by sesame the
largest share is accounted by India (23.32%), Myanmar (18.47%) and Sudan (18.33%).
Ethiopia is ranked 8th with an average share 3.02%.
During the same period (2004--2013) global production of sesame has increased from 3.48
million tons to 4.75 million tons registering an average annual growth rate of 3.62%. During
the period under consideration Myanmar, India and China with an average share of 19.08%,
17.12% and 15.19% are the leading producers of sesame. During the period 2004--2013,
global total export of sesame (in all forms) has increased from 833,437 tons to 1.56 million
tons, registering an average annual growth rate of about 7.83%. In terms of value global
export of sesame has increased from 717.38 million USD in 2004 to 2.46 billion USD in
2013, registering an average annual growth rate of 16.10%. During the same period, India,
which on average accounts for 21.46% of the global export, is the leading exporter of sesame,
followed by Ethiopia (17.79%), Sudan (11.86%) and Nigeria (10.42%). During the same
period (2004--2013) the estimated global export of hulled sesame, hulled and roasted sesame
and tahini has increased from 151,686 tons, 105,013 tons and 35,004 tons to 284,746 tons,
197,132 tons and 65,711 tons, respectively. During the period 2004--2013, global import of
sesame seed in terms of volume and value has increased from 944,691 tons to 1.35 million
tons and from USD 876.71 million to USD 2.60 billion, respectively, registering an average
annual growth rate of 4.26% and 16.62% in terms of volume and value respectively. During
the same period (2004--2013) the leading importers with an average share of 24.39%, 13.56%
and 8.26% were China, Japan and Turkey, respectively. The other important importers
include South Korea, USA, Taiwan, Syria and Israel which an average share of 6.20%,
3.31%, 3.30%, 3.15% and 3.13%, respectively. During the period 2004-2012, global
production of sesame oil has increased from 943,637 tons to 1.04 million tons, registering an
average annual growth rate of 1.59%. During the same period on average from the total

148
global production of sesame oil the largest share is accounted by Myanmar (26.95%), China
(19.81%) and India (10.92%).
During the period 2004--2013 global export of sesame oil, though slightly fluctuate in some
years, exhibits a general growth, increasing from 39,795 tons to 62,577 tons in terms of
volume and from USD 95.46 million to USD 227.09 million in terms of value, registering an
average annual growth rate of 6.33% and 10.53% in terms of volume and value, respectively.
During the period 2004--2013, on average from the total global import of sesame oil the
highest share is accounted by USA (25.78%), Hong Kong (6.54%), Japan (5.01%) and China
(4.03%). The other important importers of sesame oil include (in order of importance)
Malaysia, Netherlands, Mexico and Germany.
b) Present and Projected Global Demand
The present (2014) global demand for hulled sesame is estimated at 307,042 tons, which is
projected to reach 482,653 tons and 703,611 tons in years 2020 and 2025 respectively.
Moreover, by year 2030 the global demand is projected to reach 1.02 million tons. The
present global demand for hulled and roasted sesame is estimated at 212,569 tons. The global
demand for hulled and roasted sesame is projected to increase from 334,145 tons in 2020 to
487,116 tons and 710,118 tons by the years 2025 and 2030 respectively. Likewise, the global
demand for tahini is projected to increase from the present 70,856 tons to 111,382 tons,
162,373 tons and 236,707 tons by the years 2020, 2025 and 2030, respectively. The present
(2014) global demand for sesame oil is estimated at 66,538 tons, which is projected to reach
96,162 tons and 130,703 tons in years 2020 and 2025 respectively. Moreover, by year 2030
the global demand is projected to reach 177,649 tons.
c) Estimated Market Share for Locally Produced Value Added Sesame Produces
The present (2014) export demand for locally produced hulled sesame seed is estimated at
15,352 tons, which is projected to reach 24,133 tons and 35,181 tons in years 2020 and 2025
respectively. Moreover, by year 2030 the global demand for Ethiopian hulled sesame is
projected to reach 51,286 tons. The present export demand for locally produced hulled and
roasted sesame is estimated at 10,628 tons. The export demand for locally produced hulled
and roasted sesame is projected to increase from 16,707 tons in 2020 to 24,356 tons and
35,506 tons by the years 2025 and 2030 respectively. Likewise, the export demand for locally
produced tahini is projected to increase from the present 3,543 tons to 5,569 tons, 8,119 tons
and 11,835 tons by the years 2020, 2025 and 2030, respectively. The present (2014) export

149
demand for locally produced sesame oil is estimated at 3,327 tons, which is projected to
reach 4,808 tons and 6,535 tons in years 2020 and 2025 respectively. Moreover, by year 2030
the export demand for sesame oil is projected to reach 8,882 tons.
d) Total Projected Demand (Local Plus Export)
The total demand (local + export) for locally produced hulled sesame is projected to increase
from 28,919 tons in 2015 to 39,914 tons and 55,322 tons by the years 2020 and 2025
respectively. Moreover, by year 2030 the total demand is projected to reach 76,991 tons. The
total demand (local + export) for locally produced hulled and roasted sesame is projected to
increase from 12,835 tons in 2015 to 18,460 tons, 26,593 tons and 38,361 tons by the years
2020, 2025 and 2030 respectively. Likewise, the total demand for tahini, which is intended
for export ,is projected to increase from 3,820 tons in 2015 to 5,569 tons, 8,119 tons and
11,835 tons by the years 2020, 2025 and 2030, respectively. The total demand for locally
produced sesame oil is projected to increase from 3,991 tons in 2015 to 5,387 tons and 7,274
tons by the years 2020 and 2025 respectively. Moreover, by year 2030 the demand is
projected to reach 9,826 tons.
1.2.4 Marketing Mix
Product quality is one of the basic and most important marketing mixes that affect the success
of a product. The quality of value added sesame products is mainly dependent on the quality
of the raw material used. Accordingly, in order to insure the quality of the incoming raw
material the envisaged project needs to set up an effective raw material quality control
mechanism. Achieving this form of quality control requires the establishment of a test
laboratory. Moreover, the quality of value added sesame products should be assessed at
various points throughout the manufacturing process. EU markets and the USA market
demand a severe quality control. Implementation of HACCP and tracking & tracing is
necessary for access to these markets. Moreover, in the global market for value added sesame
taste is important but there is also growing interest in the conditions in which products were
made. Hence, product quality has increasingly begun to include criteria related to
environmental and socio-economic sustainability. This request can be clearly identified by
looking at market trends in Western countries. There are several organizations that are
promoting fair trade. Accordingly, getting certified by such institution is also important.
Hulled sesame and roasted sesame are traditionally packed in PP woven bags. However, two
ply and three-ply poly bags have gained some favor recently. Sesame oil and tahini can be
packed in suitable well-closed food grade tin or plastic containers. Based on the current FOB
150
price of for value added sesame products exported by India the recommended factory gate
price is shown below.
Hulled sesame, hulled and roasted sesame are an intermediate product used in the
manufacturing of other products. Accordingly, by taking the nature of the products and the
characteristics of the end users direct distribution to end users is selected as the most
appropriate distribution channel in the local market. Regarding sesame oil the product can be
distributed by selecting agents or wholesalers in major urban centers in the country. Value
added sesame products are imported by developed countries mostly through specialized
importers. Direct trade with end-users in the food industries is not possible as many end-users
do not have the means to import the products themselves (quality control, logistics, Customs).
Importers and, often, traders or agents handle this business. The envisaged project should
consider exhibiting at relevant international sesame expos in order to establish contacts with
buyers or to investigate the possibility of securing a business arrangement with a suitable
importing and distribution company or broke. The envisaged project is also recommended to
develop a website. Since, a well designed website can help the envisaged projects‘ export
venture in many ways, from promotion to customer service.
1.3 Technical Study
1.3.1 Materials and Inputs
According to ECX report, the major sesame producing regions in Ethiopia are Tigray,
Amhara, Oromia and Benshangul Gumuz which contribute more than 90% of total sesame
output. Amhara, Tigray and Oromia contributed 48.5%, 28.5% and 15% of the total
production in the year 2007/08 respectively.
A large number of sesame seed varieties exist in Ethiopia. However, in the international
trade, three varieties are well known as trade names: Humera, Gondar and Wollega. The three
main export varieties have their own characteristics such as colour, oil content, and taste. The
Humera variety is known for its aroma and sweat taste. The Humera and Gonder varieties are
suitable for bakery product. The Wollega variety is known with its high oil content. All

151
sesame seed varieties are produced during the main or meher crop season. The annual
consumption of direct raw material (sesame seed) for the different value added products is
15, 000 tons. The price of the sesame seed is Birr 27,723.50. Therefore, the total annual direct
raw material cost is Birr 415,852,564.76. The auxiliary materials required are chemical used
in sesame oil processing (Sodium hydroxide and bleaching earth) and different packaging
materials. The total cost of auxiliary materials required is Birr 13,740,645.00, out of which
Birr 12,371,209.00 is for packaging materials and the rest is for chemicals. The utilities
required for the operation of the envisaged plant are electricity, water, grease and lubricant
oils. The total annual cost of plant utility required is Birr 10,276,848.00.
1.3.2 Location, Site and Environment
Location of the envisaged sesame processing plant is selected based on a two stage location
and site selection procedures. The first stage is selection of project location based on the
critical project selection criteria. The critical project location determining factors are supply
of raw materials and inputs, access to market, availability of skilled and unskilled labour,
infrastructure such as road, electricity city and telephone line, availabilities of social
amenities – hospitals, schools, training centers and housing etc. Hence, four project locations
were identified – Tigray, Amhara, Oromia and Addis Ababa and its surrounding towns. Then
different weights are assigned to the project selection to compare the different proposed
locations. Accordingly, Addis Ababa and its surrounding towns was selected as an optimal
project site.
Then on the second stage - potential project sites are identified with in the selected project
location and an appropriate project site is selected from the alternative projects sites
proposed. The candidate project sites proposed were Bole Lemi and Qilinto Industrial Zones
of Addis Ababa region, Gelan, Dukkam, Burayyu, Sululta, and Lega Tafo from Oromia town
surrounding Addis Ababa. Finally, Sululta town which is found in the north direction from
Addis is selected as an appropriate project location for envisaged sesame processing plant.
1.3.3 Technology and Engineering
The major process in the production of value added sesame products are – sesame seed
cleaning, hulling, roasting, grinding roasted sesame and tahini making, and oil extraction.
Accordingly, the major technology and machinery required for the envisaged plant is sesame
pre-cleaning machinery and sesame handling and storage equipments, sesame hulling plant,
sesame roaster, milling and tahini formation, oil extraction and refining, packing machinery
and utilities equipment. The total cost of plant machinery and equipment is estimated to be

152
Birr 85,770,380.00 out of which USD 3,263,505.40 is for process machinery and equipment,
Birr 9,000,000.00 is for mechanical and electrical workshops, Birr 7,150,000.00 is for
vehicles and the rest Birr 1,086,766.75 is required for lab equipments. The total cost of
building and civil work and office furniture and equipment Birr 59,640,725.00 and Birr
2,109,830 is respectively.
1.3.4 Organization and Manpower
The organizational structure of the envisaged plant is constructed considering the extent of
the industry. The plant structure follows the functional organizational structure approach to
achieve operational efficiencies within a group. The plant has four department and two
services. The functional units are namely: production and technique departments, commercial
department, finance and administration departments. The two services are quality assurance
and safety service and planning and IT services. The project will have 197 employees with
annual cost of salary at full capacity operation is estimated to be Birr 13,640,625.00 annually
per month when it commence operation.
1.3.5 Implementation Plan
The implementation schedule covers the activities starting from the project evaluation and
approval up to and including the trial-run and commissioning. The complete implementation
program for the envisaged sesame processing plant is planned to take a total of 24 months.
The project operation starts with the assignment of the project manager and establishment of
the project office. It ends when detailed engineering design is completed by the
supplier/suppliers (General contractor). During this phase, HRD department manager is hired
to get adapted to the processes of the project. Other department heads are also hired during
this phase to facilitate preparatory works for later smooth operation of the envisaged project.
They shall be the core members of the project implementation team who shall recruit and
select other employees and also work as counter parts with all consultants. Then the tender
document will be floated for the civil works to be conducted by local contractors. Orders will
be placed for machinery and equipment procurement by giving priority to those items that
have to be manufactured based on the detailed design.
1.4 Financial and Economic Analysis
The financial analysis of the project (benefits and costs) is computed over seventeen years
assuming 24 months implementation period and 15 years of operation. In addition
depreciation and amortization, customs duty and income tax, repair and maintenance costs,
terminal (salvage) values as well as working capital have been worked out based on the

153
existing laws of the country and standard assumptions. Accordingly, the major findings of the
financial analyses are given below. The total investment cost of the project is estimated at
Birr 324.09 million. From the total investment cost the highest share (Birr 154.67 million or
47.72%) is accounted by fixed investment cost followed by initial working capital (Birr
103.31 million or 31.88%) and pre operation cost (Birr 66.11 million or 20.40%). The total
annual cost of production and revenue at full capacity utilization is estimated at Birr 511.75
million and Birr 585.73 million respectively. The project will generate a profit throughout its
operation life. Annual net profit after tax will increase from Birr 44.52 million during first
year of operation to Birr 76.50 million during the last year of the project life. The projected
cash flow of the envisaged project shows that the project would generate positive net cash
flows throughout the operation years. Based on a 10% discount rate the Internal Rate of
Return (IRR) and Net Present Value (NPV) are computed to are 27.90% and Birr 338.96
million respectively, indicating the viability of the project? The initial investment cost of the
project will be fully recovered within five years, which is a reasonably short period of time.
Other measures of profitability net profit as a % of sales revenue, net profit to equity and net
profit to total investment are also attractive. The efficiency ratios like current assets to current
liabilities and net cash flow to sales calculated from the balance sheet show that the project is
highly liquid with sound financial performance. The breakeven point for sales and capacity
utilization is computed at Birr 233.81 million and 44% which are reasonable. Moreover, the
sensitivity analysis carried out indicates that the project could be viable at adverse conditions
i.e. either a decrease of 12% in sales price or increase of 20% in production cost or an
increase of 50% in investment cost.
In addition to its financial viability the project has a number of economic and social benefits.
The establishment of the project has a foreign currency earning effect to the country by
exporting its products to the international market. Moreover, as a profitable venture it will
contribute to the increase of Regional and Federal government revenue through corporate,
payroll and other taxes. The project will create direct employment opportunities for about 202
persons. Furthermore, it creates a conducive environment for the rapid growth of service and
trade sectors around the project site which in turn create employment opportunity for a
substantial number of persons. Moreover, the project will also create backward linkages with
the agricultural sector.