summary of 2013-14 ohio deer seasons -...
TRANSCRIPT

Summary of 2013-14 Ohio Deer Seasons Page 1 Publication 5304 (R0914)
OUR DEER MANAGEMENT STRATEGYThe goal of Ohio’s deer program is to provide a deer population that maximizes recreational
opportunity including viewing, photographing, and hunting while minimizing conflicts with agri-culture, motor travel, and other areas of human endeavor. This has been our goal for over 50 years. Farmer attitude surveys have been used to establish population goals for most counties. Although these goals are based on social values, the resulting populations have never exceeded the biological carrying capacity of the habitat. Deer herd condition data collected annually and through periodic studies confirm this. While we believe these goals represent a reasonable compromise concerning appropriate deer population levels, we plan to update population goals using a combination of farm-er, hunter, and general citizenry surveys in summer of 2015. Our deer management goal ensures that Ohio’s deer herd is maintained at a level that is acceptable to most, and biologically sound. Maintain-ing the deer population at or near goal is accomplished through harvest management.
2013-14 SEASON SUMMARYSeasons, Permits, and Game Check
A valid hunting license (resident = $19, nonresident = $125) and an either-sex ($24) or antlerless permit ($15) are required (landowners are exempt) to hunt deer in Ohio. Hunters could harvest up to nine deer with a combination of either-sex and antlerless permits (Figure 1), however, they were limited to one antlerless permit per county. Permits were valid statewide during the first nine weeks of the archery season, as well as during all Division of Wildlife controlled hunts.
Hunters were limited to one antlered deer, and had the opportunity to hunt deer during Ohio’s four seasons including archery (Sep. 28, 2013 - Feb. 2, 2014), antlerless muzzleloader (Oct. 12-13), gun (Dec. 2-8), and muzzleloader (Jan. 4-7, 2014). Youth (17 and under) season was Nov. 23-24.
The Division of Wildlife issued 535,676 deer permits in license year 2013-14, nine percent fewer than last year and the fourth consecutive year that sales have declined (Table 1). Permit sales for 2013-14 were off by nearly 14% from the peak in 2009-10. The decreasing trend is likely due to sev-eral factors including fewer deer in many areas of the state; the statewide buck harvest of 70,100 was nearly 27% lower than the record 2006-07 antlered buck harvest (Figure 2). The other factor influenc-ing the decline is an aging hunter population. The most notable change in permit numbers was the decline in free permits issued to seniors and disabled veterans. In 2012-13, 58,498 free permits were issued to seniors and disabled veterans. This past year, this dropped to 35,606, a decline of nearly 40%. This decline may be partly a function of our decision to delay the sale of deer permits. In 2013-14, deer permits went on sale July 1st. Historically, these permits were available – along with all other permits and licenses – at the start of the license year, March 1st. The change affected only deer per-mits and would have meant another trip to the license outlet. Perhaps this discouraged some folks and contributed to the observed decline.
Summary of
2013-14 ohio Deer SeaSonSOhiO Department Of natural resOurces • DivisiOn Of WilDlife

Summary of 2013-14 Ohio Deer Seasons Page 2 Publication 5304 (R0914)
Beginning with the 2011-12 spring turkey season, licensed hunters were no longer required to present their turkey or deer at a check station for permanent tagging. Instead, both deer and turkey could be checked on-line, over the phone, or at any license vendor. Expectations were high, and for the most part, all were met or exceeded. Aside from the conveniences the Wild Ohio Customer Relationship Management System (WOCRMS) afforded our hunters and the time savings it created for DOW staff, our new license and game check system created opportunities to examine permit and harvest data in a manner that previously had been impossible or difficult at best. These new oppor-tunities have and will continue to allow us to offer products, licenses, and permit packages that best suit our customer’s needs.
For 2013-14, most hunters (77%) bought their permits in person, at a license vendor. Seniors and veterans were most likely to purchase their permits in person, with 89% of their permits bought at a license vendor. Non-residents were the most likely group to buy their permits on-line (39%).
In the 2013-14 season, 47% of deer were checked over the phone, making it the most popular method, with on-line reporting a close second at 42%. Only 11% of the deer harvest was checked in person. If you exclude deer harvested by landowners, no less than 60% of deer were checked using the phone, regardless of permit type (Figure 3). Because WOCRMS relies on a 10-digit deer permit number to operate the phone-in check, deer harvested by landowners (who are not required to purchase a permit) cannot be checked using this method. For this reason, 76% of landowner har-vests were reported on-line. Not surprisingly, because of their limited options, landowners were also more likely to complete their game check transaction at a license vendor than other hunters. Non-residents were least likely to use the internet to report their harvest, and preferred to check their deer over the phone more so than any other group.
HARVESTSummary
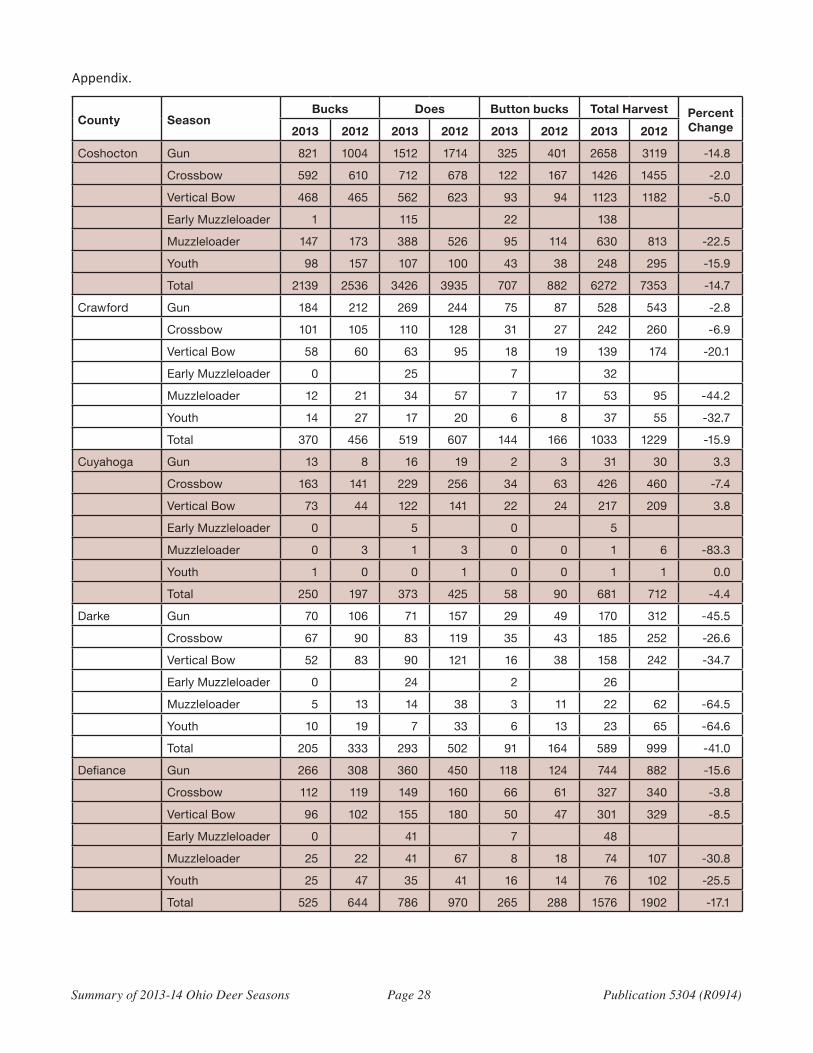
A total of 191,503 deer was harvested in the 2013-14 season, 12.5% fewer than last season (Table 2). The harvest was composed of 70,100 bucks, 99,587 does, and 21,816 button bucks. Coshocton County once again led the state in total harvest with 6,272 deer. A harvest summary by season for the top five counties is presented in Table 3, and a complete harvest summary by county and season is available in Appendix 1.
Hunters harvested 75,408 deer during the traditional statewide gun season, 13% fewer than last year (Table 2). Coshocton, Muskingum, Tuscarawas, Guernsey, and Ashtabula counties led the state in gun harvest (Table 3). These counties held the same positions last year, with the exception of Ashtabula which ranked 11th.
Archers reported harvesting 85,561 deer this year, 1% more than last season (Table 2). Archers accounted for 45% of the entire deer harvest, and for the first time in Ohio’s history, more deer were taken during archery season than the week of gun season. By comparison, just a decade ago the archery harvest accounted for just over 25% of the annual harvest (Figure 4). This shift in the harvest is likely due to the ever increasing interest and participation in archery hunting. In 1981, only one out of every three Ohio gun hunters also participated in the archery season (Figure 5). In 2013, nearly 75% of gun hunters also hunted with archery tackle.
Crossbow hunters harvested 49,041 deer this year, an increase of 4% over last season. Licking County led the state again with 1,636 deer, and Coshocton, Tuscarawas, Ashtabula, and Trumbull rounded out the top five crossbow harvest counties. This year’s vertical bow harvest (compounds, re-curves, and longbows) was 36,520 deer, 3% fewer than last year. Licking County archers led the state

Summary of 2013-14 Ohio Deer Seasons Page 3 Publication 5304 (R0914)
once again with a harvest of 1,285. This is the 7th consecutive year that Licking County has held the top spot for vertical bow harvest. Coshocton, Muskingum, and Hamilton counties again were repre-sented in the top five, but Adams replaced Tuscarawas as the county with the third highest vertical bow harvest.
In the inaugural antlerless-only early muzzleloader season, where hunters took a total of 5,608 deer, Ashtabula County hunters harvested the most (200), followed by Licking, Guernsey, Musking-um, and Knox counties. There were 16,464 deer harvested during the bitterly cold 4-day statewide muzzleloader season, a decrease of 24% from the 2012-13 harvest (Table 2). Guernsey County was again the top spot for muzzleloader hunters with a harvest of 652 deer, which was 21% fewer than last year. Coshocton, Muskingum, Tuscarawas, and Belmont counties held the 2nd, 3rd, 4th and 5th spots, respectively, just as they did last year.
Young hunters battling unseasonably cold weather took only 6,640 deer this year during the 2-day youth season, a decline of almost 28% from last year’s harvest. Top spots for youth hunters were Coshocton, Tuscarawas, Muskingum, Holmes, and Knox counties.
This past season, 63% of the harvest was antlerless. However, nearly 18% of these antlerless deer were male fawns, or button bucks. While there is no intent to minimize the accomplishment of the successful hunter, from a herd management standpoint, there is little to be gained from harvesting a button buck. With the increasing popularity of bow hunting (about 8 out of 10 Ohio deer hunters participate in the archery season) we anticipate that hunters will reduce the annual button buck har-vest. Because archers are limited to close range shots and have a four month-long season (more har-vest opportunities), bow hunters can more reliably identify button bucks and afford to pass them up without sacrificing harvest opportunities. As a group, archers in the 2013-14 season saw 17% of their antlerless harvest composed of male fawns, compared to almost 23% for the gun, muzzleloader, and youth seasons. Managing the button buck harvest presents an opportunity for hunters to continue to achieve adequate doe harvests without sacrificing opportunity. The 2013-14 button buck harvest proportion was the lowest it has been since at least 1977. This is significant considering that hunters tend to become less selective as harvest opportunities decline, as has been the case since 2009.
Non-resident HuntersNon-resident hunters accounted for 11% of the deer permits issued this year and 8% and 12% of
the total and buck harvests, respectively. The composition of the non-resident harvest was 52% ant-lered, much higher than the resident harvest which was only 34% antlered. The top 5 non-resident states (number of deer - percentage of total harvest) were Pennsylvania (2,712 - 1.4%), Michigan (1,448 - 0.8%), West Virginia (1,392 - 0.7%), North Carolina (1,129 - 0.6%), and Florida (1024 - 0.5%). Among the states taking at least 100 deer, those harvesting the most bucks as a percentage of their total harvest were West Virginia (65%), Michigan (64%), New Jersey (63%), Maryland (62%), and New York (59%). Non-residents that were most likely to harvest an antlerless deer were from Texas (67%), Canada (66%), New Hampshire (64%), Louisiana (60%), and Maine (59%). The counties with the larg-est proportion of their harvests attributable to non-residents were Adams (19.5%), Athens (17.4%), Morgan (17.4%), Pike (17.2%), and Meigs (16.1%). On the other end of the spectrum were Darke (0.8%), Putnam (0.9%), Sandusky (1.2%), Summit (1.3%), and Auglaize (1.3%) counties.
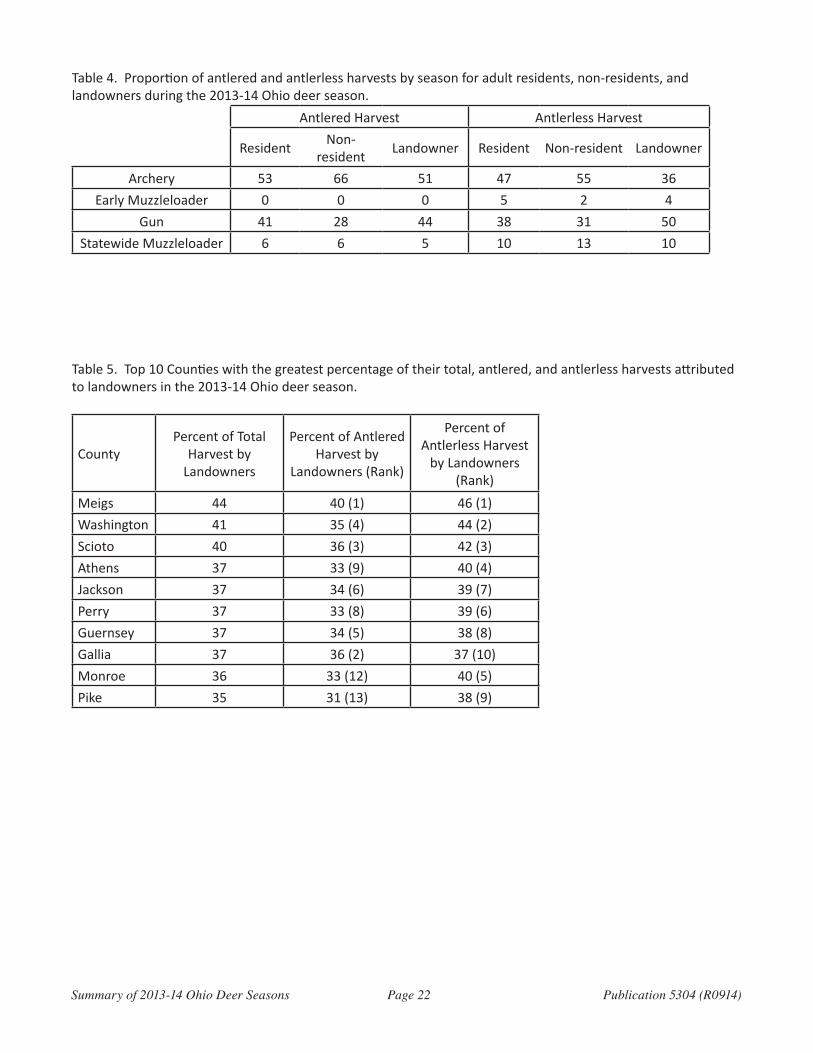
More than half (60%) of the non-resident harvest occurred during archery season, with the gun and muzzleloader seasons accounting for an additional 29% and 10%, respectively. Non-resident hunters took a larger percentage of their harvests during archery season than either residents or landowners. Sixty-six percent of the antlered and 55% of the antlerless deer harvested by non-resi-dents was taken during archery season (Table 4). Among states harvesting at least 100 deer, hunters

Summary of 2013-14 Ohio Deer Seasons Page 4 Publication 5304 (R0914)
from Louisiana took the greatest proportion of their deer during archery season (78%). The other top states for non-resident archery harvest were Massachusetts (73%), North Carolina (69%), Maine (65%), and Alabama (65%). Illinois hunters topped the list for non-residents taking the largest pro-portion of their harvest during the gun season (53%), followed by Canada (44%), Texas (39%), Indiana (38%), and Kentucky (38%).
LandownersLandowners reported harvesting 52,991 deer, nearly 28% of the total harvest. The percentage
of the statewide harvest taken by landowners has steadily increased since at least 1995 (Figure 6). Landowners harvested the majority of their deer (46%) during the gun season, 40% during archery, and 8% during the statewide muzzleloader season. Though resident and non-resident hunters harvested the greatest percentage of their antlerless deer during the archery season, landowners differed substantially, taking just over 50% of their antlerless deer during the gun season (Table 4). Landowner proportion of the total county harvest varied considerably across the state, but was greatest among southeastern counties. Meigs County led the state with landowners accounting for 44% of the total reported harvest. Landowners also accounted for a significant portion of the total harvest in Washington (41%), Scioto (39%), Athens (37%), and Jackson (37%) counties (Table 5). The counties with the smallest proportion of their harvest attributable to landowners were Cuyahoga (8%), Henry (9%), Franklin (10%), Van Wert (10%), and Marion (12%) counties.
Public LandHunters reported harvesting 17,846 deer, just over 9% of the season total, on public land. With
just over 80,000 acres of public land between the Wayne National Forest, Crown City Wildlife Area, and Dean State Forest, Lawrence County once again held the top spot for public land deer harvest. Almost 28% of the deer taken in Lawrence County were harvested on public land (Figure 7). The other top counties were Vinton (24%), Hamilton (22%), Morgan (20%), and Lucas (20%).
DEER AGE STRUCTUREIn 2013, Division of Wildlife personnel aged 6,842 deer, almost 10% of the deer harvested during
the gun season. Data was collected from 90 different processors in 51 counties. Figure 8 shows how the age structure of the antlered harvest has changed over time. Beginning in the late ‘90s, hunters began harvesting fewer yearling (1.5 year old) bucks, and the trend has continued. In the early to mid ‘80s, nearly 70% of the bucks harvested were yearlings. Today, that percentage is below 50%. A reduction of this magnitude would normally be a result of some type of regulation change, such as antler point restrictions. In our case, the decline in yearling buck harvest is likely due to at least two factors. First, the growth of the deer herd over time, coupled with very liberal antlerless harvest opportunities likely reduced the pressure on the antlered segment of the population. Second, and most importantly, Ohio hunters seem to be aware of the benefits of allowing bucks to mature, and have acted on their own “self-imposed” restrictions.
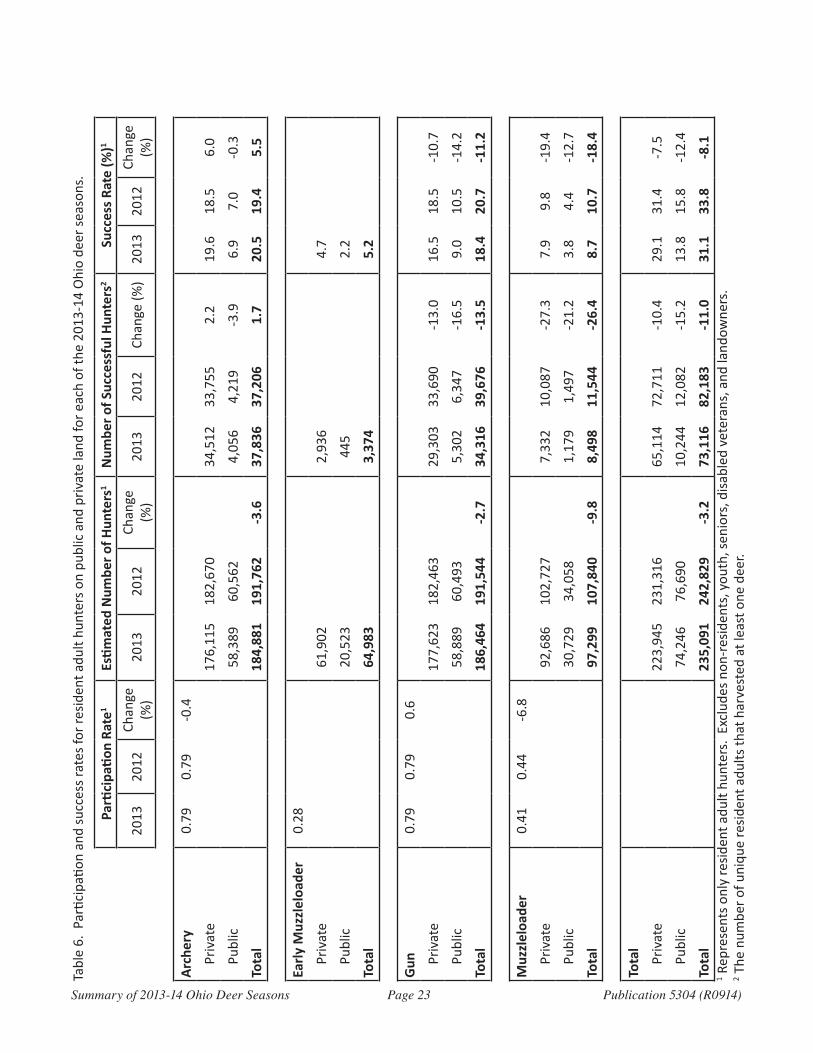
HUNTER SUCCESS, PARTICIPATION RATES, AND EFFORTThis year, 235,091 resident adults purchased at least one either-sex or antlerless-only permit and
73,116 harvested at least one deer, for a 31% hunter success rate (Table 6). In our 2012 annual deer hunter survey, 32% and 95% of hunters reported spending some time hunting public and private land, respectively. Applying these rates to our population of licensed adult hunters for the current season, we find that approximately 74,000 and 224,000 hunters hunted at least once on public and private land, respectively, during the 2013-14 season. This year, 10,244 and 65,114 and hunters reported taking a deer on public (14% success) and private (29% success) land, respectively. Because

Summary of 2013-14 Ohio Deer Seasons Page 5 Publication 5304 (R0914)
our deer hunter surveys are limited to resident adult hunters, rates may be different for non-resident hunters, as well as youth, disabled vets, free and reduced cost seniors, and landowners.
During the 2013-14 season, nearly 80% of hunters bowhunted, while 28%, 79% and 41% reported hunting in the antlerless muzzleloader, gun, and muzzleloader seasons, respectively (Figure 9). One in five archery hunters were successful, and success rates with archery tackle were nearly three times higher on private than public land (Table 6). Archers were a bit more successful this year compared to last. Overall success rate during the gun season was nearly the same as archery, with nearly one in five gun hunters reporting a deer harvest. Success rates on private land were almost double those on public land. When considering the archery and gun success rates, it is important to remember that these are very much dependent upon each other. Recall that nearly 75% of our gun hunters will bow hunt for nine weeks before gun season. Moreover, many also hunt the statewide muzzleloader season. Success with archery tackle and the appeal of hunting with a muzzleloader in January un-doubtedly contribute to lower success rates during the statewide gun season. Because most hunters participate in multiple seasons, season-specific success rates must be viewed with some caution.
Gun and muzzleloader success rates were down considerably compared to 2012. Though smaller deer populations likely contributed to the observed decline, season length undoubtedly makes the gun and muzzleloader seasons more susceptible to the effects of weather. In many parts of the state, gun and muzzleloader hunters experienced abnormally foul weather, likely leading to both lower participation and success rates.
Over the past three seasons, there has been a steady decline in the number of deer taken per hunter. In 2011, 243,126 resident adults harvested 117,988 deer, or 0.49 deer per hunter. This figure declined to 0.47 in 2012, and in 2013 there were 0.42 deer harvested per resident adult. Similarly, there has also been a steady decline in the number of deer taken by successful hunters. In 2011, successful hunters averaged harvesting 1.41 deer. In 2012, this number dropped slightly to 1.40, and again in 2013 to 1.36 deer (Figure 10).
In spite of large deer populations and liberal bag limits, only 18% of successful hunters harvested two or more deer in the 2006 season. This changed dramatically with the introduction of the $15 antlerless permit during the 2007-08 season. From 2007 to 2011, there was a steady increase in the percentage of successful hunters harvesting two or more deer, reaching an all-time high in 2011 at about 27% (Figure 11). This percentage declined in small increments in 2012 and 2013, likely due to the reduction in the size of the deer population and bag limits.
Most hunters harvesting more than one deer only harvested two. This year, 19% of successful hunters bagged two deer, 5% harvested three, and only 1% took four or more deer (Figure 12). Of important note is, even though bag limits have been largely unlimited (statewide bag in 2011 and 2012 was 18, 2013 it was 9), fewer than 1 in 500 hunters harvested five or more deer in any given year, and specifically in 2013, only 1 out of 1,000 hunters tagged five or more deer.
Figure 13 shows how the number of deer harvested per successful hunter has changed over time. In 2006, almost 82% of hunters harvesting more than one deer only harvested two, and only 2% took more than three. By 2011 only 70% of multiple-harvest hunters took two deer and almost 10% bagged more than three. As deer populations have been reduced closer to goal, the percentage of multiple-harvest hunters taking only two deer has risen. Likewise, the number of hunters taking three or more deer declined in 2012 and 2013. Specifically for the 2013-14 season, 75% of hunters harvesting multiple deer only bagged two, 19% took three, and 6% harvested four or more (Figure 13).

Summary of 2013-14 Ohio Deer Seasons Page 6 Publication 5304 (R0914)
Over the past three years, hunters have averaged 19.9 days afield. Archers have been the most consistent, spending 19.3, 19.2, and 19.7 days afield during the 2011, 2012, and 2013 seasons, respec-tively. The number of days spent hunting during gun season has declined slightly from 4.0 in 2011 and 3.9 in 2012, to 3.7 in 2013. Hunters spent fewer days hunting the statewide muzzleloader season as well; they hunted 2.4 days in 2011, 2.2 days in 2012, and 2.0 days in 2013 (Table 7). As compared to the results of a 2001-02 deer hunter survey, the average number of days spent hunting during the archery season in 2013 declined by about one day, the number of gun days has remained stable, and the number of days spent hunting the statewide muzzleloader season has declined slightly. How-ever, because more hunters are now likely to participate in multiple seasons, the average number of days spent hunting across the entire deer season has increased by about 2.5 days since 2001.
DEER DAMAGEBecause population goals for most of Ohio’s rural counties are based on farmer tolerances, the
likelihood of widespread agricultural problems should be minimal when deer populations are at or near goal. However, some localized damage is still likely to occur where hunter access is limited. In situations where deer need to be killed to reduce property damage, landowners/lessees may be issued Deer Damage Control Permits (DDCP) at the time the damage is occurring to kill deer during the dates and under the conditions specified on the permit. For most agricultural problems, these permits will only be valid from January 1 until the start of the archery season. Under limited circum-stances permits may be extended until the start of the youth gun season. In specific circumstances, permits may be valid year-round to control damage at orchards, nurseries, inside municipalities, and for safety purposes at airports. Regardless of the situation, DDCPs expire no later than December 31 the year they are issued. Except in the case of rub damage to trees, permit holders are strongly en-couraged to kill antlerless deer. Permit holders must surrender all antlers to the Division of Wildlife. In 2013, a total of 1,177 crop damage complaints was received by the Division of Wildlife, 9.3% fewer than the previous year (Figure 14). This is the fourth year in a row that both the number of com-plaints received and the number of deer killed on damage permits have declined. Out of the 1,177 complaints received, the Division of Wildlife issued permits in 1,135 cases. In 2013, these Deer Dam-age Control Permits resulted in 4,923 deer killed, 431 fewer than the 2012 season.
LOOKING BACKThe 2013-14 season was certainly a year of change. After an unprecedented 6-year run of stable
hunting regulations, the 2013-14 season saw more significant regulation changes than is typical for an entire decade. First, legal shooting hours were extended to one-half hour past sunset dur-ing all firearms seasons. There was no reported safety issues associated with this change and har-vest records indicate that a little over 3,100 deer were harvested during the week of gun season in the 30 minutes after sunset. With this change, Ohio joins at least 33 other states where it is legal to hunt with a firearm during the half hour after sunset. The other notable change was the addition of the 2-day antlerless-only muzzleloader season that took place the second weekend in October. We estimated that more than 60,000 hunters participated in the season and harvested 5,608 deer, well within the preseason forecast of 5,000-8,000 deer.
2014-15 SEASON PREVIEWBackground and Justification
Compared to the 2013-14 season, the 2014-15 season will be relatively quiet in terms of regula-tion changes. Changes to look for include the addition of straight-walled cartridge rifles to the list of legal deer hunting implements and restrictions on the use of the $15 antlerless permit. In response

Summary of 2013-14 Ohio Deer Seasons Page 7 Publication 5304 (R0914)
to overwhelming public support, straight-walled cartridge rifles will be legal for use during the youth and statewide gun seasons. Be sure and check the hunting digest for a list of legal calibers.
The Division of Wildlife remains committed to providing quality deer now and into the future. To accomplish this, we must harvest an adequate number of does each year to maintain the herd at a level that is not only socially acceptable to most, but that the habitat is capable of supporting in good to excellent condition. Through a combination of liberal bag limits, reduced cost antlerless permits, and other programmatic changes, including education on the importance of an adequate doe harvest, we have successfully moved deer populations in most counties to, or very near, estab-lished goals. In response to the population declines, and to prevent populations from dropping below goal, bag limits have been reduced in 44 counties. In 29 counties where we believe additional antlerless harvest reductions are warranted, we have opted to discontinue using the antlerless-only permit. The removal of the antlerless-only permit is designed to ease harvest pressure on antlerless deer. Though the bag limit in some of these counties will not change, we believe the removal of the antlerless-permit in these counties will likely have a greater impact on the antlerless harvest than a bag limit reduction.
Antlerless Permit Restrictions – The antlerless permit was introduced in 2007 as a tool to increase harvest pressure on antlerless deer and reduce populations. To that end, we have been very suc-cessful in many areas of the state. Now that populations are at or nearing goal in most counties, the antlerless permit is no longer needed. Without restrictions on its use, deer herds would continue to decline. Success will depend on our ability to modify hunter behavior through this permitting change. The change will not affect hunters that buy only one deer permit (about two-thirds of our hunters), as the vast majority of single-permit buyers purchase an either-sex permit, not the $15 antlerless permit. However, it does have the potential to affect about two-thirds of the hunters that buy multiple permits. Those hunters that purchase multiple permits have two choices: buy multiple either-sex permits, or buy a combination of either-sex and antlerless-only permits. In the 2013-14 season, there were twice as many hunters that bought a combination of either-sex and antlerless-on-ly permits compared to those that purchased only either-sex permits. More importantly, those com-bination permit buyers were more than twice as likely to purchase multiple permits at the same time as compared to either-sex only hunters. In other words, the buying habits of hunters purchasing a combination of either-sex and antlerless-only permits commit them to harvesting multiple deer from the start. On the other hand, the majority of hunters that buy only either-sex permits adopt a “fill and buy approach”, where they only purchase one permit at a time, fill it, and then decide whether they will buy another permit to continue hunting. Because of the one-at-a-time purchasing pattern exhibited by either-sex permit holders, they are never committed to harvesting more than one deer. Moreover, if their first deer is a buck, chances are good that they will be done hunting for the year, as they are not likely to purchase another permit to hunt antlerless deer. By removing the antlerless permit, hunters that historically bought multiple permits at the same time may alter their permit purchasing tendencies and buy only one permit at a time. Hunters that have grown accustomed to using the $15 antlerless permit will likely decide to buy fewer permits, which will lead to the intended goal of a reduced antlerless harvest.
Early Muzzleloader Antlerless-Only Season – Some hunters voiced their displeasure with the early muzzleloader season during the 2014-15 public comment period. Although open house attendees typically only represent a small fraction of Ohio’s hunters, their concerns are valid all the same. For this reason, it is important to discuss the justification for keeping this weekend a part of the 2014-2015 deer season.

Summary of 2013-14 Ohio Deer Seasons Page 8 Publication 5304 (R0914)
The first common criticism of the early muzzleloader season was, “It causes deer to become noc-turnal.” The most logical way to determine if this is true would be to monitor the movements of deer before, during, and after the early muzzleloader season. This would be a costly venture and likely take several years of data collection, but fortunately the Pennsylvania Game Commission conducted research on this very topic about a decade ago. Just like Ohio, Pennsylvania has an October muzzle-loader season (though it is a week-long season rather than two days) and researchers placed GPS collars on antlered bucks to see what effect the season had on their movement patterns. Not surpris-ingly the majority of buck movement was right at daylight or dusk, and continued through the night hours for each time period (Figure 15). Most notably, the study showed that bucks moved just as much, or even a bit more, during daylight after the early muzzleloader season as they did before or during it.
The second concern raised by hunters was that the early muzzleloader season would lower bow-hunting success, and, ultimately, archery harvest. The harvest data tell a different story. The 2013-14 season started out slow, and after the first day of the season, archers had harvested 10% fewer bucks than they had in 2012. By day 16, the day after the conclusion of the early muzzleloader season, archers had harvested 31% fewer bucks than last year. However, by the 33rd day of the season, bow hunters made up for lost ground and actually surpassed the 2012 harvest. Two other significant statistics point to a great year for archers. While the harvest was down for all of our firearms seasons, the archery buck harvest was 2% higher than the 2012 season, and this past year’s archery harvest ac-counted for a record 45% of the total harvest!
A third concern of archers was the fact that they were limited to only antlerless deer that weekend. For a host of biological as well as sociological reasons, the intent of the early muzzleloader season, as well as the antlerless-only permit, was to shift the harvest of antlerless deer earlier in the season. Hunters are apt to hunt more and harvest again if their first deer is early and antlerless. If archers were allowed the option of either-sex during this 2-day season, it would likely diminish the effective-ness of this important management tool. Inevitably, muzzleloader hunters would want an either-sex option as well, or they would just switch to using archery equipment. If this were to happen, the season would undoubtedly lose its effectiveness. The second weekend in October was purposefully chosen for the antlerless-only season because, historically, this weekend has produced fewer buck harvests than any other early season weekend. On average, about 2,000 deer (less than 1% of the season’s harvest) were harvested on this particular weekend, and, of those 2,000 deer, only about 25% of them were bucks. Bow hunters in Ohio enjoy one of the longest archery seasons in the coun-try, and they are being asked to make a very small sacrifice for the betterment of Ohio’s deer manage-ment program as a whole.
Finally, a common misconception held by some was that few hunters even liked the season. In the inaugural early muzzleloader season, 5,608 deer were harvested. If we assume a 10% success rate, there were an estimated 56,000 muzzleloader hunters in the woods on the second weekend of Oc-tober this past year. On that same weekend, archers reported harvesting 945 deer. Using the same success rate adds an estimated 9,500 archers, for an estimated total of 65,500 hunters that hunted during the third weekend of the 2013 season. In 2012, with no early muzzleloader season, 2,304 deer were harvested by archers the 3rd weekend of the season, which equates to about 23,000 hunters. Compared to the same weekend in the 2012 season, the early muzzleloader season resulted in hunt-ing opportunity for nearly 3 times as many hunters in 2013!
The timing of this antlerless-only season is consistent with the Division of Wildlife’s emphasis on the importance of harvesting antlerless deer early in the hunting season. There are multiple ben-efits to harvesting an antlerless deer early in the season versus later in the year: it is more biologi-
Summary of 2013-14 Ohio Deer Seasons Page 9 Publication 5304 (R0914)
cally sound, it is easier to differentiate between button bucks and adult does early in the season, and balancing the sex ratio of the herd early in the season can intensify rutting activity. Harvesting an antlerless deer early in the season allows the resources that deer would have consumed over the course of the season to be available to the surviving herd later in winter. A deer’s diet varies through-out the year, but on average, a 150 pound deer in good condition will eat 10-12 pounds of forage per day. So, if a hunter chose to pass on a doe on October 1, but harvested that same doe on January 1, it would have consumed food resources for an additional 3 months, totaling about 900 pounds of forage! A January harvest means those 900 pounds of resources consumed between October and January were not available to benefit those deer that survive the season. On the other hand, if the doe would have been harvested with the first opportunity in October, those resources it would have consumed throughout the season would be available to other deer. Deer surviving the season would be able to put these resources to good use by improving their body condition for the winter and fol-lowing year, eventually translating into bigger body sizes, better reproductive potential, and larger antlers.
Not only is an early harvest more biologically sound, but because buck fawns are still relatively small compared to mature does early in the season, the difference in body size makes it easier for hunters to avoid mistaking a button buck for a doe. Later in the season, button bucks may be nearly as big as adult does, making identification much more difficult, and mistakes much more likely. Finally, taking does before the onset of the rut can positively affect the sex ratio of the population, increasing the amount of competition during the breeding season. This can cause bucks to be more visible during the peak of the rut, displaying more intense rutting behaviors, which translates into a better experience for deer hunters.
Season ForecastAttempts to reduce deer herds to goal have been largely successful. Therefore, to avoid further
population declines and to stabilize herd numbers, further reductions in bag limits and antlerless harvest opportunities are in order for the 2014-2015 season. Reducing bag limits in 44 counties, along with the removal of the antlerless-only permit in 29 counties, should contribute to a reduced total statewide harvest this season to somewhere between 180,000 – 185,000 deer. The buck har-vest, largely unaffected by regulation changes and more representative of the size of the population should be similar to last year’s harvest of 70,100.

Summary of 2013-14 Ohio Deer Seasons Page 10 Publication 5304 (R0914)
Figure 1. Ohio’s 2013-14 deer zones and permit structure.
Season Opening Date Closing Date
Archery Season Sept 28, 2013 Feb 2, 2014
Antlerless Deer Muzzleloader Season Oct 12, 2013 Oct 13, 2013
Youth Gun Season Nov 23, 2013 Nov 24, 2013
Gun Season Dec 2, 2013 Dec 8, 2013
Muzzleloader Season Jan 4, 2014 Jan 7, 2014
DEER SEASONS AND BAG LIMIT MAPTHE TOTAL BAG LIMIT IS NINE (9) WITH NO MORE THAN ONE (1) ANTLERED DEER.
YOU CANNOT EXCEED AN INDIVIDUAL COUNTY BAG LIMIT.
Williams
Defiance Henry
Ottawa
LucasFulton
Sandusky
Paulding
Putnam Hancock
Seneca Huron
Erie
RichlandCrawford
Morrow
Delaware
MercerAuglaize
ShelbyLogan
Darke
MiamiChampaign
Hardin
Wyandot
Madison
Union
Marion
Van Wert
Allen
Clark
Preble Montgomery
Greene
Fayette
Warren
ClintonButler
HighlandHamilton
Clermont
AdamsBrown
WoodLorain
Cuyahoga
AshlandWayne
Holmes
KnoxCoshocton
Muskingum
Licking
Franklin
Geauga
LakeAshtabula
Stark
Columbiana
Carroll
TuscarawasHarrison
BelmontGuernsey
Pickaway
Ross
FairfieldPerry
Morgan
Noble Monroe
Washington
Athens
Vinton
Jefferson
Hocking
Pike
Scioto
JacksonMeigs
Gallia
Lawrence
MedinaSummit
Portage
Mahoning
Trumbull
2 One (1) either-sex permit and one (1) antlerless permit 3 Two (2) either-sex permits
and one (1) antlerless permit 4 Three (3) either-sex permits and one (1) antlerless permit
2-DEER COUNTIES 3-DEER COUNTIES 4-DEER COUNTIESA hunter may kill no more than two (2) deer in a 2-deer county during the 2013-2014 season.
A hunter may kill no more than three (3) deer in a 3-deer county during the 2013-2014 season.
A hunter may kill no more than four (4) deer in a 4-deer county during the 2013-2014 season.
No more than one (1) with an either-sex permit and no more than one (1) with an antlerless permit
No more than two (2) with an either-sex permit and no more than one (1) with an antlerless permit
No more than three (3) with an either-sex permit and no more than one (1) with an antlerless permit

Summary of 2013-14 Ohio Deer Seasons Page 11 Publication 5304 (R0914)
Figure 2. Ohio statewide antlered buck harvest, 1977 – 2013.
Figure 3. Percent of harvested deer that were reported over the phone, on the internet, or at a license vendor in Ohio during the 2013-14 season. Landowners are not able to use the phone to record their harvest.

Summary of 2013-14 Ohio Deer Seasons Page 12 Publication 5304 (R0914)
Figure 4. Percent of the total annual Ohio deer harvest taken during the gun and archery seasons, 1977 – 2013.

Summary of 2013-14 Ohio Deer Seasons Page 13 Publication 5304 (R0914)
Figure 5. Percent of Ohio gun hunters that also participated in the archery season, select years 1981 – present.
Figure 6. Percent of the total harvest attributed to landowners, 1995 – 2013.

Summary of 2013-14 Ohio Deer Seasons Page 14 Publication 5304 (R0914)
Figure 7. Percent of county harvests taken on public land during the 2013-14 Ohio deer season.

Summary of 2013-14 Ohio Deer Seasons Page 15 Publication 5304 (R0914)
Figure 8. Trends in the age structure of harvested antlered bucks, 1980 – 2013.
Figure 9. Hunter participation rates for the 2013-14 Ohio deer season. EML = Early Antlerless-only Muzzleloader, ML = January Muzzleloader.

Summary of 2013-14 Ohio Deer Seasons Page 16 Publication 5304 (R0914)
Figure 10. Average number of deer taken per hunter and per successful hunter, 2011 – 2013.

Summary of 2013-14 Ohio Deer Seasons Page 17 Publication 5304 (R0914)
Figure 11. Percent of successful hunters harvesting two or more deer in Ohio, 2006 – 2013.
Figure 12. Percent of successful hunters taking one, two, three, or more than three deer during the 2013-14 season.

Summary of 2013-14 Ohio Deer Seasons Page 18 Publication 5304 (R0914)
Figure 13. Percent of multiple-harvest hunters that bagged two, three, four, or five or more deer during the 2006, 2008, and 2011 – 2013 seasons.
Figure 14. Number of complaints of deer damage and the number of deer killed on DDCPs in Ohio, 1999 – 2013.

Summary of 2013-14 Ohio Deer Seasons Page 19 Publication 5304 (R0914)
Figure 15. Median distances moved by antlered deer during 2-hour time intervals the week before, during, and after the October muzzleloader season in Pennsylvania, 2002 – 2004.

Summary of 2013-14 Ohio Deer Seasons Page 20 Publication 5304 (R0914)
Table 1. Ohio deer permits issued 2007 – 2013.
YearPermit
TotalYouth Either-Sex Antlerless-only
2007-08 65,647 411,522 101,197 578,366
2008-09 67,338 396,704 147,400 611,442
2009-10 67,828 394,620 162,460 624,908
2010-11 66,300 380,462 162,655 609,417
2011-12 62,864 377,302 163,383 603,549
2012-13 64,634 397,333 126,918 588,885
2013-14 60,961 373,315 101,400 535,676
Table 2. Ohio’s 2013-14 buck, doe, button buck, and total harvest by season.
Bucks Does Buttons Total
2013 2012 2013 2012 2013 2012 2013 2012 Change (%)
Gun 26,349 31,221 39,838 44,937 9,221 10,805 75,408 86,963 -13.3
Archery
Crossbow 20,957 19,934 22,935 21,826 5,149 5,258 49,041 47,018 4.3
Vertical Bow 14,723 14,840 18,357 19,015 3,440 3,770 36,520 37,625 -2.9
Archery Total 35,680 34,774 41,292 40,841 8,589 9,028 85,561 84,643 1.1
Muzzleloader
Early Antlerless Only 69 4,655 884 5,608
Late Statewide 4,352 5,411 10,141 13,379 1,971 2,765 16,464 21,555 -23.6
Muzzleloader Total 4,421 5,537 14,796 13,540 2,855 2,792 22,072 21,869 1.8
Youth 3,043 4,671 2,671 3,306 926 1,201 6,640 9,178 -27.7
Total 70,100* 81,149 99,587 111,820 21,816 25,941 191,503 218,910 -12.5
*Includes 1,884 bucks with antlers less than three inches in length and 933 shed bucks.

Summary of 2013-14 Ohio Deer Seasons Page 21 Publication 5304 (R0914)
Table 3. Ohio’s buck, doe, button buck, and total harvest by season for the top five counties.
Season County Bucks* Does Buttons TotalRank
2013 2012
Gun
Coshocton 821 1,512 325 2,658 1 1
Muskingum 888 1,412 304 2,604 2 2
Tuscarawas 783 1,501 320 2,604 3 3
Guernsey 785 1,320 296 2,401 4 4
Ashtabula 698 1,322 314 2,334 5 11
Crossbow
Licking 660 800 176 1,636 1 1
Coshocton 592 712 122 1,426 2 2
Tuscarawas 507 633 133 1,273 3 3
Ashtabula 469 601 195 1,265 4 4
Trumbull 462 553 179 1,194 5 11
Vertical Bow
Licking 526 668 91 1,285 1 1
Coshocton 468 562 93 1,123 2 2
Adams 420 513 73 1,006 3 8
Muskingum 445 464 53 962 4 4
Hamilton 278 543 102 923 5 5
Early Muzzleloader
Ashtabula 0 160 40 200 1
Licking 3 143 18 164 2
Guernsey 3 117 24 144 3
Muskingum 2 128 13 143 4
Knox 0 118 23 141 5
Muzzleloader
Guernsey 167 397 88 652 1 1
Coshocton 147 388 95 630 2 2
Muskingum 162 365 66 593 3 4
Tuscarawas 141 375 76 592 4 3
Belmont 153 357 51 561 5 5
Youth
Coshocton 98 107 43 248 1 2
Tuscarawas 98 77 45 220 2 1
Muskingum 106 81 25 212 3 3
Holmes 83 80 33 196 4 6
Knox 76 85 28 189 5 5
Total
Coshocton 2,139 3,426 707 6,272 1 1
Tuscarawas 1,925 3,195 654 5,774 2 3
Licking 2,048 3,043 620 5,711 3 2
Muskingum 2,095 2,911 541 5,547 4 4
Guernsey 1,878 2,849 581 5,308 5 5
*Includes bucks with antlers less than three inches in length and shed bucks.
Summary of 2013-14 Ohio Deer Seasons Page 22 Publication 5304 (R0914)
Table 4. Proportion of antlered and antlerless harvests by season for adult residents, non-residents, and landowners during the 2013-14 Ohio deer season.
Antlered Harvest Antlerless Harvest
ResidentNon-
residentLandowner Resident Non-resident Landowner
Archery 53 66 51 47 55 36
Early Muzzleloader 0 0 0 5 2 4
Gun 41 28 44 38 31 50
Statewide Muzzleloader 6 6 5 10 13 10
Table 5. Top 10 Counties with the greatest percentage of their total, antlered, and antlerless harvests attributed to landowners in the 2013-14 Ohio deer season.
CountyPercent of Total
Harvest by Landowners
Percent of Antlered Harvest by
Landowners (Rank)
Percent of Antlerless Harvest
by Landowners (Rank)
Meigs 44 40 (1) 46 (1)
Washington 41 35 (4) 44 (2)
Scioto 40 36 (3) 42 (3)
Athens 37 33 (9) 40 (4)
Jackson 37 34 (6) 39 (7)
Perry 37 33 (8) 39 (6)
Guernsey 37 34 (5) 38 (8)
Gallia 37 36 (2) 37 (10)
Monroe 36 33 (12) 40 (5)
Pike 35 31 (13) 38 (9)
Summary of 2013-14 Ohio Deer Seasons Page 23 Publication 5304 (R0914)
Tabl
e 6.
Par
ticip
ation
and
suc
cess
rate
s fo
r re
side
nt a
dult
hunt
ers
on p
ublic
and
pri
vate
land
for
each
of t
he 2
013-
14 O
hio
deer
sea
sons
.
Parti
cipa
tion
Rat
e1Es
tim
ated
Num
ber
of H
unte
rs1
Num
ber
of S
ucce
ssfu
l Hun
ters
2Su
cces
s Ra
te (%
)1
2013
2012
Chan
ge
(%)
2013
2012
Chan
ge
(%)
2013
2012
Chan
ge (%
)20
1320
12Ch
ange
(%
)
Arc
hery
0.79
0.79
-0.4
P
riva
te17
6,11
518
2,67
034
,512
33,7
552.
219
.618
.56.
0
P
ublic
58,3
8960
,562
4,05
64,
219
-3.9
6.9
7.0
-0.3
Tota
l18
4,88
119
1,76
2-3
.637
,836
37,2
061.
720
.519
.45.
5
Earl
y M
uzzl
eloa
der
0.28
P
riva
te61
,902
2,93
64.
7
P
ublic
20,5
2344
52.
2
Tota
l64
,983
3,37
45.
2
Gun
0.79
0.79
0.6
P
riva
te17
7,62
318
2,46
329
,303
33,6
90-1
3.0
16.5
18.5
-10.
7
P
ublic
58,8
8960
,493
5,30
26,
347
-16.
59.
010
.5-1
4.2
Tota
l18
6,46
419
1,54
4-2
.734
,316
39,6
76-1
3.5
18.4
20.7
-11.
2
Muz
zlel
oade
r0.
410.
44-6
.8
P
riva
te92
,686
102,
727
7,33
210
,087
-27.
37.
99.
8-1
9.4
P
ublic
30,7
2934
,058
1,17
91,
497
-21.
23.
84.
4-1
2.7
Tota
l97
,299
107,
840
-9.8
8,49
811
,544
-26.
48.
710
.7-1
8.4
Tota
l
P
riva
te22
3,94
523
1,31
665
,114
72,7
11-1
0.4
29.1
31.4
-7.5
P
ublic
74,2
4676
,690
10,2
4412
,082
-15.
213
.815
.8-1
2.4
Tota
l23
5,09
124
2,82
9-3
.273
,116
82,1
83-1
1.0
31.1
33.8
-8.1
1 Rep
rese
nts
only
resi
dent
adu
lt hu
nter
s. E
xclu
des
non-
resi
dent
s, y
outh
, sen
iors
, dis
able
d ve
tera
ns, a
nd la
ndow
ners
.2 T
he n
umbe
r of
uni
que
resi
dent
adu
lts th
at h
arve
sted
at l
east
one
dee
r.

Summary of 2013-14 Ohio Deer Seasons Page 24 Publication 5304 (R0914)
Table 7. Average number of days spent hunting in each of the 2001, 2011, 2012, and 2013 Ohio deer seasons.
2001 2011 2012 2013
Archery 20.8 19.3 19.2 19.7
Early Muzzleloader 1.6
Gun 3.8 4.0 3.9 3.7
Bonus Gun 1.6 1.5
Statewide Muzzleloader 2.8 2.4 2.2 2.0
All Seasons 17.3 19.9 20.0 19.7

Summary of 2013-14 Ohio Deer Seasons Page 25 Publication 5304 (R0914)
County SeasonBucks Does Button bucks Total Harvest Percent
Change2013 2012 2013 2012 2013 2012 2013 2012
Adams Gun 469 575 738 813 136 166 1343 1554 -13.6
Crossbow 380 361 449 400 69 63 898 824 9.0
Vertical Bow 420 418 513 420 73 72 1006 910 10.5
Early Muzzleloader 2 116 17 135
Muzzleloader 94 115 172 202 30 30 296 347 -14.7
Youth 78 109 52 45 18 24 148 178 -16.9
Total 1452 1671 2049 2047 348 379 3849 4097 -6.1
Allen Gun 132 132 185 196 63 65 380 393 -3.3
Crossbow 99 105 133 122 37 40 269 267 0.7
Vertical Bow 99 84 125 117 46 39 270 240 12.5
Early Muzzleloader 1 36 9 46
Muzzleloader 14 23 26 49 6 16 46 88 -47.7
Youth 18 22 14 12 3 6 35 40 -12.5
Total 364 390 528 537 165 179 1057 1106 -4.4
Ashland Gun 367 439 630 634 165 167 1162 1240 -6.3
Crossbow 304 278 345 322 77 90 726 690 5.2
Vertical Bow 200 189 251 250 46 59 497 498 -0.2
Early Muzzleloader 0 90 21 111
Muzzleloader 63 58 180 212 40 40 283 310 -8.7
Youth 58 70 46 61 18 21 122 152 -19.7
Total 1000 1104 1563 1604 370 416 2933 3124 -6.1
Ashtabula Gun 698 654 1322 1099 314 299 2334 2052 13.7
Crossbow 469 481 601 568 195 150 1265 1199 5.5
Vertical Bow 234 218 390 411 109 87 733 716 2.4
Early Muzzleloader 0 160 40 200
Muzzleloader 71 86 182 261 60 75 313 422 -25.8
Youth 42 68 45 65 25 33 112 166 -32.5
Total 1522 1605 2714 2620 746 702 4982 4927 1.1
Athens Gun 592 704 957 1081 196 198 1745 1983 -12.0
Crossbow 336 320 301 280 59 62 696 662 5.1
Vertical Bow 397 364 404 340 57 56 858 760 12.9
Early Muzzleloader 4 102 11 117
Muzzleloader 121 118 314 335 50 57 485 510 -4.9
Youth 65 94 49 52 13 15 127 161 -21.1
Total 1525 1678 2139 2261 389 416 4053 4355 -6.9
Appendix.

Summary of 2013-14 Ohio Deer Seasons Page 26 Publication 5304 (R0914)
County SeasonBucks Does Button bucks Total Harvest Percent
Change2013 2012 2013 2012 2013 2012 2013 2012
Auglaize Gun 96 128 153 186 50 48 299 362 -17.4
Crossbow 85 90 87 107 28 31 200 228 -12.3
Vertical Bow 54 72 81 93 32 29 167 194 -13.9
Early Muzzleloader 0 32 7 39
Muzzleloader 8 14 30 30 3 7 41 51 -19.6
Youth 12 24 22 22 6 10 40 56 -28.6
Total 256 354 407 486 126 141 789 981 -19.6
Belmont Gun 639 817 1037 1101 175 209 1851 2127 -13.0
Crossbow 387 342 338 330 44 36 769 708 8.6
Vertical Bow 216 205 237 266 22 29 475 500 -5.0
Early Muzzleloader 1 83 15 99
Muzzleloader 153 171 357 498 51 70 561 739 -24.1
Youth 90 133 64 83 11 18 165 234 -29.5
Total 1500 1781 2132 2508 321 406 3953 4695 -15.8
Brown Gun 335 420 500 560 97 114 932 1094 -14.8
Crossbow 214 254 242 226 56 49 512 529 -3.2
Vertical Bow 256 267 314 312 71 56 641 635 0.9
Early Muzzleloader 1 75 18 94
Muzzleloader 68 75 145 201 20 29 233 305 -23.6
Youth 35 72 49 50 7 11 91 133 -31.6
Total 919 1153 1337 1474 271 289 2527 2916 -13.3
Butler Gun 117 143 168 159 27 48 312 350 -10.9
Crossbow 213 200 261 188 52 51 526 439 19.8
Vertical Bow 177 174 238 210 50 47 465 431 7.9
Early Muzzleloader 0 50 7 57
Muzzleloader 35 35 61 64 8 11 104 110 -5.5
Youth 11 34 16 16 1 9 28 59 -52.5
Total 556 617 802 694 145 179 1503 1490 0.9
Carroll Gun 656 716 1114 1099 249 247 2019 2062 -2.1
Crossbow 364 372 417 399 117 93 898 864 3.9
Vertical Bow 182 242 277 317 49 60 508 619 -17.9
Early Muzzleloader 0 105 15 120
Muzzleloader 129 165 284 441 45 77 458 683 -32.9
Youth 56 88 82 86 23 14 161 188 -14.4
Total 1397 1703 2306 2545 502 543 4205 4791 -12.2
Appendix.

Summary of 2013-14 Ohio Deer Seasons Page 27 Publication 5304 (R0914)
County SeasonBucks Does Button bucks Total Harvest Percent
Change2013 2012 2013 2012 2013 2012 2013 2012
Champaign Gun 148 194 211 212 55 81 414 487 -15.0
Crossbow 144 145 162 158 35 36 341 339 0.6
Vertical Bow 137 137 142 170 40 52 319 359 -11.1
Early Muzzleloader 2 26 8 36
Muzzleloader 24 33 51 76 8 9 83 118 -29.7
Youth 25 33 15 28 9 8 49 69 -29.0
Total 480 565 608 690 155 194 1243 1449 -14.2
Clark Gun 73 99 93 102 32 25 198 226 -12.4
Crossbow 125 123 116 101 24 22 265 246 7.7
Vertical Bow 95 90 96 118 17 23 208 231 -10.0
Early Muzzleloader 0 25 3 28
Muzzleloader 21 19 32 37 2 5 55 61 -9.8
Youth 12 16 4 10 2 4 18 30 -40.0
Total 328 363 371 404 81 90 780 857 -9.0
Clermont Gun 232 302 341 428 94 105 667 835 -20.1
Crossbow 380 371 463 405 90 99 933 875 6.6
Vertical Bow 343 355 482 483 71 91 896 929 -3.6
Early Muzzleloader 5 78 8 91
Muzzleloader 39 49 102 134 12 29 153 212 -27.8
Youth 37 61 23 23 6 9 66 93 -29.0
Total 1044 1185 1505 1581 284 360 2833 3126 -9.4
Clinton Gun 90 138 129 163 31 47 250 348 -28.2
Crossbow 101 95 126 90 27 23 254 208 22.1
Vertical Bow 100 98 128 114 23 27 251 239 5.0
Early Muzzleloader 1 27 6 34
Muzzleloader 7 20 40 46 5 12 52 78 -33.3
Youth 11 28 19 22 7 11 37 61 -39.3
Total 313 399 471 469 99 129 883 997 -11.4
Columbiana Gun 575 618 934 842 217 226 1726 1686 2.4
Crossbow 417 339 372 399 77 92 866 830 4.3
Vertical Bow 172 165 204 222 42 52 418 439 -4.8
Early Muzzleloader 1 105 22 128
Muzzleloader 90 82 249 289 40 70 379 441 -14.1
Youth 61 76 45 54 14 17 120 147 -18.4
Total 1325 1358 1928 2005 417 500 3670 3863 -5.0
Appendix.
Summary of 2013-14 Ohio Deer Seasons Page 28 Publication 5304 (R0914)
County SeasonBucks Does Button bucks Total Harvest Percent
Change2013 2012 2013 2012 2013 2012 2013 2012
Coshocton Gun 821 1004 1512 1714 325 401 2658 3119 -14.8
Crossbow 592 610 712 678 122 167 1426 1455 -2.0
Vertical Bow 468 465 562 623 93 94 1123 1182 -5.0
Early Muzzleloader 1 115 22 138
Muzzleloader 147 173 388 526 95 114 630 813 -22.5
Youth 98 157 107 100 43 38 248 295 -15.9
Total 2139 2536 3426 3935 707 882 6272 7353 -14.7
Crawford Gun 184 212 269 244 75 87 528 543 -2.8
Crossbow 101 105 110 128 31 27 242 260 -6.9
Vertical Bow 58 60 63 95 18 19 139 174 -20.1
Early Muzzleloader 0 25 7 32
Muzzleloader 12 21 34 57 7 17 53 95 -44.2
Youth 14 27 17 20 6 8 37 55 -32.7
Total 370 456 519 607 144 166 1033 1229 -15.9
Cuyahoga Gun 13 8 16 19 2 3 31 30 3.3
Crossbow 163 141 229 256 34 63 426 460 -7.4
Vertical Bow 73 44 122 141 22 24 217 209 3.8
Early Muzzleloader 0 5 0 5
Muzzleloader 0 3 1 3 0 0 1 6 -83.3
Youth 1 0 0 1 0 0 1 1 0.0
Total 250 197 373 425 58 90 681 712 -4.4
Darke Gun 70 106 71 157 29 49 170 312 -45.5
Crossbow 67 90 83 119 35 43 185 252 -26.6
Vertical Bow 52 83 90 121 16 38 158 242 -34.7
Early Muzzleloader 0 24 2 26
Muzzleloader 5 13 14 38 3 11 22 62 -64.5
Youth 10 19 7 33 6 13 23 65 -64.6
Total 205 333 293 502 91 164 589 999 -41.0
Defiance Gun 266 308 360 450 118 124 744 882 -15.6
Crossbow 112 119 149 160 66 61 327 340 -3.8
Vertical Bow 96 102 155 180 50 47 301 329 -8.5
Early Muzzleloader 0 41 7 48
Muzzleloader 25 22 41 67 8 18 74 107 -30.8
Youth 25 47 35 41 16 14 76 102 -25.5
Total 525 644 786 970 265 288 1576 1902 -17.1
Appendix.

Summary of 2013-14 Ohio Deer Seasons Page 29 Publication 5304 (R0914)
County SeasonBucks Does Button bucks Total Harvest Percent
Change2013 2012 2013 2012 2013 2012 2013 2012
Delaware Gun 153 224 183 313 57 83 393 620 -36.6
Crossbow 201 221 258 220 50 71 509 512 -0.6
Vertical Bow 131 170 231 243 56 47 418 460 -9.1
Early Muzzleloader 1 30 7 38
Muzzleloader 38 40 50 96 13 16 101 152 -33.6
Youth 23 25 19 10 7 7 49 42 16.7
Total 549 710 777 939 190 239 1516 1888 -19.7
Erie Gun 80 81 77 70 19 20 176 171 2.9
Crossbow 120 98 109 87 26 22 255 207 23.2
Vertical Bow 52 45 55 51 16 9 123 105 17.1
Early Muzzleloader 0 23 2 25
Muzzleloader 14 16 11 34 2 6 27 56 -51.8
Youth 7 13 7 8 5 3 19 24 -20.8
Total 326 271 353 267 81 66 760 604 25.8
Fairfield Gun 296 363 432 550 99 127 827 1040 -20.5
Crossbow 244 245 262 248 58 60 564 553 2.0
Vertical Bow 216 221 265 248 50 39 531 508 4.5
Early Muzzleloader 1 41 9 51
Muzzleloader 46 54 118 130 28 27 192 211 -9.0
Youth 31 59 32 43 6 12 69 114 -39.5
Total 839 1001 1156 1304 250 290 2245 2595 -13.5
Fayette Gun 59 49 36 51 8 11 103 111 -7.2
Crossbow 37 31 31 23 9 4 77 58 32.8
Vertical Bow 38 33 15 27 4 9 57 69 -17.4
Early Muzzleloader 0 7 0 7
Muzzleloader 10 11 16 14 1 2 27 27 0.0
Youth 13 6 4 8 3 6 20 20 0.0
Total 159 137 109 131 25 33 293 301 -2.7
Franklin Gun 46 58 48 93 19 25 113 176 -35.8
Crossbow 126 132 127 135 32 33 285 300 -5.0
Vertical Bow 116 116 131 162 20 33 267 311 -14.1
Early Muzzleloader 0 9 0 9
Muzzleloader 9 18 19 20 3 6 31 44 -29.5
Youth 4 12 3 5 0 1 7 18 -61.1
Total 303 343 340 427 76 105 719 875 -17.8
Appendix.

Summary of 2013-14 Ohio Deer Seasons Page 30 Publication 5304 (R0914)
County SeasonBucks Does Button bucks Total Harvest Percent
Change2013 2012 2013 2012 2013 2012 2013 2012
Fulton Gun 144 170 146 192 51 51 341 413 -17.4
Crossbow 87 80 111 98 35 29 233 207 12.6
Vertical Bow 51 77 100 91 36 23 187 191 -2.1
Early Muzzleloader 3 22 4 29
Muzzleloader 10 19 12 21 8 10 30 50 -40.0
Youth 12 32 15 18 7 4 34 54 -37.0
Total 307 399 411 449 141 125 859 973 -11.7
Gallia Gun 507 637 779 942 134 168 1420 1747 -18.7
Crossbow 305 204 226 217 42 38 573 459 24.8
Vertical Bow 204 184 195 222 30 35 429 441 -2.7
Early Muzzleloader 0 52 8 60
Muzzleloader 65 94 192 202 26 41 283 337 -16.0
Youth 59 80 45 50 8 12 112 142 -21.1
Total 1144 1269 1505 1764 250 323 2899 3356 -13.6
Geauga Gun 165 172 283 324 61 102 509 598 -14.9
Crossbow 253 248 338 394 90 95 681 737 -7.6
Vertical Bow 147 106 232 293 70 79 449 478 -6.1
Early Muzzleloader 2 45 16 63
Muzzleloader 27 33 52 77 17 16 96 126 -23.8
Youth 17 29 16 28 5 8 38 65 -41.5
Total 617 617 973 1173 261 320 1851 2110 -12.3
Greene Gun 87 112 120 161 17 45 224 318 -29.6
Crossbow 136 129 172 127 25 30 333 286 16.4
Vertical Bow 101 116 164 157 35 36 300 309 -2.9
Early Muzzleloader 0 22 4 26
Muzzleloader 17 20 34 55 7 20 58 95 -38.9
Youth 3 17 6 8 0 3 9 28 -67.9
Total 345 411 523 545 88 140 956 1096 -12.8
Guernsey Gun 785 894 1320 1428 296 298 2401 2620 -8.4
Crossbow 522 540 556 512 92 99 1170 1151 1.7
Vertical Bow 316 361 350 340 50 60 716 761 -5.9
Early Muzzleloader 3 117 24 144
Muzzleloader 167 210 397 488 88 123 652 821 -20.6
Youth 76 112 86 95 20 25 182 232 -21.6
Total 1878 2300 2849 3136 581 661 5308 6097 -12.9
Appendix.

Summary of 2013-14 Ohio Deer Seasons Page 31 Publication 5304 (R0914)
County SeasonBucks Does Button bucks Total Harvest Percent
Change2013 2012 2013 2012 2013 2012 2013 2012
Hamilton Gun 76 85 108 133 18 26 202 244 -17.2
Crossbow 309 298 449 430 81 88 839 816 2.8
Vertical Bow 278 289 543 556 102 114 923 959 -3.8
Early Muzzleloader 0 16 2 18
Muzzleloader 17 24 38 43 5 12 60 79 -24.1
Youth 10 17 11 3 2 0 23 20 15.0
Total 695 726 1168 1194 210 245 2073 2165 -4.2
Hancock Gun 176 233 135 243 27 82 338 558 -39.4
Crossbow 94 115 88 122 20 25 202 262 -22.9
Vertical Bow 111 98 104 137 23 31 238 266 -10.5
Early Muzzleloader 0 25 6 31
Muzzleloader 16 33 22 60 4 9 42 102 -58.8
Youth 20 34 20 26 6 11 46 71 -35.2
Total 422 537 398 628 88 171 908 1336 -32.0
Hardin Gun 176 224 280 229 88 59 544 512 6.3
Crossbow 87 101 100 132 33 39 220 272 -19.1
Vertical Bow 80 76 154 155 38 39 272 270 0.7
Early Muzzleloader 1 33 9 43
Muzzleloader 27 41 46 54 7 15 80 110 -27.3
Youth 17 14 21 16 6 13 44 43 2.3
Total 390 490 636 626 182 180 1208 1296 -6.8
Harrison Gun 738 850 1165 1292 230 228 2133 2370 -10.0
Crossbow 421 455 447 462 77 84 945 1001 -5.6
Vertical Bow 274 240 310 346 43 51 627 637 -1.6
Early Muzzleloader 3 101 11 115
Muzzleloader 128 163 323 415 62 99 513 677 -24.2
Youth 81 116 70 86 14 23 165 225 -26.7
Total 1654 1944 2438 2823 441 533 4533 5300 -14.5
Henry Gun 142 142 148 154 36 50 326 346 -5.8
Crossbow 62 49 48 57 22 29 132 135 -2.2
Vertical Bow 34 52 68 56 18 19 120 127 -5.5
Early Muzzleloader 0 11 3 14
Muzzleloader 5 10 7 16 4 8 16 34 -52.9
Youth 14 22 12 10 6 6 32 38 -15.8
Total 257 300 296 320 89 124 642 744 -13.7
Appendix.

Summary of 2013-14 Ohio Deer Seasons Page 32 Publication 5304 (R0914)
County SeasonBucks Does Button bucks Total Harvest Percent
Change2013 2012 2013 2012 2013 2012 2013 2012
Highland Gun 370 476 538 702 133 169 1041 1347 -22.7
Crossbow 258 249 304 284 72 69 634 602 5.3
Vertical Bow 239 231 289 275 53 53 581 559 3.9
Early Muzzleloader 1 65 13 79
Muzzleloader 88 85 143 191 23 42 254 318 -20.1
Youth 54 91 45 65 15 12 114 168 -32.1
Total 1013 1201 1389 1658 312 374 2714 3233 -16.1
Hocking Gun 519 706 780 1048 157 212 1456 1966 -25.9
Crossbow 379 330 384 342 49 63 812 735 10.5
Vertical Bow 269 292 321 317 42 62 632 671 -5.8
Early Muzzleloader 2 88 13 103
Muzzleloader 92 115 230 276 40 54 362 445 -18.7
Youth 59 86 53 58 15 13 127 157 -19.1
Total 1326 1578 1870 2179 318 430 3514 4187 -16.1
Holmes Gun 491 599 832 994 171 244 1494 1837 -18.7
Crossbow 440 400 510 478 104 91 1054 969 8.8
Vertical Bow 247 291 447 437 53 74 747 802 -6.9
Early Muzzleloader 1 66 22 89
Muzzleloader 75 88 206 265 55 53 336 406 -17.2
Youth 83 105 80 92 33 38 196 235 -16.6
Total 1347 1566 2167 2434 444 535 3958 4535 -12.7
Huron Gun 346 344 541 522 142 140 1029 1006 2.3
Crossbow 193 188 220 191 59 58 472 437 8.0
Vertical Bow 121 118 144 178 46 34 311 330 -5.8
Early Muzzleloader 1 65 14 80
Muzzleloader 32 36 95 114 23 27 150 177 -15.3
Youth 38 57 30 56 17 23 85 136 -37.5
Total 737 801 1099 1169 303 311 2139 2281 -6.2
Jackson Gun 390 487 632 802 134 150 1156 1439 -19.7
Crossbow 320 304 285 295 57 63 662 662 0.0
Vertical Bow 253 254 237 266 23 33 513 553 -7.2
Early Muzzleloader 2 56 4 62
Muzzleloader 75 110 169 218 21 33 265 361 -26.6
Youth 42 100 39 52 16 16 97 168 -42.3
Total 1088 1322 1423 1775 258 321 2769 3418 -19.0
Appendix.

Summary of 2013-14 Ohio Deer Seasons Page 33 Publication 5304 (R0914)
County SeasonBucks Does Button bucks Total Harvest Percent
Change2013 2012 2013 2012 2013 2012 2013 2012
Jefferson Gun 606 698 728 959 160 173 1494 1830 -18.4
Crossbow 335 314 279 283 35 42 649 639 1.6
Vertical Bow 202 225 188 289 16 31 406 545 -25.5
Early Muzzleloader 1 71 10 82
Muzzleloader 92 161 334 396 46 62 472 619 -23.7
Youth 83 98 60 59 13 19 156 176 -11.4
Total 1333 1597 1672 2170 281 354 3286 4121 -20.3
Knox Gun 680 698 1024 1158 262 303 1966 2159 -8.9
Crossbow 389 411 459 528 110 124 958 1063 -9.9
Vertical Bow 331 354 453 472 67 85 851 911 -6.6
Early Muzzleloader 0 118 23 141
Muzzleloader 105 136 227 316 59 68 391 520 -24.8
Youth 76 129 85 84 28 34 189 247 -23.5
Total 1588 1830 2387 2771 554 655 4529 5256 -13.8
Lake Gun 46 63 68 113 12 31 126 207 -39.1
Crossbow 167 157 222 268 33 60 422 485 -13.0
Vertical Bow 57 62 117 116 21 26 195 204 -4.4
Early Muzzleloader 0 16 2 18
Muzzleloader 12 12 8 37 0 10 20 59 -66.1
Youth 3 10 2 4 3 5 8 19 -57.9
Total 287 310 436 553 71 138 794 1001 -20.7
Lawrence Gun 425 522 499 660 78 104 1002 1286 -22.1
Crossbow 227 190 209 172 19 30 455 392 16.1
Vertical Bow 200 201 173 204 17 24 390 429 -9.1
Early Muzzleloader 2 46 6 54
Muzzleloader 67 60 133 148 29 22 229 230 -0.4
Youth 46 85 41 48 8 15 95 148 -35.8
Total 972 1123 1108 1325 158 213 2238 2661 -15.9
Licking Gun 628 781 1021 1187 238 303 1887 2271 -16.9
Crossbow 660 756 800 868 176 183 1636 1807 -9.5
Vertical Bow 526 541 668 755 91 132 1285 1428 -10.0
Early Muzzleloader 3 143 18 164
Muzzleloader 133 154 314 425 64 96 511 675 -24.3
Youth 85 140 77 84 27 38 189 262 -27.9
Total 2048 2486 3043 3600 620 801 5711 6887 -17.1
Appendix.
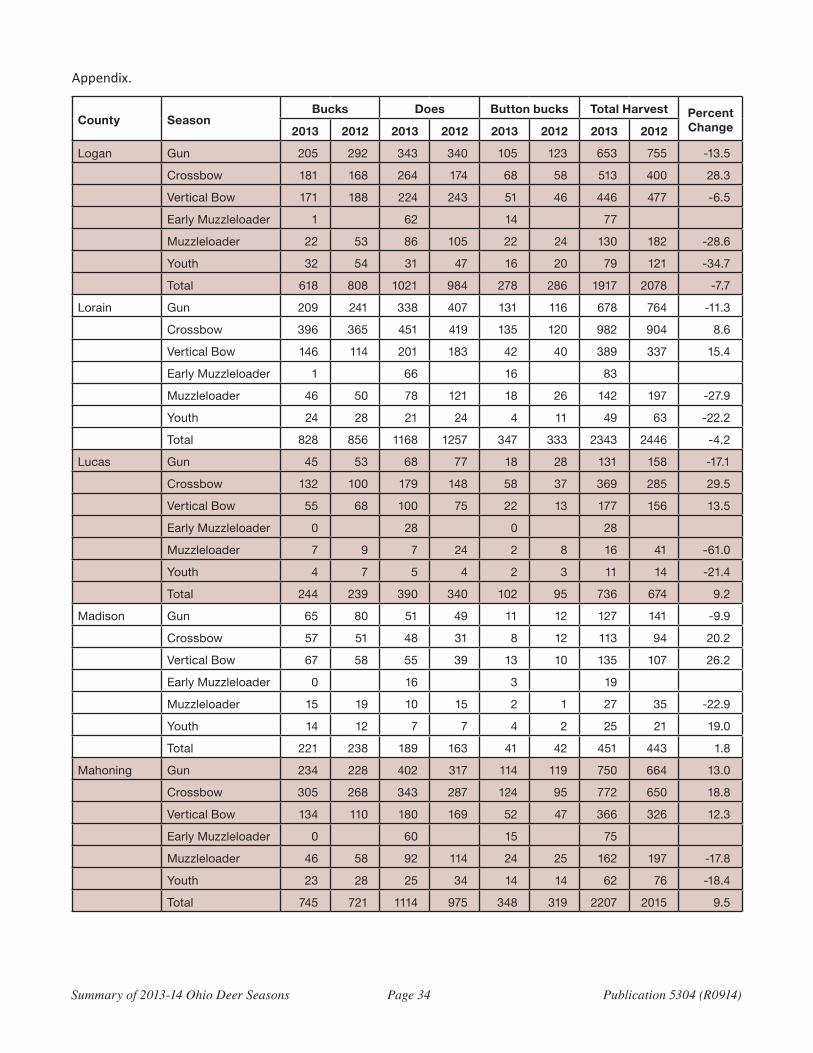
Summary of 2013-14 Ohio Deer Seasons Page 34 Publication 5304 (R0914)
County SeasonBucks Does Button bucks Total Harvest Percent
Change2013 2012 2013 2012 2013 2012 2013 2012
Logan Gun 205 292 343 340 105 123 653 755 -13.5
Crossbow 181 168 264 174 68 58 513 400 28.3
Vertical Bow 171 188 224 243 51 46 446 477 -6.5
Early Muzzleloader 1 62 14 77
Muzzleloader 22 53 86 105 22 24 130 182 -28.6
Youth 32 54 31 47 16 20 79 121 -34.7
Total 618 808 1021 984 278 286 1917 2078 -7.7
Lorain Gun 209 241 338 407 131 116 678 764 -11.3
Crossbow 396 365 451 419 135 120 982 904 8.6
Vertical Bow 146 114 201 183 42 40 389 337 15.4
Early Muzzleloader 1 66 16 83
Muzzleloader 46 50 78 121 18 26 142 197 -27.9
Youth 24 28 21 24 4 11 49 63 -22.2
Total 828 856 1168 1257 347 333 2343 2446 -4.2
Lucas Gun 45 53 68 77 18 28 131 158 -17.1
Crossbow 132 100 179 148 58 37 369 285 29.5
Vertical Bow 55 68 100 75 22 13 177 156 13.5
Early Muzzleloader 0 28 0 28
Muzzleloader 7 9 7 24 2 8 16 41 -61.0
Youth 4 7 5 4 2 3 11 14 -21.4
Total 244 239 390 340 102 95 736 674 9.2
Madison Gun 65 80 51 49 11 12 127 141 -9.9
Crossbow 57 51 48 31 8 12 113 94 20.2
Vertical Bow 67 58 55 39 13 10 135 107 26.2
Early Muzzleloader 0 16 3 19
Muzzleloader 15 19 10 15 2 1 27 35 -22.9
Youth 14 12 7 7 4 2 25 21 19.0
Total 221 238 189 163 41 42 451 443 1.8
Mahoning Gun 234 228 402 317 114 119 750 664 13.0
Crossbow 305 268 343 287 124 95 772 650 18.8
Vertical Bow 134 110 180 169 52 47 366 326 12.3
Early Muzzleloader 0 60 15 75
Muzzleloader 46 58 92 114 24 25 162 197 -17.8
Youth 23 28 25 34 14 14 62 76 -18.4
Total 745 721 1114 975 348 319 2207 2015 9.5
Appendix.

Summary of 2013-14 Ohio Deer Seasons Page 35 Publication 5304 (R0914)
County SeasonBucks Does Button bucks Total Harvest Percent
Change2013 2012 2013 2012 2013 2012 2013 2012
Marion Gun 140 167 166 208 42 35 348 410 -15.1
Crossbow 90 77 107 75 22 23 219 175 25.1
Vertical Bow 71 65 81 72 19 16 171 153 11.8
Early Muzzleloader 0 19 8 27
Muzzleloader 18 12 18 35 6 7 42 54 -22.2
Youth 12 17 8 9 3 4 23 30 -23.3
Total 331 361 402 439 100 97 833 897 -7.1
Medina Gun 213 205 263 299 79 92 555 596 -6.9
Crossbow 321 265 351 303 102 82 774 650 19.1
Vertical Bow 132 125 171 166 36 49 339 340 -0.3
Early Muzzleloader 0 57 11 68
Muzzleloader 47 37 75 94 15 28 137 159 -13.8
Youth 18 33 17 27 7 14 42 74 -43.2
Total 739 707 949 963 251 284 1939 1954 -0.8
Meigs Gun 579 637 756 929 147 198 1482 1764 -16.0
Crossbow 326 283 285 243 42 44 653 570 14.6
Vertical Bow 264 269 267 275 34 40 565 584 -3.3
Early Muzzleloader 0 81 7 88
Muzzleloader 115 124 262 310 48 48 425 482 -11.8
Youth 49 88 46 54 15 14 110 156 -29.5
Total 1338 1478 1703 1969 295 368 3336 3815 -12.6
Mercer Gun 85 122 105 146 29 50 219 318 -31.1
Crossbow 58 52 64 78 24 25 146 155 -5.8
Vertical Bow 38 63 105 77 24 25 167 165 1.2
Early Muzzleloader 0 23 3 26
Muzzleloader 5 12 16 30 7 6 28 48 -41.7
Youth 13 14 17 27 1 12 31 53 -41.5
Total 203 280 333 390 89 130 625 800 -21.9
Miami Gun 75 91 110 124 26 26 211 241 -12.4
Crossbow 126 117 159 141 40 46 325 304 6.9
Vertical Bow 87 100 129 126 36 37 252 263 -4.2
Early Muzzleloader 0 18 2 20
Muzzleloader 11 15 29 43 5 7 45 65 -30.8
Youth 10 18 11 11 2 6 23 35 -34.3
Total 309 360 460 472 112 125 881 957 -7.9
Appendix.

Summary of 2013-14 Ohio Deer Seasons Page 36 Publication 5304 (R0914)
County SeasonBucks Does Button bucks Total Harvest Percent
Change2013 2012 2013 2012 2013 2012 2013 2012
Monroe Gun 490 640 729 889 118 166 1337 1695 -21.1
Crossbow 273 271 247 283 39 40 559 594 -5.9
Vertical Bow 130 138 129 160 20 10 279 308 -9.4
Early Muzzleloader 4 52 12 68
Muzzleloader 71 129 182 333 25 49 278 511 -45.6
Youth 48 82 32 57 10 14 90 153 -41.2
Total 1025 1331 1374 1832 226 301 2625 3464 -24.2
Montgomery Gun 46 60 44 80 19 22 109 162 -32.7
Crossbow 138 126 116 127 31 35 285 288 -1.0
Vertical Bow 76 78 120 143 35 37 231 258 -10.5
Early Muzzleloader 0 16 2 18
Muzzleloader 11 15 11 32 2 10 24 57 -57.9
Youth 6 9 4 3 3 2 13 14 -7.1
Total 281 299 314 395 92 108 687 802 -14.3
Morgan Gun 485 615 797 915 163 182 1445 1712 -15.6
Crossbow 241 228 239 196 34 42 514 466 10.3
Vertical Bow 264 212 221 207 39 39 524 458 14.4
Early Muzzleloader 1 51 13 65
Muzzleloader 82 99 238 308 41 53 361 460 -21.5
Youth 59 94 41 59 18 12 118 165 -28.5
Total 1146 1339 1615 1859 319 368 3080 3566 -13.6
Morrow Gun 226 306 326 409 88 129 640 844 -24.2
Crossbow 188 184 185 169 32 52 405 405 0.0
Vertical Bow 119 124 136 157 39 45 294 326 -9.8
Early Muzzleloader 1 44 8 53
Muzzleloader 26 44 57 92 7 14 90 150 -40.0
Youth 23 31 23 23 10 12 56 66 -15.2
Total 586 722 778 932 185 270 1549 1924 -19.5
Muskingum Gun 888 978 1412 1585 304 364 2604 2927 -11.0
Crossbow 483 465 444 434 76 97 1003 996 0.7
Vertical Bow 445 456 464 456 53 77 962 989 -2.7
Early Muzzleloader 2 128 13 143
Muzzleloader 162 185 365 478 66 88 593 751 -21.0
Youth 106 132 81 109 25 39 212 280 -24.3
Total 2095 2362 2911 3318 541 737 5547 6417 -13.6
Appendix.

Summary of 2013-14 Ohio Deer Seasons Page 37 Publication 5304 (R0914)
County SeasonBucks Does Button bucks Total Harvest Percent
Change2013 2012 2013 2012 2013 2012 2013 2012
Noble Gun 502 646 793 827 159 174 1454 1647 -11.7
Crossbow 336 274 278 258 51 43 665 575 15.7
Vertical Bow 177 210 210 185 36 31 423 426 -0.7
Early Muzzleloader 1 67 15 83
Muzzleloader 85 102 208 295 48 47 341 444 -23.2
Youth 45 100 43 51 17 10 105 161 -34.8
Total 1155 1411 1610 1741 326 336 3091 3488 -11.4
Ottawa Gun 36 33 43 42 9 11 88 86 2.3
Crossbow 71 80 86 56 27 18 184 154 19.5
Vertical Bow 37 27 47 36 6 6 90 69 30.4
Early Muzzleloader 0 8 2 10
Muzzleloader 5 17 10 18 2 5 17 40 -57.5
Youth 6 9 2 6 2 6 10 21 -52.4
Total 156 167 196 165 50 47 402 379 6.1
Paulding Gun 151 190 272 267 76 94 499 551 -9.4
Crossbow 68 63 101 101 34 36 203 200 1.5
Vertical Bow 64 59 96 87 28 40 188 186 1.1
Early Muzzleloader 0 43 13 56
Muzzleloader 17 21 29 50 5 12 51 83 -38.6
Youth 18 25 15 32 10 12 43 69 -37.7
Total 319 390 562 589 166 209 1047 1188 -11.9
Perry Gun 456 644 724 866 182 216 1362 1726 -21.1
Crossbow 233 244 202 195 49 51 484 490 -1.2
Vertical Bow 212 183 175 221 30 43 417 447 -6.7
Early Muzzleloader 0 49 5 54
Muzzleloader 82 91 167 237 45 47 294 375 -21.6
Youth 50 82 35 42 16 19 101 143 -29.4
Total 1040 1337 1362 1728 330 396 2732 3461 -21.1
Pickaway Gun 125 204 180 252 38 44 343 500 -31.4
Crossbow 83 82 101 73 16 13 200 168 19.0
Vertical Bow 83 80 63 68 10 19 156 167 -6.6
Early Muzzleloader 0 15 3 18
Muzzleloader 11 22 30 51 6 10 47 83 -43.4
Youth 13 32 12 5 3 10 28 47 -40.4
Total 323 451 405 483 76 109 804 1043 -22.9
Appendix.

Summary of 2013-14 Ohio Deer Seasons Page 38 Publication 5304 (R0914)
County SeasonBucks Does Button bucks Total Harvest Percent
Change2013 2012 2013 2012 2013 2012 2013 2012
Pike Gun 346 387 372 486 100 100 818 973 -15.9
Crossbow 261 232 239 178 40 29 540 439 23.0
Vertical Bow 233 215 157 148 14 21 404 384 5.2
Early Muzzleloader 0 46 5 51
Muzzleloader 54 83 113 117 20 17 187 217 -13.8
Youth 46 60 29 25 8 4 83 89 -6.7
Total 948 1025 961 1049 187 182 2096 2256 -7.1
Portage Gun 193 210 294 272 81 126 568 608 -6.6
Crossbow 320 272 358 372 81 139 759 783 -3.1
Vertical Bow 114 106 169 174 44 55 327 335 -2.4
Early Muzzleloader 2 51 11 64
Muzzleloader 33 35 67 104 9 19 109 158 -31.0
Youth 10 45 18 59 3 18 31 122 -74.6
Total 739 686 1019 1035 249 375 2007 2096 -4.2
Preble Gun 114 127 125 155 35 41 274 323 -15.2
Crossbow 115 93 134 144 38 36 287 273 5.1
Vertical Bow 111 117 173 181 39 40 323 338 -4.4
Early Muzzleloader 0 34 7 41
Muzzleloader 27 48 60 68 13 15 100 131 -23.7
Youth 12 20 19 20 5 6 36 46 -21.7
Total 382 430 550 617 138 150 1070 1197 -10.6
Putnam Gun 97 120 109 149 49 58 255 327 -22.0
Crossbow 85 67 81 78 25 26 191 171 11.7
Vertical Bow 57 49 69 66 22 16 148 131 13.0
Early Muzzleloader 0 28 5 33
Muzzleloader 9 13 9 12 4 5 22 30 -26.7
Youth 22 35 9 25 6 18 37 78 -52.6
Total 270 298 306 360 111 126 687 784 -12.4
Richland Gun 410 453 603 738 169 227 1182 1418 -16.6
Crossbow 390 408 475 519 120 124 985 1051 -6.3
Vertical Bow 225 234 322 380 67 73 614 687 -10.6
Early Muzzleloader 1 87 17 105
Muzzleloader 58 78 142 219 27 63 227 360 -36.9
Youth 45 66 50 52 15 23 110 141 -22.0
Total 1136 1294 1689 2016 417 541 3242 3851 -15.8
Appendix.

Summary of 2013-14 Ohio Deer Seasons Page 39 Publication 5304 (R0914)
County SeasonBucks Does Button bucks Total Harvest Percent
Change2013 2012 2013 2012 2013 2012 2013 2012
Ross Gun 466 612 579 761 122 139 1167 1512 -22.8
Crossbow 360 326 313 274 65 45 738 645 14.4
Vertical Bow 340 312 277 269 43 45 660 626 5.4
Early Muzzleloader 0 75 10 85
Muzzleloader 85 107 174 212 28 43 287 362 -20.7
Youth 85 94 36 61 15 16 136 171 -20.5
Total 1344 1525 1461 1692 283 313 3088 3530 -12.5
Sandusky Gun 115 92 65 98 28 34 208 224 -7.1
Crossbow 131 130 149 131 33 24 313 285 9.8
Vertical Bow 53 57 74 63 25 13 152 133 14.3
Early Muzzleloader 0 20 7 27
Muzzleloader 11 17 26 38 6 11 43 66 -34.8
Youth 12 14 13 8 3 5 28 27 3.7
Total 322 325 349 371 102 93 773 789 -2.0
Scioto Gun 401 403 592 629 106 106 1099 1138 -3.4
Crossbow 301 221 294 238 37 43 632 502 25.9
Vertical Bow 278 252 272 270 30 49 580 571 1.6
Early Muzzleloader 0 60 4 64
Muzzleloader 58 88 120 151 18 29 196 268 -26.9
Youth 58 53 43 35 15 15 116 103 12.6
Total 1103 1108 1391 1434 212 260 2706 2802 -3.4
Seneca Gun 273 308 359 362 115 133 747 803 -7.0
Crossbow 174 184 176 211 54 50 404 445 -9.2
Vertical Bow 89 99 139 140 27 42 255 281 -9.3
Early Muzzleloader 1 54 14 69
Muzzleloader 29 40 58 84 11 25 98 149 -34.2
Youth 23 43 25 37 9 19 57 99 -42.4
Total 591 721 817 904 233 291 1641 1916 -14.4
Shelby Gun 128 178 190 215 53 63 371 456 -18.6
Crossbow 97 95 150 151 45 52 292 298 -2.0
Vertical Bow 72 84 127 133 30 31 229 248 -7.7
Early Muzzleloader 0 47 16 63
Muzzleloader 13 19 61 59 8 23 82 101 -18.8
Youth 23 37 27 32 7 19 57 88 -35.2
Total 335 443 610 641 159 206 1104 1290 -14.4
Appendix.

Summary of 2013-14 Ohio Deer Seasons Page 40 Publication 5304 (R0914)
County SeasonBucks Does Button bucks Total Harvest Percent
Change2013 2012 2013 2012 2013 2012 2013 2012
Stark Gun 291 292 476 424 116 117 883 833 6.0
Crossbow 336 323 412 351 97 83 845 757 11.6
Vertical Bow 180 150 234 232 61 60 475 442 7.5
Early Muzzleloader 0 51 15 66
Muzzleloader 45 68 131 156 26 44 202 268 -24.6
Youth 34 46 31 31 16 23 81 100 -19.0
Total 893 927 1350 1297 337 347 2580 2571 0.4
Summit Gun 58 69 60 67 22 27 140 163 -14.1
Crossbow 373 311 427 385 106 116 906 812 11.6
Vertical Bow 99 102 174 187 29 40 302 329 -8.2
Early Muzzleloader 0 7 2 9
Muzzleloader 19 11 25 38 4 7 48 56 -14.3
Youth 5 8 5 7 1 4 11 19 -42.1
Total 559 505 708 702 164 203 1431 1410 1.5
Trumbull Gun 400 386 701 620 197 231 1298 1237 4.9
Crossbow 462 364 553 435 179 158 1194 957 24.8
Vertical Bow 169 167 275 265 91 70 535 502 6.6
Early Muzzleloader 4 87 26 117
Muzzleloader 47 67 129 202 46 52 222 321 -30.8
Youth 33 39 27 45 12 25 72 109 -33.9
Total 1161 1085 1850 1708 582 581 3593 3374 6.5
Tuscarawas Gun 783 957 1501 1504 320 399 2604 2860 -9.0
Crossbow 507 532 633 641 133 142 1273 1315 -3.2
Vertical Bow 380 377 487 541 55 87 922 1005 -8.3
Early Muzzleloader 1 95 19 115
Muzzleloader 141 170 375 499 76 115 592 784 -24.5
Youth 98 157 77 124 45 36 220 317 -30.6
Total 1925 2317 3195 3613 654 834 5774 6764 -14.6
Union Gun 126 144 128 166 47 42 301 352 -14.5
Crossbow 85 80 80 72 31 31 196 183 7.1
Vertical Bow 87 87 102 96 17 21 206 204 1.0
Early Muzzleloader 0 21 11 32
Muzzleloader 20 31 30 49 7 14 57 94 -39.4
Youth 18 16 7 14 4 7 29 37 -21.6
Total 339 389 370 440 117 122 826 951 -13.1
Appendix.

Summary of 2013-14 Ohio Deer Seasons Page 41 Publication 5304 (R0914)
County SeasonBucks Does Button bucks Total Harvest Percent
Change2013 2012 2013 2012 2013 2012 2013 2012
VanWert Gun 73 105 115 152 26 33 214 290 -26.2
Crossbow 46 41 56 61 20 19 122 121 0.8
Vertical Bow 23 25 43 49 12 10 78 84 -7.1
Early Muzzleloader 0 16 3 19
Muzzleloader 7 10 16 24 2 7 25 41 -39.0
Youth 10 19 9 14 10 3 29 36 -19.4
Total 161 220 256 337 74 79 491 636 -22.8
Vinton Gun 471 575 782 840 171 168 1424 1583 -10.0
Crossbow 255 227 284 232 57 52 596 511 16.6
Vertical Bow 247 265 239 245 38 38 524 548 -4.4
Early Muzzleloader 0 72 7 79
Muzzleloader 85 108 253 232 54 52 392 392 0.0
Youth 49 67 38 43 11 16 98 126 -22.2
Total 1110 1302 1684 1726 339 353 3133 3381 -7.3
Warren Gun 116 149 135 212 34 45 285 406 -29.8
Crossbow 220 244 213 219 77 60 510 523 -2.5
Vertical Bow 136 180 198 169 47 37 381 386 -1.3
Early Muzzleloader 0 31 8 39
Muzzleloader 25 37 56 89 10 16 91 142 -35.9
Youth 7 34 11 9 8 9 26 52 -50.0
Total 509 667 650 750 186 175 1345 1592 -15.5
Washington Gun 627 774 850 1171 129 218 1606 2163 -25.8
Crossbow 310 261 257 225 47 50 614 536 14.6
Vertical Bow 231 229 188 207 29 33 448 469 -4.5
Early Muzzleloader 0 60 12 72
Muzzleloader 118 107 244 290 40 45 402 442 -9.0
Youth 76 121 54 57 10 18 140 196 -28.6
Total 1367 1570 1664 2113 267 389 3298 4072 -19.0
Wayne Gun 241 260 382 404 101 120 724 784 -7.7
Crossbow 224 211 270 262 55 65 549 538 2.0
Vertical Bow 107 114 198 195 31 41 336 350 -4.0
Early Muzzleloader 1 74 8 83
Muzzleloader 39 42 85 111 16 24 140 177 -20.9
Youth 23 48 23 54 11 19 57 121 -52.9
Total 638 709 1045 1090 225 286 1908 2085 -8.5
Appendix.

Summary of 2013-14 Ohio Deer Seasons Page 42 Publication 5304 (R0914)
County SeasonBucks Does Button bucks Total Harvest Percent
Change2013 2012 2013 2012 2013 2012 2013 2012
Williams Gun 307 366 412 415 119 125 838 906 -7.5
Crossbow 155 147 221 225 48 60 424 432 -1.9
Vertical Bow 132 135 223 247 46 42 401 424 -5.4
Early Muzzleloader 1 74 18 93
Muzzleloader 19 28 39 62 11 20 69 110 -37.3
Youth 29 36 26 35 11 12 66 83 -20.5
Total 647 756 1003 1046 254 276 1904 2078 -8.4
Wood Gun 101 120 86 97 26 37 213 254 -16.1
Crossbow 125 123 108 112 34 28 267 263 1.5
Vertical Bow 78 80 63 70 18 30 159 180 -11.7
Early Muzzleloader 0 16 0 16
Muzzleloader 16 18 14 29 4 10 34 57 -40.4
Youth 18 18 9 15 3 6 30 39 -23.1
Total 344 388 300 353 87 122 731 863 -15.3
Wyandot Gun 253 317 337 393 100 102 690 812 -15.0
Crossbow 94 93 112 110 34 30 240 233 3.0
Vertical Bow 87 92 152 147 33 27 272 266 2.3
Early Muzzleloader 1 38 19 58
Muzzleloader 17 34 45 72 7 20 69 126 -45.2
Youth 19 33 19 33 12 14 50 80 -37.5
Total 481 601 720 822 209 211 1410 1634 -13.7
Appendix.