summary of consolidated financial statements for the nine
TRANSCRIPT

Summary of Consolidated Financial Statements for the Nine Months Ended September 30, 2021(Japanese GAAP)
November 11, 2021Company name HORIBA, Ltd. Listed stock exchanges: TokyoListing code 6856 URL: https://www.horiba.com/en_en/Representative Atsushi Horiba, Chairman & Group CEO TEL: (81)75-313-8121Contact Yoshihiro Morita, Department Manager, Accounting Dept.
(1) Consolidated Operating Results (Percentages represent changes from the corresponding in the previous year)
Net Sales Operating Income Ordinary Income Net Income Attributableto Owners of Parent
Millions of yen % Millions of yen % Millions of yen % Millions of yen %
Nine months ended 9/30/21 153,957 18.6 19,859 81.1 19,868 84.0 13,721 82.3Nine months ended 9/30/20 129,790 -5.3 10,968 -8.6 10,799 -6.6 7,525 -10.7
(Note) Comprehensive Income: FY2021Q3 20,278 million yen (366.1%) FY2020Q3 4,350 million yen (-18.2%)
Net Income Attributableto Owners of Parent per Share
Net Income Attributableto Owners of Parent per Share
(Diluted)Yen Yen
Nine months ended 9/30/21 325.17 323.51Nine months ended 9/30/20 178.37 177.53
Total Assets Net Assets Shareholders'Equity Ratio
Millions of yen Millions of yen %
As of 9/30/21 357,832 194,428 54.1As of 12/31/20 328,068 178,669 54.3
As of 9/30/21 193,626 million yen As of 12/31/20 177,964 million yen
Dividend per ShareFirst
QuarterSecondQuarter
ThirdQuarter Year End Total
Yen Yen Yen Yen YenFY 12/2020 - 30.00 - 60.00 90.00FY 12/2021 - 50.00 -
FY 12/2021 (Forecast) 80.00 130.00
(Percentages represent changes from the previous fiscal year)
Net Sales Operating Income Ordinary Income Net Income Attributableto Owners of Parent
Net Income Attributableto Owners of Parent
per ShareMillions of yen % Millions of yen % Millions of yen % Millions of yen % Yen
Full year 220,000 17.6 28,500 44.7 28,000 44.3 18,500 40.3 438.42
(Figures have been rounded down to the nearest million yen)
1. Consolidated Results for the Nine Months Ended September 30, 2021 (January 1, 2021 - September 30, 2021)
(2) Consolidated Financial Position
(Reference) Net assets excluding subscription rights to shares and non-controlling interests:
2. Dividends
(Note) Changes in the latest dividend forecasts released: None
3. Consolidated Forecast for the Year Ending December 31, 2021 (January 1, 2021 - December 31, 2021)
(Note) Changes in the latest business forecasts released: None
1 HORIBA, Ltd. (Consolidated)

① Shares issued (including treasury stock) September 30, 2021 42,532,752 December 31, 2020 42,532,752② Treasury stock September 30, 2021 335,472 December 31, 2020 335,478③ Average number of outstanding shares Jan. - Sep., 2021 42,197,319 Jan. - Sep., 2020 42,191,357
Notes(1) Changes in significant subsidiaries during the period
(Changes in specified subsidiaries that caused a change in the scope of consolidation): None
(2)Application of the accounting method specific to quarterly consolidated financial statements: Yes
(3) Changes in accounting policies, accounting estimates and retrospective restatement① Changes in accounting policies associated with revision of accounting standards: None② Changes in accounting policies arising from other than the above: None③ Changes in accounting estimates: None④ Retrospective restatement: None
(4) Number of shares outstanding (common stock)
Note 1. This consolidated financial report is not subject to quarterly review by certified public accountants or accounting firms.
Note 2. Appropriate use of business forecasts and other important informationThe forecasts of dividend amount and business performance contained in this report have been made based on certain future assumptions, outlooks, and plans which are available at the HORIBA Group as of November 11, 2021. However, due to risks and various uncertain factors such as future business operation policies, changes in the economic environment in Japan and overseas, fluctuation of currency rates, it is possible that actual performance would vary considerably from the forecasts.
2 HORIBA, Ltd. (Consolidated)

1. Qualitative Information Concerning Consolidated Results(1) Information Concerning Consolidated Operating Results
(For details, see page 10, “3. Supplemental Information - HORIBA, Ltd. Financial Highlights for the Nine Months Ended September 30, 2021”)
During the nine months ended September 30, 2021, HORIBA, Ltd. (“the Company”) and its consolidated subsidiaries (together “the HORIBA Group” or “HORIBA” as a consolidated group) increased sales by 18.6% year-on-year to 153,957 million yen, mainly due to an increase in sales of the Semiconductor segment. Operating income increased by 81.1% to 19,859 million yen, ordinary income by 84.0% to 19,868 million yen and net income attributable to owners of parent by 82.3% to 13,721 million yen.
The operating results of each business segment are summarized as follows.
(Automotive Segment)Owing to decrease in sales of emission measurement systems in Japan and Asia, segment sales decreased by 10.4% year-on-year to 37,312 million yen. As a result, operating loss of 1,935 million yen was recorded (compared to operating loss of 65 million yen in the third quarter of the previous year).
(Process & Environmental Segment)Mainly due to an increase in sales of stack gas analyzers in Asia, segment sales increased by 13.8% year-on-year to 14,567 million yen and operating income increased by 69.7% to 1,294 million yen.
(Medical-Diagnostics Segment)Sales of hematology analyzers increased in Americas and other areas. As a result, segment sales increased by 25.2% year-on-year to 19,122 million yen and operating income of 84 million yen was recorded (compared to operating loss of 480 million yen in the third quarter of the previous year).
(Semiconductor Segment)Sales to semiconductor production equipment manufacturers increased significantly, in response to expansion of semiconductor manufacturers’ capital expenditures driven by an increase in demand for semiconductors. As a result, segment sales increased by 50.1% year-on-year to 62,683 million yen and operating income increased by 99.2% to 19,722 million yen.
(Scientific Segment)Mainly due to an increase in sales of optical components in Americas, segment sales increased by 10.6% year-on-year to 20,270 million yen. On the profit side, operating income however decreased by 18.7% to 692 million yen mainly due to increase in R&D expenses.
3 HORIBA, Ltd. (Consolidated)

(2) Information Concerning Consolidated Earnings Forecasts for FY2021Consolidated earnings forecasts for FY2021 remain unchanged from those in “Summary of Consolidated FinancialStatements for the Six Months Ended June 30, 2021” disclosed on August 10, 2021.Also, the dividend forecast for the current fiscal year remains unchanged.
Cautionary statement with respect to earnings forecastsThe forecasts of dividend amount and business performance contained in this report have been made based on certain future assumptions, outlooks, and plans which are available at the HORIBA Group as of November 11, 2021. However, due to risks and various uncertain factors such as future business operation policies, changes in the economic environment in Japan and overseas, fluctuation of currency rates, it is possible that actual performance would vary considerably from the forecasts.
4 HORIBA, Ltd. (Consolidated)
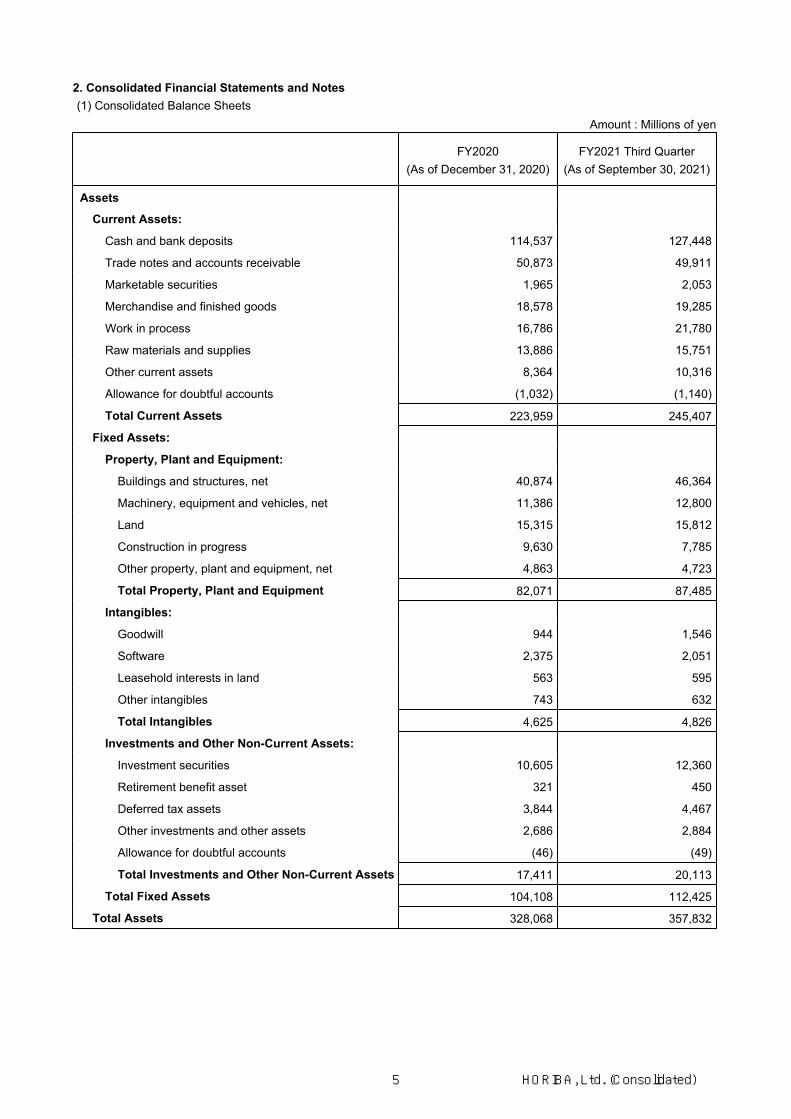
Amount : Millions of yen
FY2020(As of December 31, 2020)
FY2021 Third Quarter(As of September 30, 2021)
Assets
Current Assets:
Cash and bank deposits 114,537 127,448
Trade notes and accounts receivable 50,873 49,911
Marketable securities 1,965 2,053
Merchandise and finished goods 18,578 19,285
Work in process 16,786 21,780
Raw materials and supplies 13,886 15,751
Other current assets 8,364 10,316
Allowance for doubtful accounts (1,032) (1,140)
Total Current Assets 223,959 245,407
Fixed Assets:
Property, Plant and Equipment:
Buildings and structures, net 40,874 46,364
Machinery, equipment and vehicles, net 11,386 12,800
Land 15,315 15,812
Construction in progress 9,630 7,785
Other property, plant and equipment, net 4,863 4,723
Total Property, Plant and Equipment 82,071 87,485
Intangibles:
Goodwill 944 1,546
Software 2,375 2,051
Leasehold interests in land 563 595
Other intangibles 743 632
Total Intangibles 4,625 4,826
Investments and Other Non-Current Assets:
Investment securities 10,605 12,360
Retirement benefit asset 321 450
Deferred tax assets 3,844 4,467
Other investments and other assets 2,686 2,884
Allowance for doubtful accounts (46) (49)
Total Investments and Other Non-Current Assets 17,411 20,113
Total Fixed Assets 104,108 112,425
Total Assets 328,068 357,832
2. Consolidated Financial Statements and Notes(1) Consolidated Balance Sheets
5 HORIBA, Ltd. (Consolidated)

Amount : Millions of yen
FY2020(As of December 31, 2020)
FY2021 Third Quarter(As of September 30, 2021)
Liabilities
Current Liabilities:
Trade notes and accounts payable 20,264 26,586
Short-term loans payable 9,548 25,114
Accounts payable-other 15,092 13,879
Accrued income taxes 4,042 6,071
Advances received 15,473 16,503
Accrued bonuses to employees 919 2,004
Accrued bonuses to directors and corporate auditors - 419
Reserve for product warranty 2,331 2,375
Other current liabilities 5,124 5,310
Total Current Liabilities 72,797 98,265
Non-Current Liabilities:
Corporate bonds 30,000 30,000
Long-term loans payable 37,518 25,017
Deferred tax liabilities 836 1,636
Retirement benefit liability 2,237 2,471
Other non-current liabilities 6,009 6,014
Total Non-Current Liabilities 76,601 65,139
Total Liabilities 149,399 163,404
Net Assets
Shareholders' Equity
Common stock 12,011 12,011
Capital surplus 18,599 18,624
Retained earnings 150,222 159,302
Treasury stock (1,323) (1,323)
Total Shareholders' Equity 179,509 188,614
Accumulated Other Comprehensive Income
Net unrealized holding gains or losses on securities 4,363 5,568
Deferred gains or losses on hedges 6 -
Foreign currency translation adjustments (5,839) (517)
Remeasurements of defined benefit plans (75) (38)
Total Accumulated Other Comprehensive Income (1,545) 5,012
Subscription Rights to Shares 697 791
Non-Controlling Interests 6 9
Total Net Assets 178,669 194,428
Total Liabilities and Net Assets 328,068 357,832
6 HORIBA, Ltd. (Consolidated)

Amount : Millions of yen
FY2020 Third Quarter(Nine Months EndedSeptember 30, 2020)
FY2021 Third Quarter(Nine Months EndedSeptember 30, 2021)
Net Sales 129,790 153,957
Cost of Sales 76,816 89,252
Gross Income 52,974 64,704
Selling, General and Administrative Expenses 42,006 44,845
Operating Income 10,968 19,859
Non-Operating Income
Interest income 233 143
Dividend income 94 119
Subsidy income 176 69
Other 170 279
Total Non-Operating Income 674 610
Non-Operating Expense
Interest expense 324 364
Foreign exchange losses 314 169
Other 204 67
Total Non-Operating Expense 843 601
Ordinary Income 10,799 19,868
Extraordinary Gain
Gain on sales of fixed assets 19 15
Gain on sales of investment securities 554 6
Total Extraordinary Gain 574 22
Extraordinary Loss
Loss on sales of fixed assets 0 2
Loss on disposal of fixed assets 26 60
Loss on valuation of investment securities 9 -
Business restructuring expenses 114 -
Total Extraordinary Loss 149 63
Income before Income Taxes 11,223 19,827
Income taxes (current) 3,855 6,406
Income taxes (deferred) (153) (297)
Total Income Taxes 3,702 6,109
Net Income 7,521 13,718
Loss attributable to non-controlling interests (4) (2)
Net Income Attributable to Owners of Parent 7,525 13,721
(2) Consolidated Statements of Income and Consolidated Comprehensive Income Statements(Consolidated Statements of Income)
7 HORIBA, Ltd. (Consolidated)

Amount : Millions of yen
FY2020 Third Quarter(Nine Months EndedSeptember 30, 2020)
FY2021 Third Quarter(Nine Months EndedSeptember 30, 2021)
Net Income 7,521 13,718
Other Comprehensive Income
Net unrealized holding gains or losses on securities (718) 1,205
Deferred gains or losses on hedges (0) (6)
Foreign currency translation adjustments (2,500) 5,323
Remeasurements of defined benefit plans 49 36
Total Other Comprehensive Income (3,171) 6,559
Comprehensive Income 4,350 20,278
(Breakdown of comprehensive income)
Comprehensive income attributable to owners of parent 4,357 20,279
Comprehensive income attributable to non-controlling interests (6) (0)
(Consolidated Statements of Comprehensive Income)
8 HORIBA, Ltd. (Consolidated)
(3) Notes to Consolidated Financial StatementsApplication of special accounting for preparing quarterly consolidated financial statement(Calculation method for tax expenses)
The Company and its domestic consolidated subsidiaries calculated income tax expenses by multiplying quarterly income before income taxes by reasonably estimated annual effective tax rate. This tax rate was reasonably estimated after applying the deferred tax accounting to the annual income before income taxes.
Additional information(Application of tax effect accounting for transition from consolidated taxation system to group tax sharing system)
With regard to the transition to group tax sharing system established in the “Act for Partial Amendment of the Income Tax Act, etc.” (Act No. 8 of 2020) and items for which the nonconsolidated taxation system has been reviewed in line with the transition to the group tax sharing system, the Company and its domestic consolidated subsidiaries calculated the amounts of deferred tax assets and deferred tax liabilities in accordance with the provisions of the tax act before the amendment based on the treatment of Paragraph 3 of the “Practical Solution on the Treatment of Tax Effect Accounting for the Transition from the Consolidated Taxation System to the Group Tax Sharing System” (ASBJ Practical Issues Tax Force No. 39, March 31, 2020), instead of applying the provision of Paragraph 44 of the “Implementation Guidance on Tax Effect Accounting” (ASBJ Guidance No. 28, February 16, 2018).
9 HORIBA, Ltd. (Consolidated)

3. Supplemental Information
1. Consolidated Financial Results Amount : Millions of yen
12/2020Results
12/2021Results
12/2020Results
12/2021Forecasts
3Q (9 months) 3Q (9 months) Amount Ratio Full year Full year Amount Ratio
129,790 153,957 +24,166 +18.6% 187,080 220,000 +32,919 +17.6%
10,968 19,859 +8,891 +81.1% 19,694 28,500 +8,805 +44.7%
Operating Income Ratio 8.5% 12.9% +4.4P 10.5% 13.0% +2.5P
10,799 19,868 +9,069 +84.0% 19,399 28,000 +8,600 +44.3%
Ordinary Income Ratio 8.3% 12.9% +4.6P 10.4% 12.7% +2.3P
7,525 13,721 +6,195 +82.3% 13,188 18,500 +5,311 +40.3%
Net Income Ratio 5.8% 8.9% +3.1P 7.0% 8.4% +1.4P
US$ 107.55 108.58 +1.03 106.76 109.00 +2.24
Euro 120.93 129.87 +8.94 121.88 130.00 +8.12
2. Consolidated Segment Results Amount : Millions of yen
12/2020Results
12/2021Results
12/2020Results
12/2021Forecasts
3Q (9 months) 3Q (9 months) Amount Ratio Full year Full year Amount Ratio
41,623 37,312 -4,311 -10.4% 63,913 64,000 +86 +0.1%
12,799 14,567 +1,768 +13.8% 18,337 21,000 +2,662 +14.5%
15,278 19,122 +3,844 +25.2% 21,035 25,000 +3,964 +18.8%
41,756 62,683 +20,927 +50.1% 56,967 81,000 +24,032 +42.2%
18,332 20,270 +1,937 +10.6% 26,825 29,000 +2,174 +8.1%
129,790 153,957 +24,166 +18.6% 187,080 220,000 +32,919 +17.6%
12/2020Results
12/2021Results
12/2020Results
12/2021Forecasts
3Q (9 months) 3Q (9 months) Amount Ratio Full year Full year Amount Ratio
(65) (1,935) -1,870 - 2,465 1,000 -1,465 -59.4%
763 1,294 +531 +69.7% 1,639 1,500 -139 -8.5%
(480) 84 +565 - (426) 500 +926 -
9,898 19,722 +9,823 +99.2% 14,052 24,000 +9,947 +70.8%
852 692 -159 -18.7% 1,963 1,500 -463 -23.6%
10,968 19,859 +8,891 +81.1% 19,694 28,500 +8,805 +44.7%
Net Sales
Operating Income
Ordinary Income
Net Income Attributableto Owners of Parent
HORIBA, Ltd. Financial Highlights for the Nine Months Ended September 30, 2021
Changes Changes
Process&Environmental
Total
Medical-Diagnostics
Semiconductor
Scientific
Operating Income
Automotive
Changes
Changes
Automotive
Scientific
Changes
Changes
Medical-Diagnostics
Semiconductor
Total
Process&Environmental
Net Sales
10 HORIBA, Ltd. (Consolidated)

3. Consolidated Segment Sales by Destination Amount : Millions of yen
12/2020Results
12/2021Results
12/2020Results
12/2021Forecasts
3Q (9 months) 3Q (9 months) Amount Ratio Full year Full year Amount Ratio
41,623 37,312 -4,311 -10.4% 63,913 64,000 +86 +0.1%
Japan 12,517 10,637 -1,879 -15.0% 17,640 15,000 -2,640 -15.0%
Asia 11,499 9,892 -1,607 -14.0% 17,584 16,500 -1,084 -6.2%
Americas 4,005 3,863 -141 -3.5% 7,226 8,000 +773 +10.7%
Europe 13,601 12,918 -683 -5.0% 21,462 24,500 +3,037 +14.2%
12,799 14,567 +1,768 +13.8% 18,337 21,000 +2,662 +14.5%
Japan 7,077 7,328 +251 +3.6% 9,917 10,500 +582 +5.9%
Asia 2,461 3,795 +1,333 +54.2% 4,010 6,000 +1,989 +49.6%
Americas 1,716 1,656 -60 -3.5% 2,184 2,000 -184 -8.4%
Europe 1,543 1,787 +243 +15.8% 2,225 2,500 +274 +12.3%
15,278 19,122 +3,844 +25.2% 21,035 25,000 +3,964 +18.8%
Japan 3,958 4,013 +55 +1.4% 5,466 5,000 -466 -8.5%
Asia 3,105 4,192 +1,086 +35.0% 4,243 5,500 +1,256 +29.6%
Americas 2,867 4,375 +1,508 +52.6% 3,966 5,500 +1,533 +38.6%
Europe 5,346 6,541 +1,194 +22.3% 7,358 9,000 +1,641 +22.3%
41,756 62,683 +20,927 +50.1% 56,967 81,000 +24,032 +42.2%
Japan 13,519 19,041 +5,522 +40.8% 18,511 25,000 +6,488 +35.1%
Asia 20,572 32,327 +11,755 +57.1% 28,270 40,500 +12,229 +43.3%
Americas 5,433 7,209 +1,776 +32.7% 7,272 10,500 +3,227 +44.4%
Europe 2,230 4,103 +1,872 +84.0% 2,912 5,000 +2,087 +71.6%
18,332 20,270 +1,937 +10.6% 26,825 29,000 +2,174 +8.1%
Japan 4,218 4,859 +640 +15.2% 6,140 7,000 +859 +14.0%
Asia 4,782 4,765 -17 -0.4% 7,413 8,000 +586 +7.9%
Americas 5,369 6,543 +1,173 +21.8% 7,632 8,000 +367 +4.8%
Europe 3,960 4,102 +141 +3.6% 5,638 6,000 +361 +6.4%
129,790 153,957 +24,166 +18.6% 187,080 220,000 +32,919 +17.6%
41,291 45,881 +4,589 +11.1% 57,676 62,500 +4,823 +8.4%
42,422 54,973 +12,550 +29.6% 61,522 76,500 +14,977 +24.3%
19,393 23,649 +4,255 +21.9% 28,282 34,000 +5,717 +20.2%
Europe 26,683 29,453 +2,769 +10.4% 39,598 47,000 +7,401 +18.7%
Changes
Process&Environmental
Changes
Automotive
Scientific
Medical-Diagnostics
Semiconductor
Total
Japan
Asia
Americas
11 HORIBA, Ltd. (Consolidated)

5. Consolidated Financial Results (Quarterly Comparison) Amount : Millions of yen
12/2020 Results 12/2021
1Q 2Q 3Q 4Q 1Q Results 2Q Results 3Q Results 4Q Forecasts
44,997 39,978 44,815 57,289 48,582 52,734 52,639 66,042
3,895 2,781 4,291 8,726 5,936 7,133 6,789 8,640
Operating Income Ratio 8.7% 7.0% 9.6% 15.2% 12.2% 13.5% 12.9% 13.1%
3,906 2,870 4,022 8,600 5,885 7,161 6,820 8,131
Ordinary Income Ratio 8.7% 7.2% 9.0% 15.0% 12.1% 13.6% 13.0% 12.3%
2,287 2,573 2,665 5,662 3,900 4,844 4,976 4,778
Net Income Ratio 5.1% 6.4% 5.9% 9.9% 8.0% 9.2% 9.5% 7.2%
US$ 108.86 107.60 106.19 104.39 106.09 109.55 110.10 110.26
Euro 120.08 118.54 124.17 124.73 127.81 131.97 129.83 130.39
6. Consolidated Segment Results (Quarterly Comparison) Amount : Millions of yen
12/2020 Results 12/2021
1Q 2Q 3Q 4Q 1Q Results 2Q Results 3Q Results 4Q Forecasts
14,870 12,238 14,515 22,290 12,153 12,770 12,388 26,687
4,595 4,078 4,125 5,538 5,224 4,816 4,527 6,432
5,749 4,653 4,875 5,757 6,302 6,593 6,226 5,877
13,847 13,576 14,333 15,210 18,441 21,602 22,640 18,316
5,935 5,431 6,965 8,492 6,461 6,951 6,857 8,729
44,997 39,978 44,815 57,289 48,582 52,734 52,639 66,042
12/2020 Results 12/2021
1Q 2Q 3Q 4Q 1Q Results 2Q Results 3Q Results 4Q Forecasts
322 (591) 204 2,530 (424) (763) (747) 2,935
250 188 323 876 699 414 180 205
156 (231) (405) 54 164 162 (242) 415
3,241 3,177 3,479 4,153 5,257 7,093 7,370 4,277
(75) 238 688 1,111 239 224 228 807
3,895 2,781 4,291 8,726 5,936 7,133 6,789 8,640
ContactCorporate Planning and Investor Relations, Corporate Planning Office, General Administration Division, HORIBA, Ltd. 2, Miyanohigashi-cho, Kisshoin, Minami-ku, Kyoto 601-8510, JapanE-mail: [email protected]
Operating Income
Net Sales
Operating Income
Ordinary Income
Net Income Attributableto Owners of Parent
Net Sales
Automotive
Process&Environmental
Medical-Diagnostics
Semiconductor
Scientific
Total
Total
Automotive
Process&Environmental
Medical-Diagnostics
Semiconductor
Scientific
12 HORIBA, Ltd. (Consolidated)