summary of: “report back to city council regarding pfas”
TRANSCRIPT
PFAS RoundtablePortsmouth City Council
March 19, 2018
Summary of: “Report Back to City Council regarding PFAS”
from: City of Portsmouth – March 5, 2018 City Council Packet and Meeting
1
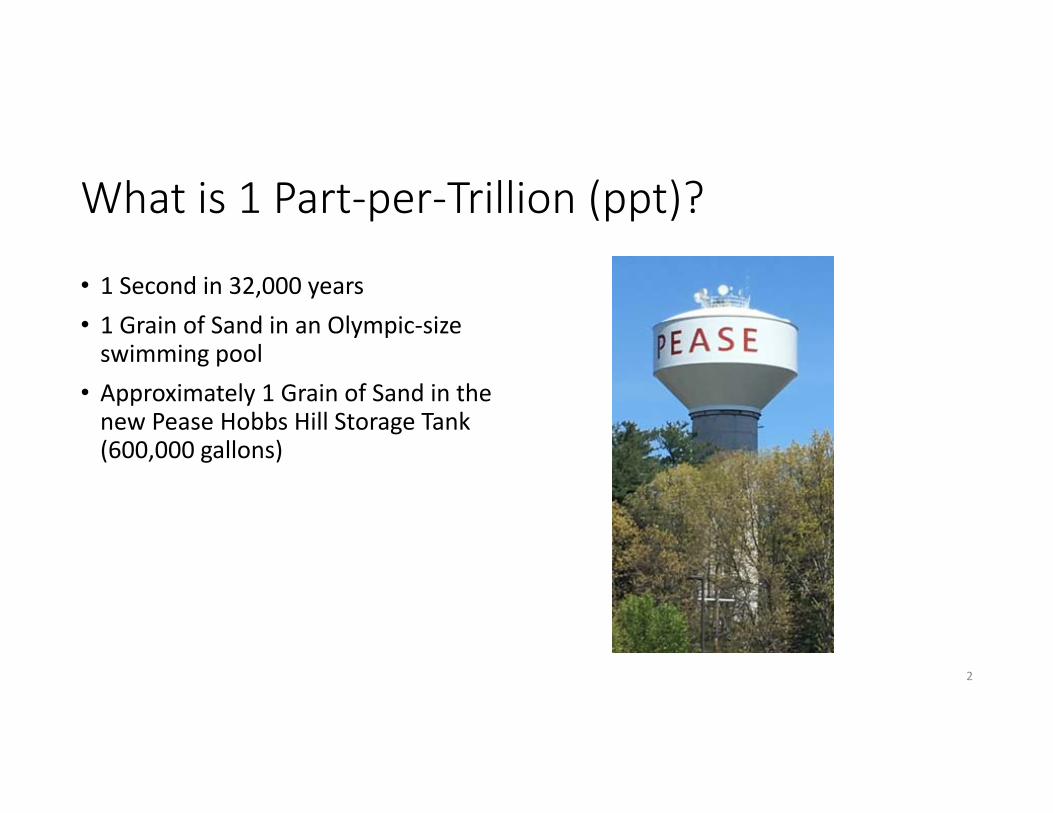
What is 1 Part‐per‐Trillion (ppt)?
• 1 Second in 32,000 years• 1 Grain of Sand in an Olympic‐size swimming pool
• Approximately 1 Grain of Sand in the new Pease Hobbs Hill Storage Tank (600,000 gallons)
2
Newington
Greenland
New Castle –& New Castle Water District
Portsmouth
Rye –& Rye Water District
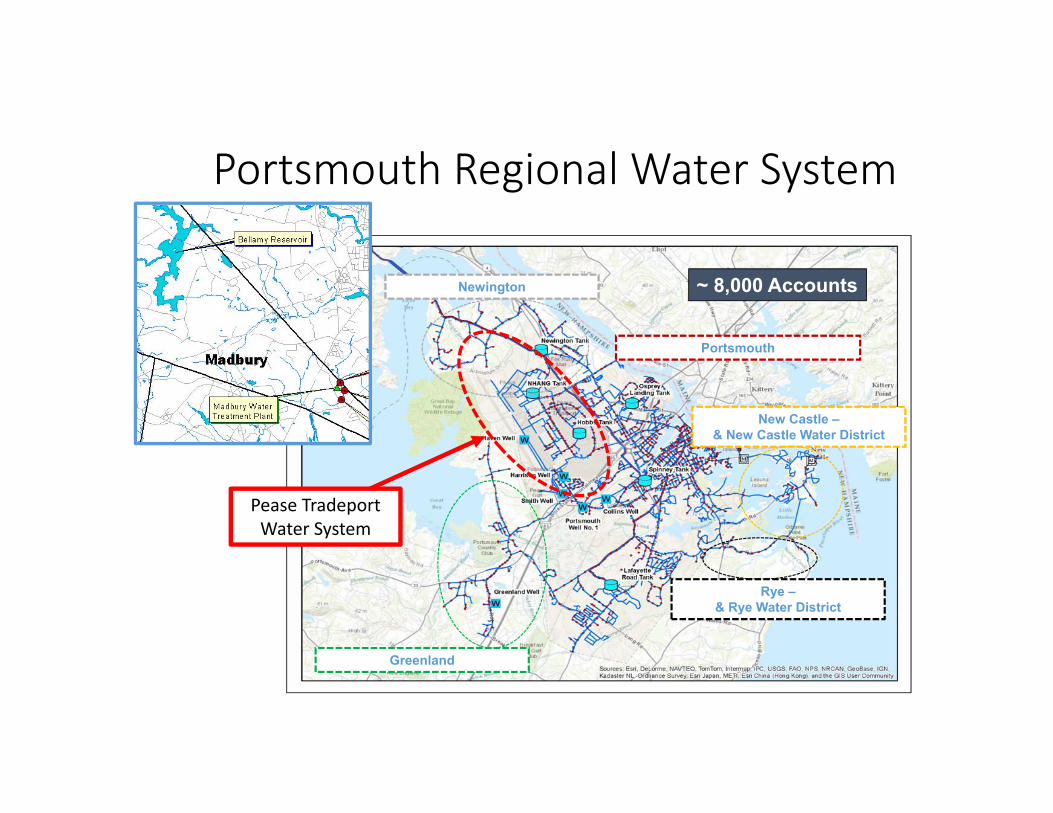
Portsmouth Regional Water System
~ 8,000 Accounts
Pease TradeportWater System

Haven Well
Smith Well
Harrison Well
Grafton Road Water Facility
Newington Booster Station
Air National Guard Tank
Hobbs Hill Tank
PeaseTradeportWater System
Booster from Portsmouth to Pease
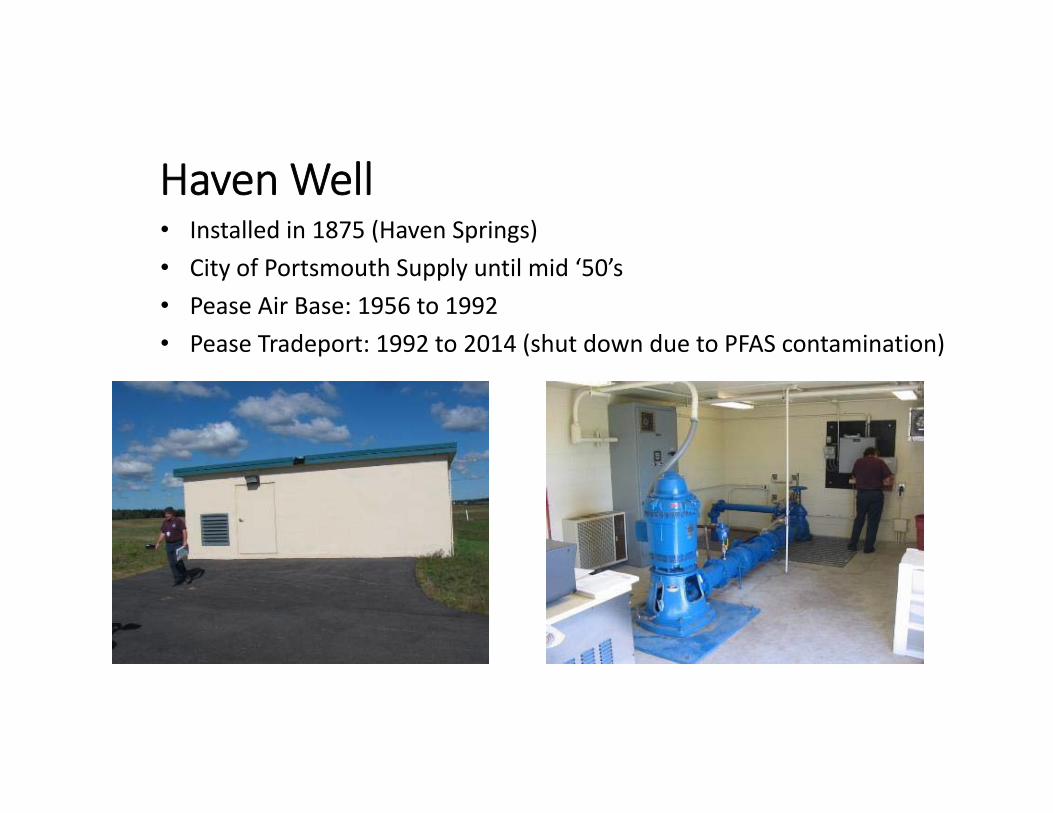
Haven Well• Installed in 1875 (Haven Springs)• City of Portsmouth Supply until mid ‘50’s• Pease Air Base: 1956 to 1992• Pease Tradeport: 1992 to 2014 (shut down due to PFAS contamination)
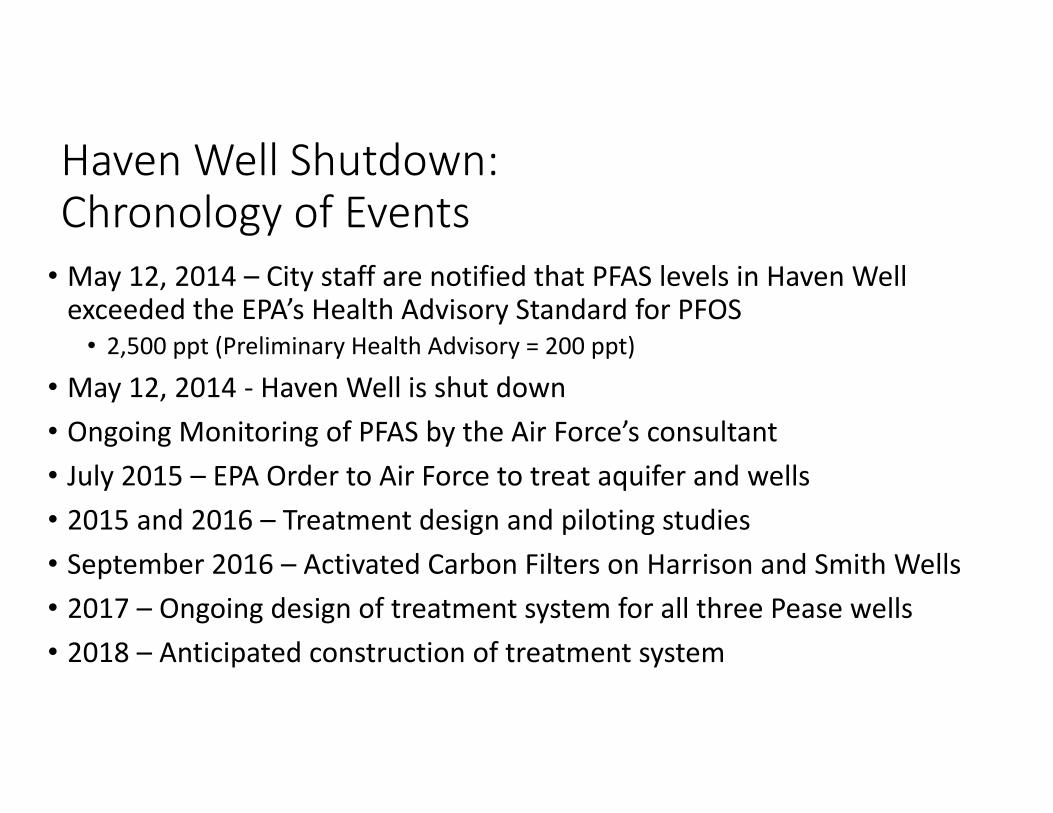
Haven Well Shutdown:Chronology of Events
• May 12, 2014 – City staff are notified that PFAS levels in Haven Well exceeded the EPA’s Health Advisory Standard for PFOS
• 2,500 ppt (Preliminary Health Advisory = 200 ppt)
• May 12, 2014 ‐ Haven Well is shut down• Ongoing Monitoring of PFAS by the Air Force’s consultant• July 2015 – EPA Order to Air Force to treat aquifer and wells• 2015 and 2016 – Treatment design and piloting studies• September 2016 – Activated Carbon Filters on Harrison and Smith Wells• 2017 – Ongoing design of treatment system for all three Pease wells• 2018 – Anticipated construction of treatment system
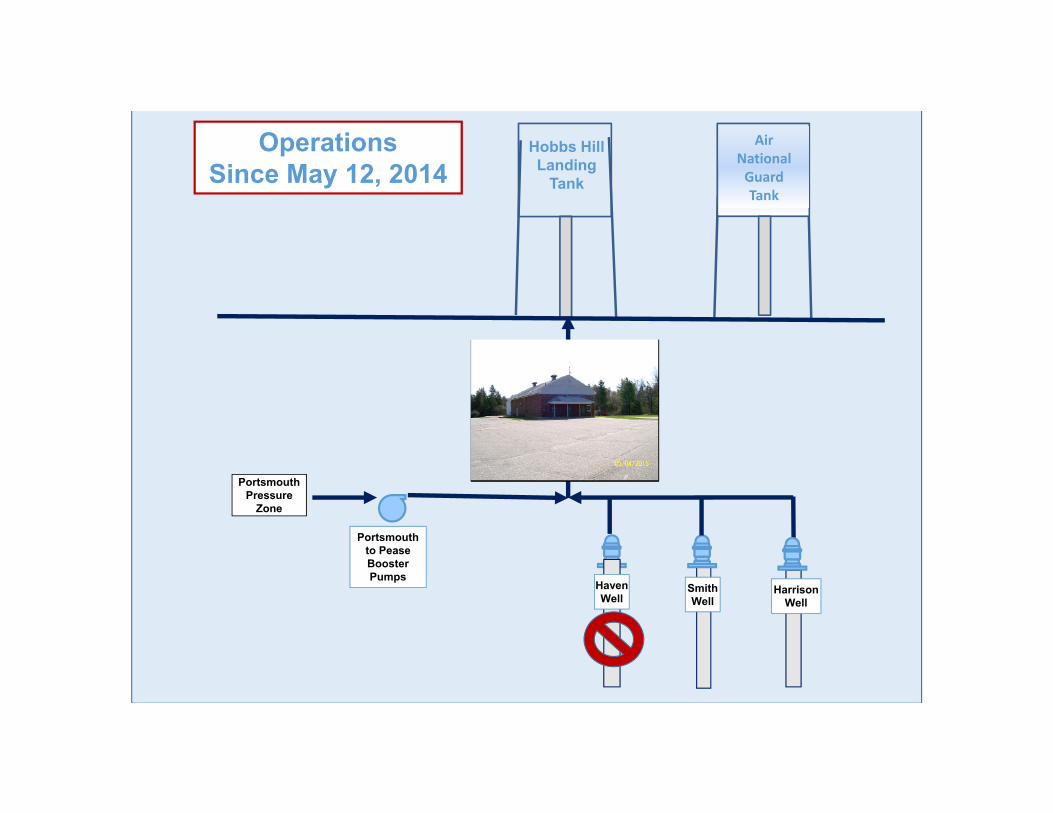
Hobbs Hill Landing
Tank
Portsmouth Pressure
Zone
Harrison Well
Portsmouth to Pease Booster Pumps
OperationsSince May 12, 2014
Smith Well
Haven Well
Air National Guard Tank

Pease Wells – 2014 PFOS Sampling2500
45 170
500
1000
1500
2000
2500
PFOS
PFOS Results ‐ Parts per Trillion (ppt)
Haven Harrison Smith
Note: Recent testing results of Haven Well = 1360 ppt (Haven Pilot Data)
Interim Health Advisory in 2014: 200 ppt – PFOS Health Advisory in May 2016: 70 ppt – PFOA/PFOS
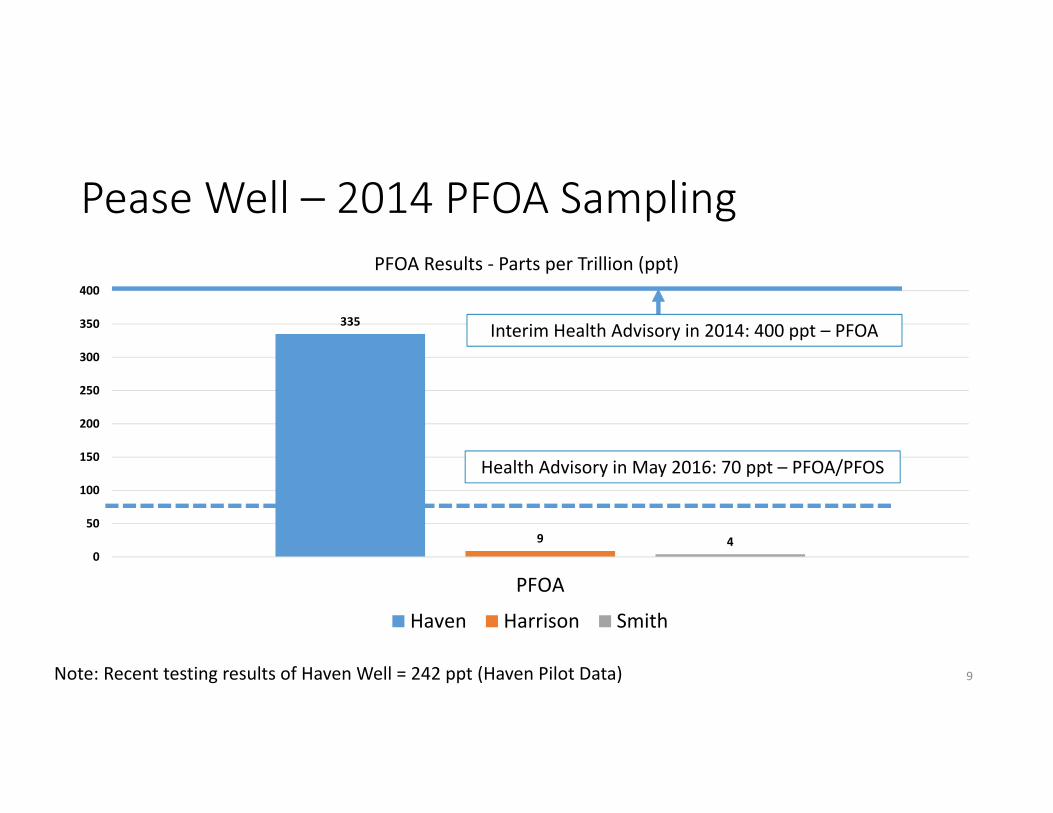
Pease Well – 2014 PFOA Sampling
335
9 40
50
100
150
200
250
300
350
400
PFOA
PFOA Results ‐ Parts per Trillion (ppt)
Haven Harrison Smith
9Note: Recent testing results of Haven Well = 242 ppt (Haven Pilot Data)
Interim Health Advisory in 2014: 400 ppt – PFOA
Health Advisory in May 2016: 70 ppt – PFOA/PFOS
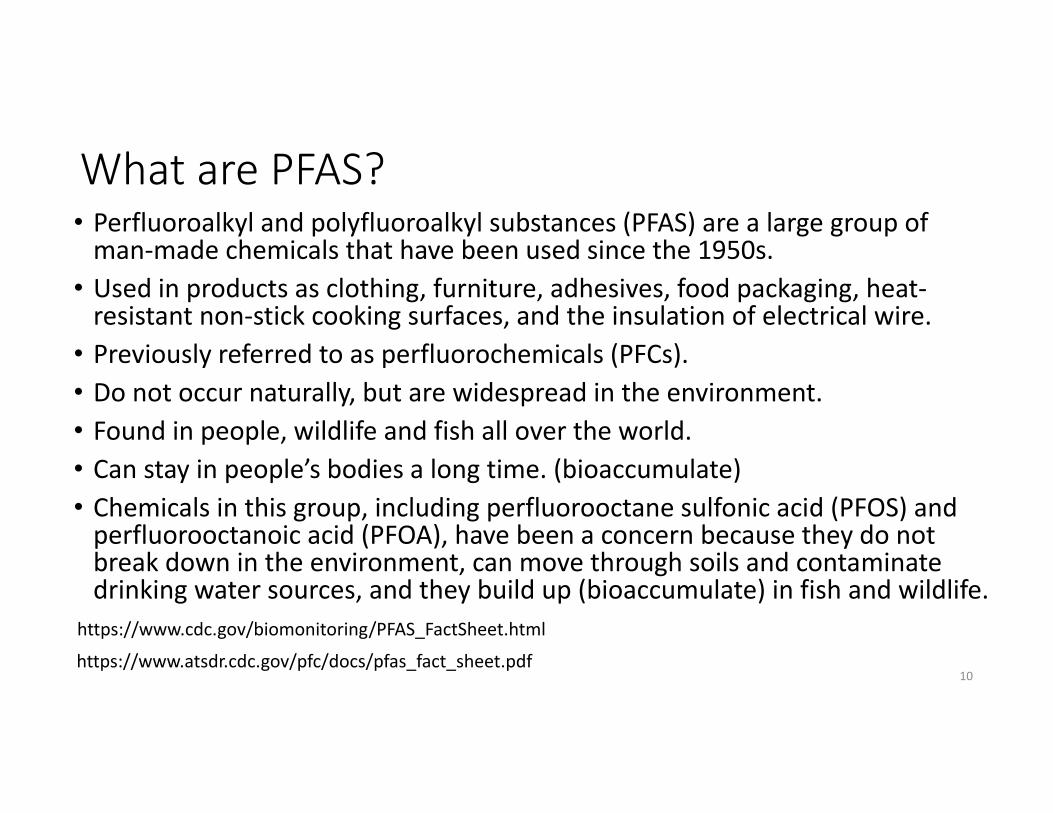
What are PFAS?• Perfluoroalkyl and polyfluoroalkyl substances (PFAS) are a large group of man‐made chemicals that have been used since the 1950s.
• Used in products as clothing, furniture, adhesives, food packaging, heat‐resistant non‐stick cooking surfaces, and the insulation of electrical wire.
• Previously referred to as perfluorochemicals (PFCs). • Do not occur naturally, but are widespread in the environment. • Found in people, wildlife and fish all over the world. • Can stay in people’s bodies a long time. (bioaccumulate) • Chemicals in this group, including perfluorooctane sulfonic acid (PFOS) and perfluorooctanoic acid (PFOA), have been a concern because they do not break down in the environment, can move through soils and contaminate drinking water sources, and they build up (bioaccumulate) in fish and wildlife.
10
https://www.cdc.gov/biomonitoring/PFAS_FactSheet.html
https://www.atsdr.cdc.gov/pfc/docs/pfas_fact_sheet.pdf

PFAS Health Effects• Some scientific studies suggest that certain PFAS may affect different systems in the body.
• Although more research is needed, some studies in people have shown that certain PFAS may:
• affect growth, learning, and behavior of infants and older children • lower a woman’s chance of getting pregnant • interfere with the body’s natural hormones • increase cholesterol levels • affect the immune system and • increase the risk of cancer \
11https://www.atsdr.cdc.gov/pfc/docs/pfas_fact_sheet.pdf

Pease Tradeport Blood Testing and Studies
• State and Federal Health agencies have taken the lead regarding the impacted population served by the Pease Tradeport water system
• Blood testing revealed higher levels of PFAS compounds in Pease population versus national averages
• Pease Citizens Advisory Panel (CAP) is currently involved in potential development of long‐term health studies
• ATSDR “Feasibility Assessment for Epidemiological Studies at Pease International Tradeport, Portsmouth, New Hampshire” released in November 2017
• https://www.atsdr.cdc.gov/sites/pease/documents/Pease_Feasibility_Assessment_November‐2017_508.pdf
12
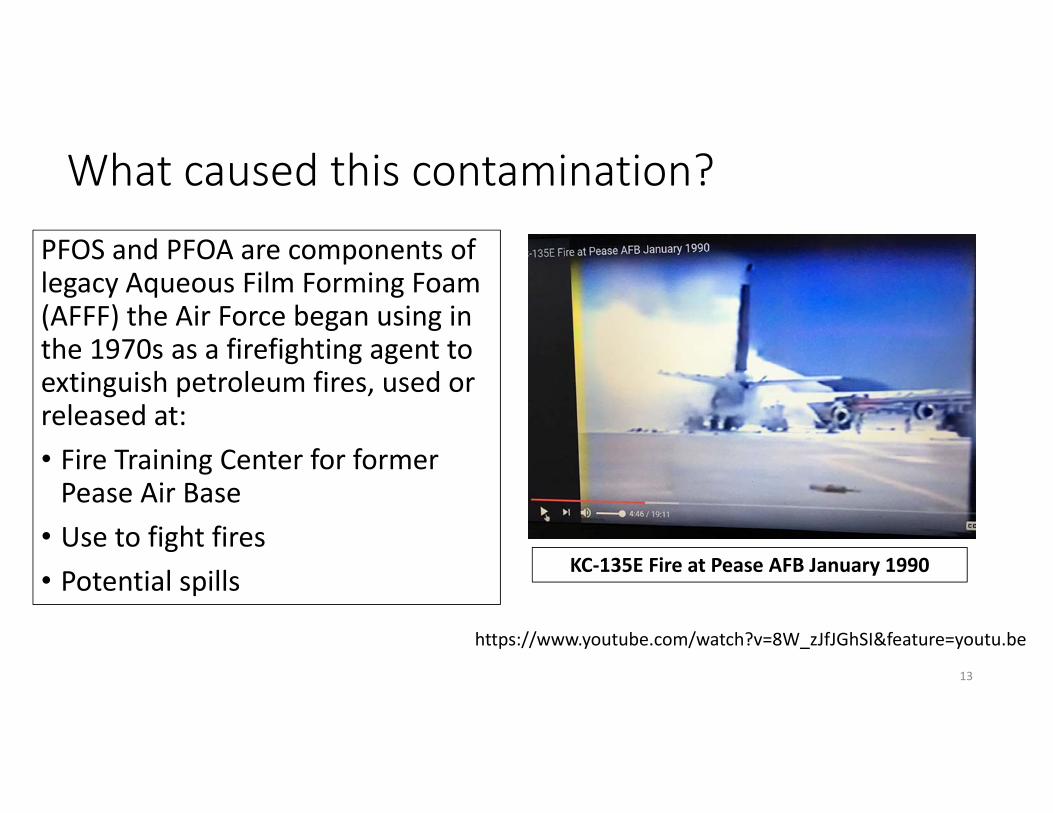
What caused this contamination?
13
KC‐135E Fire at Pease AFB January 1990
PFOS and PFOA are components of legacy Aqueous Film Forming Foam (AFFF) the Air Force began using in the 1970s as a firefighting agent to extinguish petroleum fires, used or released at:• Fire Training Center for former Pease Air Base
• Use to fight fires• Potential spills
https://www.youtube.com/watch?v=8W_zJfJGhSI&feature=youtu.be
14
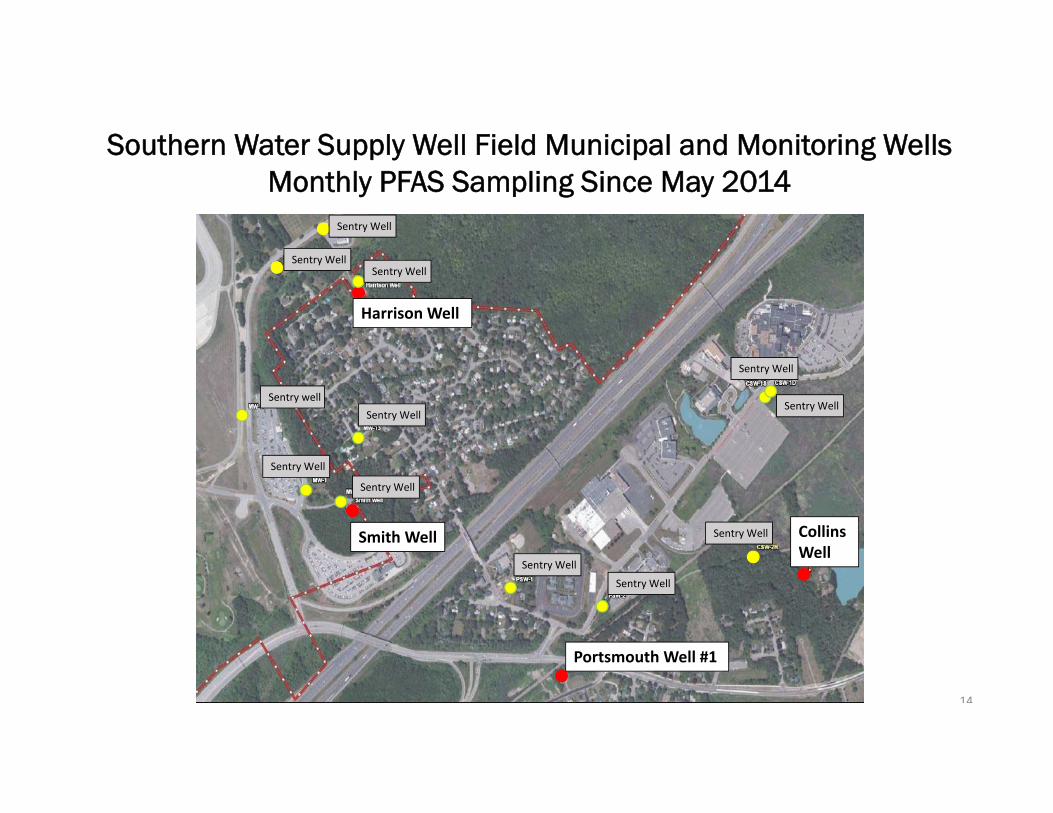
Southern Water Supply Well Field Municipal and Monitoring WellsMonthly PFAS Sampling Since May 2014
Sentry Well
Sentry Well
Sentry Well CollinsWell
Sentry Well
Sentry Well
Portsmouth Well #1
Sentry well
Smith Well
Sentry Well
Sentry Well
Sentry Well
Harrison Well
Sentry Well
Sentry Well
Sentry Well
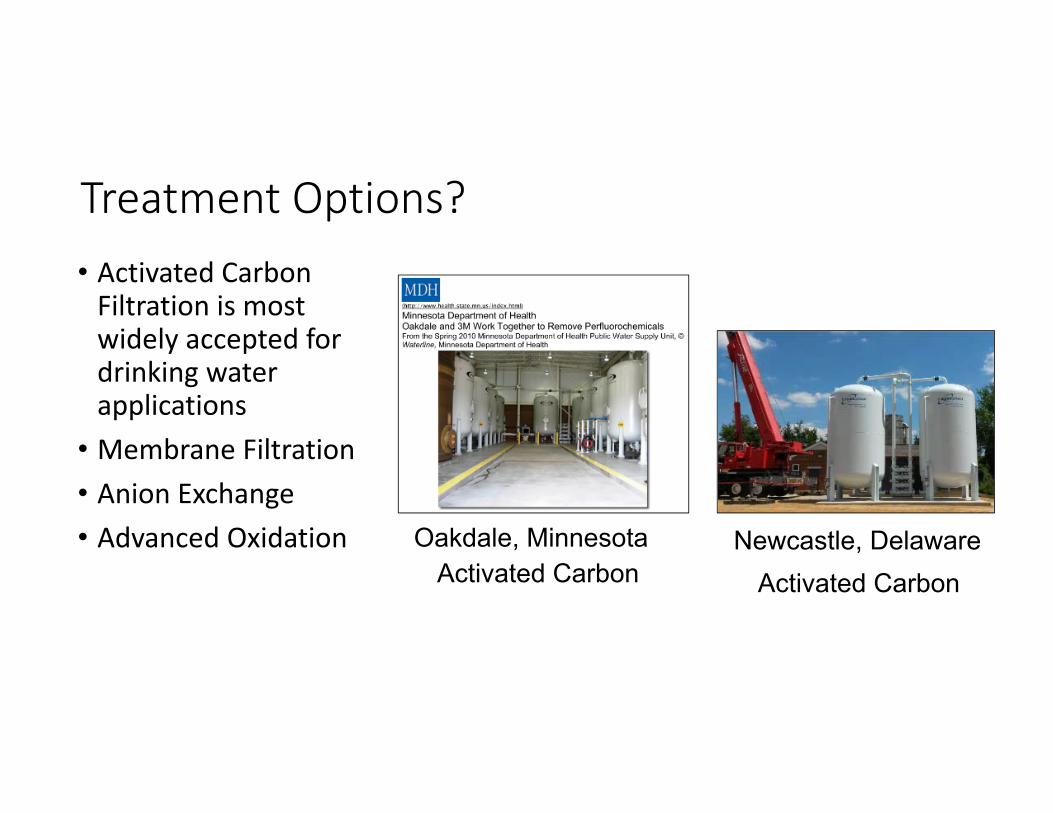
Treatment Options?• Activated Carbon Filtration is most widely accepted for drinking water applications
• Membrane Filtration• Anion Exchange• Advanced Oxidation Oakdale, Minnesota Newcastle, Delaware
Activated CarbonActivated Carbon

City’s analysis of other water systems with PFAS contamination – How are they treating the water?• Research on municipal drinking water systems with the same general groundwater quality indicates Granular Activated Carbon (GAC) as the preferred treatment alternative
• GAC only – 9/13 utilities• GAC and resin – 1/13 utilities• Point of use (carbon) – 1/13 utilities• No treatment – 1/13 utilities• No information – 1/13 utilities
• A Report summarizing this information will be completed soon by the City’s engineering consultant
16
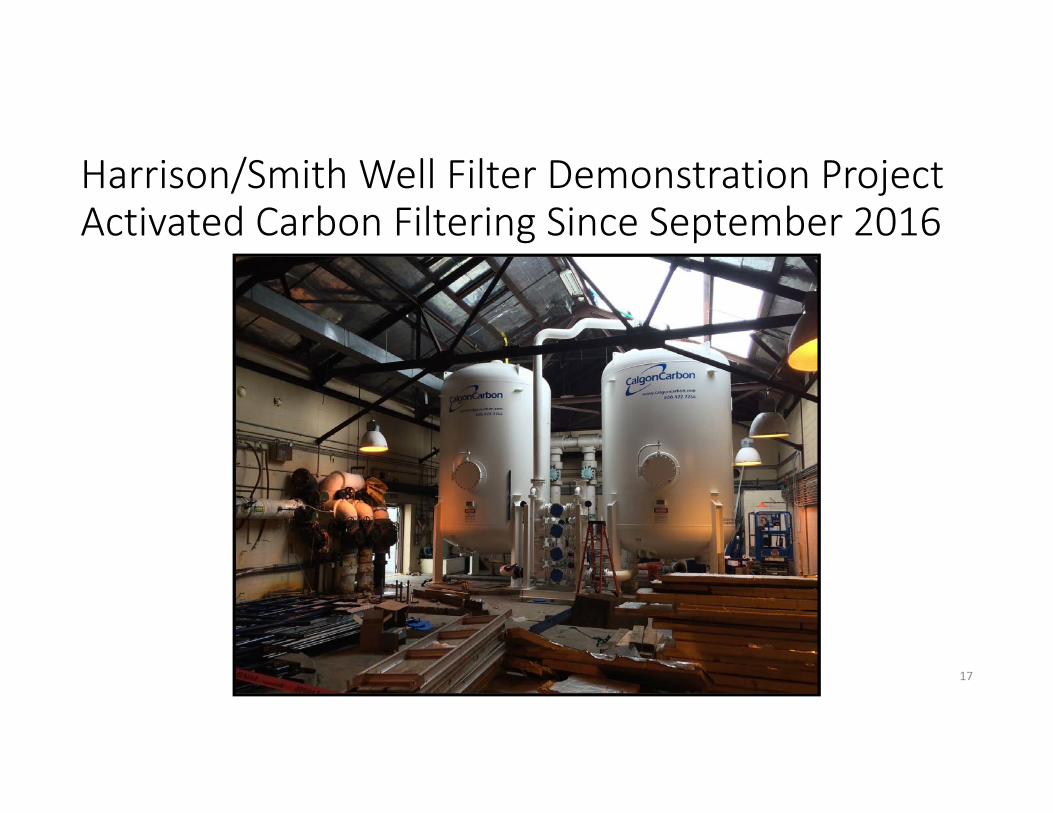
Harrison/Smith Well Filter Demonstration ProjectActivated Carbon Filtering Since September 2016
17
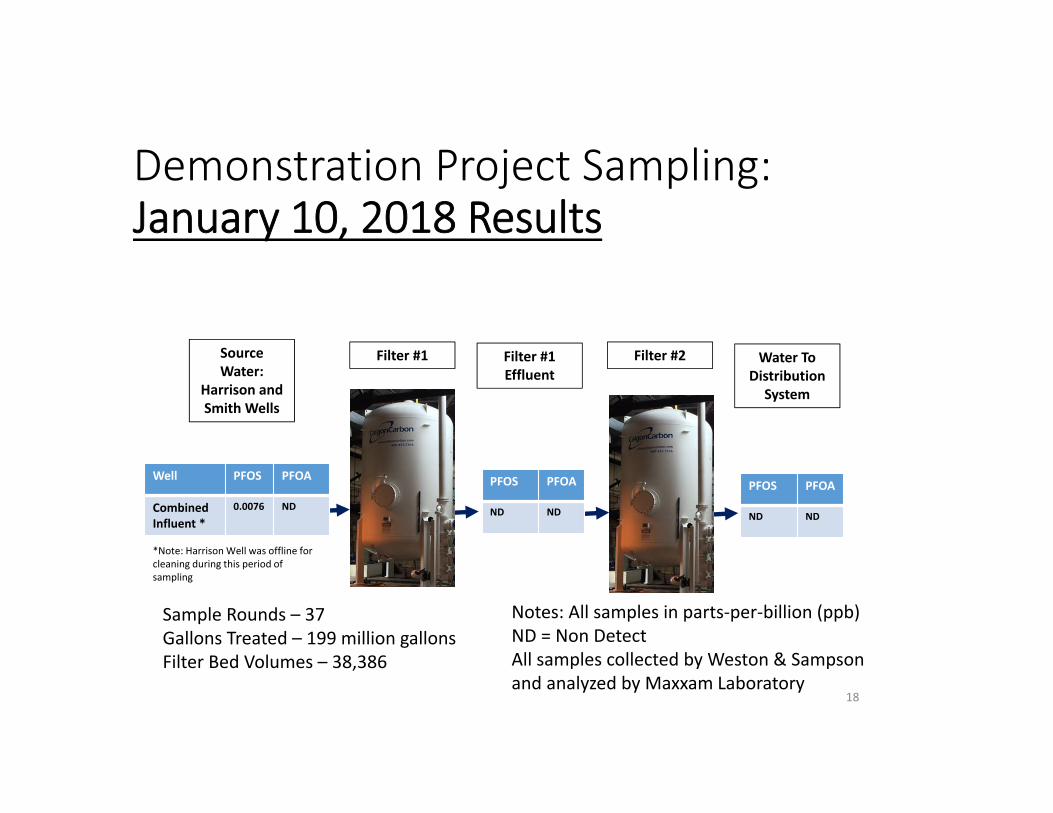
Demonstration Project Sampling:January 10, 2018 Results
18
Well PFOS PFOA
Combined Influent *
0.0076 ND
PFOS PFOA
ND ND
PFOS PFOA
ND ND
Source Water:
Harrison and Smith Wells
Filter #1 Filter #2Filter #1Effluent
Water To Distribution
System
Notes: All samples in parts‐per‐billion (ppb)ND = Non DetectAll samples collected by Weston & Sampson and analyzed by Maxxam Laboratory
Sample Rounds – 37Gallons Treated – 199 million gallonsFilter Bed Volumes – 38,386
*Note: Harrison Well was offline for cleaning during this period of sampling
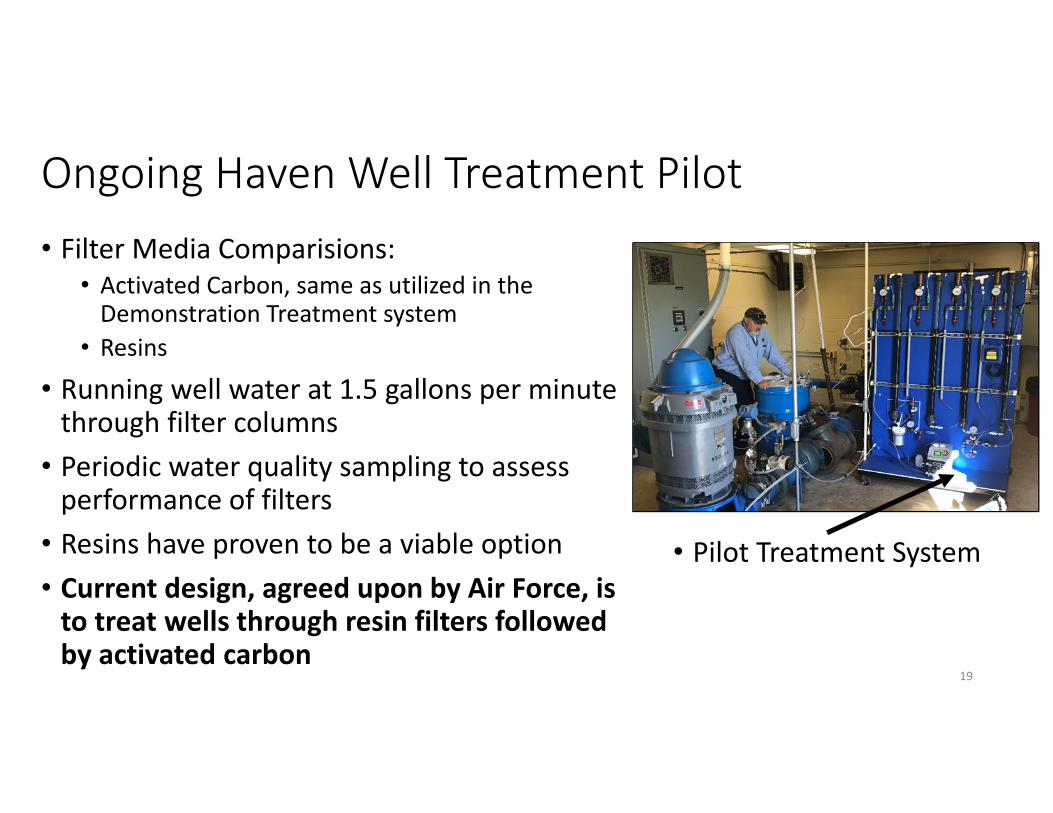
Ongoing Haven Well Treatment Pilot• Filter Media Comparisions:
• Activated Carbon, same as utilized in the Demonstration Treatment system
• Resins
• Running well water at 1.5 gallons per minute through filter columns
• Periodic water quality sampling to assess performance of filters
• Resins have proven to be a viable option• Current design, agreed upon by Air Force, is to treat wells through resin filters followed by activated carbon
19
• Pilot Treatment System
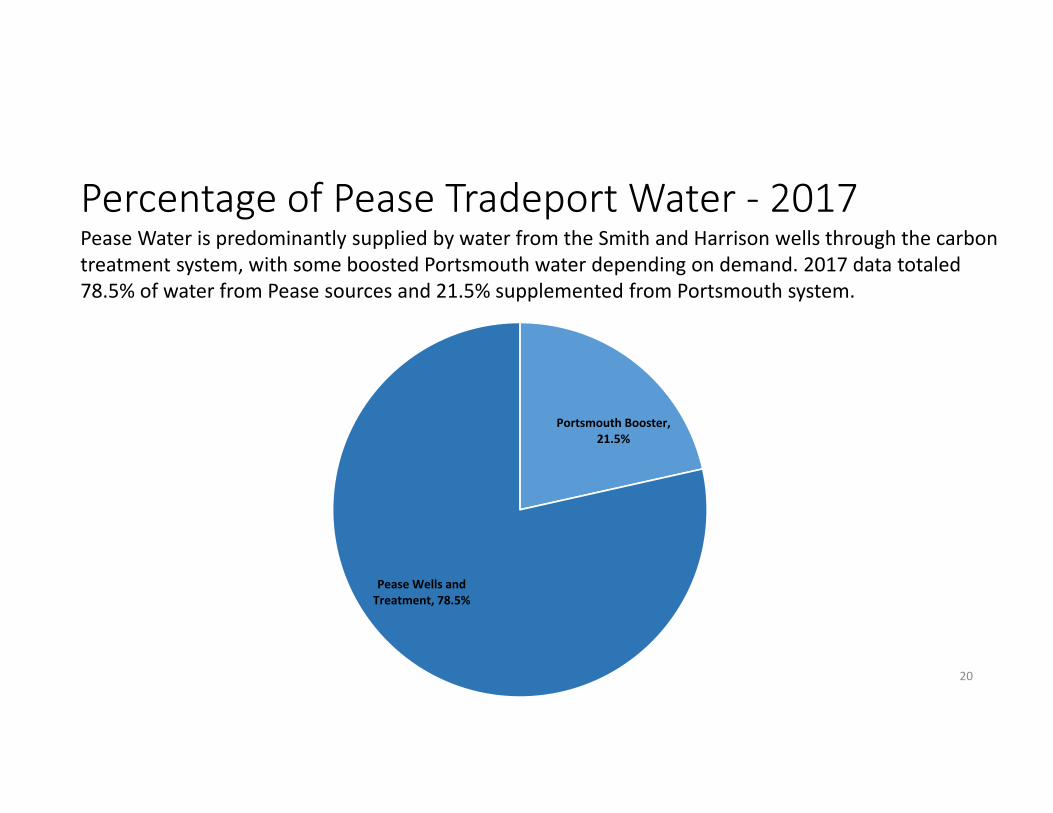
Percentage of Pease Tradeport Water ‐ 2017
20
Portsmouth Booster, 21.5%
Pease Wells and Treatment, 78.5%
Pease Water is predominantly supplied by water from the Smith and Harrison wells through the carbon treatment system, with some boosted Portsmouth water depending on demand. 2017 data totaled 78.5% of water from Pease sources and 21.5% supplemented from Portsmouth system.

Air Force Agreements to Address the Loss of the Haven Well• September 2014
• Hydrogeologic study for replacement well ‐ $154,000• Technical support assistance reimbursement ‐ $25,000
• November 2015• Preliminary Treatment Assessment ‐ $60,000
• April 2016• Treatment Pilot and Demonstration Project ‐ $947,700
• February 2017• Additional Treatment Design Evaluation ‐ $46,623
• August 2017• Final Design of Treatment for Pease Tradeport wells ‐ $1,329,080
• Pending • Facility Construction Cost• Long‐term operations and maintenance
21
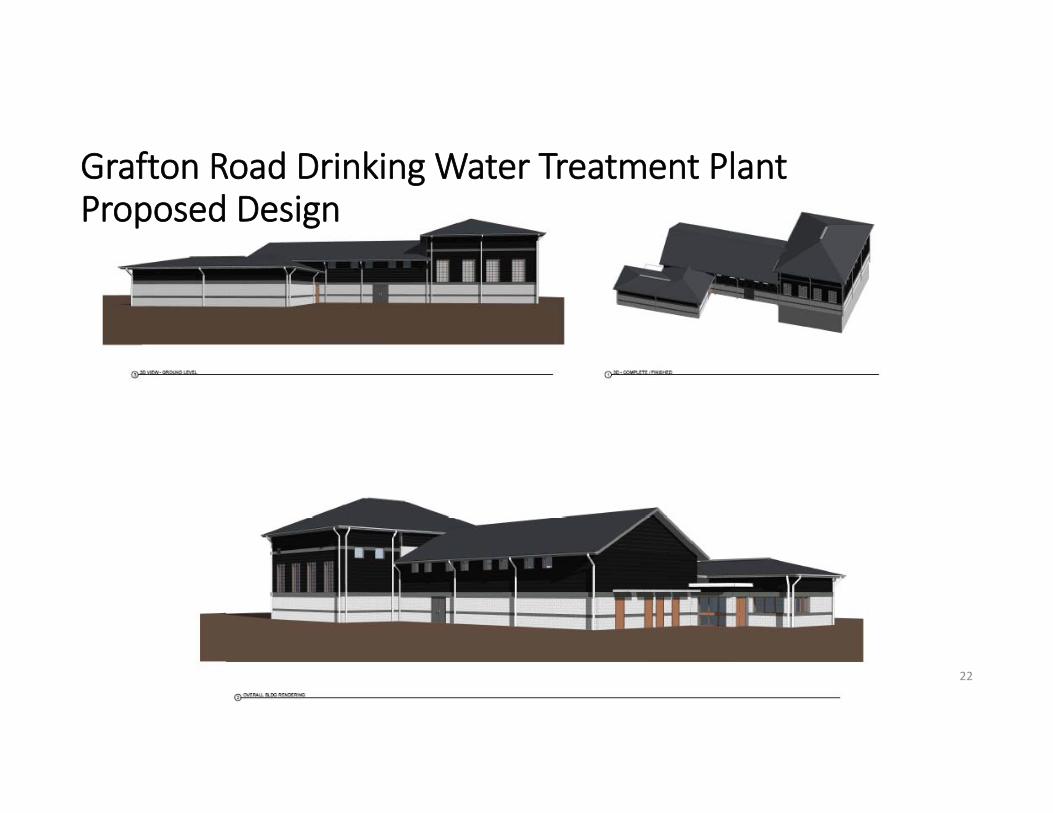
Grafton Road Drinking Water Treatment Plant Proposed Design
22

Haven Well Reactivation – Hydrogeologic and Water Quality Monitoring Program
• Intend to develop comprehensive water quality monitoring plan of PFAS and other key water quality parameters
• Sampling to occur prior to reactivation of Haven Well and will continue thereafter
• Meeting with Air Force again in early 2018 to review
23

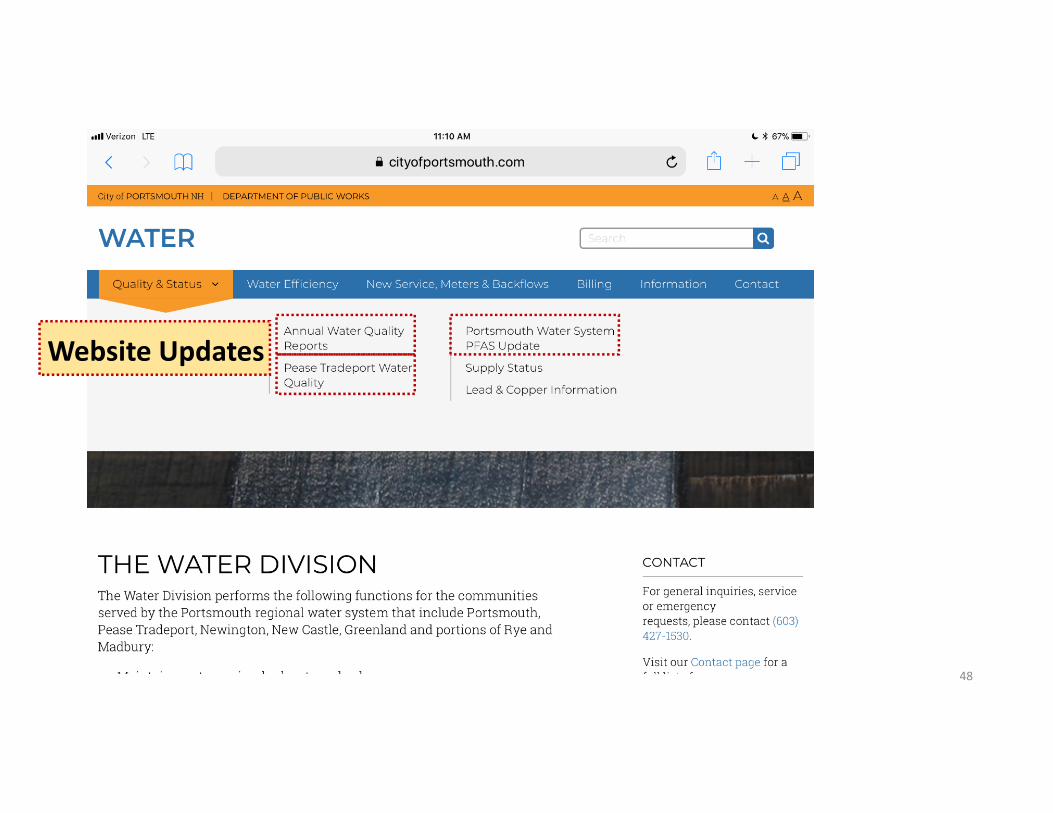
Pease Water System Updates on City Website
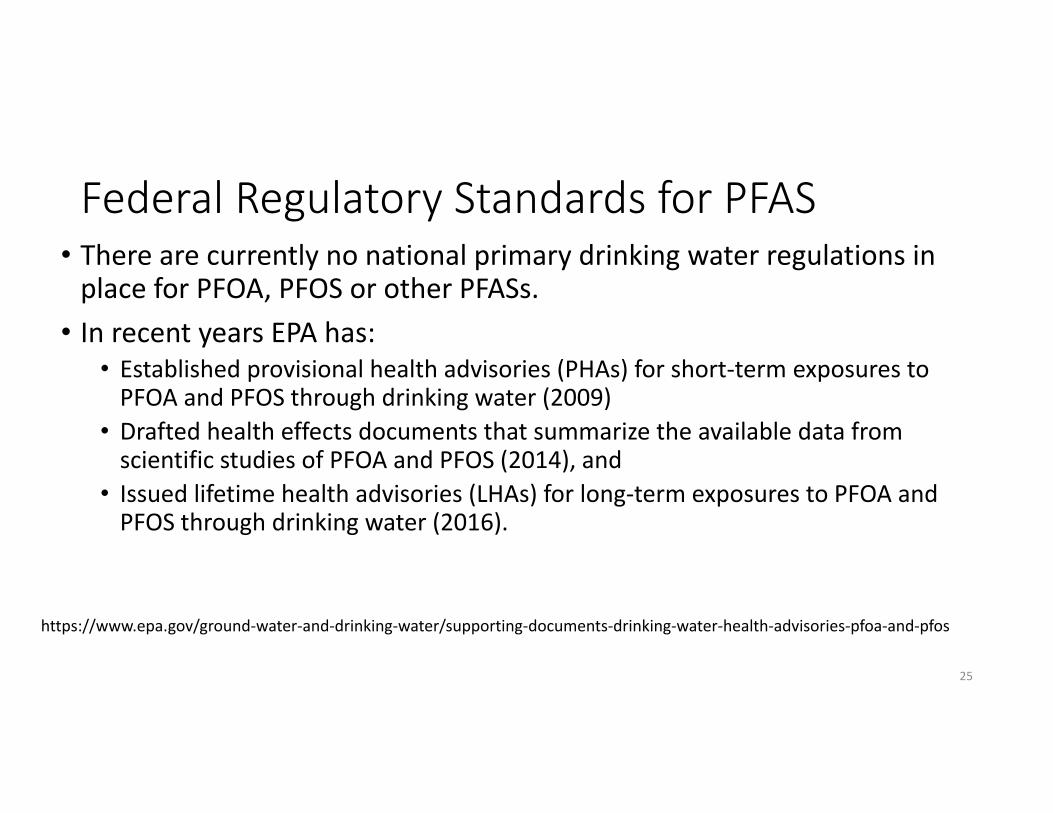
Federal Regulatory Standards for PFAS• There are currently no national primary drinking water regulations in place for PFOA, PFOS or other PFASs.
• In recent years EPA has:• Established provisional health advisories (PHAs) for short‐term exposures to PFOA and PFOS through drinking water (2009)
• Drafted health effects documents that summarize the available data from scientific studies of PFOA and PFOS (2014), and
• Issued lifetime health advisories (LHAs) for long‐term exposures to PFOA and PFOS through drinking water (2016).
25
https://www.epa.gov/ground‐water‐and‐drinking‐water/supporting‐documents‐drinking‐water‐health‐advisories‐pfoa‐and‐pfos
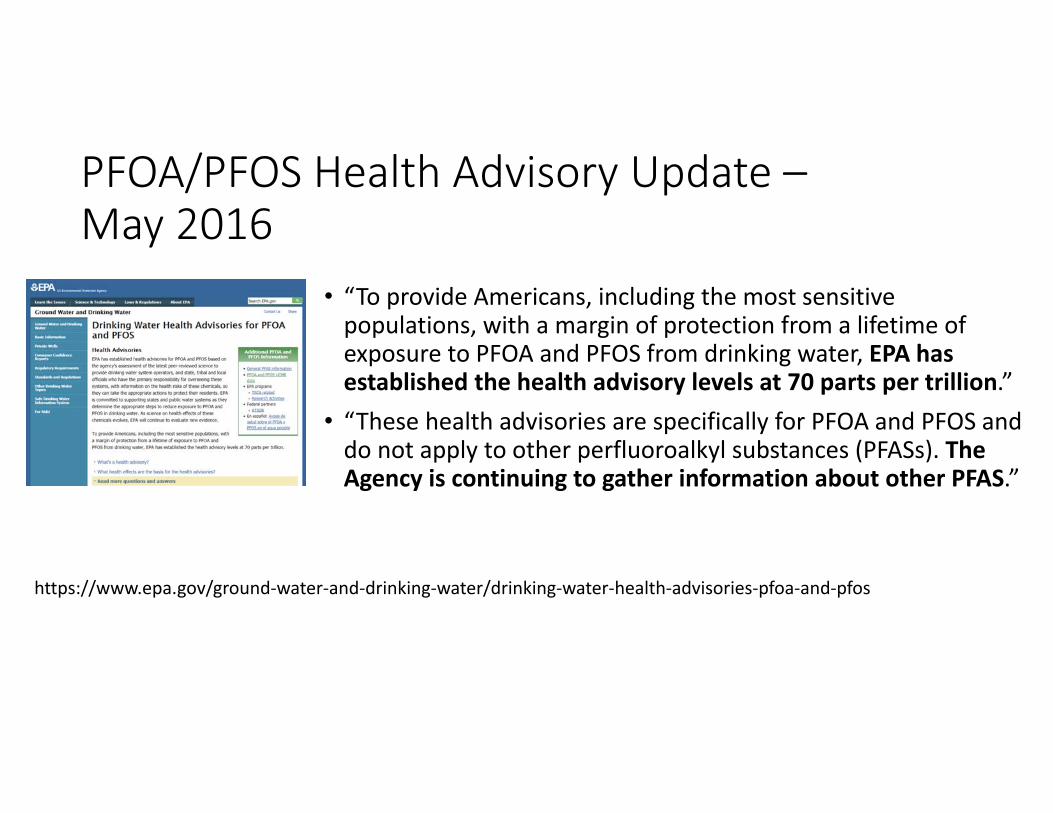
PFOA/PFOS Health Advisory Update –May 2016
• “To provide Americans, including the most sensitive populations, with a margin of protection from a lifetime of exposure to PFOA and PFOS from drinking water, EPA has established the health advisory levels at 70 parts per trillion.”
• “These health advisories are specifically for PFOA and PFOS and do not apply to other perfluoroalkyl substances (PFASs). The Agency is continuing to gather information about other PFAS.”
https://www.epa.gov/ground‐water‐and‐drinking‐water/drinking‐water‐health‐advisories‐pfoa‐and‐pfos

New Hampshire Standards for PFAS
• After a review of EPA’s information, on May 31, 2016, NHDES filed an emergency rule to establish the health advisories as Ambient Groundwater Quality Standards (AGQS).
• NHDES set three groundwater standards: 70 parts per trillion (ppt) for PFOA, 70 ppt for PFOS and 70 ppt for PFOA and PFOS combined.
27
https://www4.des.state.nh.us/nh‐pfas‐investigation/?page_id=92
“It’s important to understand that for DES these are emerging contaminates. We’re constantly staying in touch with what is happening in other states and on the federal level.” – Jim Martin, NHDES: quote from Keene Sentinel - Mar 12, 2018

Future Standards for PFAS• Research into the HA limits for PFAS compounds continues.• Per discussions with regulators it is our understanding that the NHDES continues to review any new science or analysis related to these and other UCMR PFAS chemicals. It is their understanding that by the summer of 2018, the Centers for Disease Control and Prevention (CDC) will release Toxicological Profiles that will establish Minimal Risk Levels for PFOA and PFOS, as well as PFNA and PFHxS.
• This information will likely guide any new HA or MCL standard. • If these standards do change, the City’s water operations staff will continue to test for the levels of these contaminants in our source waters and respond accordingly if they exceed any parameter.
28
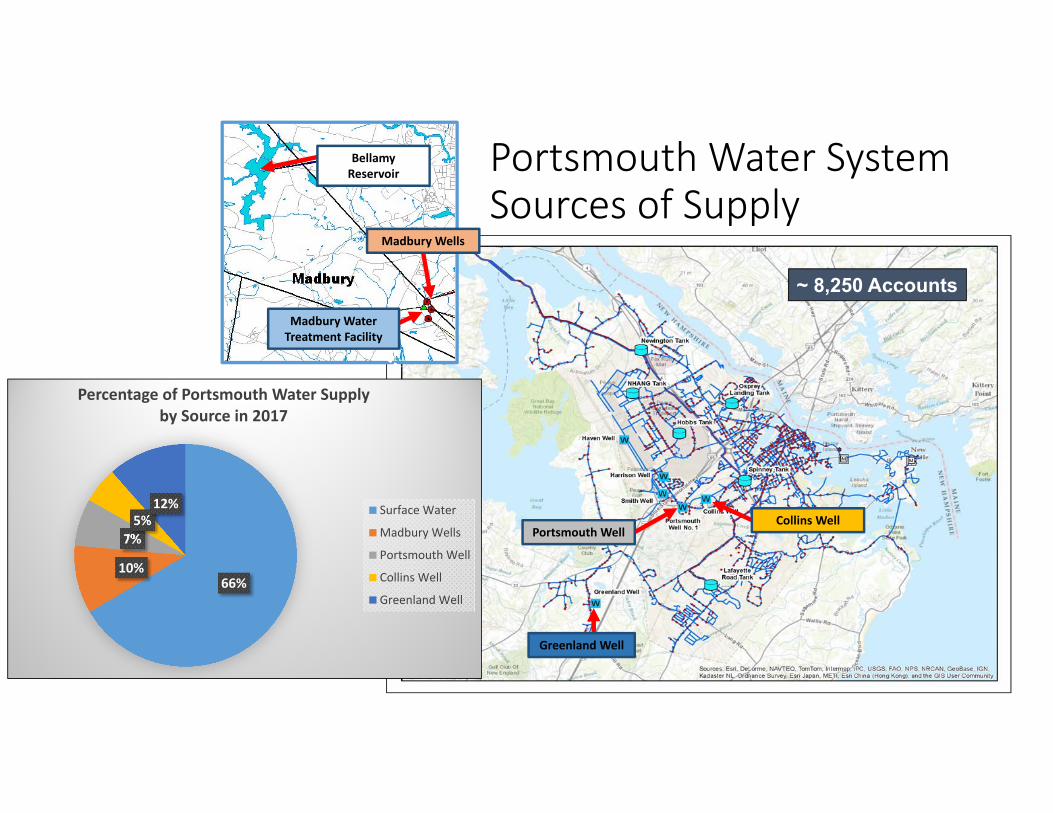
Portsmouth Water System Sources of Supply
~ 8,250 Accounts
Portsmouth WellCollins Well
Greenland Well
Madbury Wells
Madbury Water Treatment Facility
Bellamy Reservoir
66%10%
7%5%
12%
Percentage of Portsmouth Water Supply by Source in 2017
Surface Water
Madbury Wells
Portsmouth Well
Collins Well
Greenland Well
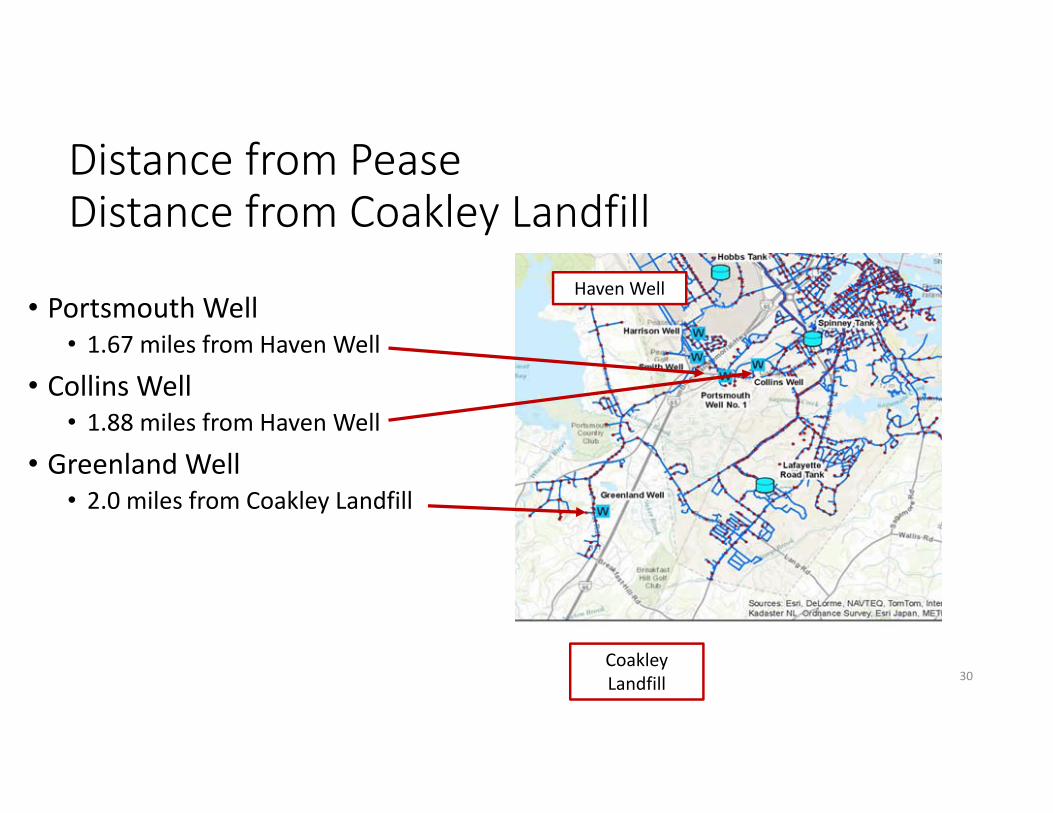
Distance from Pease Distance from Coakley Landfill
30
• Portsmouth Well• 1.67 miles from Haven Well
• Collins Well• 1.88 miles from Haven Well
• Greenland Well• 2.0 miles from Coakley Landfill
Haven Well
Coakley Landfill
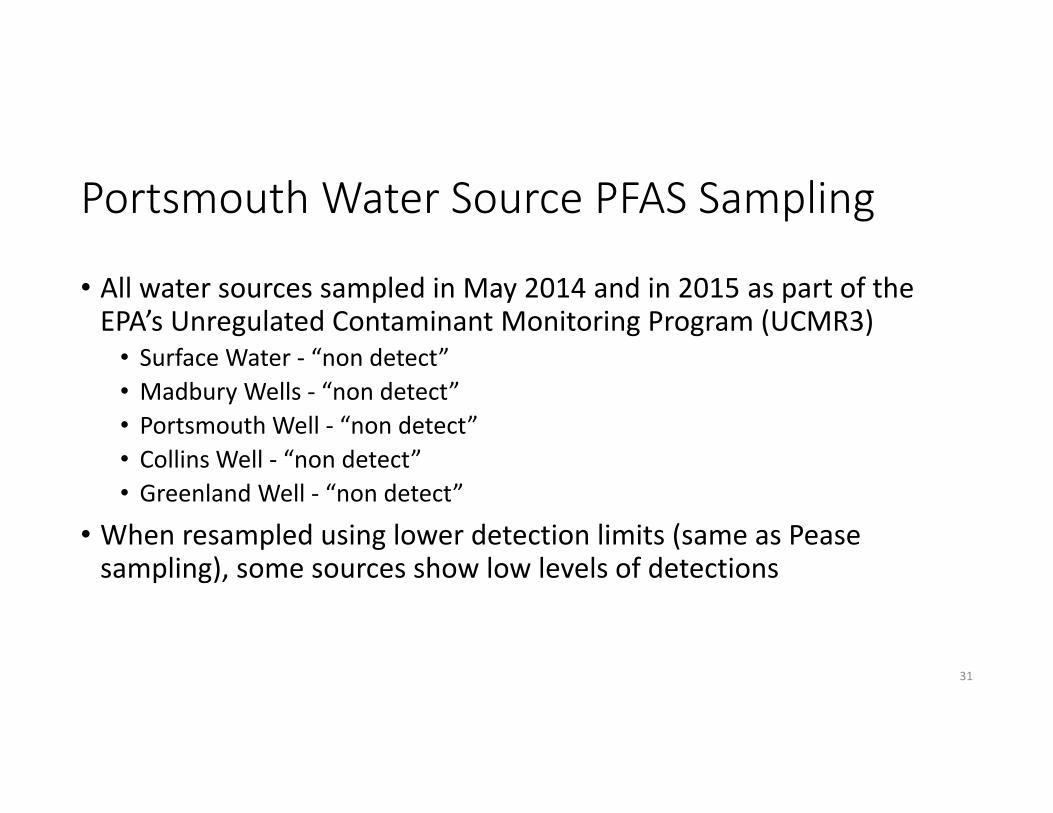
Portsmouth Water Source PFAS Sampling
• All water sources sampled in May 2014 and in 2015 as part of the EPA’s Unregulated Contaminant Monitoring Program (UCMR3)
• Surface Water ‐ “non detect”• Madbury Wells ‐ “non detect”• Portsmouth Well ‐ “non detect”• Collins Well ‐ “non detect”• Greenland Well ‐ “non detect”
• When resampled using lower detection limits (same as Pease sampling), some sources show low levels of detections
31

Maxxam Lab/In‐House Reporting
Levels
UCMR REPORTING
LIMIT
Order of Magnitude: Maxxam MDL vs. UCMR
Units RDL
Typical MDL ‐ reported on lab reports
Perfluorobutane Sulfonate (PFBS) ug/L 0.020 0.0019 0.090 47 xPerfluoroheptanoic Acid (PFHpA) ug/L 0.020 0.0047 0.010 2 xPerfluorohexane Sulfonate (PFHxS) ug/L 0.020 0.0040 0.030 8 xPerfluoro‐n‐Octanoic Acid (PFOA) ug/L 0.020 0.0053 0.020 4 xPerfluorononanoic Acid (PFNA) ug/L 0.020 0.0046 0.020 4 xPerfluorooctane Sulfonate (PFOS) ug/L 0.020 0.0033 0.040 12 x
Lower Sampling Limits ‐
Portsmouth/Pease Sampling versus UCMR3
RDL – Reportable Detection LimitMDL – Minimum Detection LimitUCMR3 – EPA’s Unregulated Contaminant Monitoring Rule
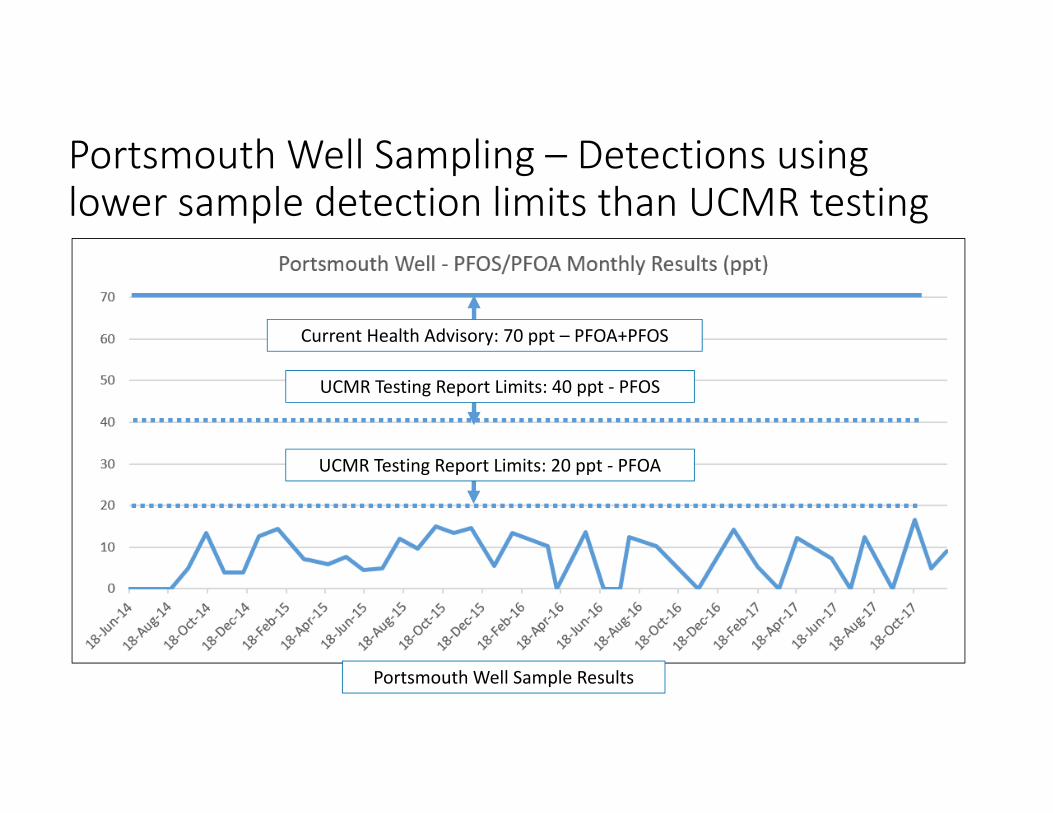
Portsmouth Well Sample Results
UCMR Testing Report Limits: 20 ppt ‐ PFOA
UCMR Testing Report Limits: 40 ppt ‐ PFOS
Current Health Advisory: 70 ppt – PFOA+PFOS
Portsmouth Well Sampling – Detections using lower sample detection limits than UCMR testing
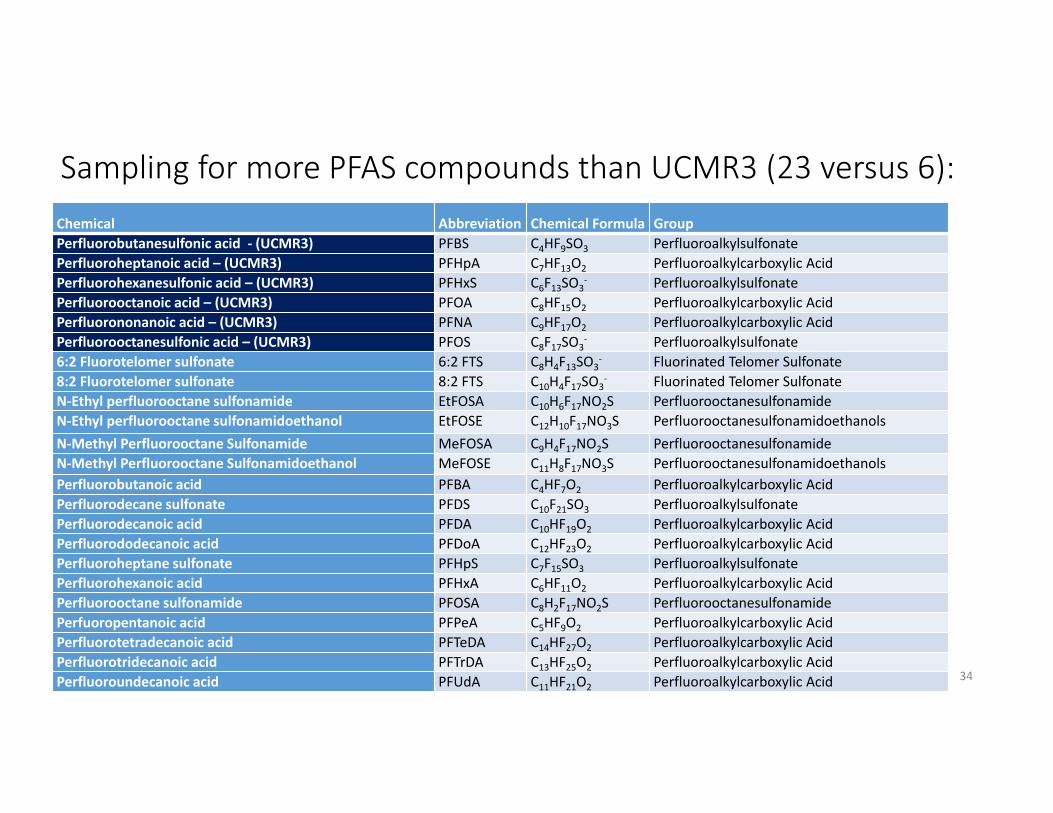
Sampling for more PFAS compounds than UCMR3 (23 versus 6):Chemical Abbreviation Chemical Formula GroupPerfluorobutanesulfonic acid ‐ (UCMR3) PFBS C4HF9SO3 PerfluoroalkylsulfonatePerfluoroheptanoic acid – (UCMR3) PFHpA C7HF13O2 Perfluoroalkylcarboxylic AcidPerfluorohexanesulfonic acid – (UCMR3) PFHxS C6F13SO3
‐ PerfluoroalkylsulfonatePerfluorooctanoic acid – (UCMR3) PFOA C8HF15O2 Perfluoroalkylcarboxylic AcidPerfluorononanoic acid – (UCMR3) PFNA C9HF17O2 Perfluoroalkylcarboxylic AcidPerfluorooctanesulfonic acid – (UCMR3) PFOS C8F17SO3
‐ Perfluoroalkylsulfonate6:2 Fluorotelomer sulfonate 6:2 FTS C8H4F13SO3
‐ Fluorinated Telomer Sulfonate8:2 Fluorotelomer sulfonate 8:2 FTS C10H4F17SO3
‐ Fluorinated Telomer SulfonateN‐Ethyl perfluorooctane sulfonamide EtFOSA C10H6F17NO2S PerfluorooctanesulfonamideN‐Ethyl perfluorooctane sulfonamidoethanol EtFOSE C12H10F17NO3S PerfluorooctanesulfonamidoethanolsN‐Methyl Perfluorooctane Sulfonamide MeFOSA C9H4F17NO2S PerfluorooctanesulfonamideN‐Methyl Perfluorooctane Sulfonamidoethanol MeFOSE C11H8F17NO3S PerfluorooctanesulfonamidoethanolsPerfluorobutanoic acid PFBA C4HF7O2 Perfluoroalkylcarboxylic AcidPerfluorodecane sulfonate PFDS C10F21SO3 PerfluoroalkylsulfonatePerfluorodecanoic acid PFDA C10HF19O2 Perfluoroalkylcarboxylic AcidPerfluorododecanoic acid PFDoA C12HF23O2 Perfluoroalkylcarboxylic AcidPerfluoroheptane sulfonate PFHpS C7F15SO3 PerfluoroalkylsulfonatePerfluorohexanoic acid PFHxA C6HF11O2 Perfluoroalkylcarboxylic AcidPerfluorooctane sulfonamide PFOSA C8H2F17NO2S PerfluorooctanesulfonamidePerfuoropentanoic acid PFPeA C5HF9O2 Perfluoroalkylcarboxylic AcidPerfluorotetradecanoic acid PFTeDA C14HF27O2 Perfluoroalkylcarboxylic AcidPerfluorotridecanoic acid PFTrDA C13HF25O2 Perfluoroalkylcarboxylic AcidPerfluoroundecanoic acid PFUdA C11HF21O2 Perfluoroalkylcarboxylic Acid 34

What about sampling for more than 23 PFAS Compounds?
• City has been in communication with EPA and DES regarding potential studies and is willing to participate
• Testing methods must be peer reviewed and accepted• EPA has a work group that has been formed to explore both additional testing and testing methodology
• Very complex science
35

Are PFAS Concentrations Increasing?Trends show no increase over four years
36
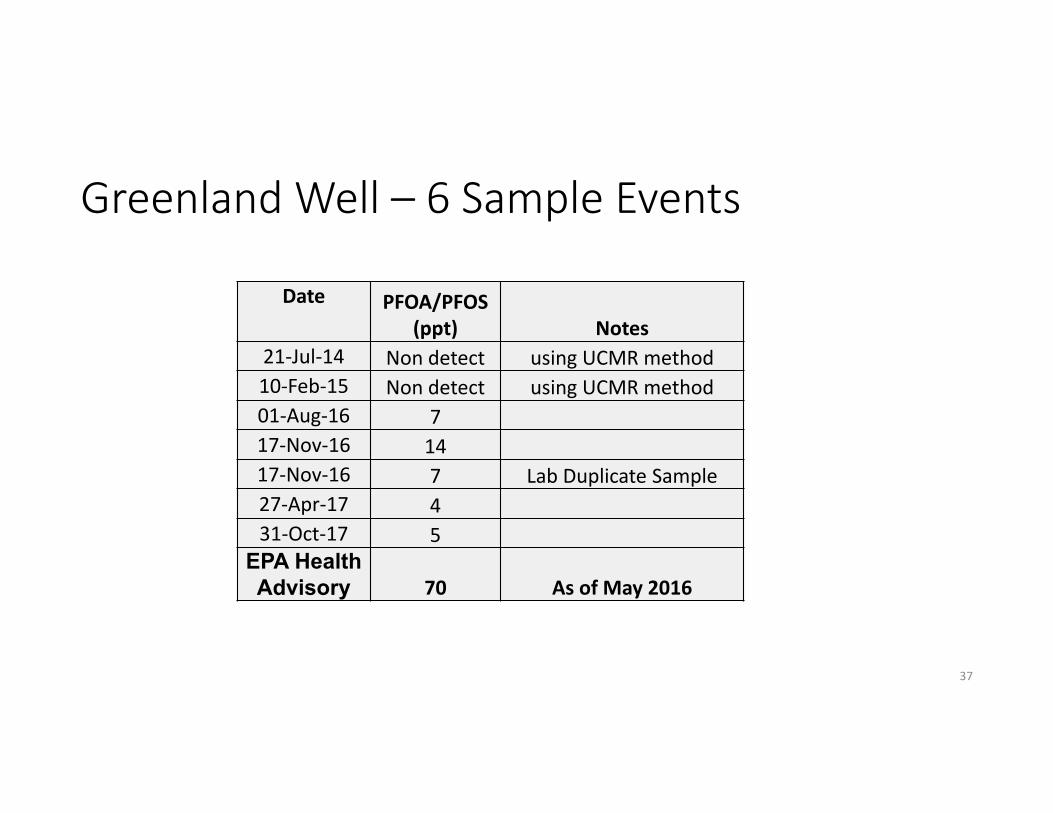
Greenland Well – 6 Sample Events
Date PFOA/PFOS (ppt) Notes
21‐Jul‐14 Non detect using UCMR method10‐Feb‐15 Non detect using UCMR method01‐Aug‐16 717‐Nov‐16 1417‐Nov‐16 7 Lab Duplicate Sample27‐Apr‐17 431‐Oct‐17 5
EPA Health Advisory 70 As of May 2016
37
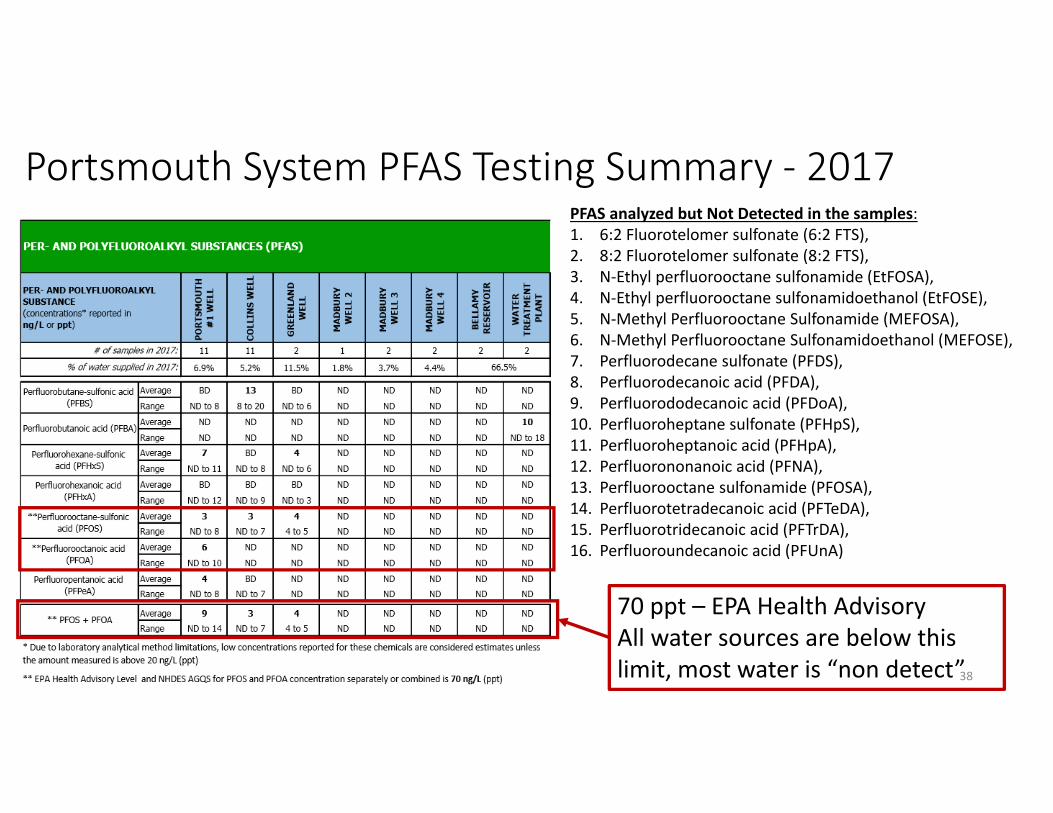
Portsmouth System PFAS Testing Summary ‐ 2017
38
70 ppt – EPA Health AdvisoryAll water sources are below this limit, most water is “non detect”
PFAS analyzed but Not Detected in the samples:1. 6:2 Fluorotelomer sulfonate (6:2 FTS), 2. 8:2 Fluorotelomer sulfonate (8:2 FTS), 3. N‐Ethyl perfluorooctane sulfonamide (EtFOSA), 4. N‐Ethyl perfluorooctane sulfonamidoethanol (EtFOSE), 5. N‐Methyl Perfluorooctane Sulfonamide (MEFOSA), 6. N‐Methyl Perfluorooctane Sulfonamidoethanol (MEFOSE), 7. Perfluorodecane sulfonate (PFDS), 8. Perfluorodecanoic acid (PFDA), 9. Perfluorododecanoic acid (PFDoA),10. Perfluoroheptane sulfonate (PFHpS), 11. Perfluoroheptanoic acid (PFHpA), 12. Perfluorononanoic acid (PFNA), 13. Perfluorooctane sulfonamide (PFOSA), 14. Perfluorotetradecanoic acid (PFTeDA), 15. Perfluorotridecanoic acid (PFTrDA), 16. Perfluoroundecanoic acid (PFUnA)
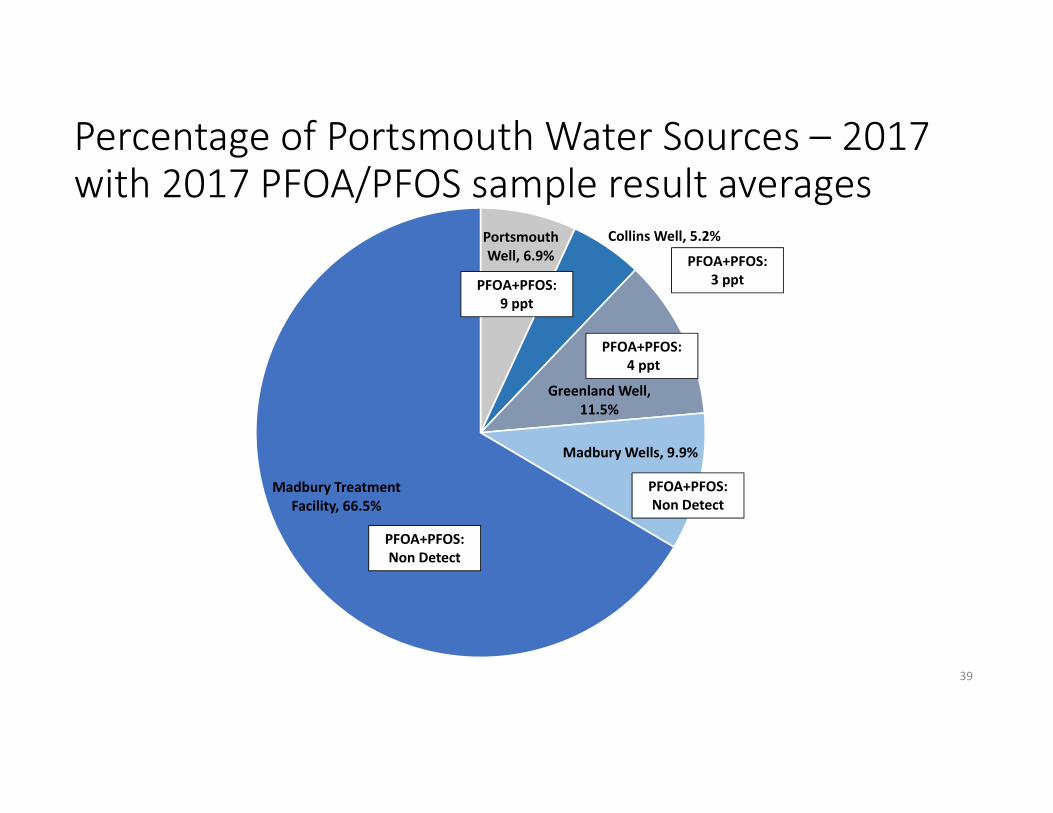
Percentage of Portsmouth Water Sources – 2017 with 2017 PFOA/PFOS sample result averages
39
Portsmouth Well, 6.9%
Collins Well, 5.2%
Greenland Well, 11.5%
Madbury Wells, 9.9%
Madbury Treatment Facility, 66.5%
PFOA+PFOS: Non Detect
PFOA+PFOS:4 ppt
PFOA+PFOS:3 pptPFOA+PFOS:
9 ppt
PFOA+PFOS: Non Detect

Do we recommend additional treatment at customer taps?• We do not recommend additional treatment for any compound that already meets regulatory or health advisory standards
• Customers may choose to treat on their own but should make sure to select the appropriate treatment system (not all carbon filters are the same) and assure that it is properly maintained. Sampling for performance is also recommended.
• Informational links to additional treatment are on City’s website:http://files.cityofportsmouth.com/publicworks/pfoa‐inhome‐treatment‐20160518.pdf
40

What might be the reason for detections at other Portsmouth Sources of Supply?• Very low levels of PFAS may be coming from local sources:• Historic use of firefighting foam:
• Accidents• House or business fires
• Past disposal practices near water sources• Car washing• Septic systems leaching into water sources
41
Cape Cod Private Drinking Water Well Study• Pollutants from household wastewater—pharmaceuticals and consumer product chemicals—can make their way into people’s private wells, and that backyard septic systems are likely to blame.
• In tests of water samples from private wells on Cape Cod, researchers at Silent Spring Institute sampled water from 20 private wells throughout Cape Cod and tested the samples for 117 different contaminants.
• 70 percent of the wells contained PFASs (perfluoroalkyl substances.
42
Link to paper: http://www.sciencedirect.com/science/article/pii/S0048969715312353
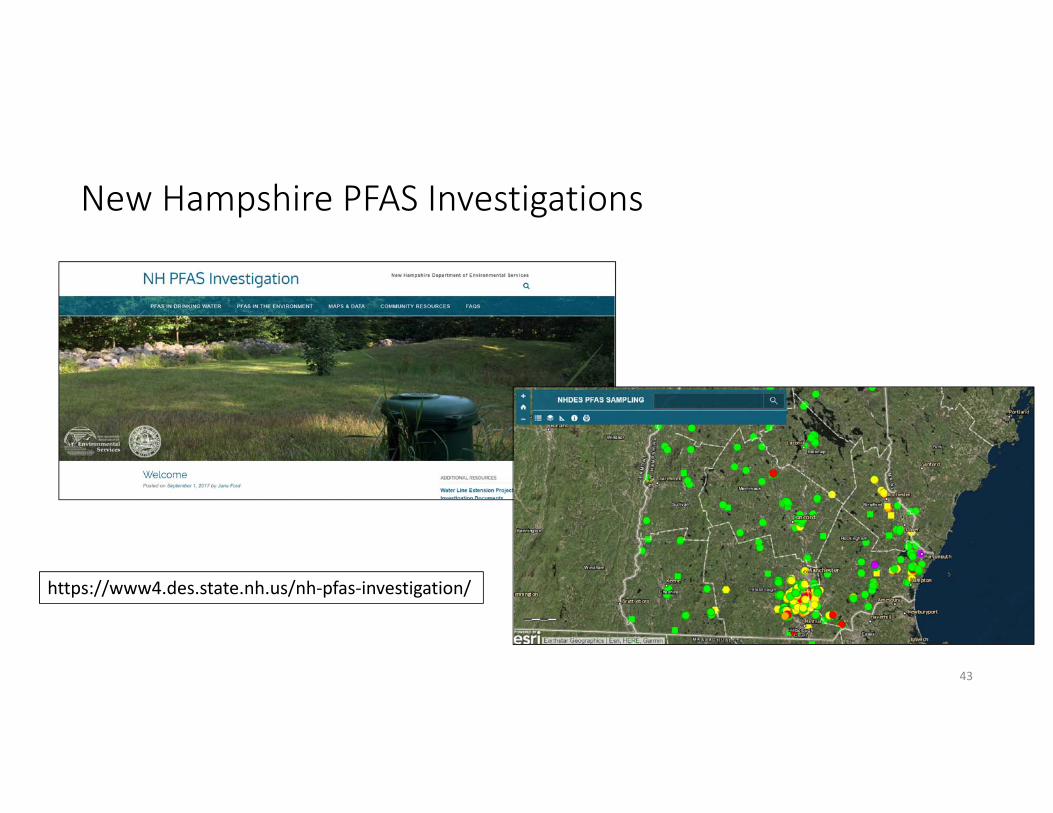
New Hampshire PFAS Investigations
43
https://www4.des.state.nh.us/nh‐pfas‐investigation/
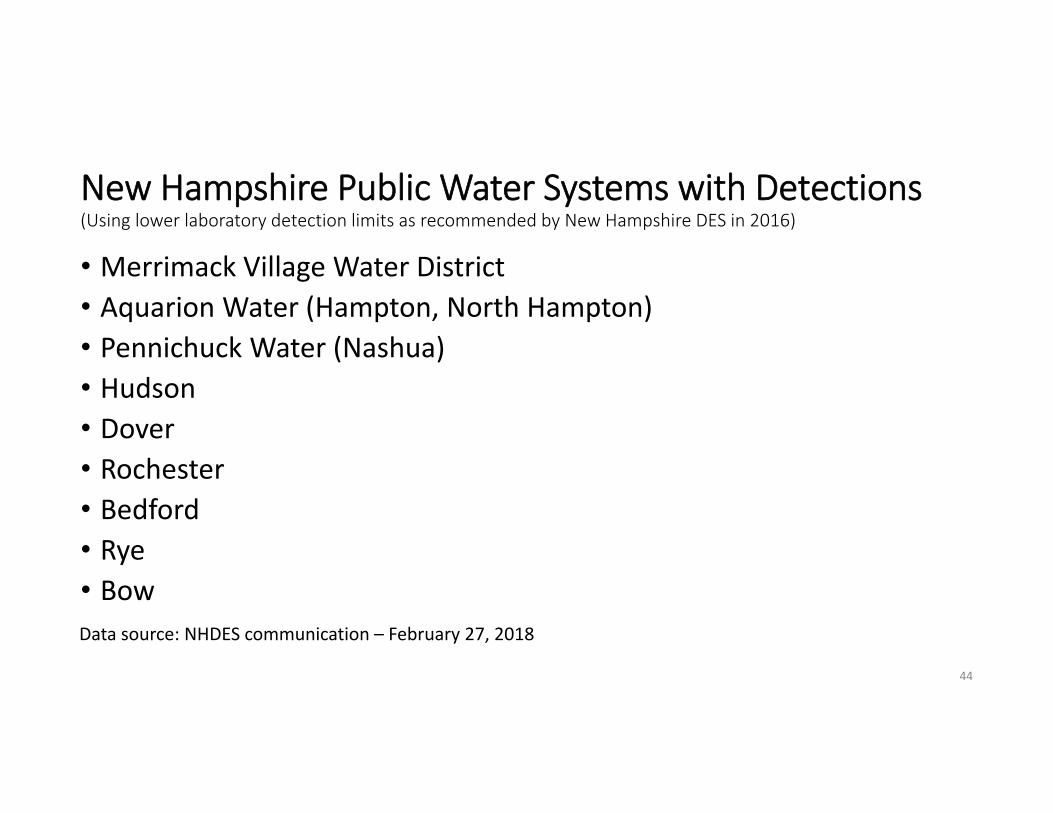
New Hampshire Public Water Systems with Detections (Using lower laboratory detection limits as recommended by New Hampshire DES in 2016)
• Merrimack Village Water District• Aquarion Water (Hampton, North Hampton)• Pennichuck Water (Nashua)• Hudson• Dover• Rochester• Bedford• Rye• Bow
44
Data source: NHDES communication – February 27, 2018
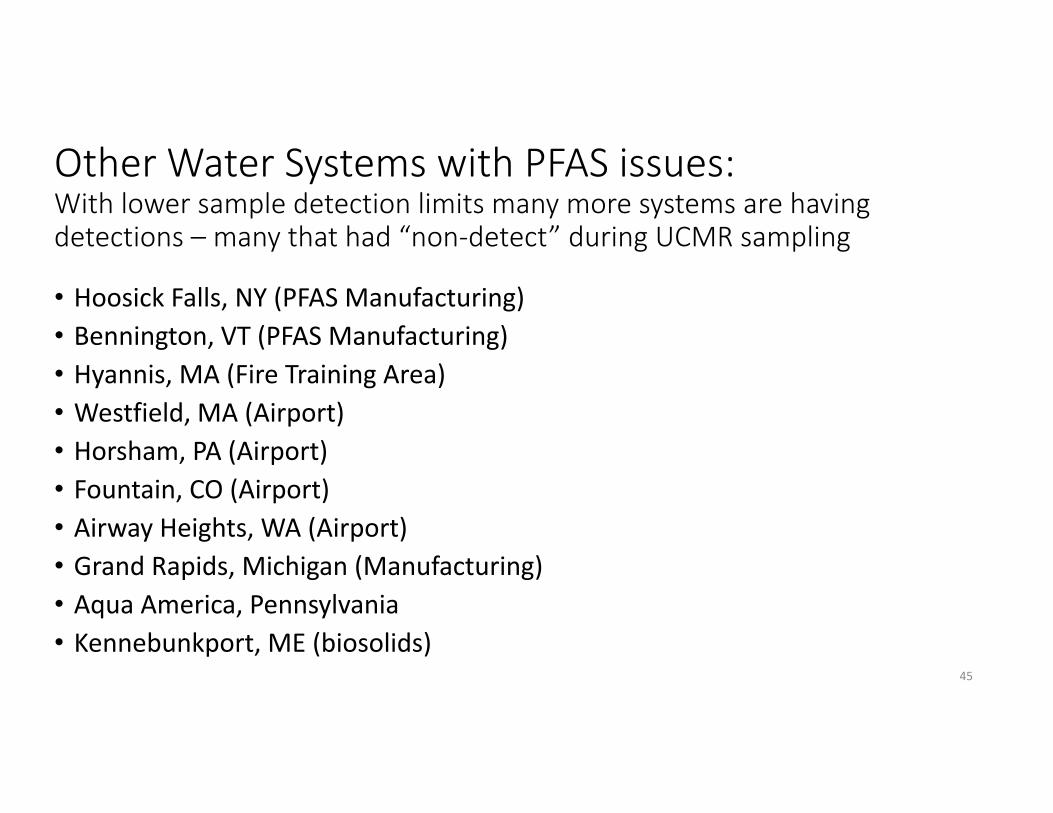
Other Water Systems with PFAS issues:With lower sample detection limits many more systems are having detections – many that had “non‐detect” during UCMR sampling
• Hoosick Falls, NY (PFAS Manufacturing)• Bennington, VT (PFAS Manufacturing)• Hyannis, MA (Fire Training Area)• Westfield, MA (Airport)• Horsham, PA (Airport)• Fountain, CO (Airport)• Airway Heights, WA (Airport)• Grand Rapids, Michigan (Manufacturing)• Aqua America, Pennsylvania• Kennebunkport, ME (biosolids)
45

Public Outreach……

Public Involvement:• Presentations to Portsmouth City Council and Other Groups• Testing for Pease Group • Haven Well Community Advisory Board
• 14 public meetings in 2014• Blood Testing
• March 31st, 2015 – Public Meeting where NHHS Announces Protocol for Pease Blood Testing
• Three public meetings announcing blood test results• ATSDR Community Assistance Panel (CAP)
• Formed in 2016 to address long‐term health concerns• Pease Restoration Advisory Board (RAB)
• Reestablished in 2016 – Meets every quarter
48
Website Updates
Looking Ahead:• Work with the Air Force and regulators to monitor PFAS compounds in the water sources in and around the Haven Well.
• Design and construct drinking water treatment system to treat and remove PFAS compounds in the Pease Tradeport Drinking water system wells.
• Develop a long‐term water quality monitoring plan (to include not only PFAS compounds but other water quality parameters) for the reactivation of the Haven Well.
• Continue twice‐a‐year monitoring of all other Portsmouth water supply sources for PFAS compounds and respond appropriately should contaminant levels appear to be approaching HA levels.
• Work with regulators and waterworks professionals to track and respond to the evolving water quality information, regulations and treatment technologies.
• Provide public information on this and all other water quality parameters in our water systems.
49
Additional Information:
• https://www.cityofportsmouth.com/publicworks/water/pease‐tradeport‐water‐system
• https://www.dhhs.nh.gov/dphs/investigation‐pease.htm• https://www.atsdr.cdc.gov/sites/pease/index.html• http://www.afcec.af.mil/Home/BRAC/Pease/• www.testingforpease.com
50