summary of tasks - math.wpi.edu of tasks appendix table of contents reporting tasks ... column...
TRANSCRIPT
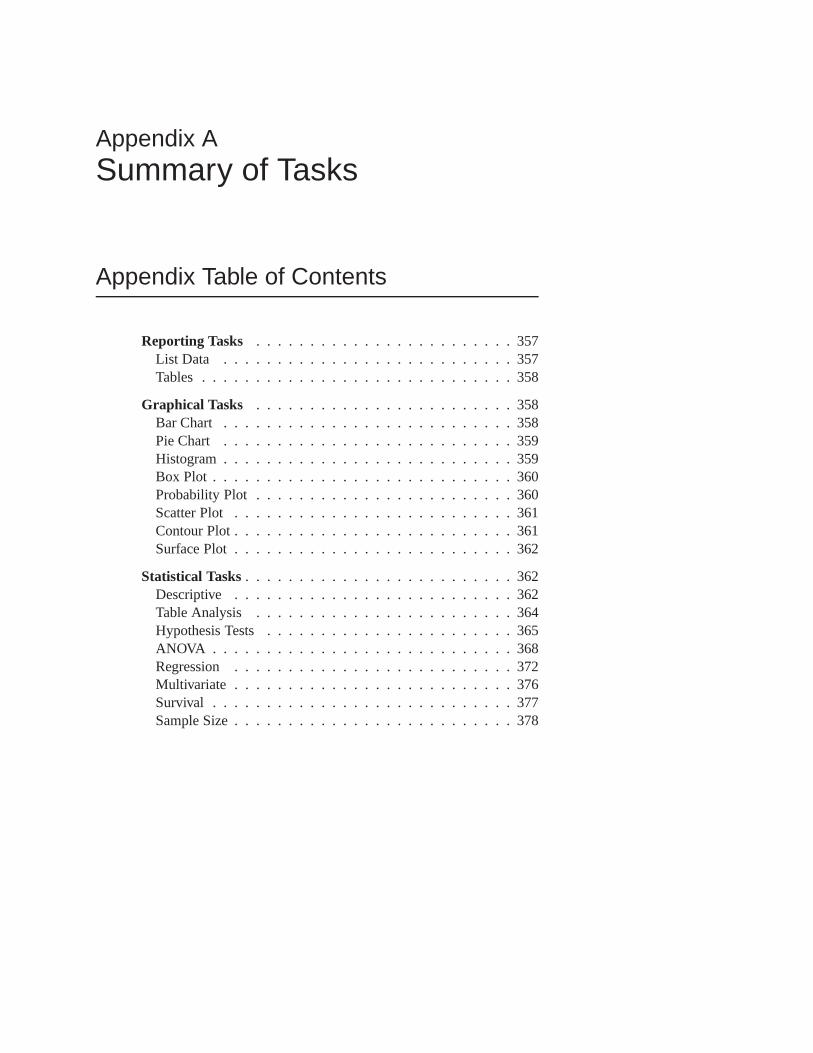
Appendix ASummary of Tasks
Appendix Table of Contents
Reporting Tasks . . . . . . . . . . . . . . . . . . . . . . . . 357List Data . . . . . . . . . . . . . . . . . . . . . . . . . . . 357Tables . . . . . . . . . . . . . . . . . . . . . . . . . . . . . 358
Graphical Tasks . . . . . . . . . . . . . . . . . . . . . . . . 358Bar Chart . . . . . . . . . . . . . . . . . . . . . . . . . . . 358Pie Chart . . . . . . . . . . . . . . . . . . . . . . . . . . . 359Histogram . . . . . . . . . . . . . . . . . . . . . . . . . . . 359Box Plot . . . . . . . . . . . . . . . . . . . . . . . . . . . . 360Probability Plot . . . . . . . . . . . . . . . . . . . . . . . . 360Scatter Plot . . . . . . . . . . . . . . . . . . . . . . . . . . 361Contour Plot . . . . . . . . . . . . . . . . . . . . . . . . . . 361Surface Plot . . . . . . . . . . . . . . . . . . . . . . . . . . 362
Statistical Tasks. . . . . . . . . . . . . . . . . . . . . . . . . 362Descriptive . . . . . . . . . . . . . . . . . . . . . . . . . . 362Table Analysis . . . . . . . . . . . . . . . . . . . . . . . . 364Hypothesis Tests. . . . . . . . . . . . . . . . . . . . . . . 365ANOVA . . . . . . . . . . . . . . . . . . . . . . . . . . . . 368Regression . .. . . . . . . . . . . . . . . . . . . . . . . . 372Multivariate . . . . . . . . . . . . . . . . . . . . . . . . . . 376Survival . . . . . . . . . . . . . . . . . . . . . . . . . . . . 377Sample Size . . . . . . . . . . . . . . . . . . . . . . . . . . 378

356 � Appendix A. Summary of Tasks
SAS OnlineDoc: Version 8
Appendix ASummary of Tasks
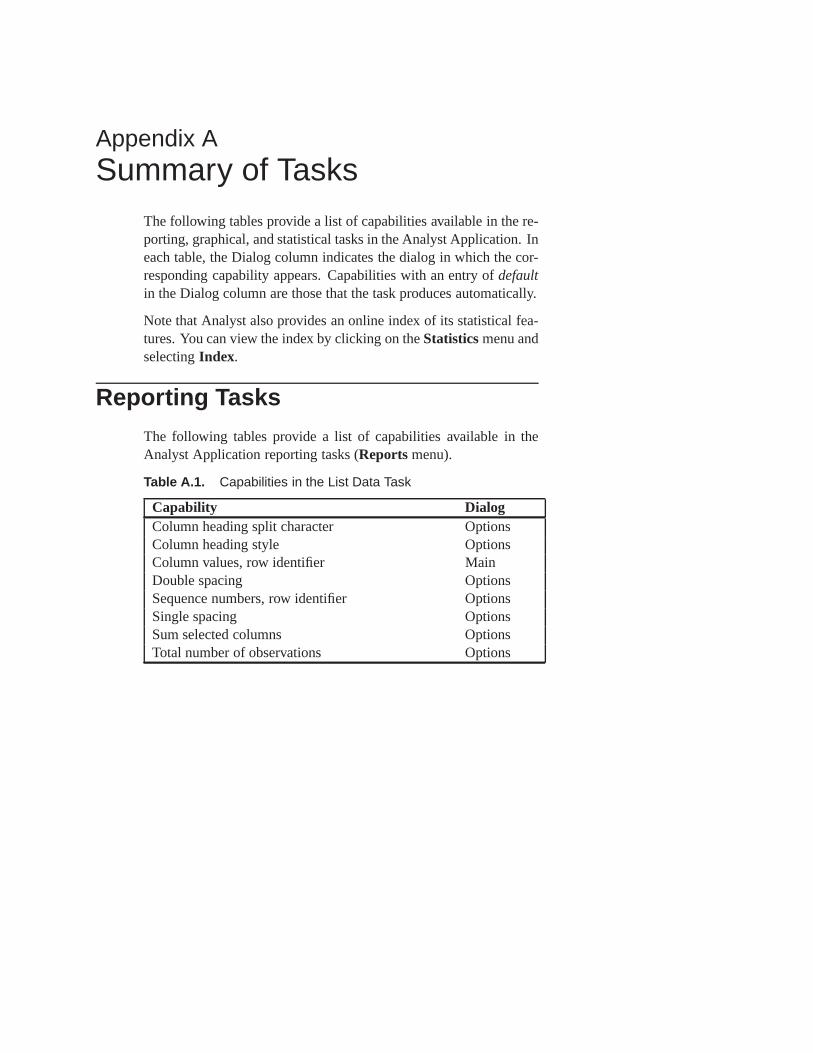
The following tables provide a list of capabilities available in the re-porting, graphical, and statistical tasks in the Analyst Application. Ineach table, the Dialog column indicates the dialog in which the cor-responding capability appears. Capabilities with an entry ofdefaultin the Dialog column are those that the task produces automatically.
Note that Analyst also provides an online index of its statistical fea-tures. You can view the index by clicking on theStatisticsmenu andselectingIndex.
Reporting Tasks
The following tables provide a list of capabilities available in theAnalyst Application reporting tasks (Reports menu).
Table A.1. Capabilities in the List Data Task
Capability DialogColumn heading split character OptionsColumn heading style OptionsColumn values, row identifier MainDouble spacing OptionsSequence numbers, row identifier OptionsSingle spacing OptionsSum selected columns OptionsTotal number of observations Options
358 � Appendix A. Summary of Tasks
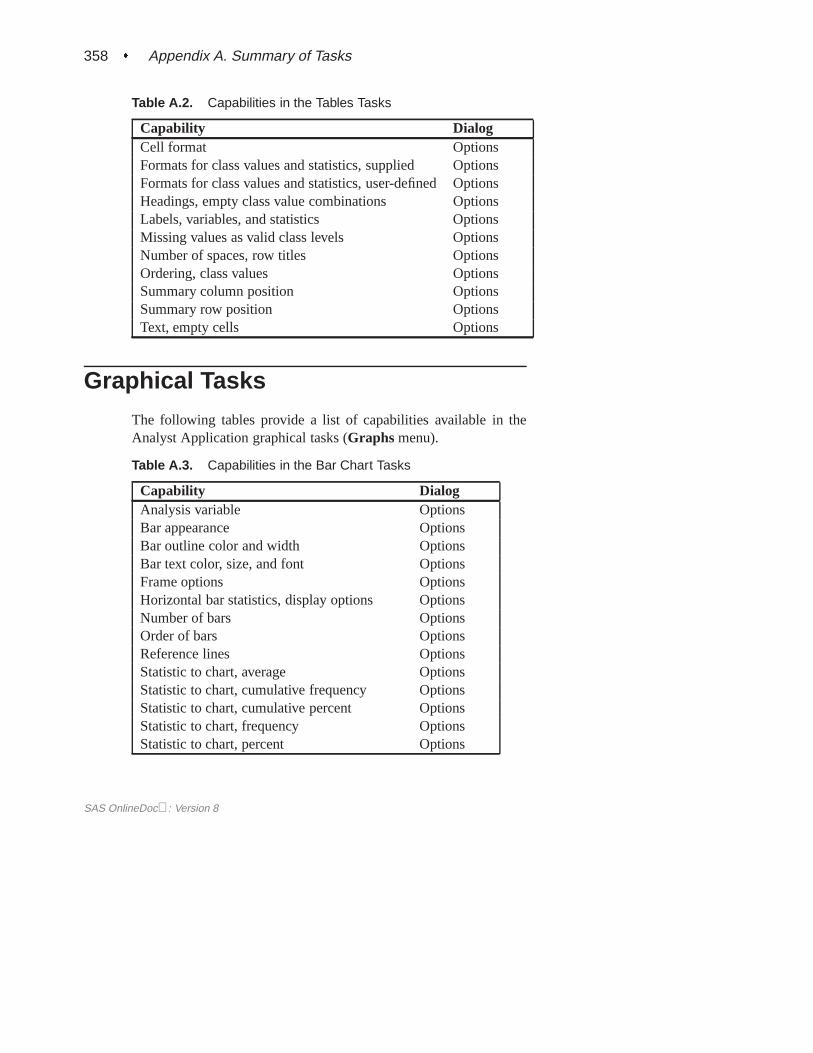
Table A.2. Capabilities in the Tables Tasks
Capability DialogCell format OptionsFormats for class values and statistics, supplied OptionsFormats for class values and statistics, user-defined OptionsHeadings, empty class value combinations OptionsLabels, variables, and statistics OptionsMissing values as valid class levels OptionsNumber of spaces, row titles OptionsOrdering, class values OptionsSummary column position OptionsSummary row position OptionsText, empty cells Options
Graphical Tasks
The following tables provide a list of capabilities available in theAnalyst Application graphical tasks (Graphs menu).
Table A.3. Capabilities in the Bar Chart Tasks
Capability DialogAnalysis variable OptionsBar appearance OptionsBar outline color and width OptionsBar text color, size, and font OptionsFrame options OptionsHorizontal bar statistics, display options OptionsNumber of bars OptionsOrder of bars OptionsReference lines OptionsStatistic to chart, average OptionsStatistic to chart, cumulative frequency OptionsStatistic to chart, cumulative percent OptionsStatistic to chart, frequency OptionsStatistic to chart, percent Options
SAS OnlineDoc: Version 8
� 359
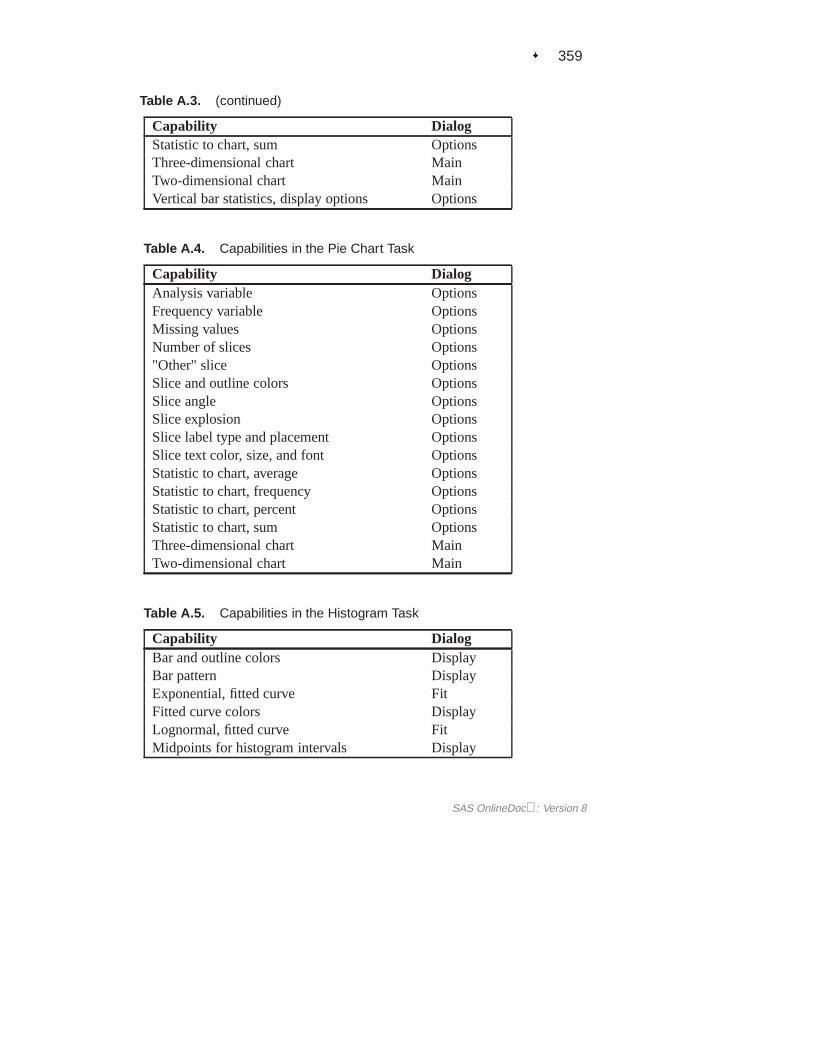
Table A.3. (continued)
Capability DialogStatistic to chart, sum OptionsThree-dimensional chart MainTwo-dimensional chart MainVertical bar statistics, display options Options
Table A.4. Capabilities in the Pie Chart Task
Capability DialogAnalysis variable OptionsFrequency variable OptionsMissing values OptionsNumber of slices Options"Other" slice OptionsSlice and outline colors OptionsSlice angle OptionsSlice explosion OptionsSlice label type and placement OptionsSlice text color, size, and font OptionsStatistic to chart, average OptionsStatistic to chart, frequency OptionsStatistic to chart, percent OptionsStatistic to chart, sum OptionsThree-dimensional chart MainTwo-dimensional chart Main
Table A.5. Capabilities in the Histogram Task
Capability DialogBar and outline colors DisplayBar pattern DisplayExponential, fitted curve FitFitted curve colors DisplayLognormal, fitted curve FitMidpoints for histogram intervals Display
SAS OnlineDoc: Version 8
360 � Appendix A. Summary of Tasks
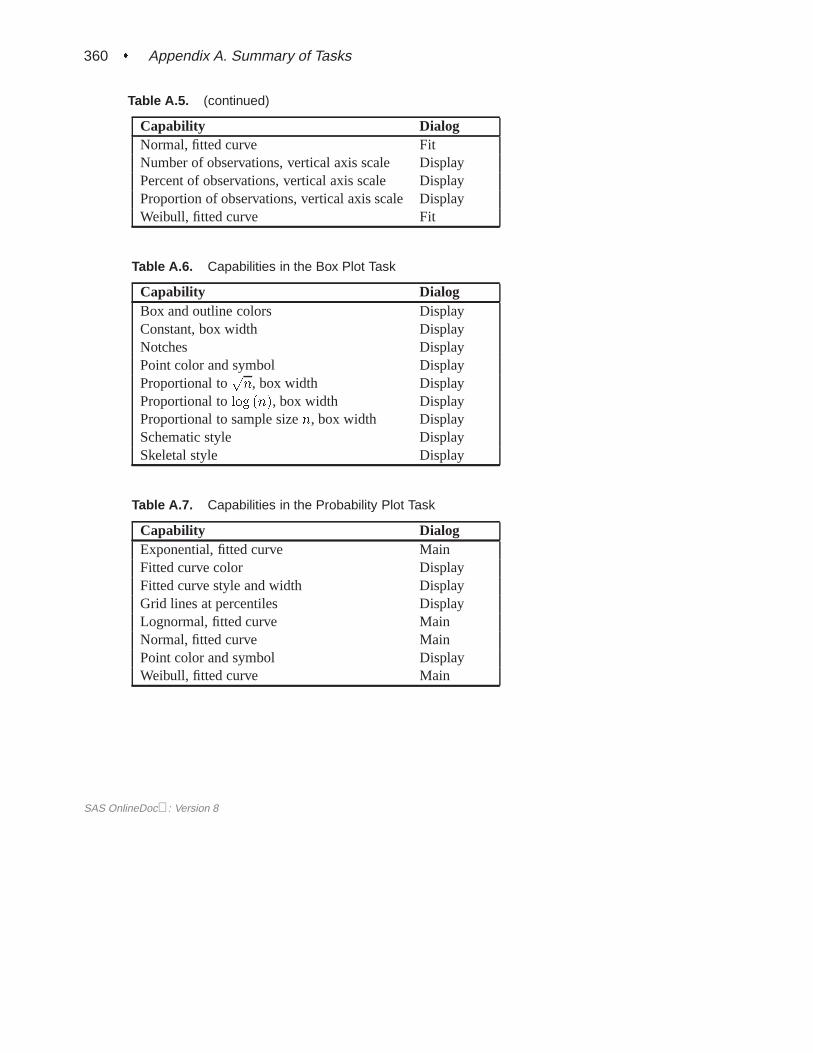
Table A.5. (continued)
Capability DialogNormal, fitted curve FitNumber of observations, vertical axis scale DisplayPercent of observations, vertical axis scale DisplayProportion of observations, vertical axis scale DisplayWeibull, fitted curve Fit
Table A.6. Capabilities in the Box Plot Task
Capability DialogBox and outline colors DisplayConstant, box width DisplayNotches DisplayPoint color and symbol DisplayProportional to
pn, box width Display
Proportional tolog (n), box width DisplayProportional to sample sizen, box width DisplaySchematic style DisplaySkeletal style Display
Table A.7. Capabilities in the Probability Plot Task
Capability DialogExponential, fitted curve MainFitted curve color DisplayFitted curve style and width DisplayGrid lines at percentiles DisplayLognormal, fitted curve MainNormal, fitted curve MainPoint color and symbol DisplayWeibull, fitted curve Main
SAS OnlineDoc: Version 8
� 361
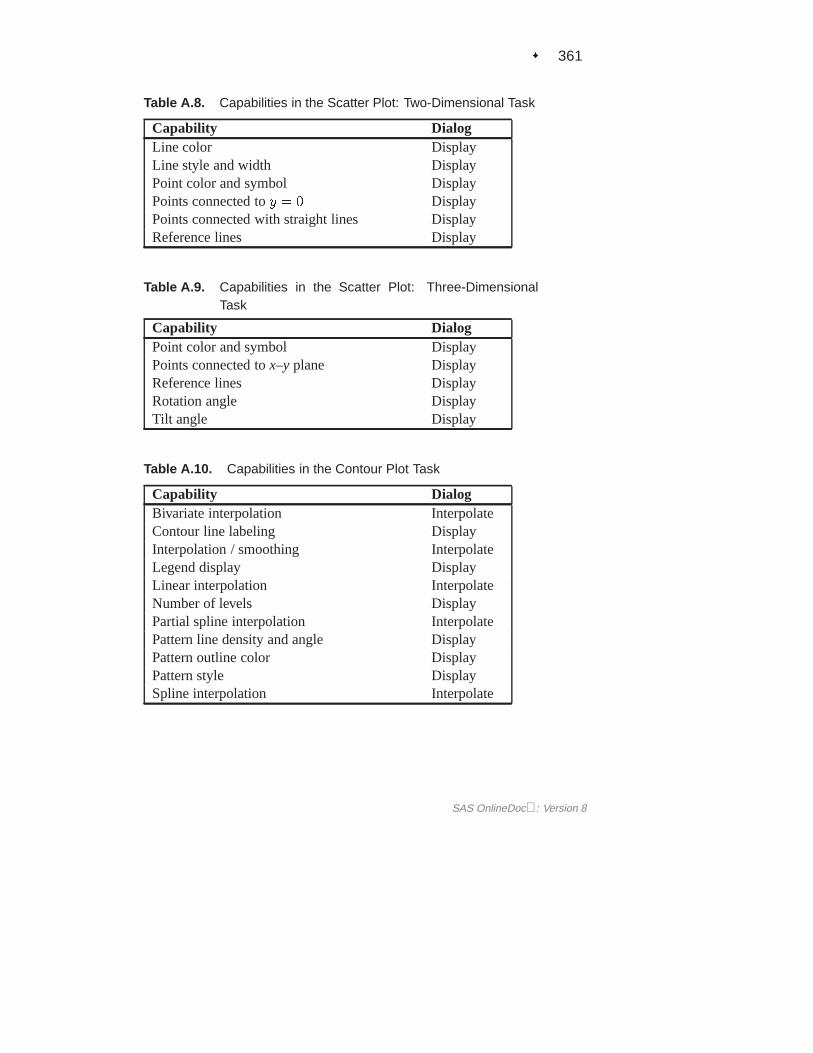
Table A.8. Capabilities in the Scatter Plot: Two-Dimensional Task
Capability DialogLine color DisplayLine style and width DisplayPoint color and symbol DisplayPoints connected toy = 0 DisplayPoints connected with straight lines DisplayReference lines Display
Table A.9. Capabilities in the Scatter Plot: Three-DimensionalTask
Capability DialogPoint color and symbol DisplayPoints connected tox–y plane DisplayReference lines DisplayRotation angle DisplayTilt angle Display
Table A.10. Capabilities in the Contour Plot Task
Capability DialogBivariate interpolation InterpolateContour line labeling DisplayInterpolation / smoothing InterpolateLegend display DisplayLinear interpolation InterpolateNumber of levels DisplayPartial spline interpolation InterpolatePattern line density and angle DisplayPattern outline color DisplayPattern style DisplaySpline interpolation Interpolate
SAS OnlineDoc: Version 8
362 � Appendix A. Summary of Tasks
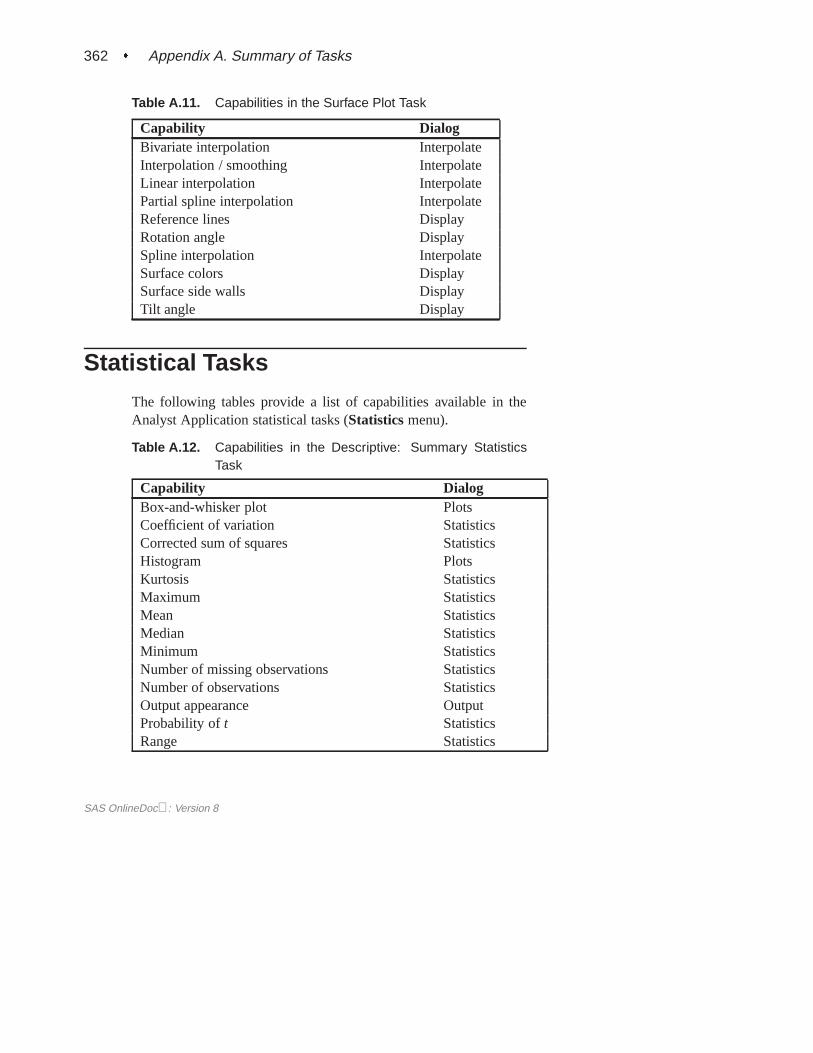
Table A.11. Capabilities in the Surface Plot Task
Capability DialogBivariate interpolation InterpolateInterpolation / smoothing InterpolateLinear interpolation InterpolatePartial spline interpolation InterpolateReference lines DisplayRotation angle DisplaySpline interpolation InterpolateSurface colors DisplaySurface side walls DisplayTilt angle Display
Statistical Tasks
The following tables provide a list of capabilities available in theAnalyst Application statistical tasks (Statisticsmenu).
Table A.12. Capabilities in the Descriptive: Summary StatisticsTask
Capability DialogBox-and-whisker plot PlotsCoefficient of variation StatisticsCorrected sum of squares StatisticsHistogram PlotsKurtosis StatisticsMaximum StatisticsMean StatisticsMedian StatisticsMinimum StatisticsNumber of missing observations StatisticsNumber of observations StatisticsOutput appearance OutputProbability oft StatisticsRange Statistics
SAS OnlineDoc: Version 8
� 363
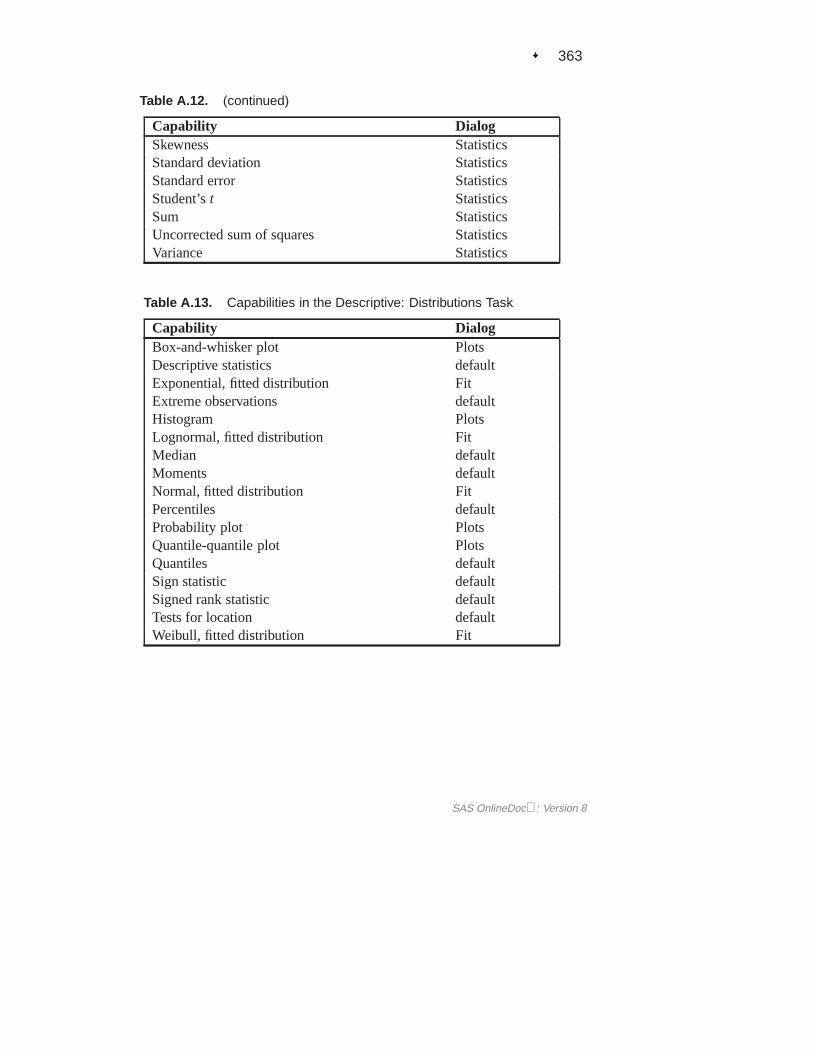
Table A.12. (continued)
Capability DialogSkewness StatisticsStandard deviation StatisticsStandard error StatisticsStudent’st StatisticsSum StatisticsUncorrected sum of squares StatisticsVariance Statistics
Table A.13. Capabilities in the Descriptive: Distributions Task
Capability DialogBox-and-whisker plot PlotsDescriptive statistics defaultExponential, fitted distribution FitExtreme observations defaultHistogram PlotsLognormal, fitted distribution FitMedian defaultMoments defaultNormal, fitted distribution FitPercentiles defaultProbability plot PlotsQuantile-quantile plot PlotsQuantiles defaultSign statistic defaultSigned rank statistic defaultTests for location defaultWeibull, fitted distribution Fit
SAS OnlineDoc: Version 8
364 � Appendix A. Summary of Tasks
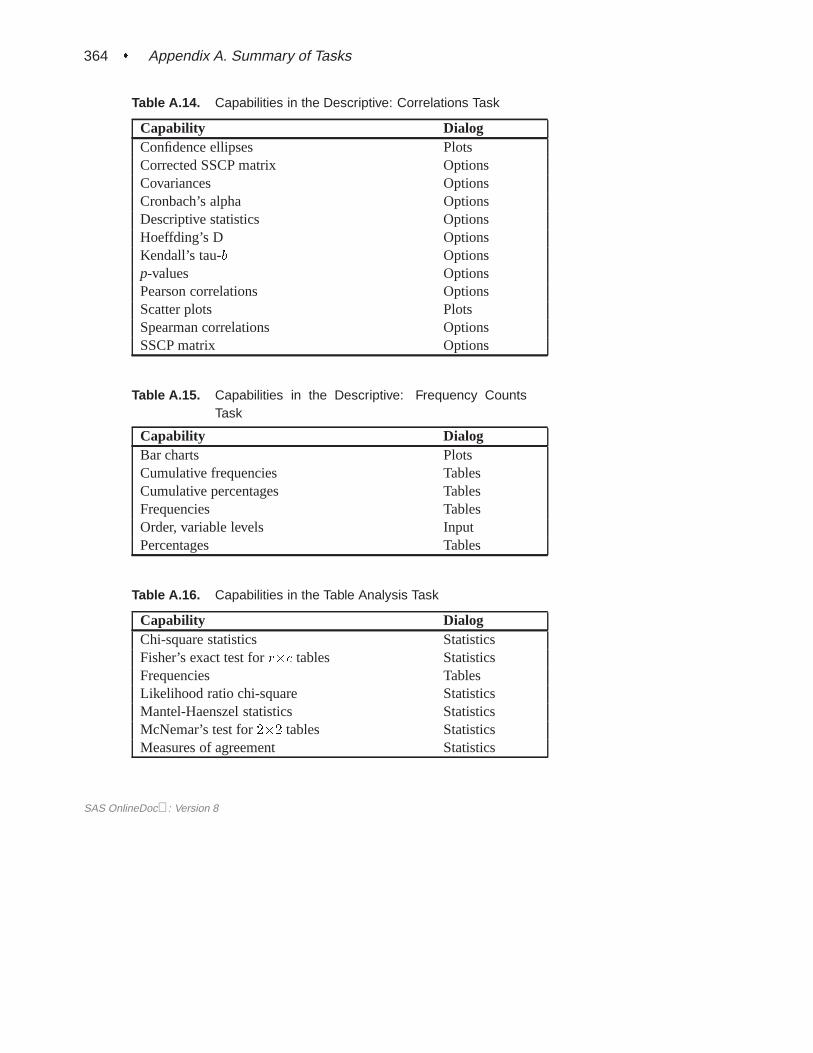
Table A.14. Capabilities in the Descriptive: Correlations Task
Capability DialogConfidence ellipses PlotsCorrected SSCP matrix OptionsCovariances OptionsCronbach’s alpha OptionsDescriptive statistics OptionsHoeffding’s D OptionsKendall’s tau-b Optionsp-values OptionsPearson correlations OptionsScatter plots PlotsSpearman correlations OptionsSSCP matrix Options
Table A.15. Capabilities in the Descriptive: Frequency CountsTask
Capability DialogBar charts PlotsCumulative frequencies TablesCumulative percentages TablesFrequencies TablesOrder, variable levels InputPercentages Tables
Table A.16. Capabilities in the Table Analysis Task
Capability DialogChi-square statistics StatisticsFisher’s exact test forr�c tables StatisticsFrequencies TablesLikelihood ratio chi-square StatisticsMantel-Haenszel statistics StatisticsMcNemar’s test for2�2 tables StatisticsMeasures of agreement Statistics
SAS OnlineDoc: Version 8
� 365
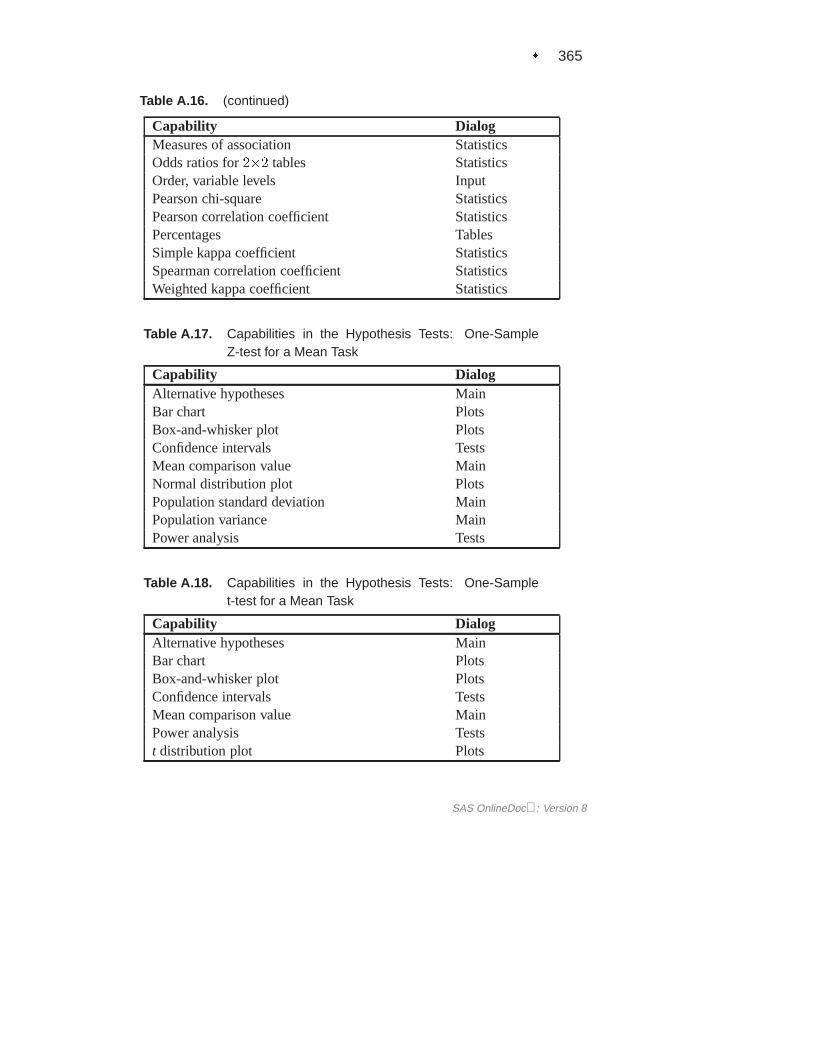
Table A.16. (continued)
Capability DialogMeasures of association StatisticsOdds ratios for2�2 tables StatisticsOrder, variable levels InputPearson chi-square StatisticsPearson correlation coefficient StatisticsPercentages TablesSimple kappa coefficient StatisticsSpearman correlation coefficient StatisticsWeighted kappa coefficient Statistics
Table A.17. Capabilities in the Hypothesis Tests: One-SampleZ-test for a Mean Task
Capability DialogAlternative hypotheses MainBar chart PlotsBox-and-whisker plot PlotsConfidence intervals TestsMean comparison value MainNormal distribution plot PlotsPopulation standard deviation MainPopulation variance MainPower analysis Tests
Table A.18. Capabilities in the Hypothesis Tests: One-Samplet-test for a Mean Task
Capability DialogAlternative hypotheses MainBar chart PlotsBox-and-whisker plot PlotsConfidence intervals TestsMean comparison value MainPower analysis Testst distribution plot Plots
SAS OnlineDoc: Version 8
366 � Appendix A. Summary of Tasks
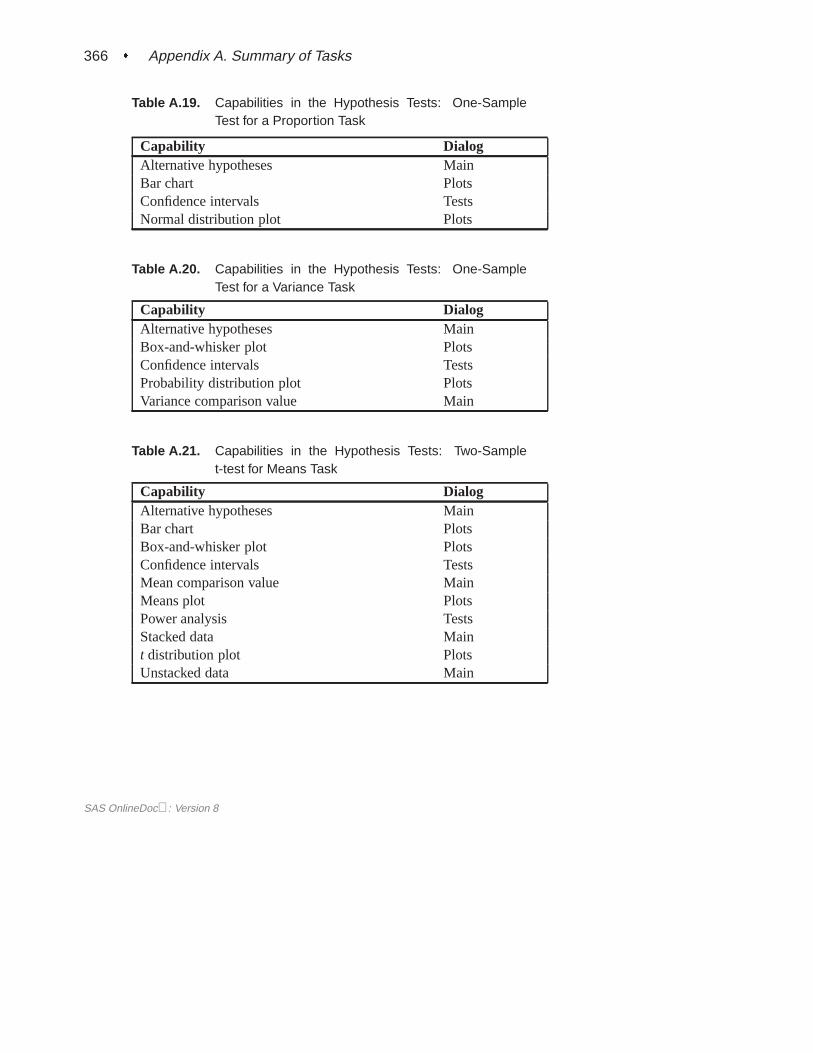
Table A.19. Capabilities in the Hypothesis Tests: One-SampleTest for a Proportion Task
Capability DialogAlternative hypotheses MainBar chart PlotsConfidence intervals TestsNormal distribution plot Plots
Table A.20. Capabilities in the Hypothesis Tests: One-SampleTest for a Variance Task
Capability DialogAlternative hypotheses MainBox-and-whisker plot PlotsConfidence intervals TestsProbability distribution plot PlotsVariance comparison value Main
Table A.21. Capabilities in the Hypothesis Tests: Two-Samplet-test for Means Task
Capability DialogAlternative hypotheses MainBar chart PlotsBox-and-whisker plot PlotsConfidence intervals TestsMean comparison value MainMeans plot PlotsPower analysis TestsStacked data Maint distribution plot PlotsUnstacked data Main
SAS OnlineDoc: Version 8
� 367
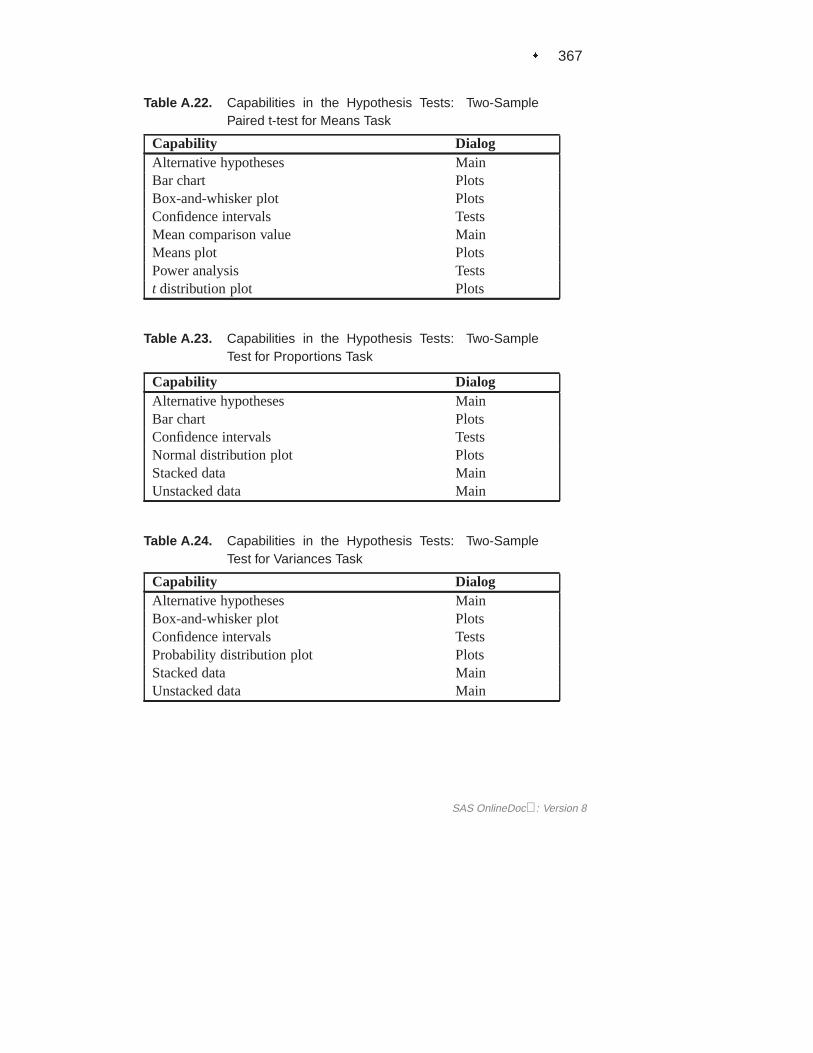
Table A.22. Capabilities in the Hypothesis Tests: Two-SamplePaired t-test for Means Task
Capability DialogAlternative hypotheses MainBar chart PlotsBox-and-whisker plot PlotsConfidence intervals TestsMean comparison value MainMeans plot PlotsPower analysis Testst distribution plot Plots
Table A.23. Capabilities in the Hypothesis Tests: Two-SampleTest for Proportions Task
Capability DialogAlternative hypotheses MainBar chart PlotsConfidence intervals TestsNormal distribution plot PlotsStacked data MainUnstacked data Main
Table A.24. Capabilities in the Hypothesis Tests: Two-SampleTest for Variances Task
Capability DialogAlternative hypotheses MainBox-and-whisker plot PlotsConfidence intervals TestsProbability distribution plot PlotsStacked data MainUnstacked data Main
SAS OnlineDoc: Version 8
368 � Appendix A. Summary of Tasks
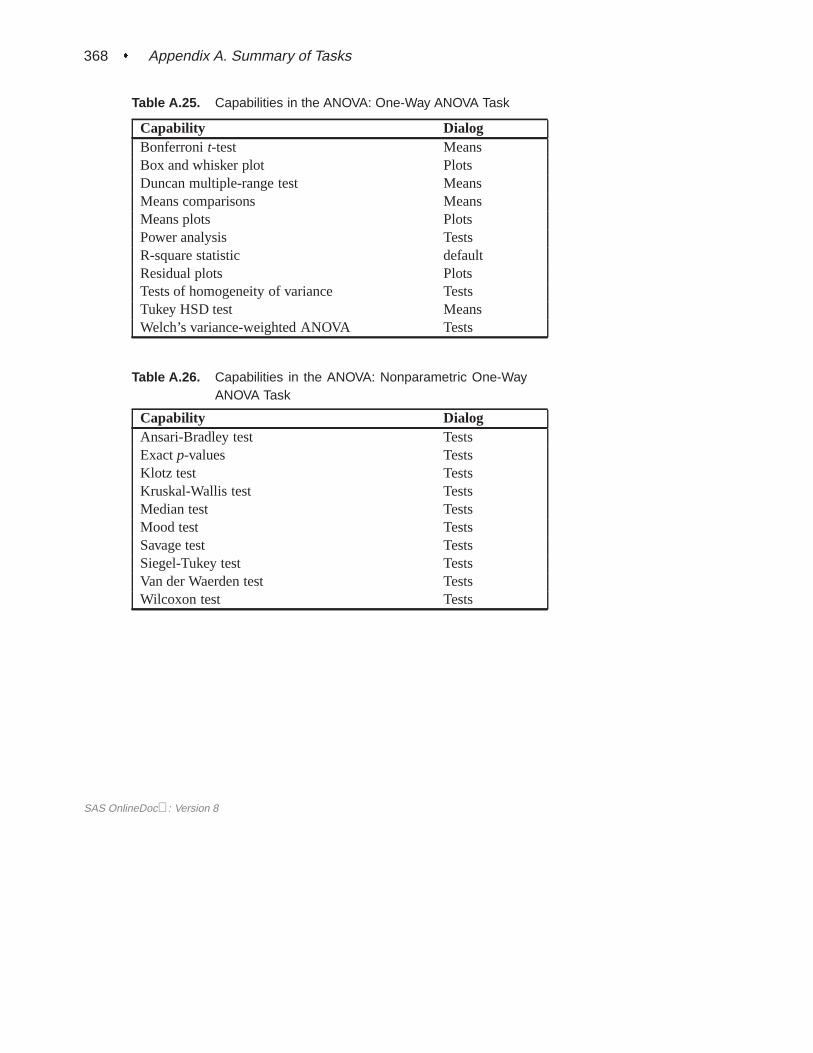
Table A.25. Capabilities in the ANOVA: One-Way ANOVA Task
Capability DialogBonferronit-test MeansBox and whisker plot PlotsDuncan multiple-range test MeansMeans comparisons MeansMeans plots PlotsPower analysis TestsR-square statistic defaultResidual plots PlotsTests of homogeneity of variance TestsTukey HSD test MeansWelch’s variance-weighted ANOVA Tests
Table A.26. Capabilities in the ANOVA: Nonparametric One-WayANOVA Task
Capability DialogAnsari-Bradley test TestsExactp-values TestsKlotz test TestsKruskal-Wallis test TestsMedian test TestsMood test TestsSavage test TestsSiegel-Tukey test TestsVan der Waerden test TestsWilcoxon test Tests
SAS OnlineDoc: Version 8
� 369
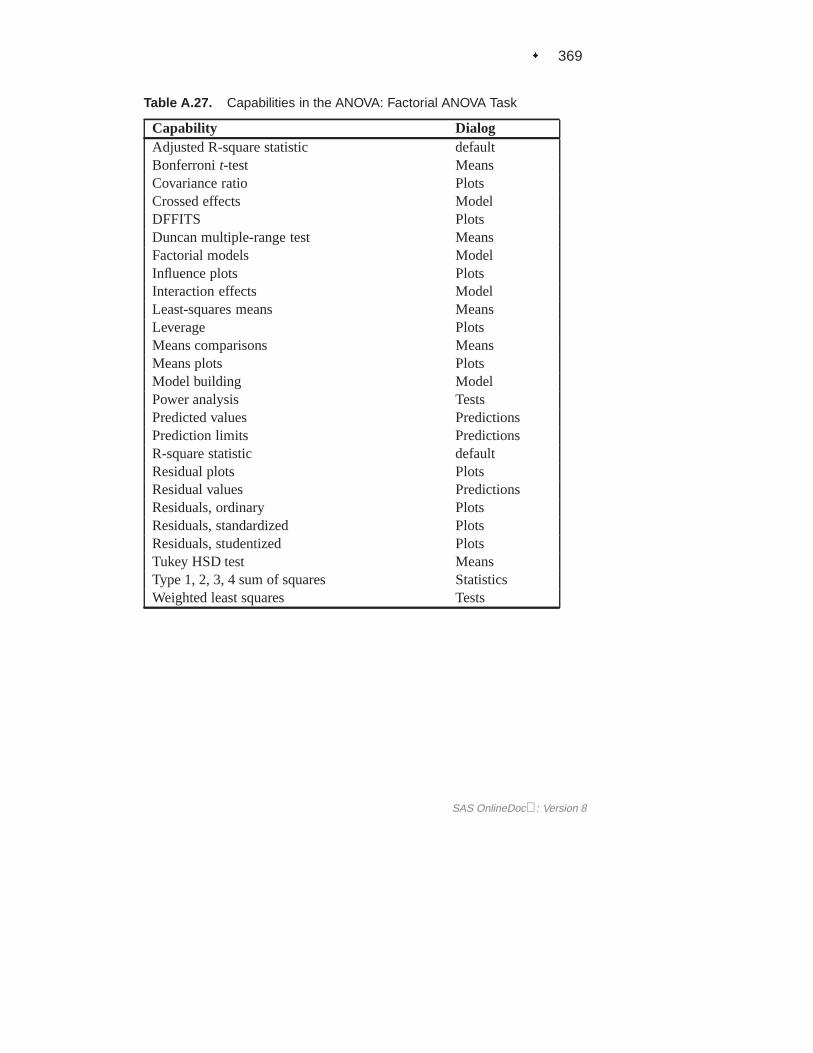
Table A.27. Capabilities in the ANOVA: Factorial ANOVA Task
Capability DialogAdjusted R-square statistic defaultBonferronit-test MeansCovariance ratio PlotsCrossed effects ModelDFFITS PlotsDuncan multiple-range test MeansFactorial models ModelInfluence plots PlotsInteraction effects ModelLeast-squares means MeansLeverage PlotsMeans comparisons MeansMeans plots PlotsModel building ModelPower analysis TestsPredicted values PredictionsPrediction limits PredictionsR-square statistic defaultResidual plots PlotsResidual values PredictionsResiduals, ordinary PlotsResiduals, standardized PlotsResiduals, studentized PlotsTukey HSD test MeansType 1, 2, 3, 4 sum of squares StatisticsWeighted least squares Tests
SAS OnlineDoc: Version 8
370 � Appendix A. Summary of Tasks
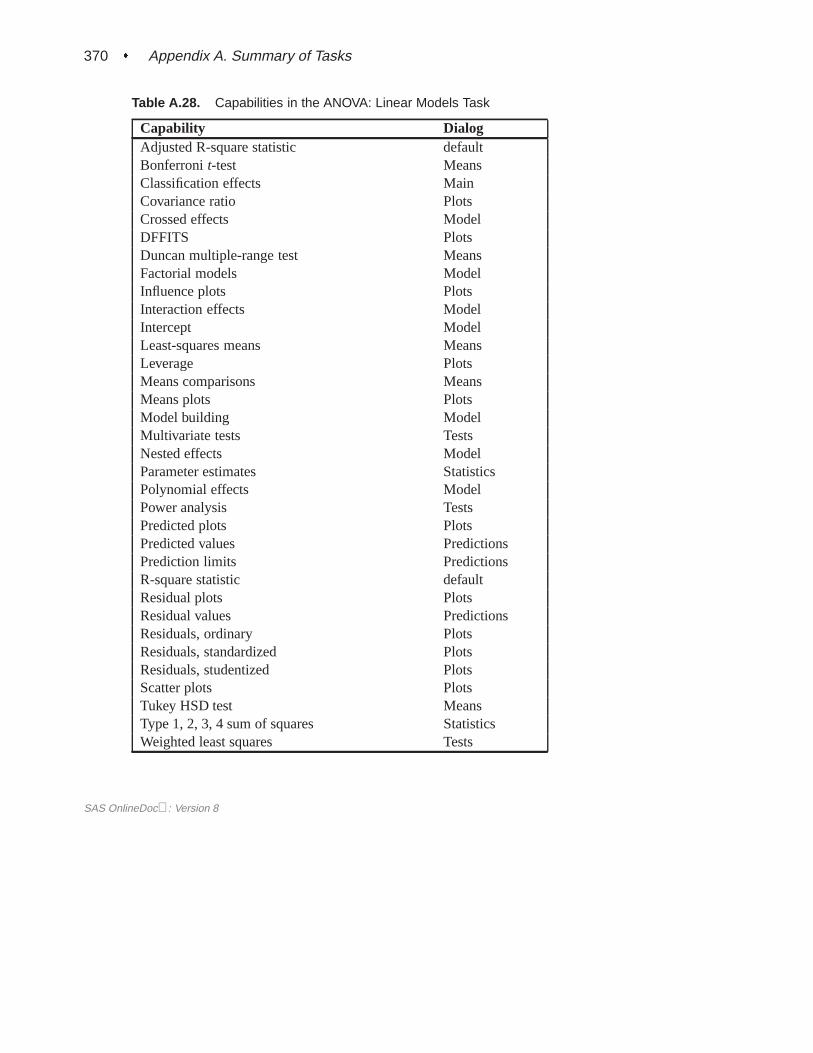
Table A.28. Capabilities in the ANOVA: Linear Models Task
Capability DialogAdjusted R-square statistic defaultBonferronit-test MeansClassification effects MainCovariance ratio PlotsCrossed effects ModelDFFITS PlotsDuncan multiple-range test MeansFactorial models ModelInfluence plots PlotsInteraction effects ModelIntercept ModelLeast-squares means MeansLeverage PlotsMeans comparisons MeansMeans plots PlotsModel building ModelMultivariate tests TestsNested effects ModelParameter estimates StatisticsPolynomial effects ModelPower analysis TestsPredicted plots PlotsPredicted values PredictionsPrediction limits PredictionsR-square statistic defaultResidual plots PlotsResidual values PredictionsResiduals, ordinary PlotsResiduals, standardized PlotsResiduals, studentized PlotsScatter plots PlotsTukey HSD test MeansType 1, 2, 3, 4 sum of squares StatisticsWeighted least squares Tests
SAS OnlineDoc: Version 8
� 371
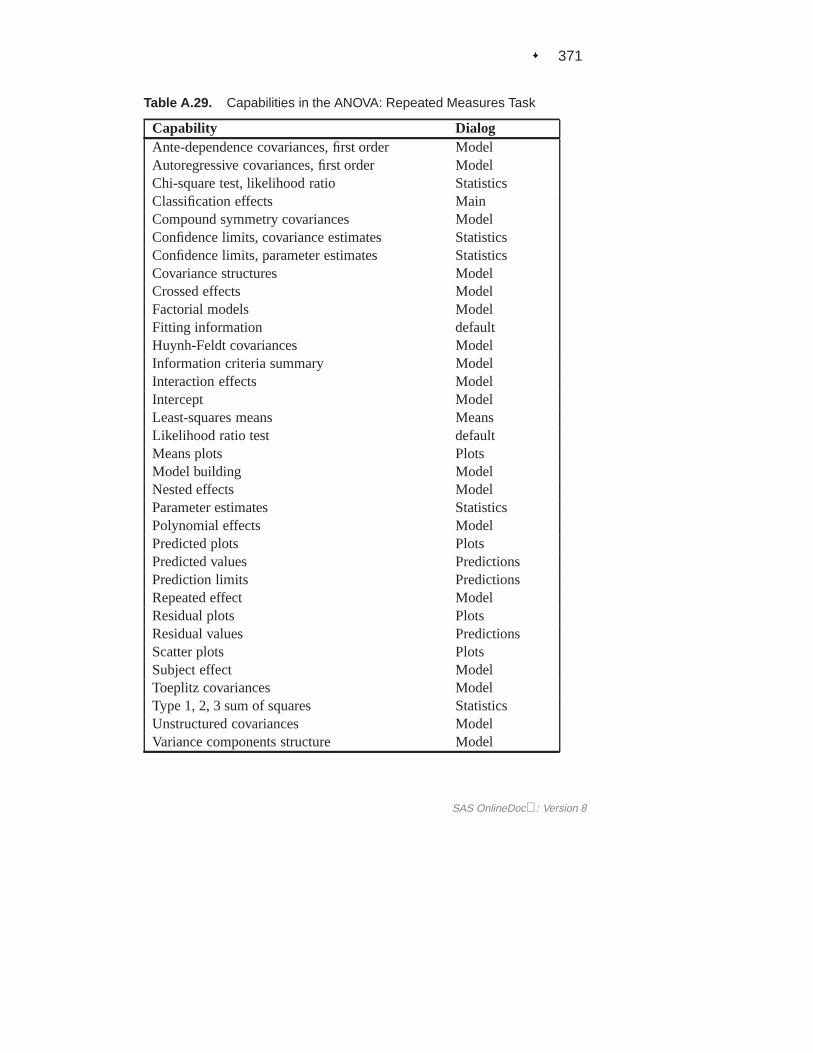
Table A.29. Capabilities in the ANOVA: Repeated Measures Task
Capability DialogAnte-dependence covariances, first order ModelAutoregressive covariances, first order ModelChi-square test, likelihood ratio StatisticsClassification effects MainCompound symmetry covariances ModelConfidence limits, covariance estimates StatisticsConfidence limits, parameter estimates StatisticsCovariance structures ModelCrossed effects ModelFactorial models ModelFitting information defaultHuynh-Feldt covariances ModelInformation criteria summary ModelInteraction effects ModelIntercept ModelLeast-squares means MeansLikelihood ratio test defaultMeans plots PlotsModel building ModelNested effects ModelParameter estimates StatisticsPolynomial effects ModelPredicted plots PlotsPredicted values PredictionsPrediction limits PredictionsRepeated effect ModelResidual plots PlotsResidual values PredictionsScatter plots PlotsSubject effect ModelToeplitz covariances ModelType 1, 2, 3 sum of squares StatisticsUnstructured covariances ModelVariance components structure Model
SAS OnlineDoc: Version 8
372 � Appendix A. Summary of Tasks
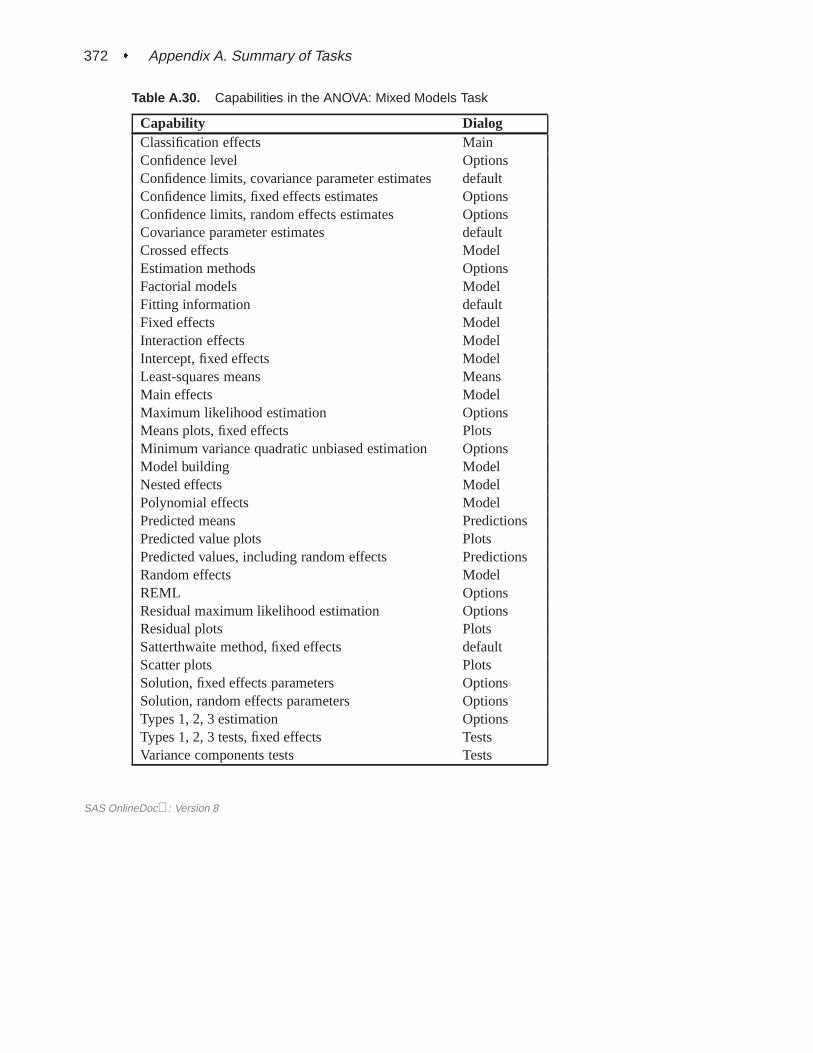
Table A.30. Capabilities in the ANOVA: Mixed Models Task
Capability DialogClassification effects MainConfidence level OptionsConfidence limits, covariance parameter estimates defaultConfidence limits, fixed effects estimates OptionsConfidence limits, random effects estimates OptionsCovariance parameter estimates defaultCrossed effects ModelEstimation methods OptionsFactorial models ModelFitting information defaultFixed effects ModelInteraction effects ModelIntercept, fixed effects ModelLeast-squares means MeansMain effects ModelMaximum likelihood estimation OptionsMeans plots, fixed effects PlotsMinimum variance quadratic unbiased estimation OptionsModel building ModelNested effects ModelPolynomial effects ModelPredicted means PredictionsPredicted value plots PlotsPredicted values, including random effects PredictionsRandom effects ModelREML OptionsResidual maximum likelihood estimation OptionsResidual plots PlotsSatterthwaite method, fixed effects defaultScatter plots PlotsSolution, fixed effects parameters OptionsSolution, random effects parameters OptionsTypes 1, 2, 3 estimation OptionsTypes 1, 2, 3 tests, fixed effects TestsVariance components tests Tests
SAS OnlineDoc: Version 8
� 373
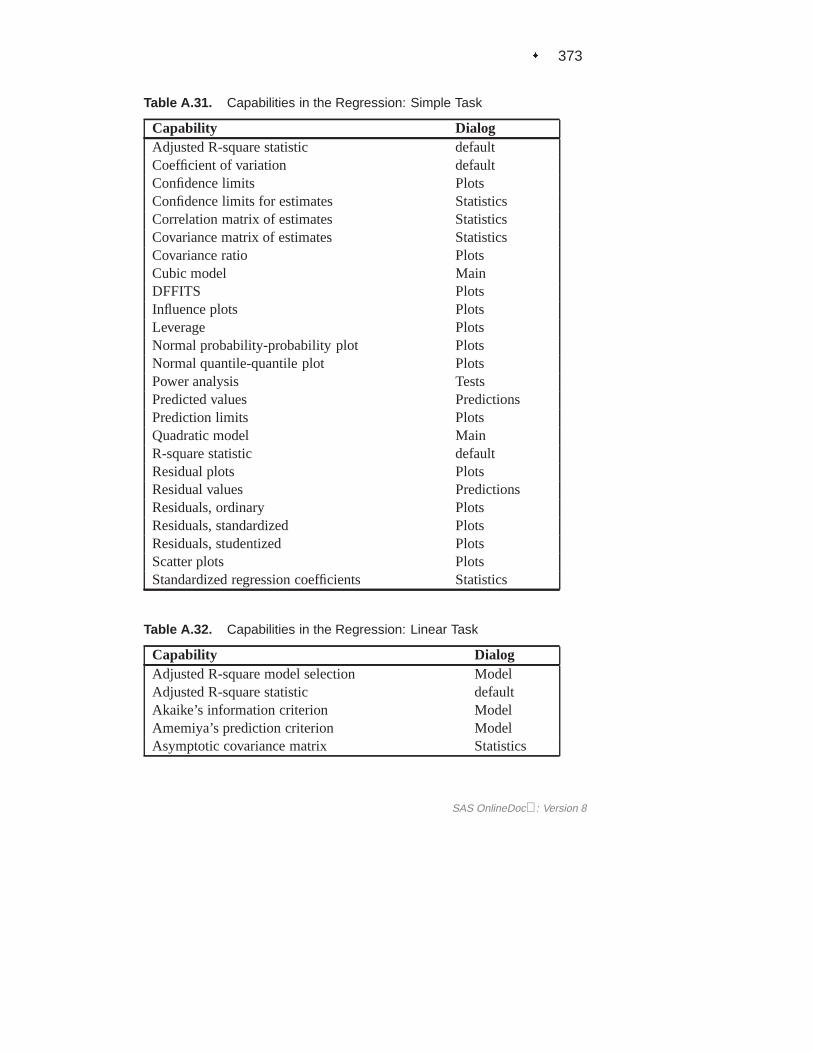
Table A.31. Capabilities in the Regression: Simple Task
Capability DialogAdjusted R-square statistic defaultCoefficient of variation defaultConfidence limits PlotsConfidence limits for estimates StatisticsCorrelation matrix of estimates StatisticsCovariance matrix of estimates StatisticsCovariance ratio PlotsCubic model MainDFFITS PlotsInfluence plots PlotsLeverage PlotsNormal probability-probability plot PlotsNormal quantile-quantile plot PlotsPower analysis TestsPredicted values PredictionsPrediction limits PlotsQuadratic model MainR-square statistic defaultResidual plots PlotsResidual values PredictionsResiduals, ordinary PlotsResiduals, standardized PlotsResiduals, studentized PlotsScatter plots PlotsStandardized regression coefficients Statistics
Table A.32. Capabilities in the Regression: Linear Task
Capability DialogAdjusted R-square model selection ModelAdjusted R-square statistic defaultAkaike’s information criterion ModelAmemiya’s prediction criterion ModelAsymptotic covariance matrix Statistics
SAS OnlineDoc: Version 8
374 � Appendix A. Summary of Tasks
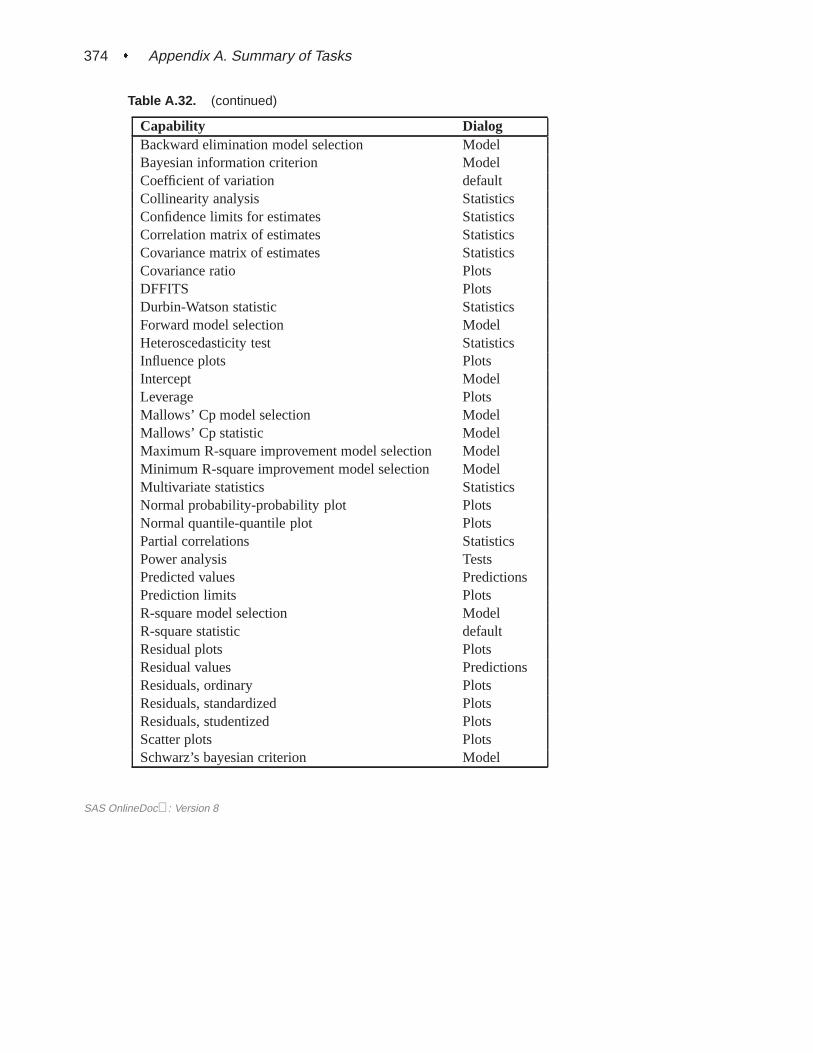
Table A.32. (continued)
Capability DialogBackward elimination model selection ModelBayesian information criterion ModelCoefficient of variation defaultCollinearity analysis StatisticsConfidence limits for estimates StatisticsCorrelation matrix of estimates StatisticsCovariance matrix of estimates StatisticsCovariance ratio PlotsDFFITS PlotsDurbin-Watson statistic StatisticsForward model selection ModelHeteroscedasticity test StatisticsInfluence plots PlotsIntercept ModelLeverage PlotsMallows’ Cp model selection ModelMallows’ Cp statistic ModelMaximum R-square improvement model selection ModelMinimum R-square improvement model selection ModelMultivariate statistics StatisticsNormal probability-probability plot PlotsNormal quantile-quantile plot PlotsPartial correlations StatisticsPower analysis TestsPredicted values PredictionsPrediction limits PlotsR-square model selection ModelR-square statistic defaultResidual plots PlotsResidual values PredictionsResiduals, ordinary PlotsResiduals, standardized PlotsResiduals, studentized PlotsScatter plots PlotsSchwarz’s bayesian criterion Model
SAS OnlineDoc: Version 8
� 375
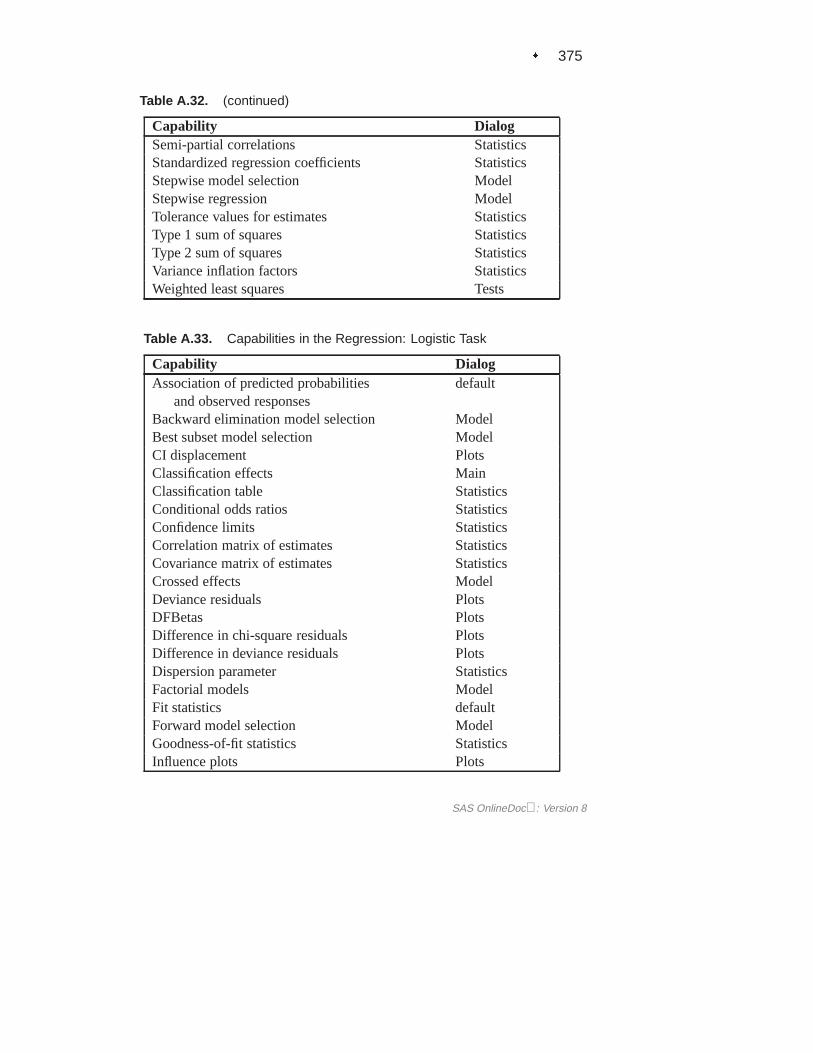
Table A.32. (continued)
Capability DialogSemi-partial correlations StatisticsStandardized regression coefficients StatisticsStepwise model selection ModelStepwise regression ModelTolerance values for estimates StatisticsType 1 sum of squares StatisticsType 2 sum of squares StatisticsVariance inflation factors StatisticsWeighted least squares Tests
Table A.33. Capabilities in the Regression: Logistic Task
Capability DialogAssociation of predicted probabilities
and observed responsesdefault
Backward elimination model selection ModelBest subset model selection ModelCI displacement PlotsClassification effects MainClassification table StatisticsConditional odds ratios StatisticsConfidence limits StatisticsCorrelation matrix of estimates StatisticsCovariance matrix of estimates StatisticsCrossed effects ModelDeviance residuals PlotsDFBetas PlotsDifference in chi-square residuals PlotsDifference in deviance residuals PlotsDispersion parameter StatisticsFactorial models ModelFit statistics defaultForward model selection ModelGoodness-of-fit statistics StatisticsInfluence plots Plots
SAS OnlineDoc: Version 8
376 � Appendix A. Summary of Tasks
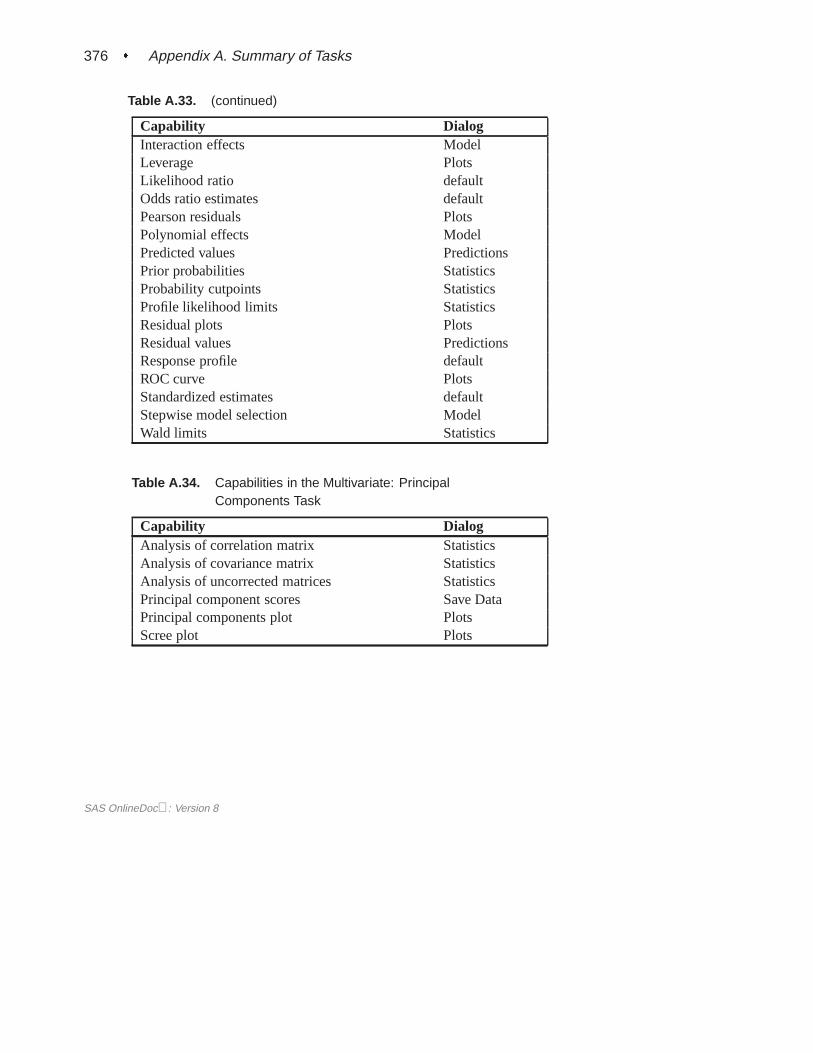
Table A.33. (continued)
Capability DialogInteraction effects ModelLeverage PlotsLikelihood ratio defaultOdds ratio estimates defaultPearson residuals PlotsPolynomial effects ModelPredicted values PredictionsPrior probabilities StatisticsProbability cutpoints StatisticsProfile likelihood limits StatisticsResidual plots PlotsResidual values PredictionsResponse profile defaultROC curve PlotsStandardized estimates defaultStepwise model selection ModelWald limits Statistics
Table A.34. Capabilities in the Multivariate: PrincipalComponents Task
Capability DialogAnalysis of correlation matrix StatisticsAnalysis of covariance matrix StatisticsAnalysis of uncorrected matrices StatisticsPrincipal component scores Save DataPrincipal components plot PlotsScree plot Plots
SAS OnlineDoc: Version 8
� 377
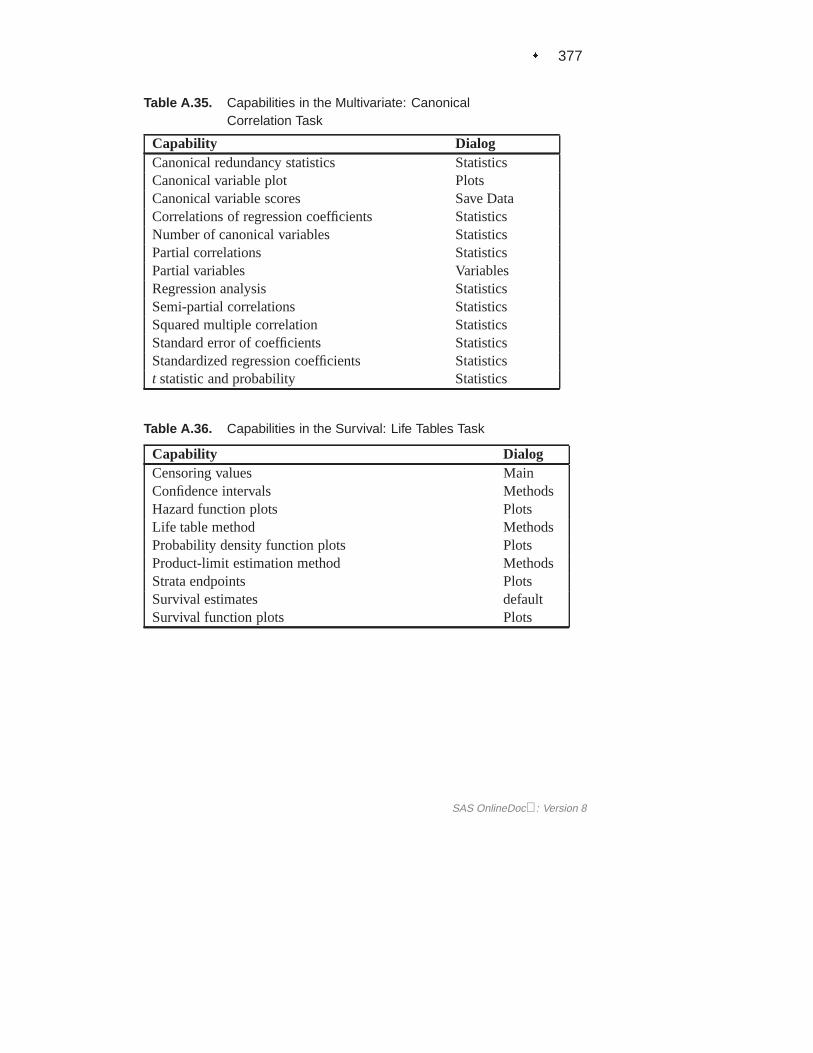
Table A.35. Capabilities in the Multivariate: CanonicalCorrelation Task
Capability DialogCanonical redundancy statistics StatisticsCanonical variable plot PlotsCanonical variable scores Save DataCorrelations of regression coefficients StatisticsNumber of canonical variables StatisticsPartial correlations StatisticsPartial variables VariablesRegression analysis StatisticsSemi-partial correlations StatisticsSquared multiple correlation StatisticsStandard error of coefficients StatisticsStandardized regression coefficients Statisticst statistic and probability Statistics
Table A.36. Capabilities in the Survival: Life Tables Task
Capability DialogCensoring values MainConfidence intervals MethodsHazard function plots PlotsLife table method MethodsProbability density function plots PlotsProduct-limit estimation method MethodsStrata endpoints PlotsSurvival estimates defaultSurvival function plots Plots
SAS OnlineDoc: Version 8
378 � Appendix 1. Summary of Tasks
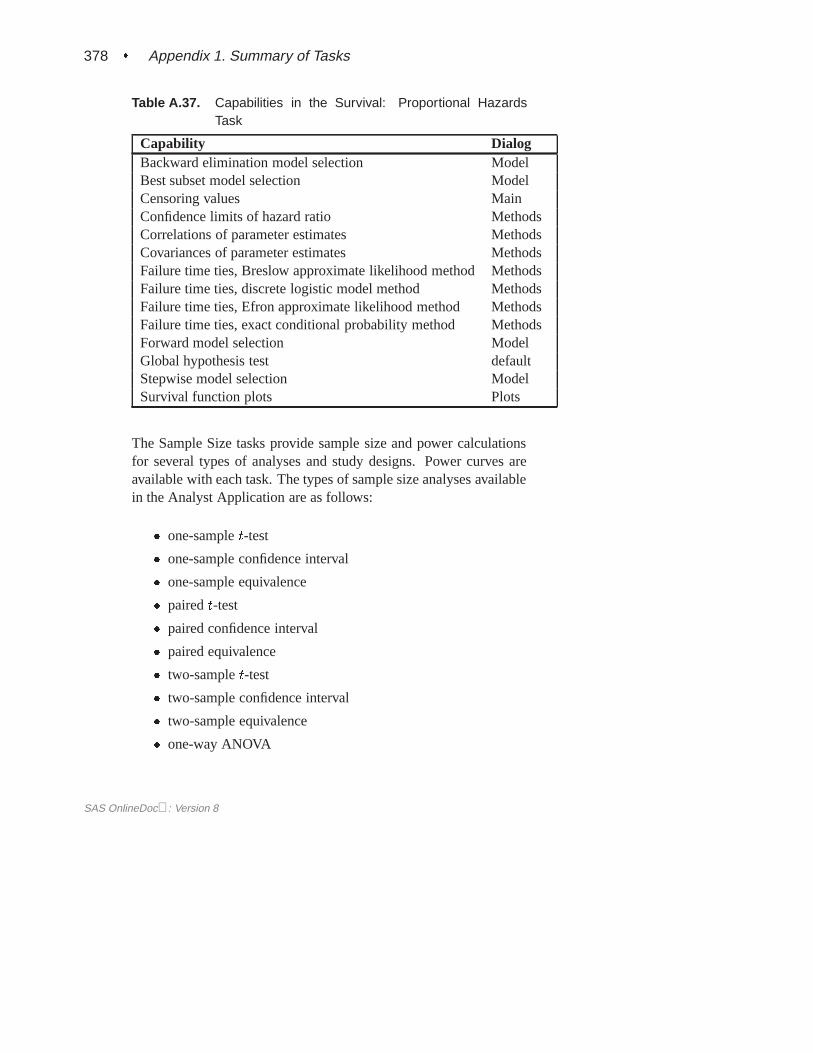
Table A.37. Capabilities in the Survival: Proportional HazardsTask
Capability DialogBackward elimination model selection ModelBest subset model selection ModelCensoring values MainConfidence limits of hazard ratio MethodsCorrelations of parameter estimates MethodsCovariances of parameter estimates MethodsFailure time ties, Breslow approximate likelihood method MethodsFailure time ties, discrete logistic model method MethodsFailure time ties, Efron approximate likelihood method MethodsFailure time ties, exact conditional probability method MethodsForward model selection ModelGlobal hypothesis test defaultStepwise model selection ModelSurvival function plots Plots
The Sample Size tasks provide sample size and power calculationsfor several types of analyses and study designs. Power curves areavailable with each task. The types of sample size analyses availablein the Analyst Application are as follows:
� one-samplet-test
� one-sample confidence interval
� one-sample equivalence
� pairedt-test
� paired confidence interval
� paired equivalence
� two-samplet-test
� two-sample confidence interval
� two-sample equivalence
� one-way ANOVA
SAS OnlineDoc: Version 8

The correct bibliographic citation for this manual is as follows: SAS Institute Inc.,The Analyst Application, First Edition, Cary, NC: SAS Institute Inc., 1999. 476 pp.
The Analyst Application, First EditionCopyright © 1999 SAS Institute Inc., Cary, NC, USA.ISBN 1–58025–446–2All rights reserved. Printed in the United States of America. No part of this publicationmay be reproduced, stored in a retrieval system, or transmitted, by any form or by anymeans, electronic, mechanical, photocopying, or otherwise, without the prior writtenpermission of the publisher, SAS Institute, Inc.U.S. Government Restricted Rights Notice. Use, duplication, or disclosure of thesoftware by the government is subject to restrictions as set forth in FAR 52.227–19Commercial Computer Software-Restricted Rights (June 1987).SAS Institute Inc., SAS Campus Drive, Cary, North Carolina 27513.1st printing, October 1999SAS® and all other SAS Institute Inc. product or service names are registered trademarksor trademarks of SAS Institute Inc. in the USA and other countries.® indicates USAregistration.IBM®, ACF/VTAM®, AIX®, APPN®, MVS/ESA®, OS/2®, OS/390®, VM/ESA®, and VTAM®
are registered trademarks or trademarks of International Business Machines Corporation.® indicates USA registration.Other brand and product names are registered trademarks or trademarks of theirrespective companies.The Institute is a private company devoted to the support and further development of itssoftware and related services.