summary of the 2017 spring flood river regulation planning board summary of the 2017 spring flood...
TRANSCRIPT

Ottawa River Regulation Planning Board www.ottawariver.ca
Summary of the 2017 Spring Flood Page | 1
Ottawa River Commission de planification Regulation de la régularisation Planning Board de la rivière des Outaouais
Summary of the 2017 Spring Flood
The main cause of the exceptional 2017 spring flooding can be described easily in just a few words: rain, rain
and even more rain. Unusually heavy rainfall, coinciding with melting snow that had already saturated the
ground and swollen waterways, generated exceptional volumes of water in the Ottawa River basin. All this
water generated record volumes and major peak water levels in the Ottawa River and its tributaries,
exceeding those set in 1974 and 1976, causing major flooding in the southern section of the basin, from
Chats Lake down to the Montreal region.
In the first sections of this document, you will find relevant information regarding the 2017 spring flood,
including the factors that contributed to the high volumes of the flooding as well as a description of the runoff
volumes in the southern part of the Ottawa River basin.
In addition, you will find in section 5 of the document a summary describing the main actions taken by the
Ottawa River Regulating Committee (the Regulating Committee) as part of managing the 13 principal
reservoirs to reduce the exceptional peak flows in May and minimize damage in the floodplain. For example,
without the coordinated effort of the principal reservoirs in attenuating the river’s flow, the water levels at Lac
des Deux Montagnes during the peak levels in May would have been approximately 90 cm higher.
Lastly, you will also find information on the various press releases issued by the Ottawa River Regulation Planning Board (the Planning Board) in order to make the hydrological forecasts available to the general
public and government agencies.
In 1983 Canada, Ontario and Québec created the Planning Board to ensure the integrated management of the flows from the principal reservoirs of the Ottawa River basin. Under the 1983 Agreement, the governments also established two other entities that report to the Planning Board, namely the Ottawa River Regulating Committee and the Ottawa River Regulation Secretariat, which act respectively as the operational arm and working arm of the Planning Board.
Ottawa River Regulation Planning Board www.ottawariver.ca
Summary of the 2017 Spring Flood Page | 2
1 – Snow on the Ground before the Thaw It is often assumed that the quantity of snow on the ground at the end of winter can by itself predict the
magnitude of flooding. In reality, spring floods largely depend on weather conditions that can only be
predicted a few days in advance, for instance the amount of precipitation, duration and trajectory of rain
events, as well as the temperature. The snow cover and its water equivalent are only risk factors considered
in forecasts.
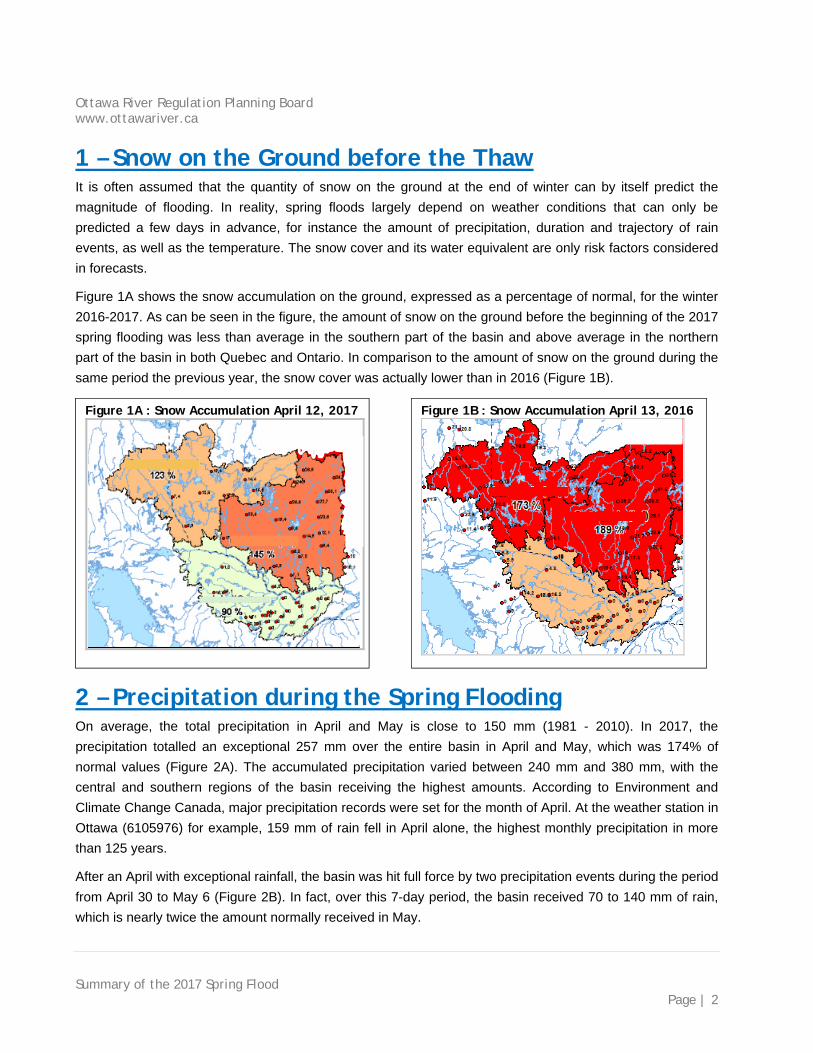
Figure 1A shows the snow accumulation on the ground, expressed as a percentage of normal, for the winter
2016-2017. As can be seen in the figure, the amount of snow on the ground before the beginning of the 2017
spring flooding was less than average in the southern part of the basin and above average in the northern
part of the basin in both Quebec and Ontario. In comparison to the amount of snow on the ground during the
same period the previous year, the snow cover was actually lower than in 2016 (Figure 1B).
2 – Precipitation during the Spring Flooding On average, the total precipitation in April and May is close to 150 mm (1981 - 2010). In 2017, the
precipitation totalled an exceptional 257 mm over the entire basin in April and May, which was 174% of
normal values (Figure 2A). The accumulated precipitation varied between 240 mm and 380 mm, with the
central and southern regions of the basin receiving the highest amounts. According to Environment and
Climate Change Canada, major precipitation records were set for the month of April. At the weather station in
Ottawa (6105976) for example, 159 mm of rain fell in April alone, the highest monthly precipitation in more
than 125 years.
After an April with exceptional rainfall, the basin was hit full force by two precipitation events during the period
from April 30 to May 6 (Figure 2B). In fact, over this 7-day period, the basin received 70 to 140 mm of rain,
which is nearly twice the amount normally received in May.
Figure 1A : Snow Accumulation April 12, 2017 Figure 1B : Snow Accumulation April 13, 2016

Ottawa River Regulation Planning Board www.ottawariver.ca
Summary of the 2017 Spring Flood Page | 3
Figure 2A : Accumulated Precipitation for the Months of April and May 2017
Figure 2B : Accumulated Precipitation for the April 30 to May 6, 2017 Period
Ottawa River Regulation Planning Board www.ottawariver.ca
Summary of the 2017 Spring Flood Page | 4
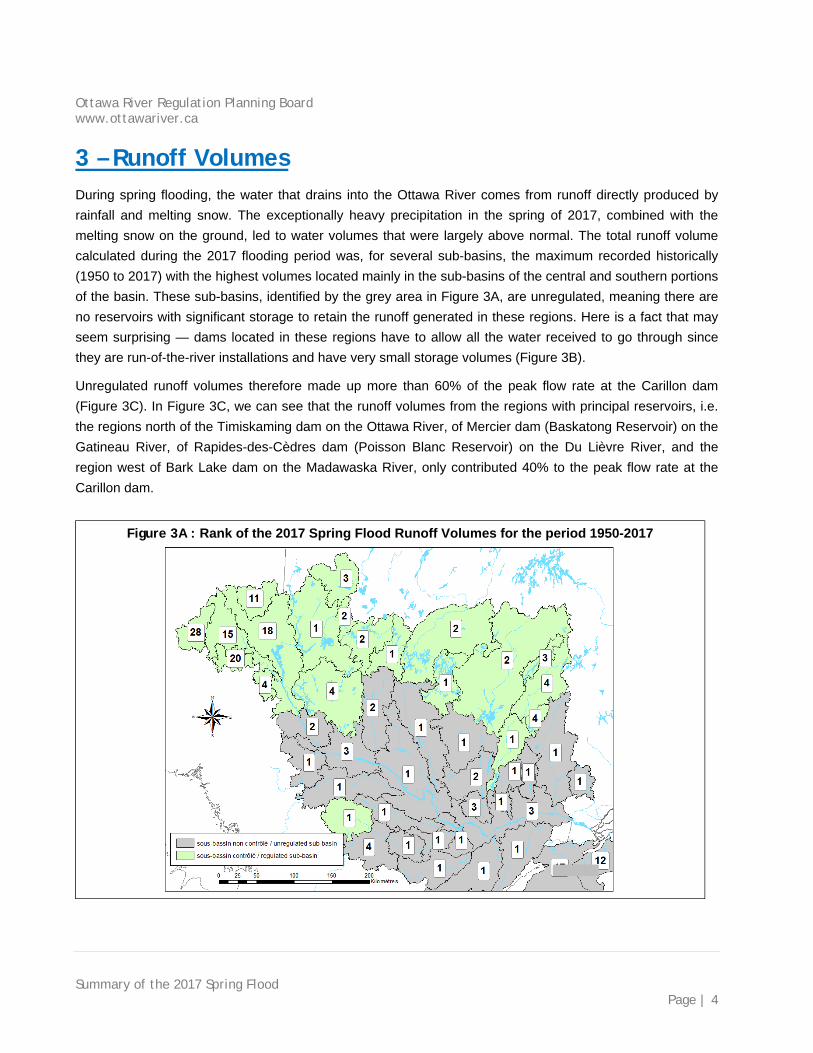
3 – Runoff Volumes During spring flooding, the water that drains into the Ottawa River comes from runoff directly produced by
rainfall and melting snow. The exceptionally heavy precipitation in the spring of 2017, combined with the
melting snow on the ground, led to water volumes that were largely above normal. The total runoff volume
calculated during the 2017 flooding period was, for several sub-basins, the maximum recorded historically
(1950 to 2017) with the highest volumes located mainly in the sub-basins of the central and southern portions
of the basin. These sub-basins, identified by the grey area in Figure 3A, are unregulated, meaning there are
no reservoirs with significant storage to retain the runoff generated in these regions. Here is a fact that may
seem surprising — dams located in these regions have to allow all the water received to go through since
they are run-of-the-river installations and have very small storage volumes (Figure 3B).
Unregulated runoff volumes therefore made up more than 60% of the peak flow rate at the Carillon dam
(Figure 3C). In Figure 3C, we can see that the runoff volumes from the regions with principal reservoirs, i.e.
the regions north of the Timiskaming dam on the Ottawa River, of Mercier dam (Baskatong Reservoir) on the
Gatineau River, of Rapides-des-Cèdres dam (Poisson Blanc Reservoir) on the Du Lièvre River, and the
region west of Bark Lake dam on the Madawaska River, only contributed 40% to the peak flow rate at the
Carillon dam.
Figure 3A : Rank of the 2017 Spring Flood Runoff Volumes for the period 1950-2017

Ottawa River Regulation Planning Board www.ottawariver.ca
Summary of the 2017 Spring Flood Page | 5
Figure 3B : Principal Reservoirs of the Basin and Principal Generating Stations along the Ottawa River

Ottawa River Regulation Planning Board www.ottawariver.ca
Summary of the 2017 Spring Flood Page | 6
intentionally left blank

Ottawa River Regulation Planning Board www.ottawariver.ca
Summary of the 2017 Spring Flood Page | 6
4 – Flood Peaks At Chats Lake, the highest water level was 75.95 m (Figure 4A) on May 6.
At Lake Deschenes in Britannia (Figure 4B), the highest level was 60.44 m, on May 6, 2017, setting a historic
record for a period of over one hundred years (1915-2017).
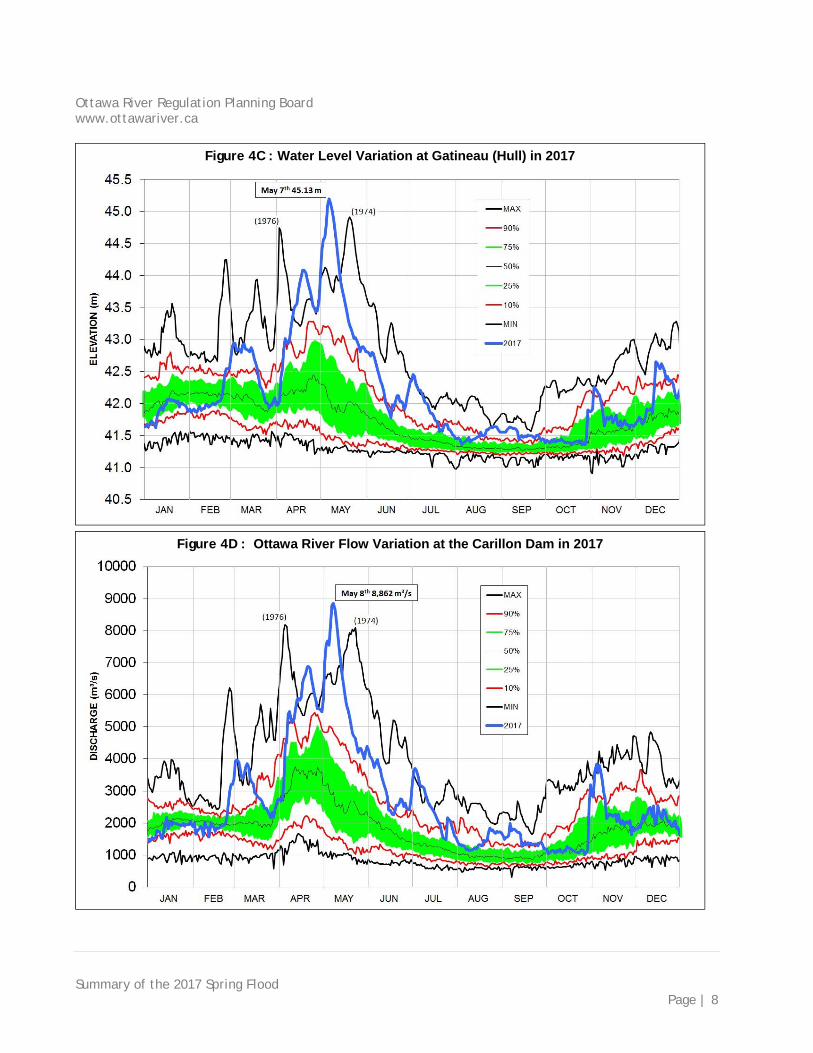
The highest level in Gatineau (Hull) reached 45.13 m on May 7 (Figure 4C), beating the levels observed
during the floods of 1974 (44.91 m) and 1976 (44.74 m).
At the Carillon dam (Figure 4D), the maximum daily flow recorded was 8,862 m³/s, on May 8, 2017, setting a
new record and beating the maximum peak flow rates of 1974 (8,105 m³/s) and 1976 (8,190 m³/s).
Figure 3C : Flow Contributions from Controlled and Uncontrolled Areas compared at Carillon

Ottawa River Regulation Planning Board www.ottawariver.ca
Summary of the 2017 Spring Flood Page | 7
Figure 4A : Water Level Variation at Chats Lake in 2017
Figure 4B : Water Level Variation at Lake Deschenes at Britannia (Ottawa) in 2017
Ottawa River Regulation Planning Board www.ottawariver.ca
Summary of the 2017 Spring Flood Page | 8
Figure 4C : Water Level Variation at Gatineau (Hull) in 2017
Figure 4D : Ottawa River Flow Variation at the Carillon Dam in 2017

Ottawa River Regulation Planning Board www.ottawariver.ca
Summary of the 2017 Spring Flood Page | 9
5 – Reservoir Management Flood reduction measures are undertaken annually in preparation for the spring runoff. Typically this involves
emptying the principal reservoirs during the winter period with reservoirs being at their lowest levels before
the spring snow melt begins. This available storage volume is then used as the spring melt progresses to
reduce downstream flows. Integrated reservoir management maximizes the use of this storage and allows
dam managers to coordinate operations between multiple reservoirs, on a daily basis, in order to minimize
flood damage along the Ottawa River and in the Montreal region.
Reservoirs were emptied by the end of March, as much as local hydraulic conditions permitted, in
accordance with normal or usual practices as illustrated by the green band in Figure 5A. In early May, at the
height of the spring flooding, the storage capacity of the reservoirs was being used much more than usual in
order to reduce peak downstream flows. The reservoirs were used to nearly their full capacity and it was not
until mid-July before the water levels in the various reservoirs returned to nearly normal values.
It should be recalled that it is not possible to hold back the entire runoff volume since runoff during spring
flooding generally exceeds the capacity of the reservoirs to store water. Except for years when there is little
snow and precipitation, most of the principal reservoirs must release part of the runoff draining into them.
Starting in early April, the Regulating Committee, composed of the major dam managers from Quebec,
Ontario and the federal government, held more than 50 conference calls and used hydrological and flow
Figure 5A : Variation of the Amount of Water Stored in the Principal Reservoirs in 2017

Ottawa River Regulation Planning Board www.ottawariver.ca
Summary of the 2017 Spring Flood Page | 10
forecasting models in real time on a nearly daily basis for more than eight weeks to ensure the coordinated
management of the dams. At certain points during the spring flood, dam operators had to make decisions
that are rarely required. For example, in order to prevent upstream flooding Ontario Power Generation was
forced to lower the water level at the Des Joachims reservoir for a second time between April 28 and April 30
due to heavy rainfall being forecast in early May. We have to go back to1979 to observe similar operations.
Another example is the decision by the Planning Board to accept the proposal by Hydro-Québec to divert
some water from the Cabonga reservoir to the Dozois reservoir in early May to delay the arrival of 85 m³/s
into the Gatineau and Ottawa rivers by about two weeks, thereby helping to minimize damages along the
Gatineau and Ottawa rivers at the height of the flooding.
Because it is located at the outlet of the Ottawa River basin, the Carillon dam is the best location to see the
cumulative effect of the13 principal reservoirs on the flows (Figure 5B). From January to early April, the flows
discharged from the various reservoirs were increased to ensure hydroelectric production during this period
when energy demand is high. Conversely, from early April to the end of the spring flooding, the flows
discharged were lower that the quantities received. The reservoir management therefore made it possible to
attenuate the peak flood flows and minimize flooding.
This year, it is estimated that flows during the flooding peak were reduced by approximately 20% at the
Carillon dam. Without this reduction in the river flow, the water levels for Lac des Deux Montagnes could
have been approximately 90 cm higher.
Similarly, reservoir management reduced peaks everywhere in areas situated downstream from the principal
reservoirs. At Chats Lake, for example, the maximum water level during the spring flooding could have been
approximately 40 cm higher (Figure 5C).
Figure 5B : Effect of the 13 Upstream Principal Reservoirs on the Ottawa River Flows at Carillon

Ottawa River Regulation Planning Board www.ottawariver.ca
Summary of the 2017 Spring Flood Page | 11
6 – Hydrological Forecasts The main role of the Planning Board is to ensure the integrated management of principal reservoirs in the
Ottawa River basin. Furthermore, its role is also to ensure that the hydrological forecasts produced for this
management are made available to the general public and government agencies that are involved in issuing
flood warnings and the deployment of emergency measures.
Because the Ottawa River can have a considerable effect on the flows of the St. Lawrence River in the
vicinity of the Montreal archipelago at certain times of the year, the Regulating Committee worked in
conjunction with the Great Lakes ‐ St. Lawrence Regulation Office during the entire 2017 spring flood period.
The Planning Board uses its website (http://ottawariver.ca/) as the main tool for issuing hydrological
forecasts. Every day, from April 4 until June 8, the Planning Board posted three-day hydrological forecasts on
its website for Temiscaming, Pembroke, Britannia and Carillon. The website was utilized extensively with
close to 400,000 pageviews during the spring flood period. An automated toll-free telephone service was also
available and received close to 3,000 calls.
The Planning Board also issued three press releases this year, on April 5, April 18 and April 28. Given the
quick progression of the flooding in early May, for the first time since it was created, the Planning Board
issued a table with the forecast peak levels and the date on which peak levels were expected for nine flood
Figure 5C : Effect of the 7 Upstream Principal Reservoirs on Flows of the Ottawa River at Chats Lake

Ottawa River Regulation Planning Board www.ottawariver.ca
Summary of the 2017 Spring Flood Page | 12
prone areas in the basin. This table was updated twice daily in the week preceding the flood peak of May 6, 7
and 8. The press releases and tables are available for review on the website at the following address:
http://ottawariver.ca/current-press-releases.php.
Added to all this, multiple interviews were granted to the media, responses to close to 300 information
inquiries made directly to the Secretariat were provided, along with participation on multiple conference calls
with the authorities responsible for monitoring the flooding at the provincial and municipal levels.
Finally, to address questions and concerns by the public, the Planning Board has published on its website
the most frequently asked questions (FAQ) and corresponding replies. The FAQ section is regularly updated
to reflect questions of general interest that are received.
For any questions regarding the Planning Board, Please communicate with the Ottawa River Regulation Secretariat :
Ottawa/Gatineau : (613)995-3443 Elsewhere : 1-800-778-1246
Contents of this publication may be reproduced in whole or in part provided the intended use is for non-commercial purposes and full acknowledgement is given to the Ottawa River Regulation Planning Board. For permission, contact [email protected] . Recommended citation format : Ottawa River Regulation Planning Board. (2018). Summary of the 2017 Spring Flood. Ottawa : Ottawa River Regulation Planning Board. www.ottawariver.ca