summary of theoretical considerations prepared by: …
TRANSCRIPT

SUMMARY OF THEORETICAL CONSIDERATIONS
AND WIND TUNNEL TESTS OF AN AERODYNAMIC SPOILER
FOR STALL PROOFING A GENERAL AVIATION AIRPLANE
Prepared by:
Howard L. Chevalier
TEXAS A&M UNIVERSITY
COLLEGE STATION, TEXAS
January, 1981
NASA Research Grant NSG - 1407
NASA Langley Research Center
Final Report
Abstract
An airplane stall proofing system utilizing a spoiler has been
investigated for application on a low wing airplane representative
of typical general aviation airplane. Tests of the full scale air-
plane were conducted in the NASA Langley 30 x 60 foot full scale
wind tunnel. The test velocity was 86 feet per second, corresponding
to a Reynolds number of 2.20 x 10 . This report shows the stall
proofing capability of the spoiler and verifies a theoretical approach
to the design of the spoiler and analysis of the spoiler's contribution
to the airplane's trim and longitudinal stability. Controlled spoiler
deployment in a narrow angle of attack range, 4 degrees, immediately
preceding the stall angle will stall proof the airplane. The results
of this investigation also show some of the limitations of small scale
tests and the need for full scale flight tests to determine spoiler
deployment rate for good handling qualities.
NOMENCLATURE
bhp Brake horsepower
c Chord length, ft
e.g. Center of gravity, % c
C. Elevator hinge moment coefficient
C, Airplane lift coefficient
C. Maximum obtainable lift coefficientLMAX
C, Tail lift coefficientLT
CM Airplane pitching moment coefficient
CM Airplane pitching moment coefficient at zero lift0
CM Airplane pitching moment coefficient due to the tailT
aSlope of the C vs a curve
CM Slope of the CM vs 6 curveM x r M e
6e
h/c The ratio of spoiler height to the tail mean geometricchord
1. Distance from the center of gravity to the aerodynamiccenter of the tail, ft
mT Lift curve slope of the tail, per degree
mw Lift curve slope of the wing, per degree
RN Reynolds number
ii

NOMENCLATURE (continued)
9 Tail volume
a Angle of attack, degree
a. Angle of attack at which spoiler activation beginsa "
a, Angle of attack which produces zero net lift0
a Angle of attack at which the airplane stalls
6 Elevator deflection angle, degree
e Wing downwash angle at the tail, degree
i f Tail efficiency factor
m
Introduction
Airplane stall/spin accidents account for a major portion of the
fatal and nonfatal accidents in general aviation flying each year.
Through the years, many attempts have been made to solve this
problem. Two basic approaches have been taken in an effort to obtain
a solution. One approach has been to design a stall proof wing.
The second effort has been to alter the control system of the air-
plane in some manner to limit the airplane's angle of attack to an
angle below stall. A third approach formed by the authors several
years ago, and recently refined, alters both the stability and control
of the aircraft at high angles of attack to produce a stall proof1 2 3.4aircraft.'"* In this approach, two fundamental requirements must
be met; the airplane must automatically trim at an angle of attack
below the stall angle, and there should be a restoring moment at this
trim condition which cannot be overridden by control inputs from the
pilot. This stabilizing moment should be such that it increases at
high angles of attack and at the maximum trim angle of attack makes
the rate of change of stabilizing moment due to the aerodynamics of
the aircraft greater than that of the rate of change of pitch up
moment produced by control or gust inputs. This report shows that
a simple stability augmentation system, a spoiler mounted on the lower
surface of the horizontal stabilizer, can meet these requirements.
A full scale general aviation aircraft was tested in the NASA
Langley 30 x 60 foot wind tunnel using a spoiler. Configuration
requirements for the full scale tests were based on theoretical
analysis of the spoiler effects, small scale testing in the NASA
Langley 12 foot low speed wind tunnel and tests of a semi-span of
the airplane's horizontal tail in the Texas A&M University's 7 x 10
foot low speed wind tunnel.
This report presents the results obtained from the full scale
tests and show that they provide "proof of concept" for the theory
developed in Reference 3. it will also be shown that, if used
judiciously, the data provided by the wind tunnel tests of the scale
model and horizontal tail alone can provide the basis for preliminary
design of the full scale spoiler system.
Background
The authors have been actively involved in developing a stall
proofing system utilizing a spoiler as the control surface for the
last 10 years. Early flight testing of such systems was essentially1 2by trial and error and met with only limited success. ' This was
because most aerodynamic effects of the spoiler were not known, and
the system could not be studied using theoretical approaches.
Wind tunnel tests of a 1/5 scale model of the full sized air-
craft , and of a full scale semi-span horizontal tail , showed that
the spoiler could provide the necessary stability and control authority
with minimum complications in terms of installation and actuation.
They also provided the necessary data from which to develop a
theoretical approach for analyzing the effects and contributions of
the spoiler to longitudinal stability. This analysis is treated in
detail in References 3 and 4. In the analysis, the effects of the
elevator and spoiler on each other were assumed to be negligible and
as a result the spoiler's contribution to the aircraft's longitudinal
pitching moment became a separate, independent term in the pitching
moment coefficient equation:
9CMVg. = -X6e +
(1)3h/c 3d

In the spoiler contribution term, the last term in Equation (1),
h/c is the ratio of spoiler height to horizontal tail chord and the
effect of spoiler deployment is a shift in the angle of zero lift of
the tail. Selection of a proper program for ,/c would provideuU
the trim and stability required to prevent stall. Figure 1 is an
idealized CM vs. angle of attack curve for a given elevator deflection
such that the aircraft would normally trim (CM=0) above the stall
angle of attack. The dashed line in Figure 1 shows a stall proof
case. Figure 2 depicts the programmed spoiler deployment schedule
for such an aircraft. The spoiler is only deployed in the 4° angle
of attack range just below the stall. At angles of attack below that,
the spoiler remains closed and the last term in Equation (1) is zero.
The third term in Equation (1) is then the only stability contribution.
The equation for the curve in Figure 2 is:
h/c = 2.37 x 10"3 (Act)2'4
where Au = a - a (2)a
The spoiler deployment schedule developed in References 3 and 4,
described by Equation (2), results in the nonlinear pitching moment
curve shown as the dashed line in Figure 1. . The result of this
deployment schedule is that the aircraft trims (reaches equilibrium)
below the stall angle of attack and the slope of the curve becomes
increasingly negative as stall is approached, producing an increasingly
stable aircraft.

•3 '
• 2 -
1 -
-.1 -
a
Figure 1, Theoretical Variation of Pitching MomentCoefficient with Angle of Attack

,08
,06
h/c ,04
,02
0
Figure 2, Variation of Spoiler Height withAngle of Attack
Selection of both the angle of attack range for the active
spoiler and the exponent in Equation (2) must remain somewhat
arbitrary until flight tests are conducted to evaluate the air-
plane's handling characteristics. Equation (2) is based on such
considerations as a smooth transition from basic to spoiler aug-
mented stability and the desired slope, CM , at trim.ex

8
Model Description
The dimensions of the airplane used in this test are shown in
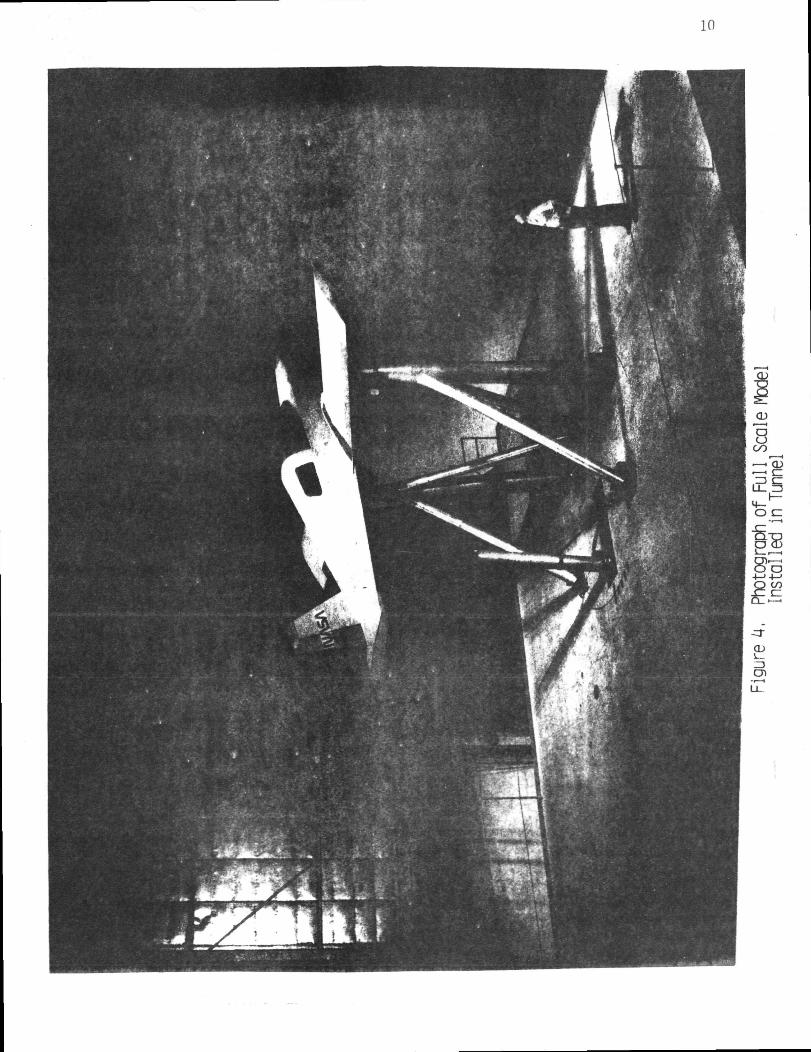
Figure 3. The aircraft is representative of a single engine low
wing general aviation airplane. Figure 4 shows a photograph of the
airplane mounted in the test section of the NASA 30 x 60 foot wind
tunnel. . •
A controllable spoiler was mounted on the underside of the
horizontal stabilizer just forward of the elevator hinge line and
of the same span. The spoiler was mounted flush against the stabilizer
skin in the fully retracted position. The spoiler was hinged at its
forward edge and could be deployed through an arc from zero to 90
degrees. Figure 5 illustrates the spoiler mounting and operation.
The spoiler chord was 2 inches. The mean geometric chord of
the horizontal stabilizer was 30.8" and the maximum h/c was 0.065.
For most tests, the maximum spoiler extension was 60°, corresponding
to an h/c of 0.056.

4,0'
Gross weight , , , 1500 Ibs,Top speed atsea level , , , 144 MPH
Wing area , , , 98,.0sq, ft,Wing loading , , .15.27 Ibs,/
sq, ft,
24.55'
Figure 3. Airplane Dimensions
10

11
Elector
Spoiler height
eFigure 5.Mounting
12
Test Conditions
The test section velocity was approximately 86 feet per second,
corresponding to a test Reynolds number of 2.20 x 10 . Table 1
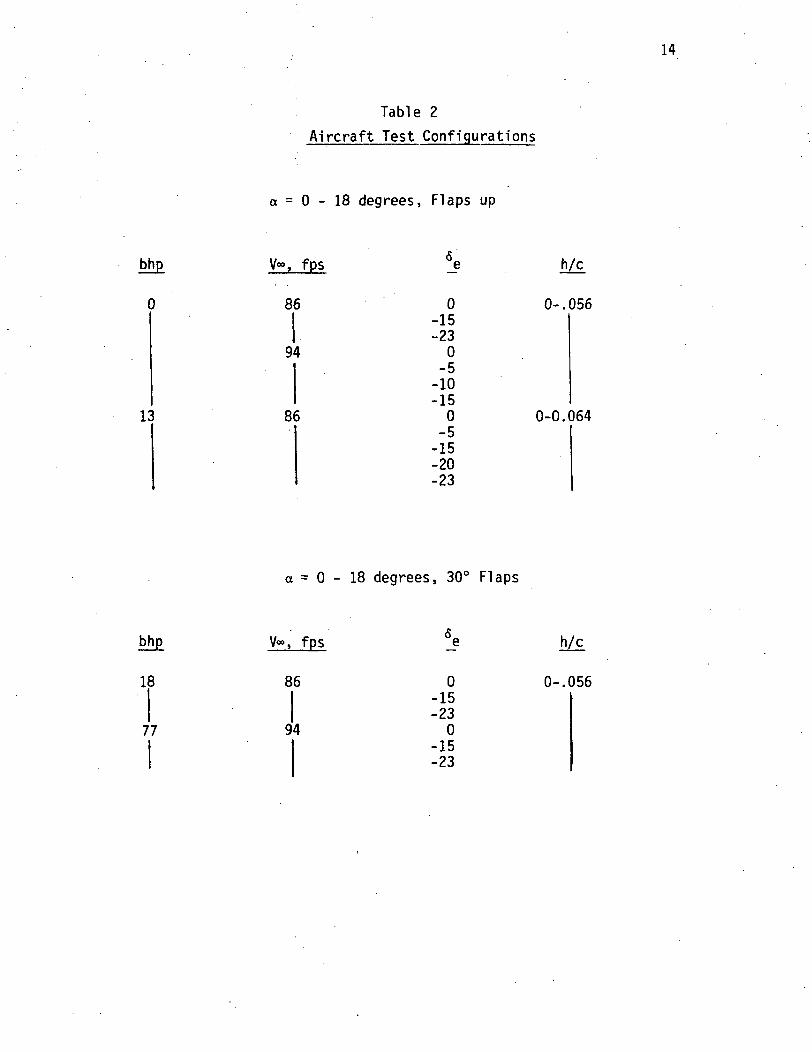
lists aircraft geometry constants. Table 2 summarizes the airplane
configurations and test conditions.

13
Table 1
Aircraft Geometry Constants
Wing Area, $w 98.0 sq. ft.
Wing Span, b •• 24.46 ftw
Wing Chord, GW 4.00 ft
Tail Area, S. 16.74 sq. ft.
Span of the Tail, bt 7.690 ft
Elevator Area, SQ 7.22 sq. ft.
Elevator mean chord, c .95 ft
Tail length, lt 11.620 ft.
Tail height, ht 1.010 ft.
14
Table 2
Aircraft Test Configurations
a = 0 - 18 degrees, Flaps up
bhp V«, fps e h/c
0 86 0 0-.056-15-23
94 0-5
-10-15
13 86 0 0-0.064-5
-15-20-23
a = 0 - 18 degrees, 30° Flaps
bhp
18
77
V°°, fps
86
94
0-15-230
-15-23
h/c
0-.056

15
Results
Stall Proofing the Test Aircraft
The first step in stall proofing an aircraft is to determine
the usable angle of attack range. Figure 6 shows the test aircraft
C. variation with angle of attack for the power off, flaps up case.
As shown, the'usable angle of attack range extends to approximately
12 degrees. Beyond 12 degrees will be considered the stall regime.
Although Ci may be increased by changes in power and flap deflections, themax
change in stall angle of attack is negligible for this aircraft configura-
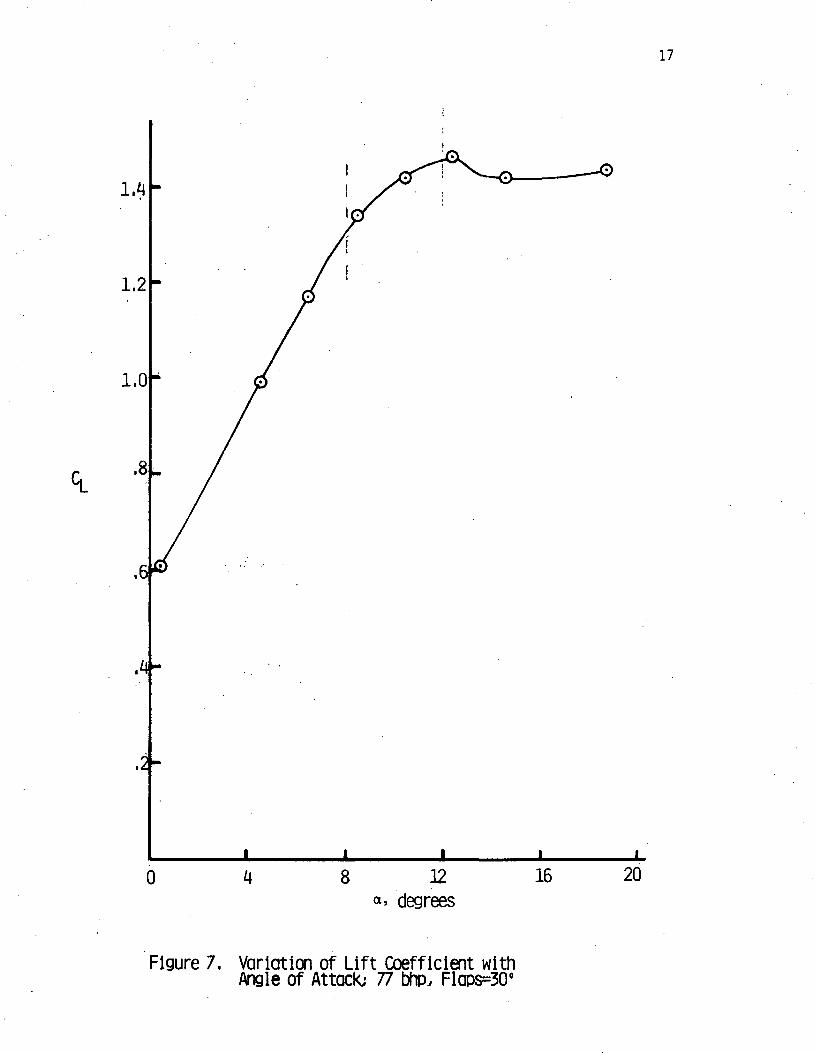
tion. Figure 7 shows the additional case of power on and flaps deflected.
The onset of the stall has been labeled a in Figures 6 and 7.
Previous studies '2'J have shown that an angle of attack range of about
4° below stall is sufficient for the transition from basic to spoiler
augmented stability.' This was shown in Equation (2) and Figure 1.
Therefore, with a = 12° and a 4° active range, spoiler deployment
should begin at 8° angle of attack. This angle is labeled a .
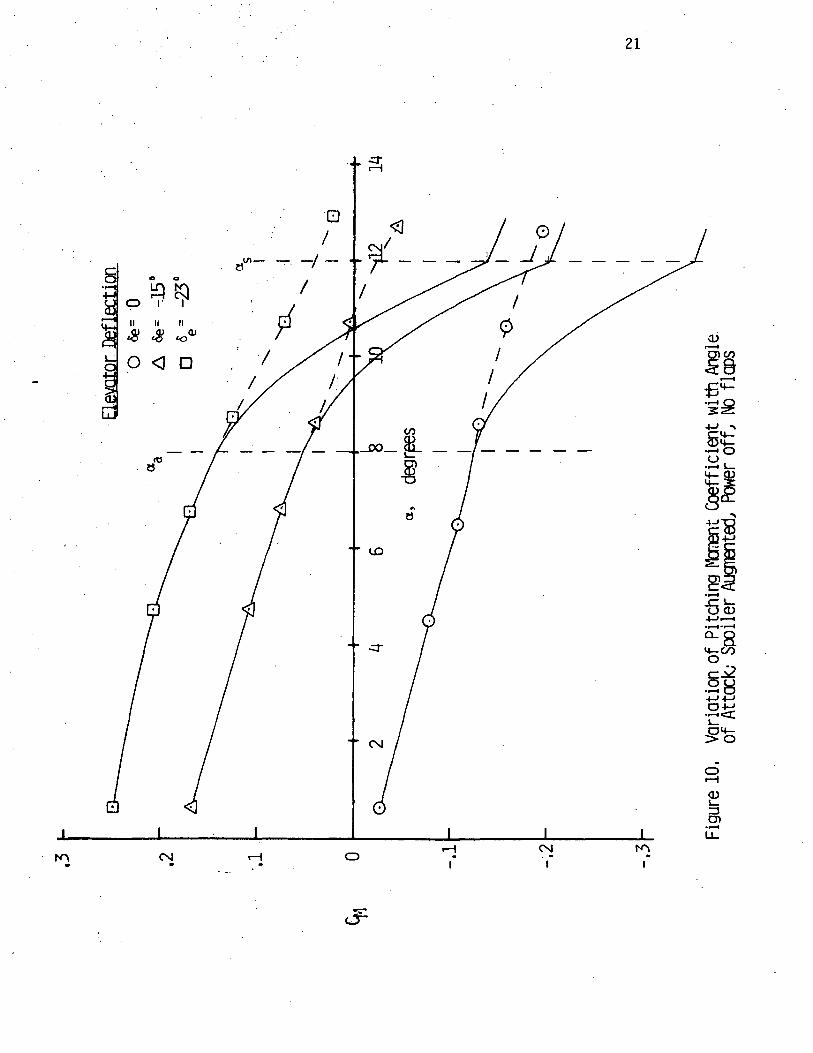
Figure 8 shows the variation in pitching moment coefficient with
changes in angle of attack for various elevator deflections. Although
this is for the power off and flaps up case, the behavior of the
curves around a is representative of all configurations and shows
that the aircraft has no inherent pitch down (increase in the negative
slope of the curve) at stall. Generally it is desirable to have a pitch
down at stall to warn the pilot and aid in stall recovery efforts.
The small scale tests showed that, for a given angle of attack

16
1,2
1.0
,8
,6
,2
012 16 20
a, degrees
Figure 6, Variation of Lift Coefficient withAngle of Attack
17
1,2
1,0
,8
,6
,2-
0 8 12a, degrees
16 20
Figure 7, Variation of Lift Coefficient withAngle of Attack; 77 bhp, Flaps=30°

18
CO
-2xiS-+-J
ooO)

19
and elevator deflection, there was an almost linear reduction in
pitching moment as spoiler height increased. Similar results were
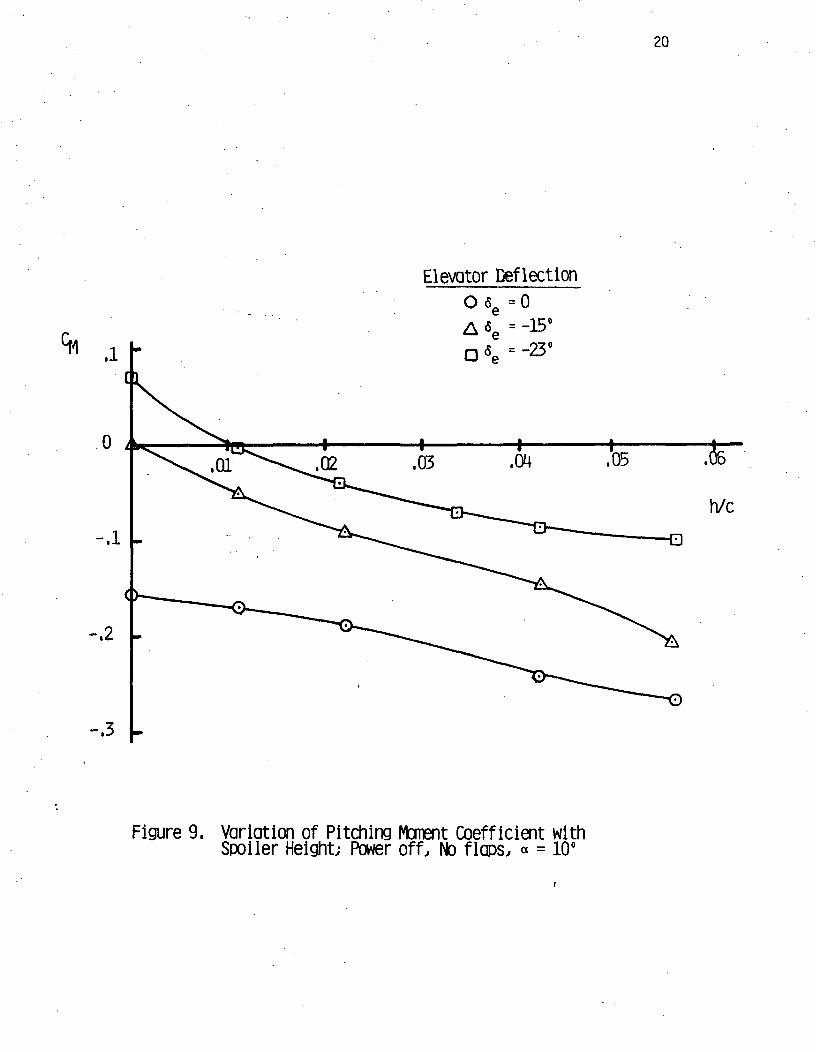
obtained for the full scale aircraft. Figure 9 shows this reduction
in pitching moment up to a spoiler height of 0.056 for the test
aircraft for a = 10° and power off. Similar results were obtained
throughout the angle of attack range from 0 to 12° and for various
power and flap configurations.
Using the full scale results shown in Figure 9 and the spoiler
deployment program presented in Equation (2), the change in pitching
moment coefficient for a programmed spoiler deployment can be
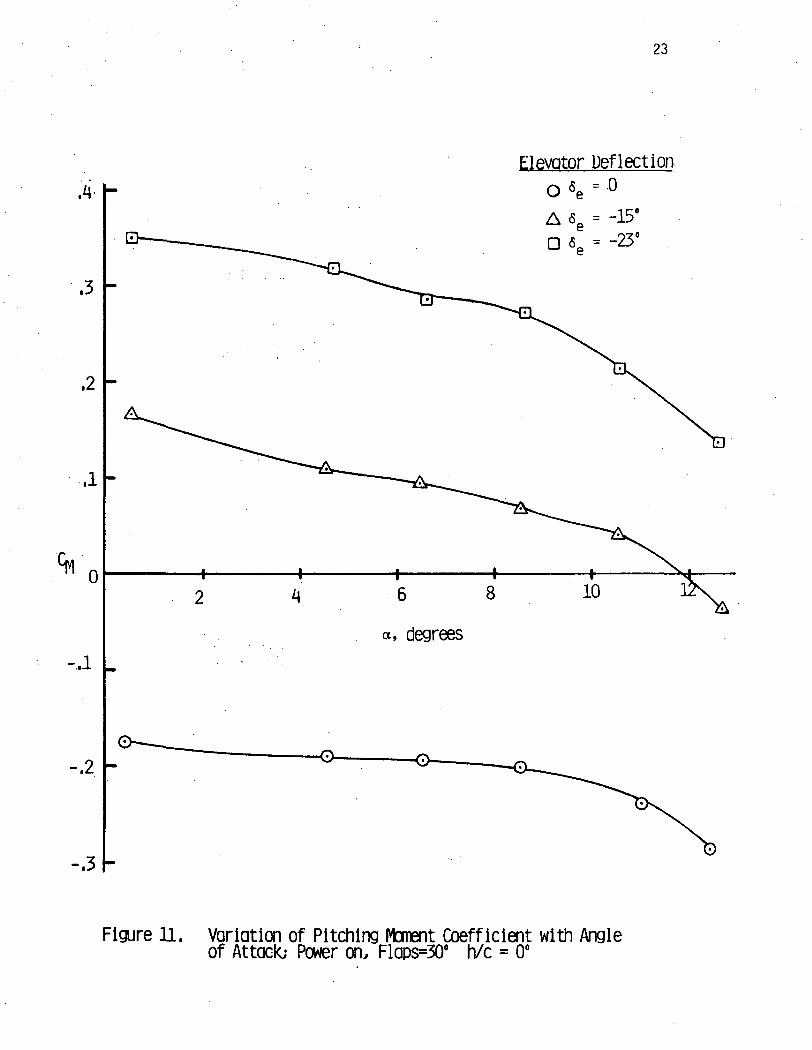
obtained. Figure 10 shows this variation in pitching moment co-
efficient for the test aircraft. The curves below and the dashed
lines above a, represent the basic aircraft pitching moment co-a
efficient and are identical to those in Figure 8. The solid lines
represent the pitching moment coefficient due to the programmed
spoiler deployment. The spoiler influenced pitching moment coefficient
returns to the slope of the original curve beyond a ; at which point
the spoiler is fully deployed. The data in Figure 10 shows that the
aircraft will trim below the stall angle of attack with full elevator
deflection (-23°). There is also a sizable increase in static stability
at the trim point. The slope of the curve, which is the static stability
parameter, is much higher at the trim point, resulting in a much more
stable airplane. This increase in stability fulfills the second fun-
damental requirement outlined in Reference 4; the air.craft should have
a restoring moment at this trim condition which cannot be overcome by
20
Elevator Deflection06 =0
- 3
Figure 9, Variation of Pitching Moment Coefficient withSpoiler Height; Power off, No flaps, « = 10°
21
22
pilot or gust inputs. It must also be able to counteract any over-
shoot due to rotational inertia about the pitch axis. The slope of
the pitching moment curve is a function of the spoiler deployment
schedule which, thus far, has been based on intuition and previous1 2 j 'experience ' .' More flight tests are needed to optimize this schedule.
It should be noted that the increased stability at high angles
of attack should enhance both handling and safety by allowing the
pilot to operate the airplane consistently and precisely near the stall
angle of attack. The precise speed control which a highly stable air-
craft is capable of would be a great aid during certain phases of
flight such as takeoffs and landings or instrument approaches.
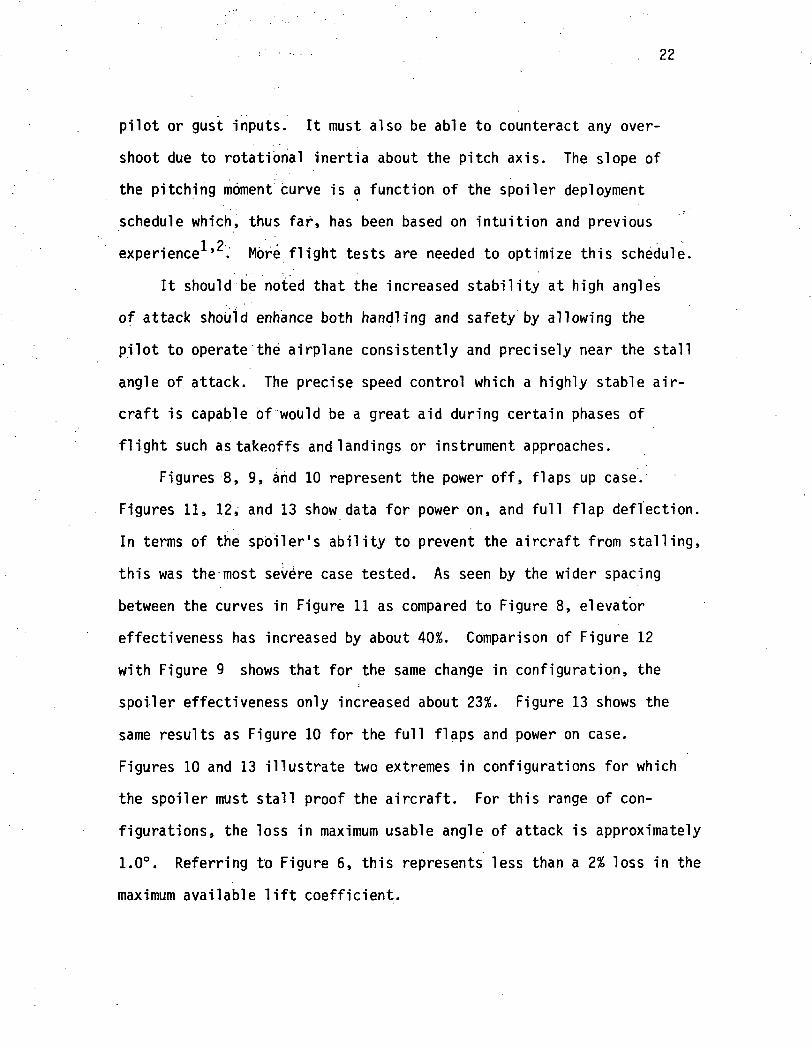
Figures 8, 9, and 10 represent the power off, flaps up case.
Figures 11, 12, and 13 show data for power on, and full flap deflection.
In terms of the spoiler's ability to prevent the aircraft from stalling,
this was the most severe case tested. As seen by the wider spacing
between the curves in Figure 11 as compared to Figure 8, elevator
effectiveness has increased by about 40%. Comparison of Figure 12
with Figure 9 shows that for the same change in configuration, the
spoiler effectiveness only increased about 23%. Figure 13 shows the
same results as Figure 10 for the full flaps and power on case.
Figures 10 and 13 illustrate two extremes in configurations for which
the spoiler must stall proof the aircraft. For this range of con-
figurations, the loss in maximum usable angle of attack is approximately
1.0°. Referring to Figure 6, this represents less than a 2% loss in the
maximum available lift coefficient.
,3
,2
,1
0
-.1
23
Elevator DeflectionO «e = 0
A se = -15°D 60 = -23°
a, degrees
-.2
-,3h
Figure U, Variation of Pitching Moment Coefficient with Angleof Attack; Power on, Flaps=30' h/c = 0°

24
,3
-.1
-.2
-.3
.01
Elevator Deflectiono «e= 0
D 6e=-23°
.03 .04h/c
.05 .06
Figure 12. Variation of Pitching Moment Coefficient withSpoiler Height; 77 bhp, 30° Flaps, « = 10°
.1 h Elevator Deflection- 0°= -15°= -23°
25
a.
Figure 13, Variation of Pitching Moment Coefficient withAngle of Attack; Spoiler Augnented, 77 bhp, 30°

26
For the power on, full flap configuration, the aircraft is
trimmed much closer to the stall angle of attack. The 77 bhp
condition is not the maximum power available and with an increase
in power, a slightly larger spoiler height may be required for
complete stall proofing. .
All data presented have been corrected'to a e.g. location
of 25% chord.: This reflects a trim condition (6e= 0) of a = 1.0°,
corresponding to a- C, of approximately 0.35. The effects of
moving the e.g.-forward would be to change the trim condition and
increase the static stability of the aircraft. Both would enhance
the spoiler's effectiveness as a stall preventative system.
Correlation of Results with Previous Tests
The primary purpose of the full scale tests was to verify the
results and conclusions obtained from the theoretical approach and
previous wind tunnel tests.
Probably one of the more difficult problems in designing the
spoiler deployment system is determining the increase in stability
which must be provided by the spoiler and the maximum usable angle
of attack. The solution is severely affected by changes in Reynolds
number. The problem is illustrated in Figure 14, which shows the
variation in lift coefficient with angle of attack for two Reynolds
numbers. The curve for RN = 2.97 x 10.5 represents data for the 1/5
scale model tested in the 12 foot low speed wind tunnel. As noted,

27
1,3 I
1.2 .
1,0 .
,8 .
,6 .
,2 -
8
O 1^ = 2,20x10^O RN = 2,97 x 10
5
12
a, degrees
16
Figure 14, Reynolds Nurter Effects on Lift Coefficient
28
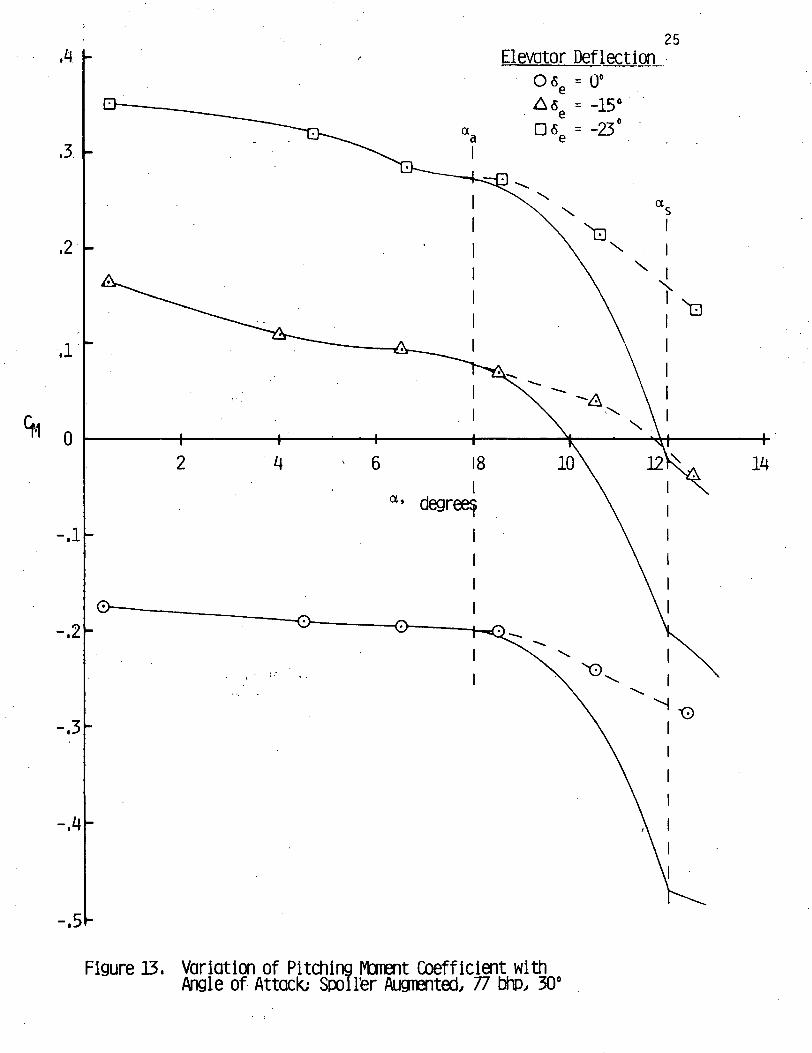
flow separation and the resulting stall occurred at approximately
9° angle of attack whereas for the full scale tests, stall did not
begin until approximately 12°. In addition, the break in the lift
curve was more severe for the small scale tests. It is evident
from this comparison that low Reynolds number tests are not suitable
for determining stall onset or the usable angle of attack range for
the full scale airplane. This would have to be determined from
flight tests or high (equal to full scale flight RN) Reynolds number
wind tunnel tests.
Figure 1.5 compares the variation in pitching moment coefficient
with angle of attack for the same tests. The curves do not coincide
at low angles of attack due to differences between the horizontal
tail incidence angles; however, the slopes of the two curves are very
similar up to the point where the stall begins on the low RN test.
Beyond the stair, the low R^ test demonstrates a marked increase in
the slope of the pitching moment curve not evident in the high R^ test.
Since the spoiler will be designed to operate in a region below the
stall angle of attack, for preliminary design purposes, the small
scale tests would provide adequate data regarding pitching moment in
this regime.
Reference 5 describes the testing of the horizontal tail only of
the test aircraft in the Texas A&M 7 x 10 foot low speed wind tunnel.
The test fulfilled three basic requirements: (1) To verify some of
the results of the small scale tests , (2) To verify the theoretical
approach developed in References 3 and 4, and (3) to optimize spoiler
29
flow separation and the resulting stall occurred at approximately
9° angle of attack whereas for the full scale tests, stall did not
begin until approximately 12°. In addition, the break in the lift
curve was more severe for the small scale tests. It is evident
from this comparison that low Reynolds number tests are not suitable
for determining stall onset or the usable angle of attack range for
the full scale airplane. This would have to be determined from
flight tests or high (equal to full scale flight RN) Reynolds number
wind tunnel tests.
Reference 5 describes the testing of the horizontal tail only
of the test aircraft in the Texas A&M 7 x 10 foot low speed wind tunnel.
The test fulfilled three basic requirements: (1) to verify some of
the results of the small scale tests , (2) to verify the theoretical
approach developed in References 3 and 4, and (3) to optimize spoiler
configuration and Ideation. The geometry of the spoiler for the full
scale test was based .on the tail only tests.
Since a change in aircraft pitching moment can be viewed as a .;•
change in tail lift, it was hoped that the results of the tail only
test could also be used to predict the response of the full scale
aircraft to spoiler and elevator deflections. Analysis of the full
scale data shows that trends can be predicted but the prediction of
absolute values requires accurate knowledge of the flow field character-
istics in which the tail is operating. For example, problems were
encountered in trying to compute a tail efficiency factor, rij. This
was done by comparing the pitching moment derivatives of the full
scale aircraft with and without the tail attached. Figure 15 shows the

30
0
-.10
-.20
.2
Figure 15, variation of Pitching Moment Coefficient withLift Coefficient; Complete Airplane

31
pitching moment variation with changes in lift coefficient for the
complete configuration. The slope of the curve, CM , is essentiallydCL
constant in the region below stall with a value of -.1519. Figure
16 shows the same curve for the airplane without the tail. If this
curve is linearized as shown by the dashed line, the resulting slope
is .0700. From the static stability equations of Reference 6, the
change in the pitching moment'coefficient of the aircraft with changes
in lift coefficient can be summarized as follows:
^aircraft and misc. components to the tail
/ _\ / \The contribution due to the tail can be further broken down as follows:
TnT 1-dj (3)
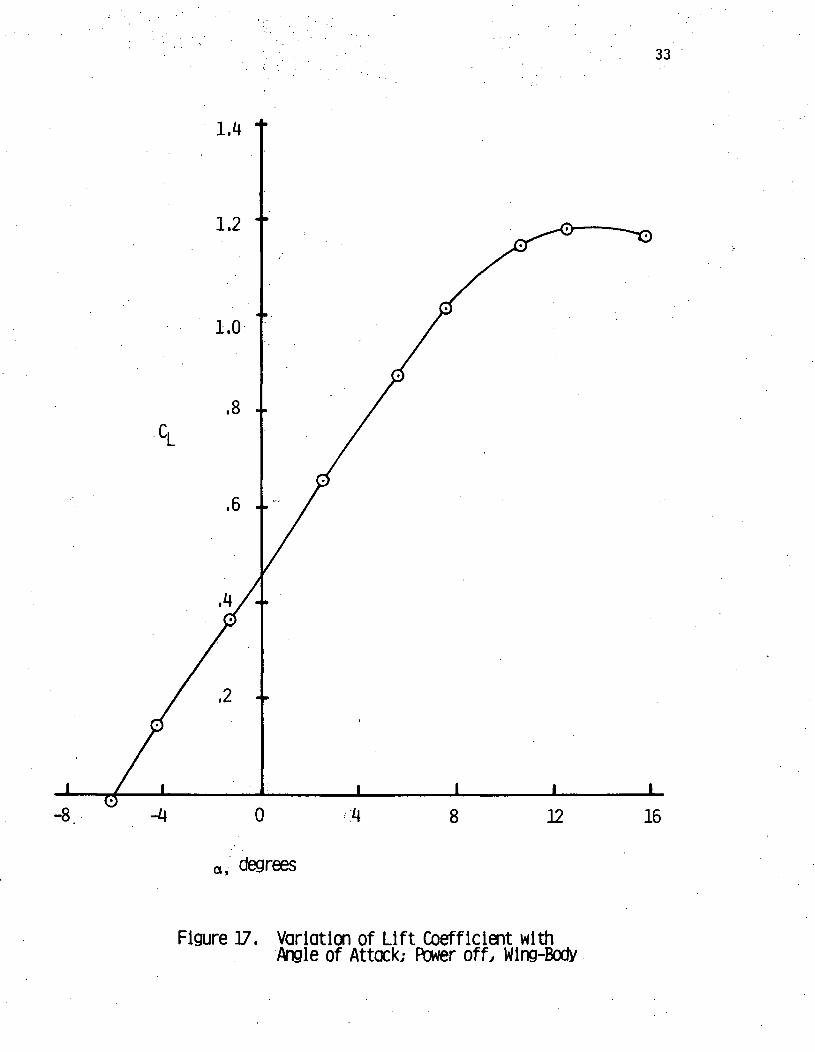
The lift curve slope of the wing-body can be determined from
Figure 17 while Figure 18 from Reference 5, provides the same
data for the tail alone. The slopes are .0746 and .0495 for the
wing-body and tail alone respectively. The value of -p , .414,
was estimated using NACA TR 6487. Since fdCM\ can be\*L Aall
determined by subtracting the wing-body contribution from the
(dCM\ , the tail efficiency factor, n-j-, is the only unknowndCL/aircraft

32
- 2 • •
Figure 16, Variation of Pitching Moment Coefficient withLift Coefficient; Wing-Body
33
1,2 "
1,0
,8 ..CL
,6 -.
0 8 12 16
a, degrees
Figure 17, Variation of Lift Coefficient withAngle of Attack; Power off, Wing-Body

34
Figure 18. Variation of Lift Coefficient withAngle of Attack; Tail only
35
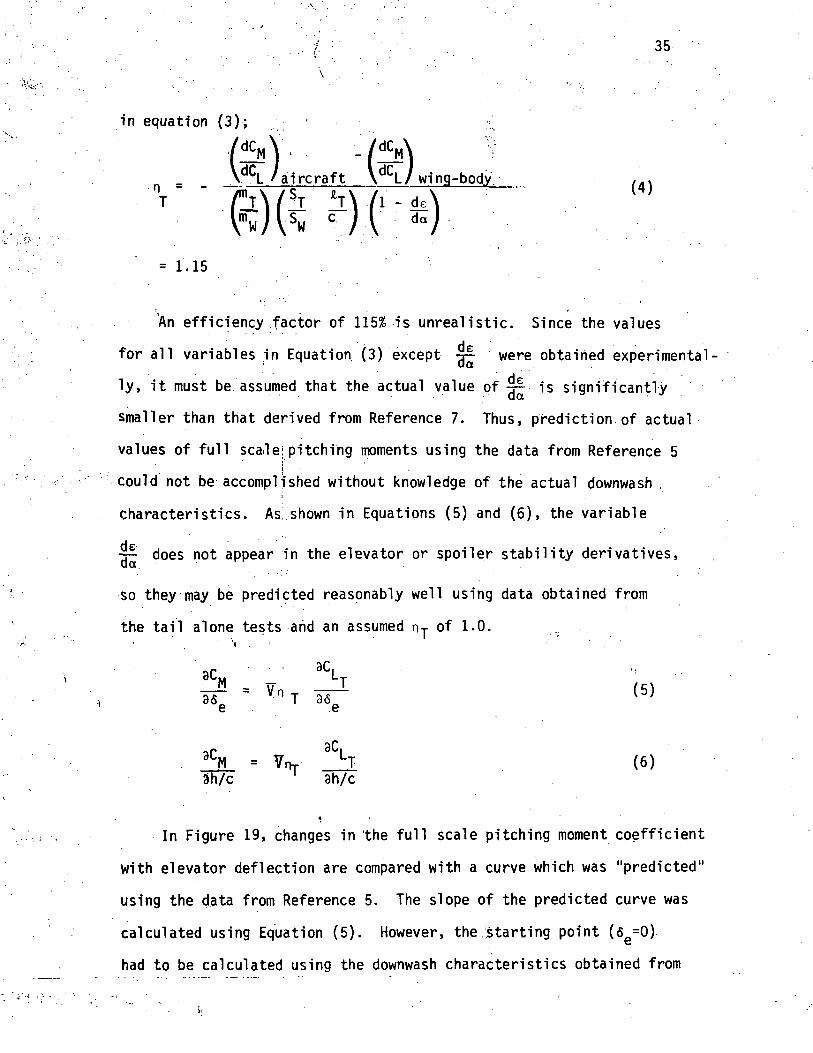
in equation (3);
\ uCi / . >. % uCi I • » i' -V L /aircraft \ L/ wing-body ,.,n_ " /"-j-X /5T JUA /i d \ " '
= 1 . 1 5 ' ' •
An efficiency factor of 115% is unrealistic. Since the values
for all variables in Equation (3) except ^p were obtained experimental
ly, it must be assumed that the actual value of 4^ is significantly
smaller than that derived from Reference 7. Thus, prediction of actual
values of full scale;pitching moments using the data from Reference 5
could not be accomplished without knowledge of the actual downwash .i
characteristics. As! shown in Equations (5) and (6), the variable
~p does not appear in the elevator or spoiler stability derivatives,
so they may be predicted reasonably well using data obtained from
the tail alone tests and an assumed n-p of 1.0.
3CM 8CLT ':
_M = YnT —- (5)e e
or . 3C,8CM = Vrh--. LT (6)Sh/c 3h/c
4
In Figure 19, changes in the full scale pitching moment coefficient
with elevator deflection are compared with a curve which was "predicted"
using the data from Reference 5. The slope of the predicted curve was
calculated using Equation (5). However, the starting point (<Se=0)
had to be calculated using the downwash characteristics obtained from
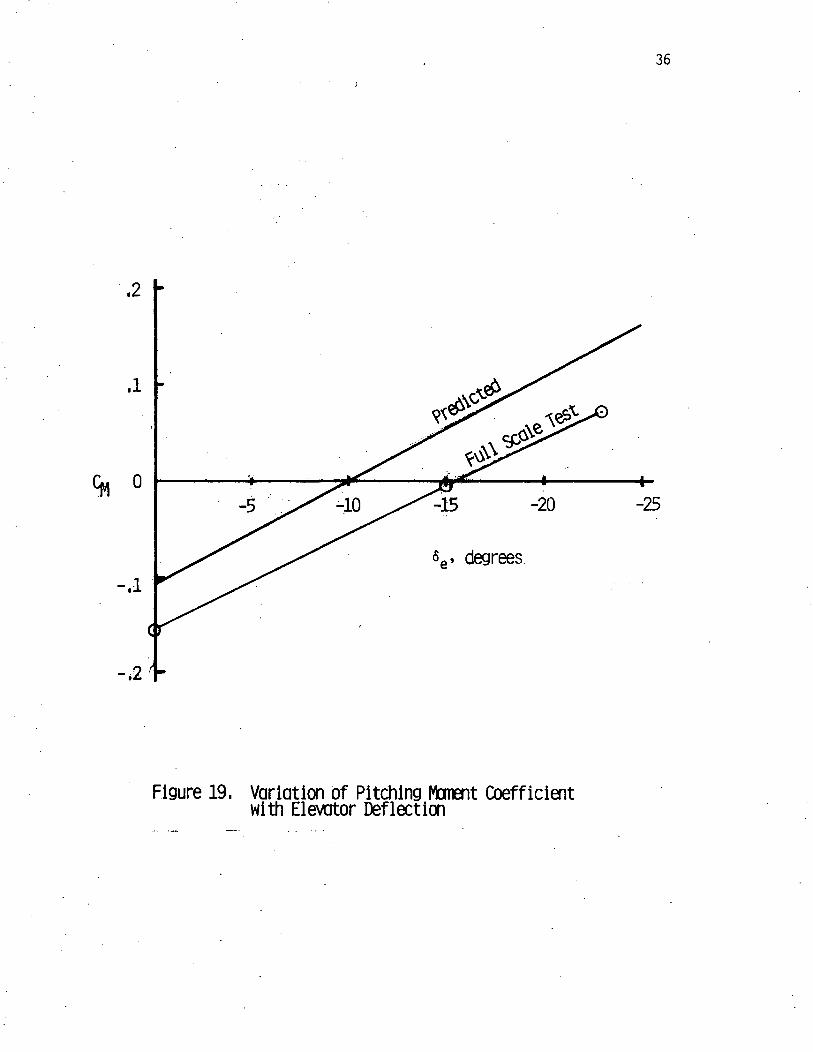
36
Figure 19, Variation of Pitching Moment Coefficientwith Elevator Deflection
37
Reference 7 and a theoretical wing lift curve slope of 4.71 instead
of the actual 4.27. Thus, while the absolute value of the aircraft
pitching moment for a given elevator deflection cannot be accurately
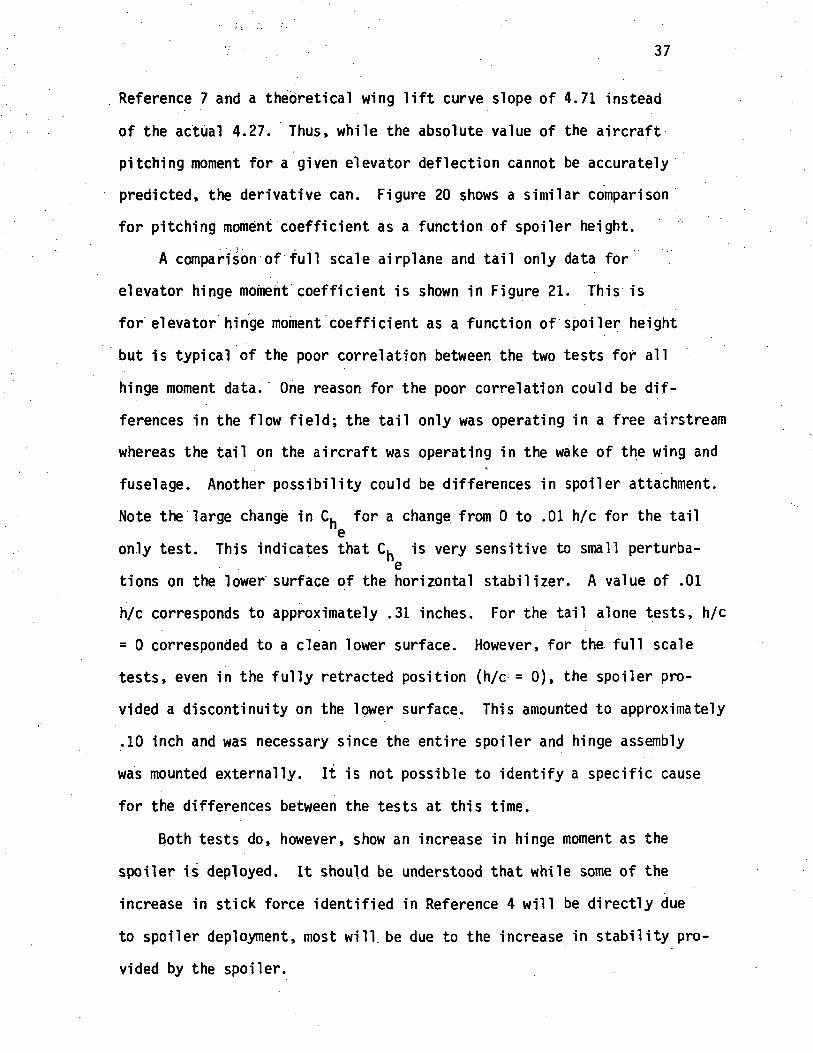
predicted, the derivative can. Figure 20 shows a similar comparison
for pitching moment coefficient as a function of spoiler height.
A comparison of full scale airplane and tail only data for
elevator hinge moment coefficient is shown in Figure 21. This is
for elevator hinge moment coefficient as a function of spoiler height
but is typical of the poor correlation between the two tests for all
hinge moment data. One reason for the poor correlation could be dif-
ferences in the flow field; the tail only was operating in a free airstream
whereas the tail on the aircraft was operating in the wake of the wing and
fuselage. Another possibility could be differences in spoiler attachment.
Note the large change in Ch for a change from 0 to .01 h/c for the taile
on.ly test. This indicates that C^ is very sensitive to small perturba-e
tions on the lower surface of the horizontal stabilizer. A value of .01
h/c corresponds to approximately .31 inches. For the tail alone tests, h/c
= 0 corresponded to a clean lower surface. However, for the full scale
tests, even in the fully retracted position (h/c = 0), the spoiler pro-
vided a discontinuity on the lower surface. This amounted to approximately
.10 inch and was necessary since the entire spoiler and hinge assembly
was mounted externally. It is not possible to identify a specific cause
for the differences between the tests at this time.
Both tests do, however, show an increase in hinge moment as the
spoiler is deployed. It should be understood that while some of the
increase in stick force identified in Reference 4 will be directly due
to spoiler deployment, most will be due to the increase in stability pro-
vided by the spoiler.
<fl
Figure 20, Variation of Pitch.ing Moment Coefficientwith Spoiler Height; 6e=0° , a=io°

o < - o
39
D -23
.24

40
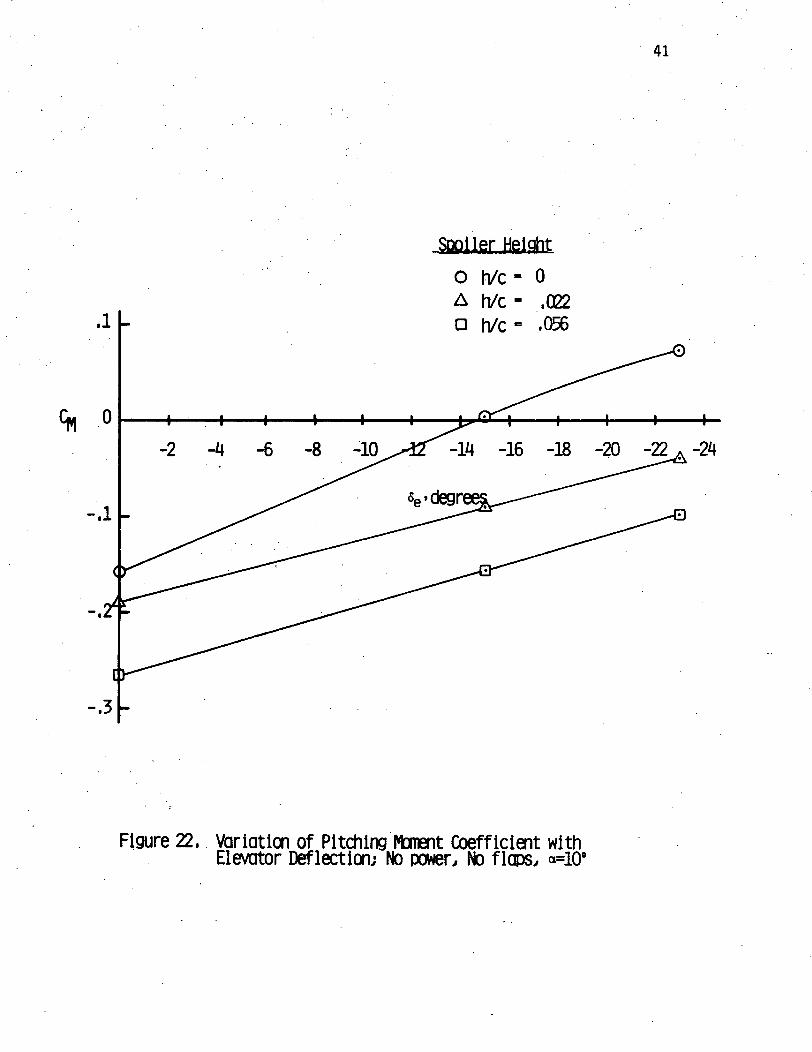
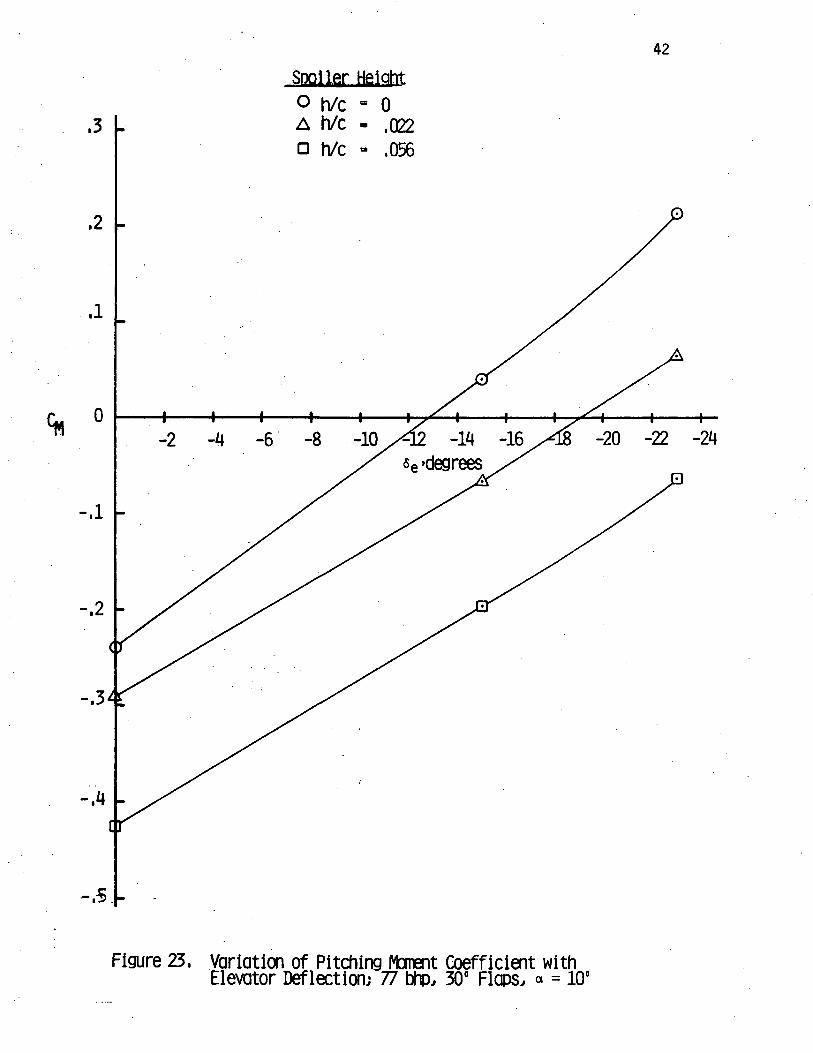
Effects of Spoiler and Elevator Deflection
Figure 22 depicts the aircraft pitching moment as a function
of elevator deflection for a = 10° and no power. The top curve
represents no spoiler deflection while the bottom curve is for
h/c = 0.056, which was the maximum height tested.
While the slope, CM , remains essentially linear throughout
\the spoiler deployment, there is a slight reduction in its slope
at full deployment. This indicates that the deployment of the
spoiler has not changed the characteristics of the elevator.
For this aircraft, elevator effectiveness, CM , increased sig-\
nificantly with increases in power and flap deflection; however,
the effect of spoiler deployment on elevator power remained small
regardless of configuration changes. This is illustrated in
Figure 23, .where the slope of the curve of the variation in
pitching moment with changes in elevator deflection angle has in-
creased considerably due to increases in power and flap deflection
but the change in CM due to spoiler deployment has remained small.\
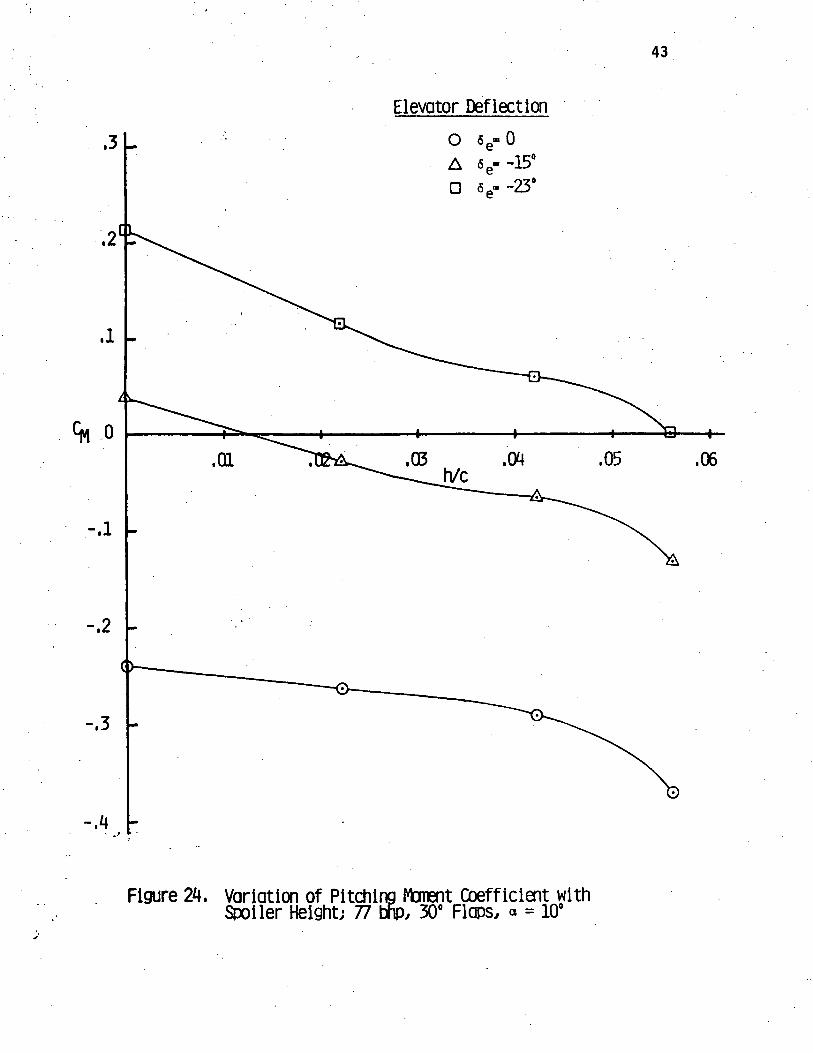
Figure 24 shows the variation in pitching moment coefficient with
changes in spoiler height. There is a tendency for the spoiler to
gain effectiveness (9C«/3n7c) as the elevator is deflected. This is
noticeable only for the high power, large flap deflection case shown
in Figure 25. The effect become undetectable with power off and no
41
,1 -
Spoiler Height
O h/c- 0A h/C- ,022D h/c - .056
Figure 22, Variation of Pitching Moment Coefficient withElevator Deflection; No power, No flaps, a=io°
42
,3 L
Spoiler HeightO h/c = 0A h/c - ,022D h/c - ,056
i 1 1 s* i 1 1
-,-5 -
Figure 23, Variation of Pitching Moment Coefficient withElevator Deflection; 77 bhp, 30° Flaps, a = 10°
43
Elevator Deflection
,3L o 0A 6e=-15°D 6e=-23°
Figure 24, Variation of Pitching Moment Coefficient withSpoiler Height; 77 bhp, 30° Flaps, a = 10°

,020
,005
o Power offo 77bhp
,01 ,02 .03 .04 .05
h/c
a. With Spoiler Height
44
-o
.06
Figure 25. Variation of Pitching Moment Coefficient Slope

45
.020 L
,015
CM ,010^
,005 .
20 40 60 80brp
b, With Power
Figure 25. Variation of Pitching Moment Coefficient Slope
46
,020
,015
.005
0
o Power offo 77 bhp
4 6
a, degrees
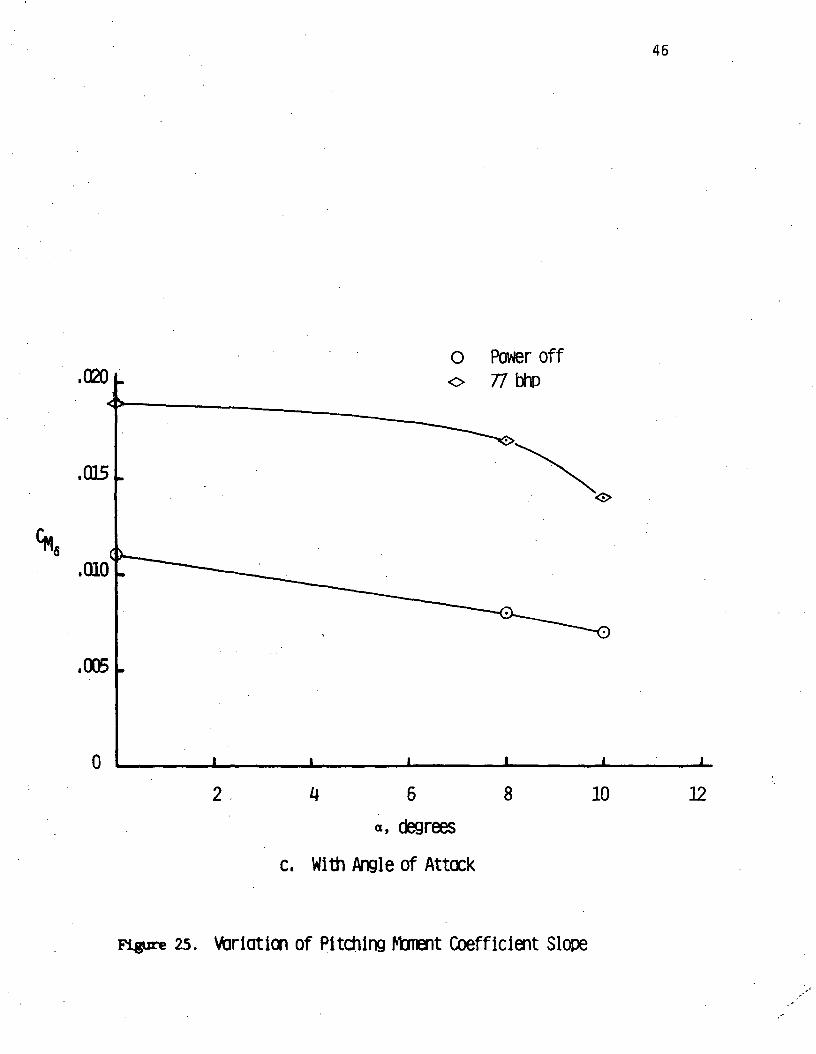
c, With Angle of Attack
8 10 12
Figure 25. Variation of Pitching Moment Coefficient Slope

47
flaps. This lack of effect is shown in Figure 9.
Thus, the overall effect of the spoiler deploying at high angles
of attack would be to reduce the elevator's effectiveness slightly
while providing its own negative pitching moment. Attempts to over-
ride the spoiler by increasing elevator deflection would result in
increasing the spoiler's effectiveness.
This apparent interaction of the elevator and spoiler would tend
to invalidate the assumption of independence established in Reference
4 and Equation (1). However, other factors normally ignored in pre-
liminary analysis can have as large or larger effects. Figure 25 shows
the changes in C due to h/c, power, and angle of attack for the testm«oeaircraft. The parameter having the least effect is h/c. Therefore,
within the limits of experimental accuracy, the assumptions of in-
dependence can still be considered valid for preliminary design.
Since the changes in CM due to either elevator or spoiler deflection
are assumed to be linear, the interaction effects can be accounted for
entirely within the last, or spoiler, term of Equation (1).

48
Concluding Remarks
The results of theoretical studies, small scale wind tunnel
tests, and the full scale aircraft tests in the 30 x 60 foot wind
tunnel at NASA Langley Research Center show that the spoiler system
can stall proof the aircraft, and the theoretical approach developed
in References 3 and 4 is valid. There are still 2 major areas of
concern that can be investigated by a flight test or simulator study.
They are establishing the maximum usable range of angle of attack and
the appropriate change in spoiler height with angle of attack.
Full scale wind tunnel tests have shown that for this particular
aircraft, the lift curve at stall is relatively flat and the stall
condition does not produce a severe drop-off in lift coefficient.
If this occurs in flight, the deployment of the spoiler can be delayed
to a higher angle of attack range, allowing the aircraft to be flown
closer to its maximum lift coefficient throughout the center of gravity
range.
The spoiler deployment rate with angle of attack is based mostly
upon engineering experience. This deployment rate will significantly
affect the stability characteristics at high angles of attack and in
turn produce an increase in stick force. This increase in stick force
has been experienced in previous flight tests using the spoiler concept.
The results of further flight tests coupled with the static
stability results presented in.this report should produce a better
understanding of the design requirements for a spoiler system capable

49
of preventing aircraft stall.
Any future flight test program should include an evaluation of
the aircraft handling qualities, which cannot be obtained from wind
tunnel tests. Results obtained to date indicate that the spoiler
system should provide a significant improvement in handling qualities
at high angles of attack.
50
References
1. Chevalier, Howard L., and Brusse, Joseph C., "A Stall/SpinPrevention Device for General Aviation Aircraft," SAE PaperNo. 730333, April 3-6, 1973.
2. Chevalier, Howard L., "Aerodynamic Spoiler for Preventing Air-plane Stall/Spin Type Accidents," Final Report No. FAA-RD-75-21,U.S. Department of Transportation, Federal Aviation Administration,December, 1974.
3. Chevalier, H.L., "Some Theoretical Considerations of a StallProof Airplane," SAE Paper'0096-736X/80/8803-2096, Volume 88SAE Transactions, 1980.
4. Chevalier, Howard L., "Wind Tunnel Tests of Aerodynamic Conceptsfor Stall Proofing a General Aviation Airplane," Interim ReportNASA Research Grant NSG-1407, May, 1979.
5. Chevalier, H.L., Wilke, R.A., and Faulkner, M.L., "Wind TunnelEvaluation of Aerodynamic Spoiler on General Aviation AircraftHorizontal Tail, Part I," Interim Report NASA Research GrantNSG-1407, May, 1979.
6. Perkins, C.D. and Hage, R.E., "Airplane Performance and Stability,"John Wiley and Sons, New York, 1949.
7. Silverstein and Katzoff, "Design Charts for Predicting DownwashAngles and Wake Characteristics Behind Plain and Flapped Wings,"NACA TR 648, 1940.