summary of utah economic analysis
TRANSCRIPT

PATHWAY TO A BALANCED PUBLIC
LANDS POLICY
A Review of and Recommendations Based On
An Analysis of a Transfer of Federal Lands to the State of Utah
Prepared for:
Utah State Legislature
Natural Resources, Agriculture, and Environment Interim Committee
Prepared by:
Public Lands Policy Coordinating Office
Office of the Governor
November 28, 2014

Table of Contents I. INTRODUCTION ............................................................................................................................. - 3 -
II. THE STATUTORY DIRECTIVE FOR THE STUDY ................................................................................ - 5 -
III. THE STUDY ................................................................................................................................ - 6 -
IV. SIGNIFICANT ISSUES .................................................................................................................. - 7 -
A. Current Expenditures, Revenues, and Economic Impacts ........................................................ - 7 -
1. BLM ....................................................................................................................................... - 8 -
2. USFS ...................................................................................................................................... - 9 -
B. Revenue-Sharing PILT and SRS ................................................................................................ - 10 -
1. Payments in Lieu of Taxes (PILT) ......................................................................................... - 10 -
2. Secure Rural Schools (SRS) .................................................................................................. - 10 -
C. Wildfire.................................................................................................................................... - 10 -
D. Recreation and Quality of Life ................................................................................................ - 12 -
E. Economic contributions of Current Activities ......................................................................... - 15 -
F. The Effect of Federal Lands upon Economic Vitality............................................................... - 15 -
G. Projected Costs and Revenues ................................................................................................ - 16 -
1. Oil and Gas Production ....................................................................................................... - 18 -
2. Coal Production ................................................................................................................... - 19 -
3. Combined Oil, Gas, and Coal ............................................................................................... - 20 -
4. Other Revenue Sources....................................................................................................... - 21 -
V. COUNTY GOVERNMENT FEEDBACK ............................................................................................ - 22 -
A. Priorities .................................................................................................................................. - 22 -
B. Concerns ................................................................................................................................. - 23 -
VI. FREQUENTLY ASKED QUESTIONS ............................................................................................ - 23 -
VII. FUTURE CONSIDERATIONS ...................................................................................................... - 25 -
VIII. CONCLUSION ........................................................................................................................... - 27 -
- 2 -
I. INTRODUCTION
With the 2012 passage and signing into law of H.B. 148, the “Transfer of Public Lands
Act,” the State of Utah (State) served notice on the federal government that the State intends to
assume title to, and management of, certain public lands within its borders. H.B. 148 demands
that the federal government transfer title to some 31.2 million acres, which, for the most part, are
presently under the management authority of the United States Bureau of Land Management
(BLM) and the United States Forest Service (USFS).
The motivations behind H.B. 148 are many. However, a common thread that influences
them all is the fundamental reality that federal management of the public lands has become
significantly constrained by restrictive policies and regulations. As the title of former Governor
Scott M. Matheson's book asserts, the federal management of the public lands is “Out of
Balance.” The congressional mandate to manage the lands according to the principles of
“multiple-use and sustained yield” has become mired in inefficiency, paralysis, and a
predisposition to limited-use management. This immobilization has an effect upon State and
local economies, private enterprise, recreational access, rural culture, and the health and
sustenance of the very lands entrusted to federal stewardship.
Following passage of H.B. 148, it became clear that it would be prudent to first examine
federal management, budgets, and the economic impacts associated with the public lands. Of
paramount importance was the question of future and potential revenues and expenses should the
State assume ownership and management. The information necessary to perform such an
assessment was either not available, or was not in a format from which meaningful
determinations could be made. Accordingly, in 2013, H.B. 142 was passed and signed into law.
This legislation charged the Utah Public Lands Policy Coordinating Office (PLPCO) with the
- 3 -

responsibility of overseeing the preparation of a study and analysis of the budget and revenue
figures, and of the economic impacts and ramifications of a transfer of the public lands into the
ownership of and management by the State. H.B. 142 explicitly set forth in detail the areas of
necessary inquiry.
In the spring of 2013, PLPCO assembled a team of economists from the University of
Utah, Utah State University, and Weber State University to perform the study and economic
analysis. Aside from the directives set forth in H.B. 142, the primary directive by PLPCO to the
research team was that the report be objective and beyond reproach.
After an eighteen-month research effort, the final product entitled An Analysis of a
Transfer of Federal Lands to the State of Utah, November 2014 (Study), is now complete. Its
700+ pages is testament to the enormity of the task, the complexity of the issues, the depth of the
examination and the detail of its findings. It is a remarkable work that has never before been
performed. Its utility will be both broad and enduring, and will be of lasting interest to decision-
makers at all levels of government, both in Utah and throughout the Western United States, as
well as to the widely varied user interests and individuals regardless of perspective, interest, or
ideology.
The Study contains extensive useful information, and should be read as an integrated
whole in order to appreciate the complex and inter-connected nature of the economic and cultural
attributes of the public lands. Most significantly, it demonstrates that a transfer of the public
lands can be an economically sound pathway to a more balanced public lands policy. The Study
demonstrates that this can be accomplished without sacrificing the beauty of our State, the
quality of our life, or the attraction of Utah to tourists and recreationists from around the country
and the world.
- 4 -

II. THE STATUTORY DIRECTIVE FOR THE STUDY
H.B. 142 charged PLPCO with the duty to “conduct a study and economic analysis of the
ramifications and economic impacts of the transfer of public lands” from federal to State
ownership. The Study was directed (1) to examine the public lands for ownership, management,
jurisdiction, resource characteristics, federal management requirements, and current and potential
uses; (2) to determine ongoing and historical trends of maintenance costs, revenue production,
and funding sources of federal management, as well as revenues paid to State, county, and local
governments and how such revenues might be replaced following a transfer of the public lands;
(3) to determine existing uses of the public lands, the economic impacts of such uses and ways
that these uses can be protected following transfer; (4) to identify ways that, following the
transfer public lands, revenues from public lands can be increased while mitigating
environmental impact; (5) to identify the impact that federal ownership of public lands has on the
Utah School and Institutional Trust Lands (SITLA) Administrator’s ability to administer trust
lands, the State’s ability to fund education, and on State and local tax bases; and (6) to examine
how tourism and recreation contribute to State and local economics and to quality of life. Utah
Code Ann. § 63J-4-606 (2)(a). Theoretical modeling was to be employed to project future
economic impacts under various land use and development scenarios. Utah Code Ann. § 63J-4-
606 (2)(b)(viii). The Study was to “recommend the optimal use of the public lands following
transfer.” Utah Code Ann. § 63J-4-606 (2)(b)(ix). Lastly, PLPCO was required to submit a final
report on the Study, including proposed legislation and recommendations, to this Committee and
to the Governor before November 30, 2014. Utah Code Ann. § 63J-4-606 (5). The following
review and recommendations are submitted in fulfillment of PLPCO’s duties under H.B. 142.
- 5 -

III. THE STUDY
The 700+ page Study was prepared by a team of research economists from the Bureau of
Economic and Business Research, David Eccles School of Business, University of Utah (BEBR);
the Department of Applied Economics, Utah State University; and the Department of
Economics, Weber State University. It is broken down into thirteen sections, preceded by an
executive summary, and followed by a number of appendices, as follows (page references are to
Study pagination):
Section 1: Background (pp. 1-10) A.
Section 2: Management of Utah’s Lands (pp. 11-122) B.
Section 3: Potential Revenues and Costs of Managing Transferred Lands (pp. C.
123-152)
Section 4: Public Lands and Economic Growth (pp. 153-215) D.
Section 5: Federal Land-Based Revenues (pp. 215-241) E.
Section 6: Mining-Related Tax Revenues (pp. 241-254) F.
Section 7: Current Activities on Federal Lands and Their Economic Contributions G.
(pp. 255-372)
Section 8: Utah’s Natural Resources (pp. 373-490) H.
Section 9: Wildfire in Utah (pp. 491-537) I.
Section 10: State Funding of Public Education in Utah (pp. 537-546) J.
Section 11: Linking Public Lands to Social Conditions and Quality of Life (pp. K.
547-590)
Section 12: Summary of County Feedback (pp. 591-594) L.
Section 13: Transfer Scenarios (pp. 595-652) M.
- 6 -
Appendix A: Glen Canyon National Recreation Area Operations (pp. 653-670) N.
Appendix B: A Comparison of North Dakota’s Shale Oil and Utah’s Oil Shale O.
(pp. 671-674)
Appendix C: State Forest Management and Timber Programs (pp. 675-688) P.
Appendix D: BLM Oil & Gas Leasing: Wildness, Master Lease Planning and Q.
Sage-Grouse (pp. 689-720)
Appendix E: Economic Impact Modeling (pp. 721-724) R.
Appendix F: Grazing Cattle Budgets (pp. 725-731) S.
Appendix G: Text of H.B. 148 T.
Appendix H: Text of H.B. 142 U.
IV. SIGNIFICANT ISSUES
While the Study addresses a great many issues associated with the public lands, those
discussed below are viewed by PLPCO as having the most significance and interest. (Note: all
data is taken directly from the Study). Certain excerpts and certain salient data are emphasized.
The Study itself should be referenced and all economic data fully reviewed for a more in depth
analysis and discussion of specific issues. This report focuses on the economic issues. The
Study also contains analyses of non-economic and quality of life issues.
A. Current Expenditures, Revenues, and Economic Impacts
Of the 31.2 million acres of federally managed public lands subject to transfer under H.B.
148, almost all are presently under the authority of either the BLM or the USFS (lands under the
authority of the National Park Service (NPS) and the U.S. Fish and Wildlife Service (FWS) are
minimally involved). Accordingly, the Study primarily focuses on the revenues and expenses of
these two agencies.
- 7 -

1. BLM
Revenues from activities on Utah lands managed by BLM, primarily from oil, gas and
coal production, averaged $317.6 million annually from 2008 to 2012, reaching $339.1 million
in 2012 or $14.84 per acre. These revenues are collected by BLM and the Office of Natural
Resource Revenue (ONRR). ONRR receives payments from energy and mineral production,
which averaged $309.7 million per year from 2008 to 2012. BLM also collects permit and
recreational fees and rights-of-way rents, as well as other charges, which averaged $7.8 million
per year from 2008-2012.
BLM’s Utah activities are funded with annual congressional appropriations, permanent
operating funds, grants, fees, and reimbursements. Its average annual spending from 2003-
2012 was $118.6 million, or $5.19 per acre.
In terms of direct economic impacts measured in earnings, jobs and contributions to gross
State product (GSP), from 2008 to 2012, average impacts were (1) earnings – $66.2 million; (2)
jobs – 796; and (3) GSP – $11.8 million. Total economic impacts were (1) earnings – $107.2
million; (2) jobs – 2,105; (3) GSP – $92.3 million. Fiscal impacts, i.e. State and local taxes, for
the years 2008-2012 averaged (1) State – $7.2 million; (2) local – $671,000; and (3) total – $7.84
million.
BLM’s management of lands in Utah is constrained by certain factors over which it has
no control, and is deficient in many areas by reason of its own policies. While BLM agents and
employees on the ground are hard-working and well-intentioned, often their hands are tied and
they are prevented from taking necessary actions to address problems as they arise. As the Study
notes:
- 8 -

BLM’s management decisions are constrained by budget considerations and a complex regulatory environment. While the overarching goals and principals [sic] governing management of public lands are provided in FLPMA, the BLM must also incorporate a plethora of other—and sometimes conflicting—laws and regulations in its management objectives, all while accommodating public demands for access and use.
Study p. 41.
2. USFS
USFS collects revenues from a number of activities including recreation, grazing, sales of
mineral resources and forest products, land use for power generation, and ski resort operations.
Revenues are divided into two groups: (1) receipts from commercial activities, and (2) fees.
Revenues from commercial activities go to the National Forest Fund (NFF). Fees are paid into
special accounts and trust funds. In 2012, $7.9 million in revenues were generated by Utah
Forests, $5.2 million of which went to NFF and $2.7 million in fees. These numbers do not
include oil and gas or coal revenues as these activities are managed by BLM.
Because of USFS accounting practices, the costs of management cannot reliably be
allocated to specific states. Accordingly, spending and employment reflected in the Study relate
only to the 5 national forests that are exclusively in Utah. Average spending over the period
from 2008 through 2012 was $93.9 million or $11.04 per acre. In 2012, USFS spent $102
million or $12.05 per acre, managing Utah forests, of which $51.1 million was paid in
wages; 987 people were employed at the forest level.
In terms of direct economic impacts, over the period 2008 through 2012, average impacts
from USFS activities were (1) earnings – $77.9 million; and (2) jobs – 1,365. Total economic
impacts were (1) earnings – $108.9 million; (2) jobs – 2,384; and (3) GSP – $64.5 million.
Fiscal impacts (taxes) for this period averaged (1) State – $7.28 million; (2) local – $681,910.
- 9 -

B. Revenue-Sharing: PILT and SRS
There are two federal programs that provide funding for public education which are
based upon federal ownership.
1. Payments in Lieu of Taxes (PILT)
PILT are federal payments to counties and may be used for any local government
purpose. PILT payments are based upon the acres of federal land in the county. In 2013, PILT
payments totaled $35.4 million. Some 10 percent or $3.2 million of these funds were directed to
local school districts.
2. Secure Rural Schools (SRS)
SRS is an important source of county revenue, but its ongoing funding is not guaranteed
as periodic congressional re-authorization is required. Funding is presently set to expire this
year. SRS payments to Utah counties totaled $11.5 million in 2012 and $10.9 million in 2013.
C. Wildfire
Wildfire is “a significant issue in Utah.” During the period 2003-2012, 2.2 million acres
burned in the State with annual suppression costs averaging $33.4 million. The Utah Division of
Forestry, Fire and State Lands (FFSL) is responsible for wildfire control on approximately 15
million acres of State and private lands, USFS and BLM together are responsible for
approximately 31 million acres.
Adjusted for inflation, total spending on wildfire by BLM, USFS and FFSL,
combined, averaged $83.3 million during the period 2008-2012. Of that total, BLM spent
$40.1 million, USFS, $36.6 million and FFSL $6.6 million. Fire suppression costs were a
portion of the total spending. During 2003-2012, average annual spending by the BLM, USFS
and FFSL totaled $33.4 million. Annual federal wildfire suppression costs averaged $27.6
- 10 -
million; State annual fire suppression costs averaged $5.8 million. See Study, Table 9.12, p. 510.
During 2004-2008, USFS spent 54.7 percent of its fire suppression costs in the West on aircraft
or firefighting services, for which USFS bears a large share. A land transfer could result in
FFSL “losing access to federal aircraft suitable” for fire suppression and could “raise state costs
above current levels.” As of 2014, federal land managers also paid about 80% of Utah’s $2.5
million annual assessment for the services of the National Interagency Coordination Center
(NICC).
During 2008-2012, most wildfire spending ($52.2 million per year, (97.3%)) for
mitigation, preparedness and rehabilitation (non-suppression costs) came from federal agencies.
FFSL contributed $1.4 million annually. Study, p. 513. Non-suppression expenditures by USFS
averaged $2.48/acre; BLM, $1.38/acre; and FFSL, $0.06/acre.
Post transfer, Utah “may require an estimated $25.9 million increase in state funding for
fire suppression for an additional 31.3 million acres of federal lands (Table 9.9)….Furthermore,
for wildfire-related expenses besides suppression, state costs may rise an additional $50.8 million
for a total estimated $76.7 million in new wildfire management costs.” Study, p. 509. This
increase is based on the assumption that the State would continue the same wildfire management
practices currently employed by BLM and the USFS. Id.
The Study suggests some alternatives by which wildfire costs could be reduced or
revenue increased to meet increased costs. Changes in fire suppression approaches and
mitigation could allow for management at lower costs. “[L]and managers can actively manage
forests and rangelands and regulate the wildland-urban-interface to make them less vulnerable to
dangerous fires.” Study, p. 491. Zoning measures “to direct new construction to defensible
areas,” and the requirement that homeowners install fire-safe landscaping and use fire-safe
- 11 -

construction materials, are suggested as strategies for fire prevention and reducing fire
suppression costs. Post-transfer alternatives for aircraft services include, creating a State fleet,
leasing through private contracts, using the National Guard and its equipment, or continuing to
request support through the NICC.
The Study observes that “[s]ustainable management of resources uses such as timber
harvesting and livestock grazing is compatible with healthy vegetation and normal wildfire
activity. Harvesting, prescribed burns and preparedness can reduce the severity and cost of
wildfire.” Study, p. 506. As of 2005, 3.6 million acres of timberland in Utah (77%) had timber
in excess of prescribed USFS forest conditions. Study, p. 526. Removal is recommended for
about 38% of the total volume of timber standing in Utah forests with commercially viable trees.
The Study concludes “[s]uppression and post-fire restoration costs are only part of the true cost
of wildfire. Prospects of property losses, personal harm, environmental degradation, and a
variety of other economic and noneconomic costs from wildfire would make the argument for
prescribed burns and mechanical treatments more compelling.” Study, p. 531-532.
D. Recreation and Quality of Life
The Study contains a review of data regarding the importance of recreation activities to
the Utah economy (Chapter 7), Study, pp. 257-289; and information from a comprehensive
survey of research literature and a 2007 statewide survey of Utah residents conducted by Utah
State University (2007 State Survey) regarding certain “quality of life” issues (Chapter 11).
Study, pp. 547-590. Among other things, the Study concludes, “Outdoor recreation is part of
Utah’s culture and heritage, and preserving such opportunities enhances the quality of life for
residents and visitors ….The State values preserving its natural surroundings, and recognizes that
the natural environment and the abundance and diversity of outdoor activities contribute to the
- 12 -

Utah economy." Study, p. 257. Further, Utahans overwhelmingly agree that public lands are
important in defining the culture and heritage of their communities, and in providing areas where
they can pursue the activities they enjoy most. Another section of the Study notes that access to
roads and trails on the public lands is important for many recreation activities. The Study
concludes that “access to roads and trails would increase following land transfer . . . the state
would likely be more permissive than federal land managers in this regard.” Id.
Chapters 7.1 and 7.2 discuss recreation, in general, and wildlife-related recreation
(hunting, fishing, and wildlife watching), in particular. According to the Study, “[T]he total
benefit of recreation and travel in Utah is approximately $16.9 billion; this consists of consumer
spending of $9.8 billion, and an overall net benefit to Utah residents of approximately $7.1
billion.” Study, p. 276. The U.S. Fish and Wildlife Service (USFWS) estimates that more than 1
million people, aged 16 and older, participated in wildlife-related recreation in Utah during 2011.
Study, p. 277. “Expenditures by resident and nonresident hunters, fishers and wildlife viewers
supported 11,815 jobs with $340.6 in earnings and contributed $657.2 million to gross state
product in 2011.” Study, p. 289; See also Table 7.19, p. 289. Improved access that might be
provided by the State is also important for wildlife recreation. “Post-transfer , the state could re-
evaluate access by hunters, anglers and DWR personnel to transferred lands, particularly WSAs
and those not well served by approved travel plans.” Study, pp. 108, 113. The Study uses
nonmarket valuation methods to measure recreational and environmental values. “[V]aluation of
environmental quality demonstrates that the environment provides utility to individuals in much
the same way as market goods and services.” Study, p. 261. Additionally, “[t]he opportunity to
recreate and have access to lands is important even if the opportunity is not realized.” Study, p.
xxix.
- 13 -
In Chapter 11, the Study examines existing literature and a 2007 Statewide Survey and
discusses possible linkages between the presence of public lands and the associated natural
resources, and “quality of life” for those living in those areas. Study, pp. 547-548. “Overall, a
substantial majority of residents living in Utah and surrounding western states consider public
lands important to their quality of life, and to the economies of their communities.” Study, p.
547. The 2007 State Survey demonstrated the importance of public lands to Utahans with the
level of protection or the existence of public lands revealing little variation in the responses or in
the views of residents about the importance of protected-status lands or public lands to their
quality of life or activities on public lands. Residents living in counties with the highest
protected land status were most likely to consider public land commodity production/resource
utilization activities (public land livestock grazing; development of energy resources such as oil,
gas, coal or uranium; development of sand, gravel and minerals industries used in construction;
use of water resources for crop and pasture irrigation; and timber production) to be highly
important to local quality of life. Study, pp. 567-570. The importance of opportunities to engage
in hunting, fishing and off-road vehicle/snowmobile activities received a nearly equal response
from residents of counties with the highest amounts of protected land and those with the lowest
amount of protected land. Both rated the opportunities as “highly important to local quality of
life.” Study, pp. 570-572. The importance of habitat, biodiversity protection, and non-motorized
recreational uses was highest in counties with low levels of protected land status and lowest in
counties with the highest or lowest protected acreage categories, particularly with regard to lands
managed by the BLM. Study, pp. 572-575.
- 14 -
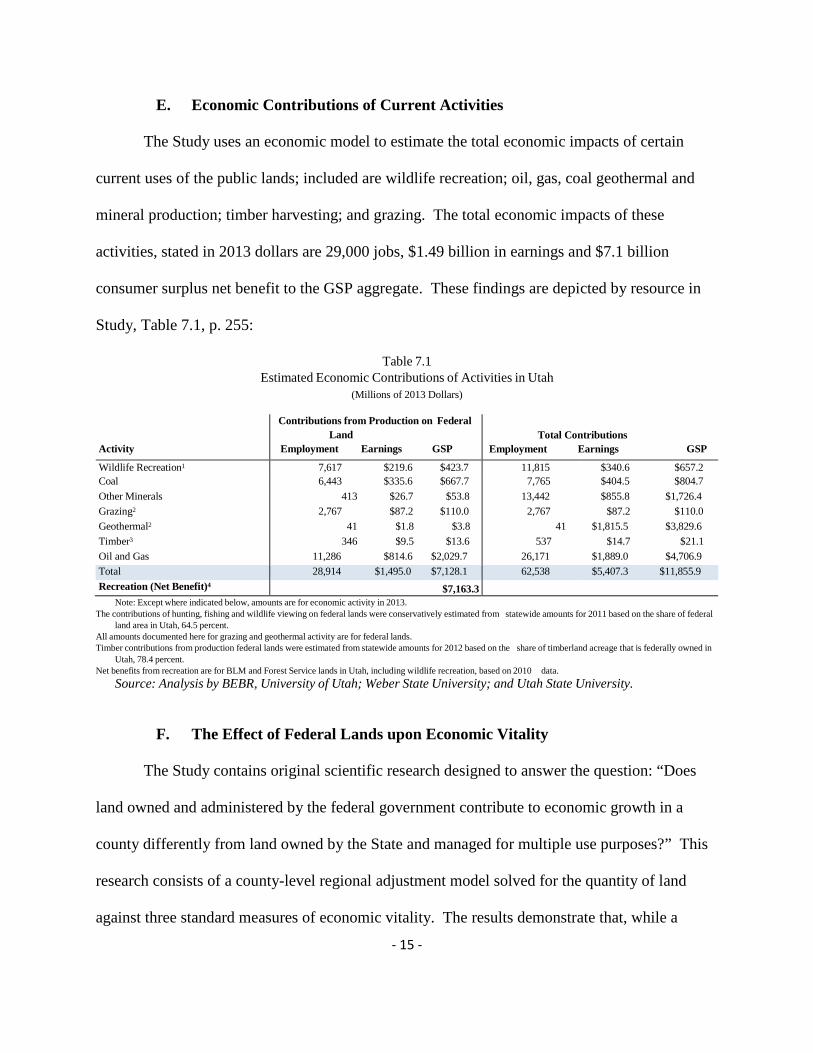
E. Economic Contributions of Current Activities
The Study uses an economic model to estimate the total economic impacts of certain
current uses of the public lands; included are wildlife recreation; oil, gas, coal geothermal and
mineral production; timber harvesting; and grazing. The total economic impacts of these
activities, stated in 2013 dollars are 29,000 jobs, $1.49 billion in earnings and $7.1 billion
consumer surplus net benefit to the GSP aggregate. These findings are depicted by resource in
Study, Table 7.1, p. 255:
Table 7.1 Estimated Economic Contributions of Activities in Utah
(Millions of 2013 Dollars) Activity
Contributions from Production on Federal Land
Employment Earnings GSP
Total Contributions
Employment Earnings
GSP
Wildlife Recreation1 7,617 $219.6 $423.7 11,815 $340.6 $657.2 Coal 6,443 $335.6 $667.7 7,765 $404.5 $804.7 Other Minerals 413 $26.7 $53.8 13,442 $855.8 $1,726.4 Grazing2 2,767 $87.2 $110.0 2,767 $87.2 $110.0 Geothermal2 41 $1.8 $3.8 41 $1,815.5 $3,829.6 Timber3 346 $9.5 $13.6 537 $14.7 $21.1 Oil and Gas 11,286 $814.6 $2,029.7 26,171 $1,889.0 $4,706.9 Total 28,914 $1,495.0 $7,128.1 62,538 $5,407.3 $11,855.9 Recreation (Net Benefit)4 $7,163.3
Note: Except where indicated below, amounts are for economic activity in 2013. The contributions of hunting, fishing and wildlife viewing on federal lands were conservatively estimated from statewide amounts for 2011 based on the share of federal
land area in Utah, 64.5 percent. All amounts documented here for grazing and geothermal activity are for federal lands. Timber contributions from production federal lands were estimated from statewide amounts for 2012 based on the share of timberland acreage that is federally owned in
Utah, 78.4 percent. Net benefits from recreation are for BLM and Forest Service lands in Utah, including wildlife recreation, based on 2010 data.
Source: Analysis by BEBR, University of Utah; Weber State University; and Utah State University.
F. The Effect of Federal Lands upon Economic Vitality
The Study contains original scientific research designed to answer the question: “Does
land owned and administered by the federal government contribute to economic growth in a
county differently from land owned by the State and managed for multiple use purposes?” This
research consists of a county-level regional adjustment model solved for the quantity of land
against three standard measures of economic vitality. The results demonstrate that, while a
- 15 -
certain amount of federal land provides for positive measures of these indicators, once the
amount of land exceeds a modeled amount, the indicators become negative, and economic
growth slows. The research study notes that this phenomenon must be balanced against “quality
of life” measurements.
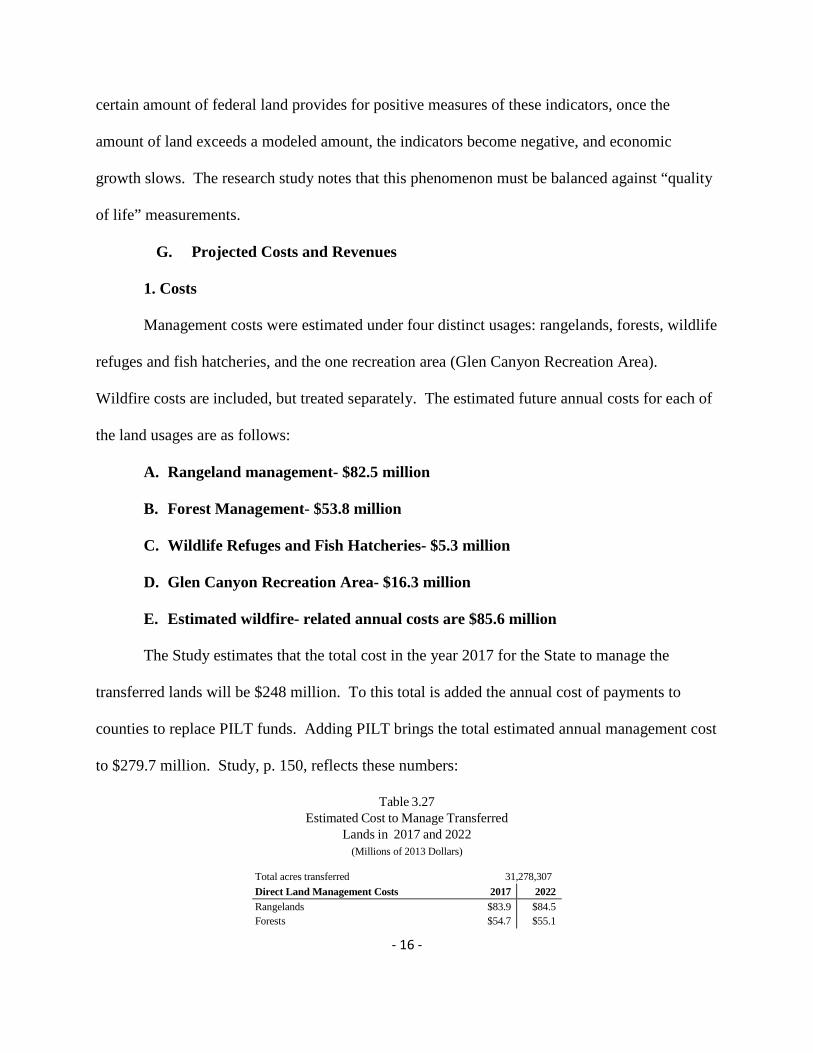
G. Projected Costs and Revenues
1. Costs
Management costs were estimated under four distinct usages: rangelands, forests, wildlife
refuges and fish hatcheries, and the one recreation area (Glen Canyon Recreation Area).
Wildfire costs are included, but treated separately. The estimated future annual costs for each of
the land usages are as follows:
A. Rangeland management- $82.5 million
B. Forest Management- $53.8 million
C. Wildlife Refuges and Fish Hatcheries- $5.3 million
D. Glen Canyon Recreation Area- $16.3 million
E. Estimated wildfire- related annual costs are $85.6 million
The Study estimates that the total cost in the year 2017 for the State to manage the
transferred lands will be $248 million. To this total is added the annual cost of payments to
counties to replace PILT funds. Adding PILT brings the total estimated annual management cost
to $279.7 million. Study, p. 150, reflects these numbers:
Table 3.27 Estimated Cost to Manage Transferred
Lands in 2017 and 2022 (Millions of 2013 Dollars)
Total acres transferred 31,278,307 Direct Land Management Costs 2017 2022 Rangelands $83.9 $84.5 Forests $54.7 $55.1
- 16 -

Refuges and Hatcheries $5.4 $5.5 Glen Canyon National Recreation Area $16.6 $16.8 Wildfire Management Costs $87.4 $88.1 Grand Total Land Management $248.0 $250.0 Federal PILT $31.7 $29.3 Total with Land Management, Wildfire
Management, and Federal PILT $279.7 $279.3
Source: BEBR analysis.
Table 3.27 also shows the total cost estimate in the year 2022 to be $279.3 million
indicating that, at least in the first five years, the costs will remain flat. For purposes of
comparisons to revenues, $280 million in 2013 dollars is used.
2. Revenues
In projecting revenues from the transferred lands, the Study starts with 2013 revenues
from existing sources (potential sources of revenue that remain speculative such as oil shale, tar
sands, wind and solar are not included in the revenue analysis). Table 3.2 below, Study, p. 125,
shows these sources and their respective 2013 revenues, which total $331,665,567 in current
dollars.
Table 3.2 Total Land-Based Revenue in FY2013
(Current Dollars)
Source Amount Mineral Lease Revenues $308,021,015
Oil and Gas Royalties $256,968,418 Coal Royalties All other mineral lease revenue
$35,641,043 $15,411,554
Bureau of Land Management $15,655,835 Rights-of-Way rents $9,413.503 Recreation fees $3,351,225 Grazing fees $1,012,285 All other revenue $1,878,822
U.S. Forest Service $7,988,717 Recreation fees and permits $4,114,156 Power project rights-of-way rents $1,265,355 All other revenue $2,609,206
Total $331,665,567 Source: U.S. Department of the Interior, Office of Natural Resources Revenue; U.S. Department of the Interior; U.S. Forest Service; Bureau of Land Management; Bureau of Reclamation; Utah Department of Natural Resources, Division of Oil, G d M
- 17 -

Using predictive economic models, the Study then projects estimated revenues from the
sources over an extended period of years using constant (2013) dollars and various assumptions
to demonstrate what revenues from the transferred lands can be expected to flow to State and
local governments to offset $280 million per year in costs.
1. Oil and Gas Production
Revenues from oil and gas production on the transferred lands constitute some 77.5
percent of total revenues. Ten different scenarios using two price estimates and a combination of
three different revenue-related influences are modeled to show revenues over the period from
2017 to 2027.
The two prices modeled are a most likely “Reference Price” (based on long-term
forecasts published by the Energy Information Administration) that assumes an average price for
oil at $92 per barrel, and for gas an average price of $5.1 per thousand cubic feet, and “Low
Price” scenario that assumes an average price for oil at $62 per barrel and an average price for
gas of $3.3 per thousand cubic feet. The “Low Price” levels are based upon government
information “as a ‘what if’ scenario . . . ” to “reveal the sensitivity of oil and gas production and
revenue forecasts to future energy prices, a factor over which the state has little control.” Study,
p. 600.
For each of the two price scenarios, a baseline forecast and four additional forecasts are
presented in the Study showing different assumptions as to royalty rate, division of royalties and
the number of new wells that might be drilled according to current federal government
information. Summary Table 1, Study, p. xxviii, sets forth the results of this modeling showing
the revenue projections for the 10 scenarios for the years 2017 through 2035:
- 18 -

Summary Table 1 Oil and Gas Royalties and Tax Revenues
(Millions of Constant 2013 Dollars) Estimated Land Management Costs in 2017: $280 million
Reference Price Forecast Oil:
Average $92 per barrel Gas: Average $5.10 per thousand cubic feet
Low Price Forecast Oil: Average $62 per barrel
Gas: Average $3.30 per thousand cubic feet
Year Baseline
Forecast 1 Forecast
2 Forecast
3 Forecast
4 Forecast
5 Baseline
Forecast 6 Forecast
7 Forecast
8 Forecast
9 Forecast
10 2017 $226.8 $235.1 $245.4 $389.2 $422.0 $202.7 $210.7 $219.4 $346.8 $377.6 2018 $234.7 $256.3 $270.7 $405.5 $440.9 $200.4 $219.3 $230.5 $345.9 $378.2 2019 $237.2 $270.4 $287.5 $413.4 $450.3 $198.1 $225.4 $238.8 $343.7 $375.5 2020 $245.6 $290.3 $311.1 $430.7 $468.9 $195.4 $229.0 $244.2 $340.7 $371.9 2021 $262.3 $320.2 $345.6 $462.5 $501.7 $192.2 $231.7. $248.3 $336.7 $366.5 2022 $279.4 $351.2 $381.8 $495.4 $535.6 $189.0 $231.4 $249.5 $331.9 $361.2 2023 $298.3 $385.7 $421.2 $532.0 $575.0 $185.5 $230.2 $248.8 $326.6 $355.8 2024 $318.8 $422.8 $463.2 $570.8 $617.7 $182.0 $227.4 $246.4 $321.3 $349.5 2025 $342.7 $459.5 $505.9 $616.2 $659.9 $177.9 $224.7 $243.5 $314.4 $342.7 2026 $365.0 $497.4 $547.4 $659.4 $712.4 $173.2 $221.0 $239.9 $307.2 $336.1 2027 $390.6 $537.0 $595.3 $708.5 $763.3 $169.1 $217.0 $236.1 $300.0 $329.6
Note: Revenue includes royalties, severance taxes and sales tax. Assumptions used in these forecasts: Forecasts 2 and 7—Oil and gas royalties remain at 12.5 percent, new wells are drilled at historic levels, the state receives 50 percent of all royalties on production from existing wells (wells that were in production prior to the transfer) and 100 percent of the royalties from production on new wells (wells that are drilled after the transfer). Forecasts 3 and 8—Oil and gas royalties remain at 12.5 percent; the number of new wells drilled increases 15 percent over the baseline estimate; the state receives 50 percent of the royalties on existing wells and 100 percent of the royalties on new wells. Forecasts 4 and 9—Oil and gas royalties remain at 12.5 percent; the number of new wells drilled increases 15 percent over the baseline estimate; the state receives 100 percent of the royalties on existing wells and new wells. Forecasts 5 and 10—Oil and gas royalties increase to 16.7 percent on new wells; the number of new wells drilled is 15 percent more than the baseline estimate; and Utah receives 100 percent of the royalties on production from all wells.
What is clear from these forecasts is that it is important for the State to receive 100
percent of the royalties on wells drilled post-transfer. If it does, oil and gas revenues alone will
offset $280 million in total costs associated with the transfer after 3 years. If the State receives
100 percent of the royalties on both existing and new wells, and increases new drilling by just 15
percent, State oil and gas revenues start at $389.2 million in 2017 and climb to 1.15 billion by
2035. Revenues would be even higher if the royalty rate was increased to 16.7 percent on new
leases.
2. Coal Production
In determining projected coal revenues, the Study modeled three coal scenarios provided
by the Utah Geological Survey (UGS). Under all three scenarios the UGS assumed a steady
depletion of the resource in existing mines. Increases in production would come from new - 19 -

mines. The most optimistic scenario assumes State control of the Grand Staircase-Escalante
National Monument and the development of this resource in some manner.
The revenue impacts of coal production under the three scenarios are summarized in
Study, Table 3.15, p. 141:
Table 3.15 Utah Coal Production Scenarios, 2017–2015
(Coal in Millions of Tons, Millions of Constant 2013 Dollars)
Year
Low Scenario Coal State Taxable
Production Royalties Investments
State Total
Middle Scenario Coal State Taxable
Production Royalties Investments
State Total
High Scenario Coal State Taxable
Production Royalties Investments
State Total
2017 16.4 $49.0 $1.54 $50.6 16.4 $49.0 $43.3 $50.6 16.4 $49.0 $1.54 $50.6 2018 15.3 $46.0 $1.46 $47.5 15.8 $46.0 $41.8 $47.5 15.8 $46.0 $1.51 $47.5 2019 11.5 $36.6 $1.12 $37.8 15.2 $42.0 $39.8 $43.5 16.7 $43.6 $1.62 $45.3 2020 10.8 $35.1 $1.07 $36.2 16.2 $43.3 $41.3 $44.9 20.2 $50.1 $2.01 $52.2 2021 10.4 $34.1 $1.04 $35.2 16.4 $44.5 $41.1 $46.1 21.4 $51.4 $2.15 $53.5 2022 10.0 $33.5 $1.03 $34.5 16.5 $45.8 $41.3 $47.5 22.0 $54.6 $2.26 $56.8 2023 10.0 $34.2 $1.05 $35.3 17.5 $50.4 $43.6 $52.2 25.1 $67.0 $2.63 $69.6 2024 8.0 $27.5 $0.85 $28.4 15.5 $44.1 $39.7 $45.7 25.5 $69.7 $2.73 $72.5 2025 8.0 $28.1 $0.87 $29.0 15.5 $45.0 $39.6 $46.7 25.7 $72.0 $2.81 $74.8 2026 8.0 $28.5 $0.88 $29.3 15.5 $45.5 $39.5 $47.2 25.7 $72.8 $2.84 $75.7 2027 6.5 $22.9 $0.72 $23.7 10.5 $32.5 $27.9 $33.7 23.7 $69.6 $2.64 $72.2 2028 6.5 $23.0 $0.73 $23.8 10.5 $32.6 $26.3 $33.8 23.7 $69.9 $2.65 $72.5 2029 6.5 $23.5 $0.74 $24.3 10.0 $31.3 $24.7 $32.5 23.2 $69.4 $2.65 $72.0 2030 6.5 $23.8 $0.75 $24.5 10.0 $31.7 $24.6 $32.9 23.2 $70.2 $2.68 $72.8 2031 6.5 $24.3 $0.77 $25.0 10.0 $32.4 $25.2 $33.5 24.2 $45.6 $2.85 $78.5 2032 7.0 $24.5 $0.83 $25.3 10.0 $30.6 $25.9 $31.8 25.2 $78.4 $2.99 $81.4 2033 5.0 $16.5 $0.60 $17.1 9.0 $28.8 $24.2 $29.9 24.7 $79.1 $2.96 $82.1 2034 5.0 $16.5 $0.60 $17.2 9.0 $29.0 $24.6 $30.0 24.2 $77.4 $2.91 $80.3 2035 5.0 $16.7 $0.61 $17.4 9.0 $29.3 $25.3 $30.4 23.2 $74.1 $2.83 $76.9
Source: BEBR analysis.
3. Combined Oil, Gas, and Coal
The Study combines oil, gas, and coal revenue projections in Study, Table 3.16, p. 141,
showing combined revenues for the years 2017 through 2035:
- 20 -

Table 3.16 Summary of Oil and Gas Forecasts and Coal Projections
(Millions of Constant 2013 Dollars)
Reference Price Oil & Gas Forecasts Low Price Oil & Gas Forecasts Coal Projections Year Forecast 2 Forecast 3 Forecast 4 Forecast 6 Forecast 7 Forecast 8 Low Middle High 2017 $273.8 $289.5 $422.0 $243.5 $257.4 $377.6 $50.6 $50.6 $50.6 2018 $291.5 $310.2 $440.9 $246.8 $263.5 $378.2 $47.5 $47.5 $47.5 2019 $301.8 $324.6 $450.3 $249.2 $267.3 $375.5 $37.8 $43.5 $45.3 2020 $319.5 $345.7 $468.9 $250.0 $269.5 $371.9 $36.2 $44.9 $52.2 2021 $348.0 $378.1 $501.7 $249.1 $269.7 $366.5 $35.2 $46.1 $53.5 2022 $377.8 $412.3 $535.6 $248.0 $268.9 $361.2 $34.5 $47.5 $56.8 2023 $410.4 $449.9 $575.0 $245.6 $267.0 $355.8 $35.3 $52.2 $69.6 2024 $445.5 $489.6 $617.7 $243.1 $264.8 $349.5 $28.4 $45.7 $72.5 2025 $486.3 $535.9 $659.9 $239.4 $260.8 $342.7 $29.0 $46.7 $74.8 2026 $524.7 $580.0 $712.4 $234.4 $256.3 $336.1 $29.3 $47.2 $75.7 2027 $568.1 $629.8 $763.3 $230.2 $251.5 $329.6 $23.7 $33.7 $72.2 2028 $614.8 $683.2 $814.4 $224.8 $245.7 $322.1 $23.8 $33.8 $72.5 2029 $667.7 $741.6 $872.4 $219.4 $240.3 $312.8 $24.3 $32.5 $72.0 2030 $720.5 $803.4 $937.7 $214.2 $234.3 $303.5 $24.5 $32.9 $72.8 2031 $780.0 $870.8 $1,002.9 $208.4 $228.3 $294.6 $25.0 $33.5 $78.5 2032 $845.5 $947.3 $1,078.1 $202.2 $221.4 $285.9 $25.3 $31.8 $81.4 2033 $911.3 $1,021.9 $1,159.5 $195.8 $214.7 $276.8 $17.1 $29.9 $82.1 2034 $979.5 $1,102.1 $1,241.8 $188.7 $207.4 $267.6 $17.2 $30.0 $80.3 2035 $1,065.3 $1,196.4 $1,334.4 $181.9 $199.7 $258.8 $17.4 $30.4 $76.9 Source: BEBR analysis.
4. Other Revenue Sources
In addition to oil, gas and coal royalties, there are other revenues that are presently
collected by BLM and USFS including bonus payments and rents on oil, gas and coal leases and
royalties, bonuses and rents on other extractive minerals. The Study sets forth the amounts of
these mineral lease revenues for the years 2009 through 2013 in Study, Table 3.17, p. 142:
- 21 -

Table 3.17 Mineral Lease Revenue, Except Oil, Gas and Coal
Royalties, FY2003–FY2013
(Constant 2013 Dollars)
Fiscal Year
Royalties
Lease Bonus Payments
Rent Payments
Other Payments
Total Payments
2009 $2,610,348 $10,727,316 $6,279,405 $1,966 $19,619,035 2010 $2,095,600 $12,382,941 $6,254,371 $31,091 $20,764,003 2011 $3,410,483 $21,851,698 $5,795,752 $35,593 $31,093,525 2012 $3,745,145 $51,353,266 $5,163,293 $22,730 $60,284,433 2013 $6,592,593 $6,182,972 $3,748,601 $57,968 $13,582,133
Mean $3,690,833 $20,499,639 $5,448,284 $29,869 $29,068,626 Source: U.S. Department of the Interior, Office of Natural Resources Revenue, statistics.onrr.gov/ReportTool.aspx.
V. COUNTY GOVERNMENT FEEDBACK
The Study presents the feedback received by BEBR in response to a survey distributed to
county officials and political leaders in all 29 Utah counties. The purpose of the survey was to
identify the prevailing sentiments regarding current land allocation and management, problems
with federal land authorities, priorities and concerns regarding transfer to State management and
potential economic effects of the land transfer. In order of priority, the aggregate responses were
as follows:
A. Priorities
Keeping public lands open and available to the public 1.
Mixed-use land management 2.
More local authority in public land management 3.
Return of the timber industry 4.
Healthy forest management practices 5.
Rural road and ATV trail expansion and maintenance 6.
- 22 -

B. Concerns
Lack of defined management plan and organizational structure 1.
Funding for new management and responsibilities 2.
Loss of federal revenues 3.
Cost-benefit structure of public land management 4.
VI. FREQUENTLY ASKED QUESTIONS
A. Can the State afford it?
The Study shows that the State can afford to take over the management of the public
lands assuming that 100 percent of future oil, gas and coal revenues from the lands are received
by the State
B. What about wildfire costs?
Even though wildfire costs are projected to remain significant ($80 million per year),
projected revenue would more than offset these costs.
C. Would the State have to sell lands?
The Study does not contemplate the sale of any transferred lands. In fact, it would not be
in the State’s economic interest to do so.
D. Would recreational, hunting or fishing access be lost?
Access would be maintained or enhanced under State ownership as the State and counties
would be able to enforce their existing Transportation Plans. Again, these lands will remain
public lands and the State and counties will be able to insure continued access.
E. Would all of the lands be developed?
- 23 -
The Study makes clear that both recreation and quality of life issues are of great
importance to the State, its citizens and its visitors, both economically and otherwise. These
factors must play a significant role in balancing future decisions concerning development
potential and the need for conservation and proper stewardship of the lands.
F. What about federal funds that are presently paid to counties?
The Study assumes in its projected costs that counties would be made whole and that
revenue-sharing monies, that is, PILT and SRS, would be fully replaced.
G. What about Wilderness Study Areas?
Under the recently enacted Utah Wilderness Act (H.B. 160 2014 General Session),
transferred lands that are suitable for wilderness or are otherwise deserving of protection will be
reviewed for wilderness designation and preservation.
H. How will this help public education?
Using the “Reference Price” revenue projections in the Study, the State will receive
substantial revenues in excess of costs. These additional revenues can be applied, in part, to
increase funding for education. In addition, it is expected that SITLA revenues will be
substantially increased due to the fact that most SITLA lands will no longer be isolated parcels
and, therefore, will become more susceptible to revenue enhancement.
I. Does the Study advocate one use over others?
The Study recognizes that all present uses, and some projected uses, within a multiple use
framework have value, whether market-based or not. The key is to find the proper balance.
J. Who is going to manage the lands?
This determination will be made by the Legislature, in consultation with the Governor,
concerning the proper allocation of management among the State and local governments.
- 24 -

Existing State agencies may be able to assume much of the responsibility, but new authorities
may need to be considered for certain resource management (such as mining and recreation)
which the federal government currently performs.
K. What role will local governments play?
Among the concerns that have driven the transfer of lands effort has been the lack of
local input. It is up to the Legislature, in consultation with the Governor, to determine the
appropriate level of involvement of local government in the management of the lands including,
for example, roads, law enforcement and planning.
VII. FUTURE CONSIDERATIONS
PLPCO recommends the Utah Legislature continue its efforts to conclude a transfer of
federal lands to the State. The State is fully capable of managing the lands, and the Study has
demonstrated that the State will have the financial resources to fully carry-out its stewardship
responsibilities. However, these responsibilities are many and varied, and changes will not
happen overnight. In order to further set the stage, PLPCO recommends the Legislature may
wish to consider the following:
Consider various options for management authority over the many and varied 1.
resources and responsibilities found upon the lands. A role for local government in some
management issues should be evaluated.
Consider a management structure for resources which are most appropriately 2.
managed at the State level. Determine which existing State agencies should assume
management of certain resources or lands, what modifications to agency authority or
responsibilities would be required, and whether a new agency or agencies might be
necessary.
- 25 -

Determine what is to be the “mission” of the relevant local or State agencies with 3.
respect to the lands or resources given to each to manage. Consider, among others, the
concepts of multiple-use, public trust, revenue optimization (SITLA model),
conservation, stewardship and priority zone concepts as beginning points.
Establish a process and framework for the transition from federal management to 4.
State management, including a realistic timetable for this transition.
Consider the creation of a State transition office to manage and focus all facets of 5.
the land transfer and related efforts.
Determine how best to staff the agencies given the assigned management 6.
responsibilities, including the possibility of the movement of federal employees to State
or local employment.
Identify additional infrastructure necessary to carry out projected resource 7.
development, such as timber mills. Consider industry inducements through existing
agencies such as the Governor’s Office of Economic Development.
Consider additional authority necessary to promote the restoration and 8.
rehabilitation of rangelands and forest lands.
Examine ways in which wildfire suppression costs can be reduced through 9.
operational efficiencies, or through prevention measures, particularly in the areas of
wildland-urban-interface.
Consider the creation or enhancement of a rational system for balancing of the 10.
social, economic and environmental effects resulting from land and resource decisions.
Consider the connection between this process and the management priorities set for the
- 26 -

lands (item 3 above), and consider the authority and standards for judicial review of land
management decisions.
Establish a mechanism to allow local government to share in revenue derived 11.
from both the consumer surplus and direct economic value created by commercial and
non-commercial outdoor recreation activities.
Clarify State and local control over the maintenance of existing roads, as set out 12.
in approved transportation plans. Determine the proper authority for the creation and
eventual reclamation or enhancement of new roads, particularly those involved in the
recreational and resource development industries.
Determine the best division of authority concerning law enforcement between 13.
federal, State and local governments.
Determine disposition of other assets which currently may be appurtenant to the 14.
lands, or in support of operations to manage the lands, such as buildings.
VIII. CONCLUSION
The Study is an optimistic, yet cautionary, examination of the transfer of public lands to
State ownership and management. It is thorough, detailed, exhaustively researched, realistic and
scrupulously objective. It identifies both opportunities and challenges. It is an essential tool that
gives decision-makers the information needed to fully understand the economic impacts and
potential of a transfer of the public lands. It fully meets the objectives of H.B. 142 and provides
firm economic guidance to those who will decide how best to structure and implement the
transfer and management of these varied lands. The complexities and magnitude of the task are
evident from the Study’s detailed examination of the multiple, and often conflicting, present and
- 27 -

potential uses of these lands. Some realities are apparent. The State must maintain, develop
and/or enhance programs that will add to the revenues of State and local governments. It must
do this in a manner that preserves and protects our many areas of scenic wonder and that fully
supports and enhances recreational opportunities and provides for dispersal of resulting
economic benefits over the entire State. The challenge will be finding the proper balance. Such
a balance can, and must, be achieved. The Study provides a pathway.
- 28 -