summary of vital statistics 2013 the city of ... of vital statistics 2013 the city of new york...
TRANSCRIPT

SUMMARY OF VITAL STATISTICS 2013
THE CITY OF NEW YORK
INFANT MORTALITY
BUREAU OF VITAL STATISTICS, NEW YORK CITY DEPARTMENT OF HEALTH AND MENTAL HYGIENE
125 WORTH STREET, CN 7, NEW YORK, NEW YORK, 10013
Infa
nt M
orta
lity
Rate
per
1,00
0 Li
ve B
irth
s
0
20
40
60
80
100
120
140
160
New Historic Low of 4.6 Infant Deaths per 1,000 Live Births, 2013
Pasteurization of Milk, 1912
20131898 1912 1926 1940 1954 1968 1982 1996First Use of Incubators for Premature Infants, Coney Island, 1903-1941
DOH Starts Post-partum Visits, 1908
Introduction of Sulfonamides, 1937
Introduction of Penicillin, 1940’s
Introduction ofRh Factor Leading to Compatible Blood Transfusions, 1940’s
Widespread Availability of Fluid/Electrolyte Replacement Therapy, 1950’s
Introduction of Medicaid, 1965
Technical Advances in Neonatal Medicine, 1970’s
FDA Approval of Artificial Lung Surfactant, 1990
Folic Acid Supplementation During Prenatal Care, 1998

Bill De Blasio, Mayor Mary T. Bassett, MD, MPH, Commissioner
SUMMARY OF VITAL STATISTICS 2013THE CITY OF NEW YORK
INFANT MORTALITY
New York City Department of Health and Mental Hygiene
Division of EpidemiologyCharon Gwynn, PhD, Deputy Commissioner
Bureau of Vital StatisticsGretchen Van Wye, PhD, MA, Assistant Commissioner
Flor Betancourt, MA, Director, Birth and Death Registration UnitKevin Koshar, MPP, Director, Offi ce of Vital Records
Erica Lee, MPH, Acting Director, Quality Improvement UnitWenhui Li, PhD, Director, Statistical Analysis and Reporting Unit
Steven Schwartz, PhD, RegistrarRegina Zimmerman, PhD, MPH, Director, Data Use Unit
January 2015
THIS REPORT WAS PREPARED BY THE DEPARTMENT OF HEALTH AND MENTAL HYGIENE, OFFICE OF VITAL STATISTICS STAFF UNDER THE DIRECTION OF REGINA ZIMMERMAN, PHD, MPH AND WENHUI LI, PHD.
SUGGESTED CITATION: ZIMMERMAN R, LI W, LEE E, LASNER-FRATER L, VAN WYE G, FREEDMAN B, KELLEY D, KENNEDY J, MADURO G, ONG, P, SUN Y. SUMMARY OF VITAL STATISTICS, 2013: INFANT MORTALITY. NEW YORK, NY: NEW YORK CITY DEPARTMENT OF HEALTH AND MENTAL HYGIENE, OFFICE OF VITAL STATISTICS, 2014.
2013 INFANT MORTALITY, MORTALITY, PREGNANCY OUTCOMES, AND EXECUTIVE SUMMARY REPORTS ARE AVAILABLE ONLINE AT HTTP://WWW.NYC.GOV/VITALSTATS.

3
PAGE
INFANT MORTALITY OVERVIEW .....................................................................................................................................4 Figure 1. Infant Mortality Rate, New York City, 2004–2013, United States, 2004–2012 .............................4
DEMOGRAPHIC INDICATORS ......................................................................................................................................5-8 Figure 2. Infant Mortality Rate by Mother’s Age, New York City, 2004–2013 .............................................5 Figure 3. Infant Mortality Rate by Mother’s Racial/Ethnic Group, New York City, 2004–2013 ....................5 Figure 4. Infant Mortality by Mother’s Racial/Ethnic Group and Education, New York City, 2013 ...............5 Figure 5. Infant Mortality Rate by Neighborhood Poverty, New York City Residents, 2004, 2013 ...............6 Figure 6. Average Infant Mortality Rate by Community District of Residence, New York City, 2011–2013 ................................................................................................6 Table 1. Average Infant and Neonatal Mortality Rates by Community District of Residence, New York City, 2009–2013 ................................................................................................7 Table 2. Average Infant Mortality Rate by Mother’s Birthplace, New York City, 2007–2013 ......................8
NEONATAL AND POST-NEONATAL MORTALITY .............................................................................................................8-9 Figure 7. Neonatal and Postneonatal Mortality Rates, New York City, 2004–2013 .....................................8 Figure 8. Leading Causes of Infant Deaths, New York City, 2013 ................................................................9 Figure 9. Leading Causes of Neonatal and Postneonatal Deaths, New York City, 2013 ...............................9 Table 3. Infant Deaths by Cause, Sex, and Age, New York City, 2013 .......................................................9
PRETERM BIRTHS ........................................................................................................................................................10 Figure 10. Live Births by Gestational Age, New York City, 2013 .................................................................10 Figure 11. Infant Mortality Rate among Preterm Live Births, New York City, 2004–2013 ............................10 Figure 12. Infant Mortality Rate among Term Live Births, New York City, 2004–2013 ................................10
MOTHER’S BODY MASS INDEX ...................................................................................................................................11 Figure 13. Live Births by Mother’s Pre-pregnancy Body Mass Index (BMI), New York City, 2011--2013 ......11 Figure 14. Average Infant Mortality Rate by Mother’s Pre-pregnancy Body Mass Index (BMI) and Age, New York City, 2011–2013 ..............................................................................................11 Figure 15. Average Infant Mortality Rate by Mother’s Pre-pregnancy Body Mass Index (BMI) and Racial/Ethnic Group, New York City, 2011–2013 .............................................................11
MOTHER’S CHARACTERISTICS ......................................................................................................................................12 Table 4. Live Births and Infant Mortality Rate by Characteristics of Mother, New York City, 2013 ...........12
INFANT MORTALITY CONTENTS

4
Infant mortality is a key indicator of a population’s overall health and is defi ned as the number of infant deaths occurring within the fi rst year of life per 1,000 live births. To characterize infant mortality in New York City, the Bureau of Vital Statistics links the mother’s demographic data from the child’s birth certifi cate to data from the death certifi cate and confi dential medical report of death. Rates are displayed as three-year rolling averages or as single year depending on the stability of the measure. For technical notes, sample certifi cates, and additional data tables, please see the Bureau of Vital Statistics website at www.nyc.gov/vitalstats.
Select Key Findings:
• The 2013 New York City infant mortality rate reached an historic low of 4.6 infant deaths per 1,000 live births, a 24.6% decline from 6.0 in 2004 and a 2.1% decline from 4.7 in 2012. The Healthy People 2020 goal of 6.0 was met in 2005 (Figure 1).
• In 2012 (the most recent year for which US data are available), the New York City infant mortality rate was 4.7 per 1,000 live births, 27.7% lower than the US rate of 6.0 per 1,000 live births. In 2004, the New York City rate was just 11.3% lower than the US rate (Figure 1).
• Although infant mortality rates have declined among all racial/ethnic groups, disparities persist. In 2013, the infant mortality rate among non-Hispanic blacks was 2.8 times higher than among non-Hispanic whites, down from 3.3 in 2004 indicative of a health disparity reduction. However, these rates will fl uctuate due to small numbers of infant deaths (Figure 3).
• The effect of education on the infant mortality rate varies by racial/ethnic group. Women with more than a high school education consistently have the lowest infant mortality rate. Among mothers with more than a high school education, the infant mortality rate among non-Hispanic black mothers was 3.6 times greater than among non-Hispanic white mothers, at 7.2 infant deaths per 1,000 live births compared to 2.0, respectively. (Figure 4).
• In 2013, infant mortality rates were 1.9 times greater in areas with very high poverty compared to areas with low poverty at 5.2 infant deaths per 1,000 live births and 2.8, respectively (Figure 5).
• The three leading causes of infant death in New York City were prematurity (short gestation and low birth weight) (20.9%), followed by birth defects (congenital malformations/deformations) (20.3%), and cardiovascular disease deaths originating in the perinatal period (11.3%) in 2013. External causes, which include injuries, homicides, and deaths of undetermined intent also accounted for a substantial percentage of these deaths (9.6%) (Figure 9).
• DOHMH continues to address these disparities through its initiatives in the District Public Health Offi ces, Center for Health Equity, and the Bureau of Maternal Infant and Reproductive Health, by targeting the underlying health and social factors that contribute to the disproportionately high infant mortality rates in some areas of the city.
Figure 1. Infant Mortality Rate, New York City, 2004–2013, United States, 2004-2012*
INFANT MORTALITY OVERVIEW
0
1
2
3
4
5
6
7
'13'12'11'10'09'08'07'06'05'04
Year
Infa
nt M
orta
lity
Rate
per
1,00
0 Li
ve B
irth
s
4.6New York City
US6.0
*Latest year available.

5
DEMOGRAPHIC INDICATORSFigure 2. Infant Mortality Rate by Mother’s Age*,
New York City, 2004–2013• In 2013, the infant mortality rate was highest
among infants born to the youngest and oldest mothers (<20 years of age and ≥40 years of age), both at 6.5 infant deaths per 1,000 live births, followed by 4.5 among infants born to mothers 20 to 29 years of age. Mothers 30 to 39 years of age had the lowest infant mortality rate, at 3.6 infant deaths per 1,000 live births.
• Infant mortality rates have decreased among infants born to mothers in all age groups since 2004: 34.3% among mothers ages younger than 20, 28.0% among mothers ages 30 to 39, 18.2% among mothers ages 20 to 29, and 12.2% among mothers ages 40 and older.
Figure 3. Infant Mortality Rate by Mother’s Racial/Ethnic Group, New York City, 2004–2013
• Although infant mortality rates have declined among all racial/ethnic groups, disparities persist. In 2013, the infant mortality rate among non-Hispanic blacks was 2.8 times higher than among non-Hispanic whites, down from 3.3 in 2004 indicative of a health disparity reduction. However, these rates will fl uctuate due to small numbers of infant deaths.
• From 2004 to 2013, the infant mortality rate declined 36.0% among Puerto Ricans. It declined 28.4% among non-Hispanic blacks, 24.4% among Asian and Pacifi c Islanders, 14.3% among non-Hispanic whites, and 4.4% among other Hispanics.
*The fl uctuation in the infant mortality rate among infants born to mothers <20 and ≥40 is likely due to small numbers.
0
2
4
6
8
10
12
Citywide
'13'12'11'10'09'08'07'06'05'04Year
Infa
nt M
orta
lity
Rate
per
1,00
0 Li
ve B
irth
s
6.56.5
4.64.53.6
0
2
4
6
8
10
12
Citywide
Non-Hispanic Black
Non-Hispanic White
Asian & Pacific Islander
Other Hispanic
Puerto Rican
'13'12'11'10'09'08'07'06'05'04
Year
Infa
nt M
orta
lity
Rate
per
1,00
0 Li
ve B
irth
s
8.3
4.84.34.6
3.13.0
Figure 4. Infant Mortality by Mother’s Racial/Ethnic Group and Education, New York City, 2013
• Citywide, the 2013 infant mortality rate was approximately 1.5 times higher among infants born to mothers with less than a high school education, at 5.3 infant deaths per 1,000 live births, compared to mothers with more than a high school education, at 3.5.
• The effect of education on the infant mortality rate varies by racial/ethnic group. Across all racial/ethnic groups, however, women with more than a high school education consistently had the lowest infant mortality rate.0
2
4
6
8
10
12 Less Than High School GraduateHigh School GraduateMore than High School
CitywideNon-Hispanic Black
Non-Hispanic White
Asian & Pacific Islander
Other Hispanic
Puerto Rican
Infa
nt M
orta
lity
Rate
per
1,00
0 Li
ve B
irth
s
6.4
4.34.4
3.2
2.0
3.9 3.63.53.0
3.3
4.34.6
10.2
7.27.8
5.3
3.5
5.1
Mother’s Racial/Ethnic Group

6
DEMOGRAPHIC INDICATORS
• The community districts with the highest average infant mortality rates (2011–2013) were Jamaica/St. Albans at 9.0 infant deaths per 1,000 live births, followed by East Tremont at 8.7, Central Harlem at 8.1, Brownsville at 8.0, and Hunts Point, Williamsbridge, and East New York, each at 7.8.
• The community districts with the lowest average infant mortality rates were the Upper East Side, at 1.0 infant deaths per 1,000 live births, followed by Battery Park/Tribeca at 1.5, Sunset Park at 1.6, Borough Park at 1.8, and Greenwich Village/SOHO at 2.0.
• The average infant mortality rates in the community districts with the 5 highest rates were 4 to 9 times greater than the average infant mortality rates in the community districts with the 5 lowest rates.
Figure 6. Average* Infant Mortality Rate by Community District of Residence and DPHO†,
New York City, 2011–2013
*Due to instability in the infant mortality rates by community district, rates are presented as three-year averages.
Infant Mortality Rate6.6 - 9.05.0 - 6.53.7 - 4.92.7 - 3.61.0 - 2.6DPHO Neighborhood
Parks & Airports
Citywide 3-year average: 4.7
Source: Bureau of Vital Statistics, based on events occurring in 2011-2013.
Figure 5. Infant Mortality Rate by Neighborhood Poverty*, New York City Residents,
2004, 2013 • In 2013, infant mortality rates were 1.9 times
greater in areas with very high poverty compared to areas with low poverty (5.2 infant deaths per 1,000 live births vs. 2.8, respectively). The relative difference in rates will fl uctuate due to small numbers.
• From 2004 to 2013, the infant mortality rate declined in all groups: 42.9% in low poverty areas, followed by 32.3% in high poverty areas, 26.8% in very high poverty areas and 16.3% in medium poverty areas.
*Neighborhood poverty (based on mother’s NYC resident census tract) de-fi ned as percent of residents with incomes below 100% of the Federal Pov-erty Level, per Census 2000 for 2004 data and per American Community Survey 2008-2012 for 2013 data.
0
2
4
6
8
10
12CitywideResidents
Low (<10%)
Medium(10 to <20%)
High (20 to <30%)
Very High
20132004
Infa
nt M
orta
lity
Rate
per
1,00
0 Li
ve B
irth
s
2.8
4.94.2 4.1
4.9
6.2
5.2
7.1
Neighborhood Poverty*
4.6
6.1
†See Technical Notes Community Districts, Boroughs, and District Public Health Offices.

7
DEMOGRAPHIC INDICATORSTable 1. Average* Infant and Neonatal Mortality Rates by Community District of Residence,
New York City, 2009–2013
Infant Neonatal† Infant Neonatal† Infant Neonatal†Mortality Mortality Mortality Mortality Mortality Mortality
Rate Rate Rate Rate Rate RateNEW YORK CITY 4.9 3.3 4.8 3.1 4.7 3.1MANHATTAN 3.9 2.6 3.5 2.2 3.4 2.3
101 Battery Park, Tribeca 1.6 1.3 1.2 1.2 1.5 1.2102 Greenwich Village, SOHO 2.4 2.4 2.4 2.4 2.0 2.0103 Lower East Side 3.4 1.1 2.6 1.3 2.4 1.0104 Chelsea, Clinton 3.3 2.5 2.9 1.4 4.9 3.9105 Midtown Business District 4.0 2.3 5.7 3.4 4.5 2.2106 Murray Hill 3.9 3.1 2.3 1.5 2.1 1.0107 Upper West Side 1.3 0.7 2.2 1.3 2.2 1.6108 Upper East Side 2.5 1.9 1.5 1.1 1.0 0.8109 Manhattanville 4.7 3.2 4.9 3.6 4.7 3.6110 Central Harlem 8.5 6.2 8.4 5.7 8.1 5.7111 East Harlem 6.9 4.5 5.3 3.9 6.0 4.5112 Washington Heights 4.9 2.6 4.2 1.8 3.6 1.7
BRONX 5.9 3.9 5.6 3.7 5.7 3.7201 Mott Haven 6.3 4.1 6.6 4.2 6.6 3.7202 Hunts Point 7.6 4.5 8.7 5.5 7.8 3.7203 Morrisania 7.7 4.8 6.9 3.9 7.7 4.9204 Concourse, Highbridge 4.8 3.3 5.5 3.4 5.5 3.3205 University/Morris Heights 7.3 4.9 6.1 4.4 5.4 3.6206 East Tremont 6.6 3.6 9.0 6.0 8.7 5.9207 Fordham 4.6 3.6 4.3 3.3 3.9 2.9208 Riverdale 5.3 4.5 4.0 2.8 4.1 1.7209 Unionport, Soundview 5.4 3.3 4.2 2.4 4.4 2.7210 Throgs Neck 4.6 3.0 2.4 1.4 3.1 2.1211 Pelham Parkway 6.3 5.1 3.8 3.0 5.0 4.3212 Williamsbridge 6.0 3.4 6.6 4.3 7.8 5.3
BROOKLYN 4.4 2.8 4.2 2.6 3.9 2.5301 Williamsburg, Greenpoint 2.4 1.5 2.4 1.6 2.4 1.4302 Fort Greene, Brooklyn Heights 3.5 2.6 3.4 2.5 2.7 1.9303 Bedford Stuyvesant 7.0 4.0 6.0 3.5 5.0 3.2304 Bushwick 4.4 3.2 4.5 2.7 5.0 2.3305 East New York 8.4 4.5 7.7 4.5 7.8 4.9306 Park Slope 1.9 0.9 2.6 1.3 2.2 1.3307 Sunset Park 2.9 2.0 2.2 1.7 1.6 1.5308 Crown Heights North 4.2 3.1 7.2 3.8 7.1 3.9309 Crown Heights South 4.4 2.6 3.1 1.4 2.8 1.3310 Bay Ridge 4.0 2.5 3.5 2.2 2.5 1.6311 Bensonhurst 4.2 3.1 4.4 2.6 3.9 2.5312 Borough Park 2.8 2.0 2.0 1.4 1.8 1.3313 Coney Island 5.6 3.6 6.3 4.1 5.5 3.6314 Flatbush, Midwood 3.8 2.3 3.9 2.8 4.0 3.3315 Sheepshead Bay 2.1 1.3 2.6 1.1 2.6 1.4316 Brownsville 9.2 5.6 7.4 5.1 8.0 5.2317 East Flatbush 6.8 4.6 7.2 5.1 6.1 4.5318 Canarsie 4.8 3.2 5.2 3.0 5.6 3.5
QUEENS 4.5 2.9 4.8 3.2 4.7 3.2401 Astoria, Long Island City 4.3 2.5 4.7 3.2 4.5 3.3402 Sunnyside, Woodside 2.4 1.9 2.9 2.5 4.6 3.6403 Jackson Heights 3.2 1.7 4.1 2.2 3.3 2.2404 Elmhurst, Corona 4.1 2.9 5.1 3.5 4.9 3.0405 Ridgewood, Glendale 3.7 2.4 3.4 2.4 3.4 2.4406 Rego Park, Forest Hills 2.3 2.1 2.8 2.3 3.0 2.2407 Flushing 2.7 1.5 3.3 2.3 2.9 2.0408 Fresh Meadows, Briarwood 5.1 3.0 4.3 2.7 3.6 2.5409 Woodhaven 3.5 1.2 2.8 1.4 2.7 1.6410 Howard Beach 4.9 2.7 4.6 2.8 5.5 4.2411 Bayside 3.0 3.0 2.4 2.4 2.9 2.4412 Jamaica, St. Albans 8.4 5.2 8.7 5.6 9.0 5.8413 Queens Village 6.4 4.9 7.2 5.6 7.2 5.4414 The Rockaways 7.2 4.8 7.5 5.0 6.5 4.6
STATEN ISLAND 4.8 3.6 5.0 3.9 4.7 3.1501 Port Richmond 5.5 3.9 6.0 4.2 6.1 3.6502 Willowbrook, South Beach 4.5 3.8 5.1 4.6 4.2 3.3503 Tottenville 3.6 2.7 3.3 2.6 2.9 2.0
*Due to instability in the infant mortality rates by community district, rates are presented in rolling three-year averages.†Neonatal infants are those less than 28 days old.
Community District
2009–2011* 2010–2012* 2011–2013*
8
DEMOGRAPHIC INDICATORS
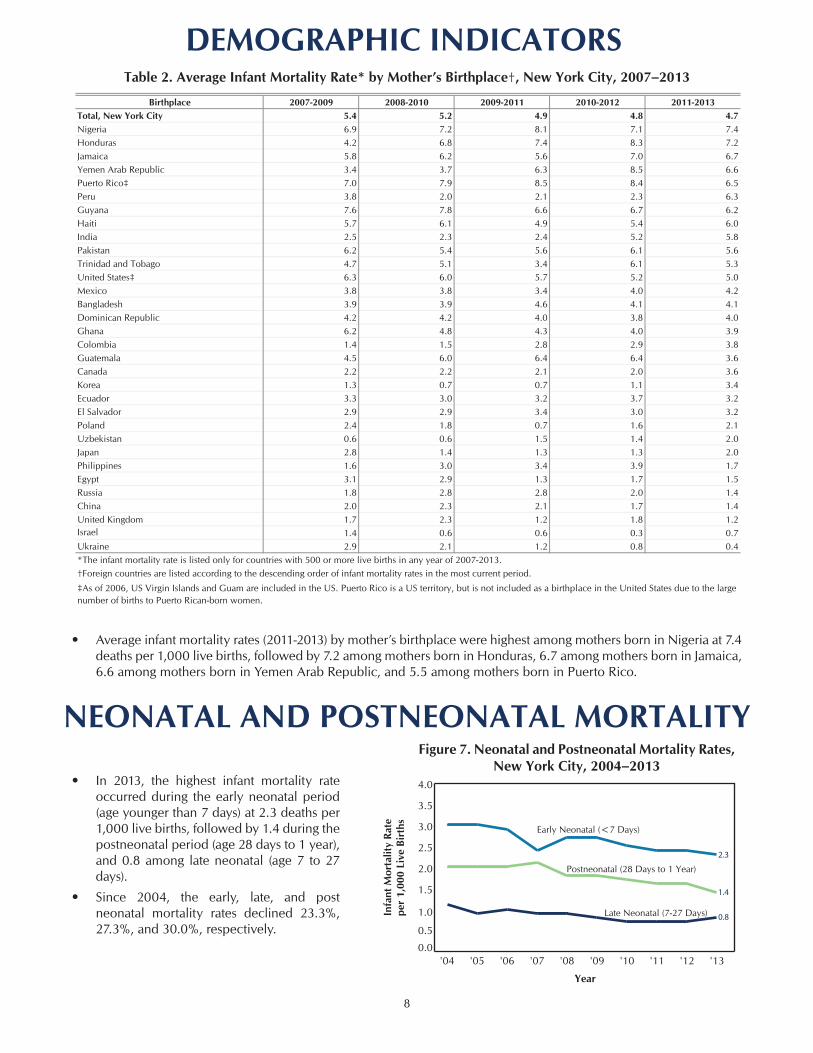
Figure 7. Neonatal and Postneonatal Mortality Rates, New York City, 2004–2013
NEONATAL AND POSTNEONATAL MORTALITY
Table 2. Average Infant Mortality Rate* by Mother’s Birthplace†, New York City, 2007–2013
• Average infant mortality rates (2011-2013) by mother’s birthplace were highest among mothers born in Nigeria at 7.4 deaths per 1,000 live births, followed by 7.2 among mothers born in Honduras, 6.7 among mothers born in Jamaica, 6.6 among mothers born in Yemen Arab Republic, and 5.5 among mothers born in Puerto Rico.
0.0
0.5
1.0
1.5
2.0
2.5
3.0
3.5
4.0
Postneonatal (28 Days to 1 Year)
Late Neonatal (7-27 Days)
Early Neonatal (<7 Days)
'13'12'11'10'09'08'07'06'05'04
Year
Infa
nt M
orta
lity
Rate
per
1,00
0 Li
ve B
irth
s
2.3
1.4
0.8
• In 2013, the highest infant mortality rate occurred during the early neonatal period (age younger than 7 days) at 2.3 deaths per 1,000 live births, followed by 1.4 during the postneonatal period (age 28 days to 1 year), and 0.8 among late neonatal (age 7 to 27 days).
• Since 2004, the early, late, and post neonatal mortality rates declined 23.3%, 27.3%, and 30.0%, respectively.
Birthplace 2007-2009 2008-2010 2009-2011 2010-2012 2011-2013Total, New York City 5.4 5.2 4.9 4.8 4.7Nigeria 6.9 7.2 8.1 7.1 7.4Honduras 4.2 6.8 7.4 8.3 7.2Jamaica 5.8 6.2 5.6 7.0 6.7Yemen Arab Republic 3.4 3.7 6.3 8.5 6.6Puerto Rico‡ 7.0 7.9 8.5 8.4 6.5Peru 3.8 2.0 2.1 2.3 6.3Guyana 7.6 7.8 6.6 6.7 6.2Haiti 5.7 6.1 4.9 5.4 6.0India 2.5 2.3 2.4 5.2 5.8Pakistan 6.2 5.4 5.6 6.1 5.6Trinidad and Tobago 4.7 5.1 3.4 6.1 5.3United States‡ 6.3 6.0 5.7 5.2 5.0Mexico 3.8 3.8 3.4 4.0 4.2Bangladesh 3.9 3.9 4.6 4.1 4.1Dominican Republic 4.2 4.2 4.0 3.8 4.0Ghana 6.2 4.8 4.3 4.0 3.9Colombia 1.4 1.5 2.8 2.9 3.8Guatemala 4.5 6.0 6.4 6.4 3.6Canada 2.2 2.2 2.1 2.0 3.6Korea 1.3 0.7 0.7 1.1 3.4Ecuador 3.3 3.0 3.2 3.7 3.2El Salvador 2.9 2.9 3.4 3.0 3.2Poland 2.4 1.8 0.7 1.6 2.1Uzbekistan 0.6 0.6 1.5 1.4 2.0Japan 2.8 1.4 1.3 1.3 2.0Philippines 1.6 3.0 3.4 3.9 1.7Egypt 3.1 2.9 1.3 1.7 1.5Russia 1.8 2.8 2.8 2.0 1.4China 2.0 2.3 2.1 1.7 1.4United Kingdom 1.7 2.3 1.2 1.8 1.2Israel 1.4 0.6 0.6 0.3 0.7Ukraine 2.9 2.1 1.2 0.8 0.4*The infant mortality rate is listed only for countries with 500 or more live births in any year of 2007-2013.†Foreign countries are listed according to the descending order of infant mortality rates in the most current period.
‡As of 2006, US Virgin Islands and Guam are included in the US. Puerto Rico is a US territory, but is not included as a birthplace in the United States due to the large number of births to Puerto Rican-born women.

9
NEONATAL AND POSTNEONATAL MORTALITYFigure 8. Leading Causes of Infant Deaths,
New York City, 2013
Figure 9. Leading Causes of Neonatal and Post-neonatal Deaths, New York City, 2013
• Neonatal deaths (<28 days old) were primarily caused by prematurity (short gestation and low birth weight) (28.1%), followed by birth defects (congenital malformations/ deformations) (19.7%) and cardiovascular disorders originating in the perinatal period (16.2%).
• Postneonatal deaths (28 days to 1 year) were primarily due to external causes (27.0%), followed by birth defects (congenital malformations/ deformations) (21.8%). Prematurity (short gestation and low birth weight) (5.2%) and infl uenza and pneumonia (4.0%) were also among the leading causes of death in the post-neonatal period.
Table 3. Infant Deaths by Cause, Sex, and Age, New York City, 2013
• The three leading causes of infant death in 2013 were prematurity (short gestation and low birth weight) (20.9%), followed by birth defects (congenital malformations/deformations) (20.3%) and cardiovascular disorders originating in the perinatal period (11.3%). External causes, which include injuries, homicides, and deaths of undetermined intent, also contributed to a substantial number of deaths (9.6%).
*External causes of infant death include accidents, assault, events of undeter-mined intent, and complications of medical and surgical care.
TotalNeonatal
(<28 Days)Postneonatal( 28 Days)
Neonatal(<28 Days)
Postneonatal( 28 Days)
Total 551 231 93 146 811 HIV Infection (B20-B24)† 0 - - - -2 Diseases of the Circulatory System (I00-I99)† 4 - 3 1 -3 Influenza and Pneumonia (J10-J18)† 7 - 5 - 24 Newborn Affected by Maternal Complications of Pregnancy (P01)† 7 5 - 2 -5 Newborn Affected by Complications of Placenta, Cord, and Membranes (P02)† 11 10 - 1 -6 Short Gestation and Low Birthweight (P07)† 115 63 3 43 67 Intrauterine Hypoxia and Birth Asphyxia (P20-P21)† 5 2 - 3 -8 Respiratory Distress of Newborn (P22)† 23 15 - 8 -9 Pulmonary Hemorrhage Originating in the Perinatal Period (P26)† 7 4 - 3 -10 Atelectasis (P28.0-P28.1)† 4 - - 1 311 Other Respiratory Conditions Originating in the Perinatal Period (P23-P28)‡ 8 3 1 2 212 Cardiovascular Disorders Originating in the Perinatal Period (P29)‡ 62 38 1 23 -13 Infections Specific to the Perinatal Period (P35-P39)‡ 15 9 2 4 -
Bacterial sepsis of newborn (P36) 10 6 1 3 -14 Neonatal Hemorrhage (P50-P52, P54)† 8 3 - 4 115 Necrotizing Enterocolitis of Newborn (P77)† 7 3 1 3 -16 Remainder of Conditions Originating in the Perinatal Period (Rest of P00-P99) 33 17 2 14 -17 Congenital Malformations, Deformations (Q00-Q99)† 112 48 12 26 26
Congenital malformations of heart (Q20-Q24) 39 15 5 7 1218 Sudden Infant Death Syndrome (R95)† 5 - 2 - 319 All Other Diseases (Rest of A00-R99) 65 7 35 6 1720 External Causes (V01-Y89)‡ 53 4 26 2 21
†Eligible to be ranked as leading causes nationally and in New York City.‡Contains causes not eligible to be ranked as a leading cause nationally but frequent in New York City. Including these groups permits recognition of important causes of infant death.
FemaleMale
Cause of Death (ICD-10 Codes)
0
20
40
60
80
100
Perc
ent o
f Inf
ant B
irth
s
28.1
%
All Other Diseases
Infections Specific to Perinatal Period
19.7
%
Respira-tory
Distress
6.1%
Cardio-vascular Disorders
Birth Defects
Prematurity
16.2
%
3.4%
26.5
%
27.0
%
21.8
%
4.0%5.2%
2.9%
39.1
%
Birth Defects
All Other Diseases
Prematurity
External Causes
Influenza & Pneumonia
SuddenInfantDeath
Syndrome
174 Postneonatal Infant Deaths(>28 days to 1 year)
377 Neonatal Infant Deaths(<28 days)
0
20
40
60
80
100
All Other Diseases
External Causes
Cardiovascular Disorders
Birth Defects
Prematurity
Perc
ent o
f Inf
ant B
irth
s
9.6%
20.3%
11.3%
20.9%
37.9%
551 Infant Deaths

10
Figure 10. Live Births by Gestational Age, New York City, 2013
• The percent of births that are preterm has remained constant over time (data not shown) and continues to be a risk factor for infant mortality.
• In 2013, term births accounted for 91.0% of all New York City births; they decreased 1.7% since 2004 (data not shown).
• Preterm births accounted for 9.0% of 2013 births and decreased 10.9% since 2004 (data not shown).
Figure 11. Infant Mortality Rate among Preterm Live Births, New York City, 2004–2013
• The less than 2% of infants born extremely and very preterm had very high risks for death, with infant mortality rates of 349.9 and 36.2 infant deaths per 1,000 live births, respectively, in 2013. Rates of infant death for early preterm and late preterm births were 15.2 and 6.7, respectively (data not shown), averaging to 8.0 deaths among moderately preterm births.
• Since 2004, infant mortality declined 7.9% among extremely preterm births, 8.7% among very preterm births, and 3.8% among moderately preterm births.
Figure 12. Infant Mortality Rate among Term Live Births*, New York City, 2004–2013
• Among term births in 2013, the infant mortality rate was highest among early term births, at 2.2 deaths per 1,000 live births, followed by 0.8 for full-term births, and lowest among late and postterm births at 0.6.
• Since 2004, the infant mortality rate declined 43.2% among postterm births, 38.4% among full-term births, and 22.0% among early term births.
PRETERM BIRTHS
*Live births for which gestational age was reported in 2013.
*See Technical Notes for revised defi nition of term births.
Full-term(58.3%)
Early Term (23.6%)
ExtremelyPreterm(0.7%) Very Preterm
(0.8%)Late and Postterm(9.2%) Moderately
Preterm(7.5%)
120,457 Live Births*
050
100
150
200
250
300
350
400
450
'13'12'11'10'09'08'07'06'05'04
Year
Infa
nt M
orta
lity
Rate
per
1,00
0 Li
ve B
irth
s 349.9
36.28.0
379.9
39.6.
8.3 Moderately Preterm
Very Preterm
Extremely Preterm
0
1
2
3
4
'13'12'11'10'09'08'07'06'05'04
Year
Infa
nt M
orta
lity
Rate
per
1,00
0 Li
ve B
irth
s
0.6
2.2
0.8
1.3
2.8
1.1
Late and Postterm
Full-term
Early Term
Preterm <37 weeks Extremely preterm <28 weeks Very preterm 28 weeks <32 Moderately preterm 32 weeks <37
Early preterm 32 weeks 33 Late preterm 34 weeks 36
Term Births 37 weeks Early term 37 weeks <39 Full term 39 weeks <41 Late and postterm 41 weeks

11
Figure 13. Live Births by Mother’s Pre-pregnancy Body Mass Index (BMI)*, New York City, 2011-2013
• Obesity is strongly associated with chronic disease, which increases the risk of adverse birth outcomes such as preterm birth and birth defects.
• Nearly 40% of mothers were either obese (16.2%) or overweight (23.6%) pre-pregnancy in 2011 to 2013.
Figure 14. Average† Infant Mortality Rate by Mother’s Pre-pregnancy Body Mass Index (BMI)
and Age, New York City, 2011–2013
MOTHER’S BODY MASS INDEX
Figure 15. Average* Infant Mortality Rate by Mother’s Pre-pregnancy Body Mass Index (BMI) and
Racial/Ethnic Group, New York City, 2011–2013• The average infant mortality rate among women
who were obese prior to pregnancy was 9.5 deaths per 1,000 live births among non-Hispanic blacks, followed by 6.8 among Asian & Pacifi c Islanders, 6.2 among Puerto Ricans, 4.9 among other Hispanic and 4.7 among non-Hispanic whites.
• Among non-Hispanic black, Puerto Rican, other Hispanic, non-Hispanic white, and Asian and Pacifi c Islander mothers, the infant mortality rate was 1.2, 1.1, 1.3, 2.2, and 2.8 times greater among obese vs normal weight mothers, respectively.
• City wide, the infant mortality rate was 2 times greater among infants born to mothers who were obese (6.8 infant deaths per 1,000 live births) compared to infants born to normal weight mothers (3.5).
• The infant mortality rate was over 7.0 deaths per 1,000 live births among mother’s less than 20 years old, regardless of mother’s BMI.
• Among mothers 20 to 29, 30 to 39 and 40 years and older, the infant mortality rate was 1.8, 2.4 and 2.0 times greater among obese vs. normal weight mothers, respectively.
*Due to instability, the infant mortality rates by certain mother’s characteristics, are presented in three-year averages.
Obese
Overweight
Underweight
Normal Weight
0
3
6
9
12
15
Citywide
Age
Infa
nt M
orta
lity
Rate
per
1,00
0 Li
ve B
irth
s
7.27.5
3.62.7
7.26.5
3.52.9
1.9
6.9
0.0
2.6
RR†=1.1
RR† RR†
RR†=2.0 RR†=2.0
0
3
6
9
12
15
Asian & Pacific Islander
Non-Hispanic White
Other Hispanic
Puerto RicanNon-Hispanic Black
Mother’s Racial/Ethnic Group
Infa
nt M
orta
lity
Rate
per
1,00
0 Li
ve B
irth
s
5.7
7.67.0
9.5
6.2
4.4
6.2
3.6
2.1
4.9
6.8
2.9
4.7
2.5
4.4
Normal Weight (18.5 ≤ BMI<25)Underweight (BMI<18.5)
3.2
4.4
1.9 1.7
5.7
RR†=1.2
RR†=1.1
RR†=1.3 RR†=2.2
RR†=2.8
*Live births for which mother’s pre-pregnancy height and weight were reported in 2011-2013.
†Due to instability, the infant mortality rates by certain mother’s characteristics, are presented in three-year averages.
†Due to instability, the infant mortality rates by certain mother’s characteristics, are presented in three-year averages.
†Rate Ratio
†Rate Ratio

12
Table 4. Live Births and Infant Mortality Rate by Characteristics of Mother, New York City, 2013
MOTHER’S CHARACTERISTICS
Characteristics Number Percent Deaths Rate Deaths Rate Deaths RateTotal 120,457 100.0 551 4.6 377 3.1 174 1.4Race/Ethnicity
Puerto Rican 7,960 6.6 38 4.8 28 3.5 10 1.3Other Hispanic 27,621 22.9 120 4.3 72 2.6 48 1.7Asian and Pacific Islander 19,767 16.4 62 3.1 50 2.5 12 0.6Non-Hispanic White 39,573 32.9 117 3.0 85 2.1 32 0.8Non-Hispanic Black 24,108 20.0 201 8.3 132 5.5 69 2.9Other and unknown 1,428 1.2 13 - 10 - 3 -
BoroughManhattan 18,201 15.1 58 3.2 42 2.3 16 0.9Bronx 19,936 16.6 124 6.2 77 3.9 47 2.4Brooklyn 40,633 33.7 137 3.4 97 2.4 40 1.0Queens 26,536 22 109 4.1 77 2.9 32 1.2Staten Island 5,269 4.4 30 5.7 18 3.4 12 2.3Unknown
Age of MotherAge <18 1,443 1.2 11 7.6 7 4.9 4 2.8Age 18-19 3,603 3.0 22 6.1 14 3.9 8 2.2Age 20-29 51,570 42.8 233 4.5 159 3.1 74 1.4Age 30-39 57,220 47.5 204 3.6 150 2.6 54 0.9Age 40 6,619 5.5 43 6.5 32 4.8 11 1.7Age unknown 2 0.0 1 - 1 - 0 -Unmatched* - - 37 - 14 - 23 -
Mother's Education11th grade or less/12th grade, no diploma 24,319 20.2 128 5.3 79 3.2 49 2.0High school graduate or GED 26,095 21.7 133 5.1 97 3.7 36 1.4Some college/associate degree 26,373 21.9 138 5.2 92 3.5 46 1.7Bachelor's degree 23,997 19.9 64 2.7 48 2.0 16 0.7Master's degree or higher 19,257 16.0 40 2.1 36 1.9 4 0.2Mother's education unknown 416 0.3 11 - 11 - 0 -Unmatched* - - 37 - 14 - 23 -
Marital Status of Mother†Not married 48,733 40.5 283 5.8 182 3.7 101 2.1Married 71,724 59.5 231 3.2 181 2.5 50 0.7Unmatched* - - 37 - 14 - 23 -
Mother's BirthplaceUS born, including territories 58,914 48.9 292 5.0 198 3.4 94 1.6Foreign born 61,507 51.1 221 3.6 164 2.7 57 0.9Birthplace unknown 36 0.0 1 - 1 - 0 -Unmatched* - - 37 - 14 - 23 -
Primary Payer for This BirthMedicaid/Family Plus/Child PlusB/other govt 70,657 58.7 326 4.6 217 3.1 109 1.5Other 49,438 41.0 182 3.7 140 2.8 42 0.8Coverage unknown 362 0.3 6 . 6 . 0 .Unmatched* - - 37 - 14 - 23 -
PluralitySingletons 115,751 96.1 416 3.6 286 2.5 130 1.1Multiples 4,704 3.9 98 20.8 77 16.4 21 4.5Plurality unknown 2 0.0 - - - - - -Unmatched* - - 37 - 14 - 23 -
ParityFirst birth 53,050 44.0 218 4.1 168 3.2 50 0.9Second birth or higher 67,317 55.9 290 4.3 189 2.8 101 1.5Unknown 90 0.1 6 - 6 - 0 -Unmatched* - - 37 - 14 - 23 -
First Prenatal Care VisitNo prenatal care 848 0.7 20 23.6 18 21.2 2 2.4First trimester (1-3 months) 86,374 71.7 334 3.9 241 2.8 93 1.1Second trimester (4-6 months) 23,711 19.7 87 3.7 57 2.4 30 1.3Late (7-9 months) 7,905 6.6 29 3.7 12 1.5 17 2.2Prenatal care unknown 1,619 1.3 44 - 35 - 9 -Unmatched* - - 37 - 14 - 23 -
Pre-pregnancy Body Mass Index (BMI)Underweight (BMI<18.5) 6,583 5.5 18 2.7 10 1.5 8 1.2Normal weight (18.5 BMI<25) 65,115 54.1 228 3.5 165 2.5 63 1.0Overweight (25 BMI<30) 28,488 23.6 131 4.6 96 3.4 35 1.2Obese (BMI 30) 19,598 16.3 122 6.2 78 4.0 44 2.2Pre-pregnancy BMI unknown 673 0.6 15 - 14 - 1 -Unmatched* - - 37 - 14 - 23 -
*Infants who died in New York City who were born elsewhere were classified as unmatched. †Reporting the mother’s marital status on the birth certificate is prohibited by the New York City Health Code 201.05(b). Marital status was computed using father’s name. When missing or accompanied by an Acknowledgment of Paternity, marital status is categorized as unmarried; all others with father’s name were categorized as married.
Infant Mortality Rate (IMR) per 1,000 Live BirthsLive Births All Neonatal Postneonatal