summary report of the workshop on the experimental ... experimental nuclear reaction data database...
TRANSCRIPT

BNL-107653-2014-IR
Summary Report of the Workshop on The Experimental Nuclear Reaction Data Database
IAEA Headquarters, Vienna, Austria
6-10 October 2014
V.Semkova1, B.Pritychenko2
1IAEA Nuclear Data Section, Vienna, Austria 2Brookhaven National Laboratory, Upton, New York
December 2014
National Nuclear Data Center Brookhaven National
Laboratory P.O. Box 5000
Upton, NY 11973-5000 www.nndc.bnl.gov
U.S. Department of Energy Office of Science, Office of Nuclear Physics
Notice: This manuscript has been authored by employees of Brookhaven Science Associates, LLC under Contract No. DE-SC0012704 with the U.S. Department of Energy. The publisher by accepting the manuscript for publication acknowledges that the United States Government retains a non-exclusive, paid-up, irrevocable, world-wide license to publish or reproduce the published form of this manuscript, or allow others to do so, for United States Government purposes.

DISCLAIMER
This report was prepared as an account of work sponsored by an agency of the United States Government. Neither the United States Government nor any agency thereof, nor any of their employees, nor any of their contractors, subcontractors, or their employees, makes any warranty, express or implied, or assumes any legal liability or responsibility for the accuracy, completeness, or any third party’s use or the results of such use of any information, apparatus, product, or process disclosed, or represents that its use would not infringe privately owned rights. Reference herein to any specific commercial product, process, or service by trade name, trademark, manufacturer, or otherwise, does not necessarily constitute or imply its endorsement, recommendation, or favoring by the United States Government or any agency thereof or its contractors or subcontractors. The views and opinions of authors expressed herein do not necessarily state or reflect those of the United States Government or any agency thereof.

INDC(NDS)-0672
Distr. G+NC
INDC International Nuclear Data Committee
Summary Report of the Workshop on
The Experimental Nuclear Reaction Data
Database
IAEA Headquarters, Vienna, Austria
6 - 10 October 2014
Prepared by
V. Semkova
IAEA Nuclear Data Section, Vienna, Austria
B. Pritychenko
BNL National Nuclear Data Center, Upton NY, USA
December 2014
IAEA Nuclear Data Section
Vienna International Centre, P.O. Box 100, 1400 Vienna, Austria

Selected INDC documents may be downloaded in electronic form from
http://www-nds.iaea.org/publications
or sent as an e-mail attachment.
Requests for hardcopy or e-mail transmittal should be directed to
or to:
Nuclear Data Section
International Atomic Energy Agency
Vienna International Centre
PO Box 100
1400 Vienna
Austria
Printed by the IAEA in Austria
December 2014

INDC(NDS)-0672
Distr. G+NC
Summary Report of the Workshop on
The Experimental Nuclear Reaction Data
Database
IAEA Headquarters, Vienna, Austria
6 - 10 October 2014
V. Semkova
IAEA Nuclear Data Section, Vienna, Austria
B. Pritychenko
BNL National Nuclear Data Center, Upton NY, USA
ABSTRACT
The Workshop on the Experimental Nuclear Reaction Data Database (EXFOR) was held at
IAEA Headquarters in Vienna from 6 to 10 October 2014. The workshop was organized to
discuss various aspects of the EXFOR compilation process including compilation rules,
different techniques for nuclear reaction data measurements, software developments, etc. A
summary of the presentations and discussions that took place during the workshop is reported
here.
December 2014


TABLE OF CONTENTS
1. Introduction ............................................................................................................................ 7
2. Presentation summaries ......................................................................................................... 7
2.1. Technical remarks on compilation, N. Otuka ................................................................. 7
2.2. Compilation of beta-delayed neutron emission data, V. Semkova ................................. 9
2.3. Results of the 100
Mo(p,2n)99m
Tc cross section measurements and possible
systematic errors, S. Takacs ......................................................................................... 11
2.4. Definitions of yields. Problems and confusions, S. Takacs .......................................... 14
2.5. Neutron Kerma factors in EXFOR: actual status and missing published results,
S. Simakov .................................................................................................................... 16
2.6. Some problems of photonuclear data compilation and evaluation, V. Varlamov ........ 19
2.7. Compilation of neutron data in the resolved resonance region measured by
TOF method. Spectrometers’ response function, V. Semkova ..................................... 21
2.8. Neutron source spectra format. EXFOR formats and rules: present status and
proposals for neutron source data storage, O. Gritzay .................................................. 22
2.9. Nuclear astrophysics data. Calculations of nuclear astrophysics and
californium neutron cross section uncertainties using ENDF/B-VII.1,
JEFF-3.1.2, JENDL-4.0 and low-fidelity covariances, B. Pritychenko ........................ 28
2.10. Structure of software on graphic data processing for the EXFOR data library,
G. Pikulina, S.Taova, S. Dunaeva ................................................................................. 28
2.11. Introduction to the digitization software GDgraph, Guochang Chen
(Yongli Jin, Jimin Wang, CNDC, China) ..................................................................... 29
2.12. Status of the compiled Neutron Spectra in EXFOR. Summary of discussions held at the
Workshop and further developments, S. Simakov, N. Otuka, V. Semkova, V. Zerkin33
2.13. EXFOR Web Editor, V. Zerkin .................................................................................... 38
3. Summary of discussions and recommendations .................................................................. 39
APPENDIX I: Agenda of the Workshop .................................................................................... 41
APPENDIX II: List of Participants ............................................................................................. 43

THE INTERNATIONAL NETWORK OF NUCLEAR REACTION DATA CENTRES
National, regional and specialized nuclear reaction data centres, coordinated by the International
Atomic Energy Agency, cooperate in the compilation, exchange and dissemination of nuclear reaction
data in order to meet the requirements of nuclear data users in all countries. At present, the following
data centres participate in the International Network of Nuclear Reaction Data Centres (NRDC):
NNDC US National Nuclear Data Center, Brookhaven National Laboratory,
Upton, USA
NEA DB OECD NEA Data Bank, Issy-les-Moulineaux, France
NDS IAEA Nuclear Data Section, Vienna, Austria
CJD Russian Nuclear Data Centre, Institute of Physics and Power Engineering,
Obninsk, Russia
CNDC China Nuclear Data Centre, China Institute of Atomic Energy, Beijing,
China
ATOMKI Charged-Particle Nuclear Reaction Data Group, Institute for Nuclear
Research (ATOMKI), Debrecen, Hungary
NDPCI Nuclear Data Physics Centre of India, Bhabha Atomic Research Centre,
Trombay, Mumbai, India
JAEA/NDC Nuclear Data Center, Japan Atomic Energy Agency, Tokai-mura, Japan
JCPRG Nuclear Reaction Data Centre, Hokkaido University, Sapporo, Japan
KNDC Nuclear Data Center, Korea Atomic Energy Research Institute, Daejeon,
Republic of Korea
CDFE Centre for Photonuclear Experiments Data, Moscow State University,
Moscow, Russia
CNPD Centre of Nuclear Physics Data, Institute of Nuclear and Radiation
Physics, Russian Federal Nuclear Center –All-Russia Research Institute of
Experimental Physics, Sarov, Russia
UkrNDC Ukrainian Nuclear Data Centre, Institute for Nuclear Research, Kyiv,
Ukraine

7
1. Introduction
The Workshop on The Experimental Nuclear Reaction Data Database (EXFOR) was held at IAEA
Headquarters, Vienna, Austria from 6 to 10 October 2014. Eleven participants from different Nuclear
Reaction Data Centres and four staff from the IAEA attended the Workshop (Appendix II)
The Workshop was organized to discuss various aspects of the EXFOR compilation process including
compilation rules, different techniques for nuclear reaction data measurements, software developments,
etc. At the beginning the conclusions and the recommendations of the Report NEA/DB/DOC(2014)3
“Statistical verification and validation of the EXFOR database: (n,n'), (n,2n), (n,p), (n,α) and other
neutron-induced threshold reaction cross sections” were discussed. Presentations of charged-particle
induced reaction cross sections, thick target yields, nuclear astrophysics data, TOF spectra in the
resolved resonance region, beta-delayed neutron emission data and photonuclear data measurements
provided information on the experimental technique in order to improve the quality of the EXFOR
compilations. The need to compile the neutron Kerma factors, status of Kerma factors in EXFOR data
library and a list of articles for compilation were discussed during the Workshop. The importance of
defining the format (rules) for the compilation of neutron source spectra in EXFOR was emphasized
and different proposals were discussed. Software developments related to EXFOR compilation, both
stand-alone and online, were presented. In addition to discussions, several compilation and digitization
exercises were carried out. The Workshop was concluded with a list of recommendations.
In the welcome address S. Simakov (IAEA) and R. Capote-Noy (IAEA) greeted participants of the
Workshop on behalf of the Nuclear Data Section and its Section Head, Robin Forrest, who was not able
to attend.
N. Otuka was elected Chairperson of the Workshop and B. Pritychenko Rapporteur. The agenda was
discussed and adopted (see Appendix I).
During the Workshop participants gave presentations, led intensive discussions and carried out
compilation exercises. The presentations and Working Papers are available at https://www-
nds.iaea.org/nrdc/wksp_2014/.
The Nuclear Data Section acknowledged all participants for their cooperation and contribution to this
Workshop.
2. Presentation summaries
2.1. Technical remarks on compilation, N. Otuka
Technical remarks from the reviewers were discussed. Many of them are treated as recommendations
rather than (proposals of) new rules. Some of them could be further discussed and added to the manuals
if appropriate. The goal is to make key information more visible in a simple and concise EXFOR
database.
DECAY-DATA - T1/2 vs isomeric flag
All half-lives coded under the keyword DECAY-DATA with those compiled in the Nuclear Wallet Cards
were compared last year, and a list was prepared for cases where more than 50% deviation exists
between EXFOR and Nuclear Wallet Cards. Each case was checked with Svetlana Babykina against the
source article as well as the ENSDF library (mainly through the LiveChart of Nuclides). Some cases are
for straight forward corrections, e.g., simple mistake by the compiler, change in the level order (e.g., 5
hr and 70 min state of 120
In). But our response must be discussed for some non-trivial cases (e.g., half-

8
life reported by the author but without a corresponding state in ENSDF, isomeric flag for which its level
ordering is uncertain (e.g., the 17 sec and 6 min state of 108
Rh).
Level energies in heavy-ion binary reactions
The level energy (E-LVL) of the residual nucleus (reaction product) is sufficient to characterize the
secondary energy of the binary reaction when the projectile is a light particle (e.g., neutron, proton,
deuteron). However, both the outgoing nucleus and residual nucleus may not be in their ground states.
Therefore, the compiler should provide the level energies of both products (e.g., under E-LVL1 and E-
LVL2) when a partial data set is compiled for a binary heavy-ion induced reaction.
Alternative (interdependent) results
Different results for the same quantity obtained in the same experiment by two different methods of
analysis (e.g., two data sets obtained by off- and on-line analysis, two data sets from two flight paths.)
may be coded in the (1) same subentry by using the multiple reaction formalism, or (2) separated
subentries linked to each other by COREL under the keyword STATUS. However, the flags should not be
used for this purpose. Also two entries must be linked to each other not by COREL but by a related
reference (REL-REF) type O when they are compiled from the same article (e.g., neutron data in area 1
while charged-particle in area C).
Keywords kept in deleted entries
Our current rule asks to keep REFERENCE, TITLE, AUTHOR, INSTITUTE, and HISTORY keywords in the
common subentry (001) when an entry is deleted, while the decision is up to the compiler for other
keywords. In order to make future maintenance of deleted entries easier (e.g., replacement of a code due
to dictionary update), it is recommended to delete unnecessary keywords.
Free text – Be short and concise!
The compiler should not perform a simple “copy and paste” operation but rather carefully identify
essential key information to be kept as free text. Lengthy free text information may hide the essential
free text information. Repetition of the coded information by its expansion in free text should be
avoided. A coded form should be adopted instead of free text when possible. When appropriate, free
text must be entered under the keyword and code to which it pertains.
Source described under ERR-ANALYS
The EXFOR Formats Manual introduces the keyword ERR-ANALYS as follows: “Explains the sources of
uncertainties and the values given in the COMMON or DATA”. The “source” in this sentence does not
mean where the compiler found the uncertainties but what types of error sources are considered (e.g.,
counting statistics, normalization). Therefore, headings should not be trivialized as “The uncertainty is
reported by authors on figure”. Some headings (e.g., ERR-DIG) are self-explanatory without any free
text information, and it is advisable not to define such headings under this keyword.
Documentation of alterations under HISTORY
In the NRDC 2014 meeting documents, the conclusion was that (1) all important alterations must be
described in each affected data subentry in addition to a short summary (e.g., subentry numbers) in the
common (001) subentry; (2) compilers will not be urged to document all changes under HISTORY (c.f.
Conclusion 28 and Action 12 of the meeting). It is proposed that the documentation of formal
corrections (e.g., upper to lower cases, two digits to four digits year) should be avoided in favour of the
more important alterations.

9
2.2. Compilation of beta-delayed neutron emission data, V. Semkova
The main characteristics of the beta-delay neutron emission, the measurement techniques and the
compilation rules were discussed in accordance with the decision of the NRDC Meeting 2014 to include
beta-delayed neutron spectra from specific precursors in the scope of the EXFOR compilation. The
rules for the compilation of the emission probabilities have been revised in order to take into account
the probability of the emission of more than one beta-delayed neutron from a precursor.
Beta-delayed neutron emission data are important in many fields of science and applications. Regarding
nuclear technologies, beta-delayed neutron are essential for reactor kinetics, safety and decay heat
analysis. The new developments of advanced reactors, Accelerator Driven Systems etc., considerably
extend: the type of the targets; projectiles and excitation energies involved in the nuclear fission or
fragmentation processes; the composition of the fission products and its dynamics during the fuel cycle.
In such cases the calculations of the aggregate beta-delayed neutron characteristics based on the data for
the individual precursors are more feasible than the measurements. The benchmark experiments are
particularly sensitive to a beta-delayed neutron emission. In such experiments eff is used as a
conversion factor between experimental results and calculations, which implies a high accuracy of the
beta-delayed neutron emission data. The beta-delayed neutron emission is an important process for
nuclear astrophysics. The process may shift the decay path towards lower masses. It also provides
neutrons during the freeze-out stage. There is a renewed interest in the beta-delayed neutron data
measurements in recent years. Consistent compilation of the beta-delayed neutron emission data
measurements will provide an experimental data record in this field.
The compilers are advised to verify the (Q > SNn) condition for emission of beta-delayed neutrons
during the compilation. This condition can be calculated using atomic masses of the isotopes involved.
Such data are also available, for example, from the Live Chart of Nuclides (https://www-
nds.iaea.org/relnsd/vcharthtml/VChartHTML.html). The decay of a precursor may be followed by a
decay chain as presented in Fig. 1 [1]. Thus, the decay of some precursors can be followed by the
emission of more than one beta-delayed neutron. The coding rules for the compilation of beta-delayed
neutron emission from the specific precursor Z-S-A are defined in Memo CP-C/429 as follows:
The delayed neutron emission probability (= probability for emission of at least one beta-delayed
neutron), Pn, is coded as: ,PN with units NO-DIM.
The probability of emission of N beta-delayed neutrons, PNn, is coded as: ,NUM,PN with units NO-
DIM.
The delayed-neutron emission multiplicity, <n> = P1n + 2*P2n + 3*P3n + …. is coded as ,MLT,DN
with units PRT/DECAY or PC/DECAY.
The energy spectrum of delayed neutrons emitted by a specific precursor is coded as: ,PN/DE with
units of dimension 1/E.
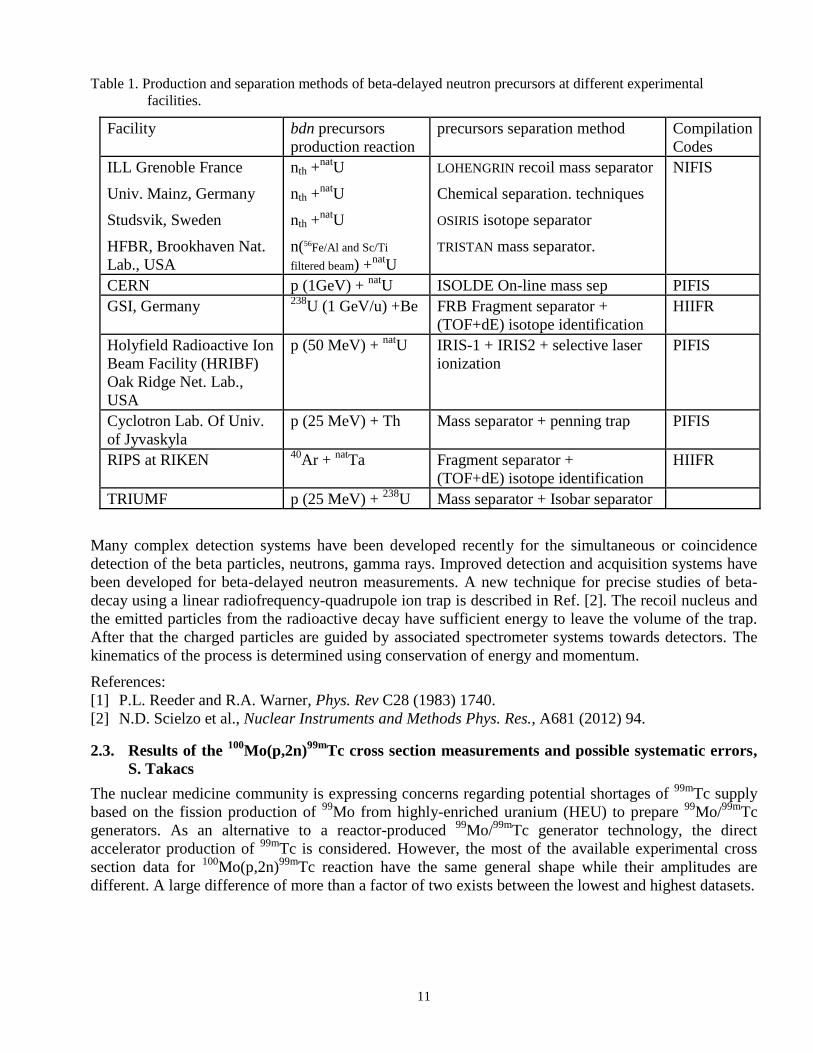
The precursors’ production and separation methods applied at different experimental facilities are
shown in Table 1. The following new codes for the keyword METHOD have been proposed in the
WP2014- 23(Rev.) NIFIS (neutron induced fission), PIFIS(proton induced fission), HIIFR (heavy-ion
induced fragmentation), LIISP (light-ion-induced spallation LCP<=4) documents.

10
Fig.1. The mass chain beginning with
98Rb and delayed-neutron branching ratios from the Ref. [1].
Determination of the branching ratios and decay characteristics is often performed by analysis of the
measured growth and decay curves as presented in Fig. 2 [1].
Fig. 2 Growth and decay curves from Ref. [1].
11
Table 1. Production and separation methods of beta-delayed neutron precursors at different experimental
facilities.
Facility bdn precursors
production reaction
precursors separation method Compilation
Codes
ILL Grenoble France
Univ. Mainz, Germany
Studsvik, Sweden
HFBR, Brookhaven Nat.
Lab., USA
nth +nat
U
nth +nat
U
nth +nat
U
n(56Fe/Al and Sc/Ti
filtered beam) +nat
U
LOHENGRIN recoil mass separator
Chemical separation. techniques
OSIRIS isotope separator
TRISTAN mass separator.
NIFIS
CERN p (1GeV) + nat
U ISOLDE On-line mass sep PIFIS
GSI, Germany 238
U (1 GeV/u) +Be FRB Fragment separator +
(TOF+dE) isotope identification
HIIFR
Holyfield Radioactive Ion
Beam Facility (HRIBF)
Oak Ridge Net. Lab.,
USA
p (50 MeV) + nat
U IRIS-1 + IRIS2 + selective laser
ionization
PIFIS
Cyclotron Lab. Of Univ.
of Jyvaskyla
p (25 MeV) + Th Mass separator + penning trap PIFIS
RIPS at RIKEN 40
Ar + nat
Ta Fragment separator +
(TOF+dE) isotope identification
HIIFR
TRIUMF p (25 MeV) + 238
U Mass separator + Isobar separator
Many complex detection systems have been developed recently for the simultaneous or coincidence
detection of the beta particles, neutrons, gamma rays. Improved detection and acquisition systems have
been developed for beta-delayed neutron measurements. A new technique for precise studies of beta-
decay using a linear radiofrequency-quadrupole ion trap is described in Ref. [2]. The recoil nucleus and
the emitted particles from the radioactive decay have sufficient energy to leave the volume of the trap.
After that the charged particles are guided by associated spectrometer systems towards detectors. The
kinematics of the process is determined using conservation of energy and momentum.
References:
[1] P.L. Reeder and R.A. Warner, Phys. Rev C28 (1983) 1740.
[2] N.D. Scielzo et al., Nuclear Instruments and Methods Phys. Res., A681 (2012) 94.
2.3. Results of the 100
Mo(p,2n)99m
Tc cross section measurements and possible systematic errors,
S. Takacs
The nuclear medicine community is expressing concerns regarding potential shortages of 99m
Tc supply
based on the fission production of 99
Mo from highly-enriched uranium (HEU) to prepare 99
Mo/99m
Tc
generators. As an alternative to a reactor-produced 99
Mo/99m
Tc generator technology, the direct
accelerator production of 99m
Tc is considered. However, the most of the available experimental cross
section data for 100
Mo(p,2n)99m
Tc reaction have the same general shape while their amplitudes are
different. A large difference of more than a factor of two exists between the lowest and highest datasets.

12
There are several error sources that could contribute to the differences among the reported datasets:
Beam current
Target thickness
Detector efficiency
Nuclear decay data
Problematic peak analysis
Latent cooling time error
Figure 1. Simplified decay scheme of
99Mo
The most important and most probable error sources are the obsolete nuclear decay data and the data
evaluation methods.
The aim of this study was to determine the absolute amplitude of the excitation function of 100
Mo(p,2n)99m
Tc reaction. For determining of the cross section peaks in spectra the E=140.5keV
gamma photons could be used.
The E=140.5keV gamma photons have four different origins, these are:
Decay of directly-produced 99m
Tc (Eq.1)
Decay of 99m
Tc produced during extensive irradiation by decay of 99
Mo (Eq.2)
Decay of 99m
Tc produced after end of bombardment (EOB) by decay of 99
Mo (Eq.3)
Prompt gamma radiation that follows the decay of 99
Mo (Eq.4)
The corresponding contributions to the total peak area T acquired during a tm measuring time after a tb
irradiation and tc cooling time for a given Mo target foil can be described by the following four
equations for the above four components respectively.
mcb ttt
bttdD eeeNNdirectT 222
21
11
2
2
(1)
mcbb ttttbttdx
eeeeNfN
decayT 2212
21
111
2
21
21
1
(2)
mcmcb tttttbttdy
eeeeeNfN
decayT 11221
2111
1
2
21
1
(3)
mcb ttt
bttdM eeeNNdirectT 111
11
11
1
1
, (4)
where: Nt is surface density of target atoms, [atom/cm2]; Nb is number of bombarding particles per unit
time, [proton/sec]; i is activation cross sections, [cm2]; f is decay branching ratio of
99Mo to
99mTc; d
is detector efficiency; is corresponding gamma intensity; t is dead time correction; i is decay
constant, [1/sec]; tb is bombarding time, [sec]; tc is cooling time, [sec]; tm is acquisition, [sec]; i is the
i=1 index refers to the 99
Mo parent radionuclide, i=2 is referred to the 99m
Tc daughter radionuclide
instead.
Following the above data, the independent experiments were performed at 38, 36 and 16 MeV proton
energies. The stacked foil technique, proton activation and high resolution gamma-spectrometry
methods were used for measuring the cross sections of the 100
Mo(p,2n)99m
Tc reaction using thin
molybdenum foils in metallic form with natural isotopic composition as target. The 36 and 16 MeV
99mTc
99Mo
99Tc
87.6%
5.1%
140.5 keV
T1/2=66 h
T1/2=6.01 h7.3%

13
irradiations were new experiments, while the 38 MeV irradiation was done earlier with results
published in 2003. This experiment was re-evaluated by using up-to-date decay data and upgraded
recommended cross sections for the nat
Ti(p,x)48
V monitor reaction.
The excitation function of the 100
Mo(p,2n)99m
Tc reaction determined in the three independent
irradiations using analytically derived equations and the data evaluation are in perfect agreement. This
agreement proves that the main discrepancy among the published experimental cross section data of the 100
Mo(p,2n)99m
Tc reaction could originate from the data evaluation methods.
New experimental results were cross checked by evaluating additional non-interfering reactions nat
Mo(p,x)95m
Tc and nat
Mo(p,x)96g
Tc reactions which are in a good agreement with the earlier published
data.
Figure 2. The newly-measured cross section data of the
100Mo(p,2n)
99mTc reaction in comparison with the data
reported earlier. The thick solid line is a spline fit of the results of this work and the re-evaluated data of
published in 2003. Thin lines indicate a ±15% acceptance level.
Detailed information on the experiment and the derived results will be published in Nuclear Instruments
and Methods B.
100Mo(p,2n)
99mTc
0
50
100
150
200
250
300
350
400
450
0 5 10 15 20 25 30 35
Proton energy (MeV)
Cro
ss s
ecti
on
(m
b)
Levkovskij 1991 [8]Lagunas-Solar 1996 [10]Scholten 1999 [11]Takacs 2003 [12]Khandaker 2007 [14]Challan 2007 [15]Lebeda 2010 [16]Alharbi 2011[18]Gagnon 2011 [20]Tarkanyi 2012 [19]Manenti 2014 [22]This workre-eval Takacs 2003This work fit15% acceptance levelQaim 2014 [23]TENDL-2013 [34]

14
2.4. Definitions of yields. Problems and confusions, S. Takacs
There is some confusion among the different definitions and use of the experimental yields of charged
particle induced reactions in everyday use. Different physical quantities like production rates, EOB
activity (activity at the end of bombardment) are called yield and the applied units are mixed up as well
which makes proper compilation of the reported data difficult.
The yield of a nuclear reaction is defined as the ratio of the number of new nuclei formed in the nuclear
reaction to the number of particles incident on the target. This yield is termed as the physical yield, Y
and the corresponding unit is particle/particle.
For charged particle induced reactions the number of incident particles can also be expressed by the
corresponding charge of the number of bombarding particles. So, the unit of the yield can be
particle/charge, particle/C, particle/Ah etc. (where the Ah represents charge unit and not A*h).
The yield is always:
target specific
depends on the energy of the bombarding particles
a time independent quantity.
There are fewer problems in the compilation of yields of stable reaction products which are always
expressed in terms of the number of product particles per number of beam particles or in units of
electric charge in case of charged particle beam. Since the reaction products are stable, the yield is
“time independent”.
Although the yield of a reaction with radioactive products can be expressed in the same manner, in the
every-day practice some other physical quantities such as production rate or activity are used as yield,
and this is a major source of confusion. Description on definitions of the used “experimental yield” is
often insufficient or even missing in the literature. For radioactive reaction products it is widely
accepted that the number of produced particles is determined by the measured activity. The unit of yield
then is expressed as Activity/Charge (MBq/C, MBq/Ah, (Ah is a charge unit). In an experiment not
the yield but the number of decays is measured directly. The main problem arises from the fact that the
activity is not time independent, and several time-dependent corrections should be applied to the
measured activity in order to determine the proper number of the produced particles.
Experimental data of more than 800 works, which present experimental excitation functions and thick
target yields were determined by measurements of activities followed by charged-particle irradiation,
are already included in the EXFOR library.
In order to retrieve and analyse experimental thick target yields of a specific type from EXFOR
efficiently and properly, each experimental data set must be properly tagged not only by the reaction
type (i.e., target, beam particle, radioisotope product), but also by the definition of the yield. However,
the large variety of yield nomenclature that can be found in the literature makes compilation work
difficult.
Thin- and Thick-Target Yield
Thick-target Yield is defined as the yield of a reaction measured on a target with such a thickness in
which the energy of the incident beam degrades to below the threshold energy of the reaction.
Thin-target yield is defined as the yield of a reaction measured on a target with such a thickness in
which the energy of the incident beam degrades less significantly and the energy of the particles passing
through the target is above the threshold energy of the reaction.

15
Production and decay rates
For any target thickness the number of reaction product formed during irradiation can be described as
follows. If the cross section to produce the isotope i is i(x), the total number of the produced isotope i
after irradiation time t is N(t) (not considering any decay, just production).
)/)((0
1
0 ZeSEdx
dEdEtI
E
Ei
L
(1)
ytItN 0)( , (2)
where EL is the beam energy at the exit of the sample, -(1/)(dE/dx) is the stopping power, and y is the
number of the isotope i produced by deposition of unit charge (e.g., 1 C). The quantity y (in nuclides/C)
describes the amount of produced particles in the target per unit charge; therefore it is called
production rate. This quantity can be defined for both stable and radioactive products and it is time
independent.
If the isotope i is radioactive (with decay constant ), the total number N*(t) of the radioisotope i
present in the target after irradiation time t satisfies the following differential equation
)()( *
0
*
tNyIdt
tdN (3)
and its solution is
teyItN
1)( 0
* . (4)
Experimentally, the activity of the produced nuclides is measured and the production rate can be
deduced from the measured activity A(t)
)(1)()( 00
* taIeyItNtA t , (5)
where a(t) defined as the decay rate or specific activity per unit current (Bq/A) at the irradiation time
t. The decay rate is a time dependent quantity.
The limit of equation (5) at t→ and its derivate at t=0 have special importance.
For a very long irradiation time (i.e., t much longer than the half-lives of the reaction product) the value
of the 11 te , and the production rate and decay rate of the reaction product are in equilibrium.
sataIyItA 00)( , (6)
where asat defined as the saturation decay rate or saturation specific activity per unit current (Bq/A)
after a very long irradiation time.
The curve of the growing activity of the produced radionuclide versus irradiation time described by
equation (5) is not a straight line. From Eq. (5), the time evolution of the activity during irradiation is
described as:
)()(
00 tIyeIdt
tdA t (7)
yt )0( . (8)
Equation (8) describes the slope of the growing activity curve versus time. The value of (t) at t=0 has
a special importance, it is the production rate (y) times decay constant ( which gives the decay rate at
t = 0. This time-independent quantity with units of Bq/C is defined as the physical yield.

16
Quantities defined in EXFOR Symbol Typical unit
hick target product yield y ,PY„TT/CH nuclei/μC,
nuclei/μAh
end-of-bombardment thick target yield a(t) ,TTY„EOB MBq/μA
saturation thick target yield asat ,TTY„SAT MBq/μA
a(t→∞)
physical thick target yield phys ,TTY„PHY MBq/C
a(t=0)
2.5. Neutron Kerma factors in EXFOR: actual status and missing published results, S. Simakov
KERMA (K) is a Kinetic Energy Released in Matter per mass unit, K = dE/dm. K accounts for the
energy deposition from all charged ejectiles (p, d, α, e) of nuclear reaction including heavy recoils
which deposit their energy locally. However, it excludes neutral reaction products (n, γ, …) which
deposit energy non-locally, i.e. at “large” distance from collision.
The KERMA factor kf is defined as KERMA per incident particle fluence Φ = N/Area:
kf = KΦ⁄ .
kf is a product of mean ejectile energy Ej and production cross section σj summed over all reaction
channels j and is normalized per target atom mass M :
kf(E) = ∑ kj
j
=∑ Ej σ(n, xj)j
M.
Units of KERMA factors are Energy/Mass*Area and expressed either in J/kg m2 and Gy m
2 (SI)
or in erg/g cm2
and rad cm2 (CGS).
KERMA factors are used:
In Reactor and Radiation Material Physics: Kerma factors after partitioning between electron
ionization losses and atom recoils energies gives the Damage Energy that defines the number of
Primary Kick-off Atoms (PKA) shifted from the lattice sites and finally the displacement-per-
atom probability or dpa-cross-sections. This is, in particular, a point of interest for the IAEA
CRP on “Primary Radiation Damage Cross Sections”: https://www-nds.iaea.org/CRPdpa/;
In Medicine: Neutron Kerma factors are used to predict the ionization coursed by the secondary
charged particles from neutron reactions in the human tissue or in Tissue Equivalent Plastics
(TEP) such as A-150;
More generally, for the Validation of Evaluated cross section Libraries: KERMA provides
additional data for confidence.
EXFOR Documents have at the moment the following information about KERMA factors:
LEXFOR (IAEA-NDS-208, rev 2011/01) has no information about KERMA at all;
EXFOR Basics (IAEA-NDS-206, June 2008) defines in Dictionary 236 the specific Kerma
factor parameter in subfield SF6 as ,KER ;
EXFOR Protocol (IAEA-NDS-0215, rev 2014/05) categories a compilation scope for Kerma as
“voluntary compilation (B)” and “Kerma factors (integral data only)”.

17
Currently EXFOR contains the measured Kf data published by following authors:
U. Schrewe et al., Entry 22507: results from paper presented at ND-1997 Trieste for 8 elements
and 3 materials (however the author’ data were wrongly converted into fGy*m2 units and likely
these data have to be superseded by those published in Phys. Med. Biol. 45, 651 (2000));
S. Benck et al., Entry 22811: (Al) and 22807.45 (Si);
E. Raeymackers et al., Entry 22942: Bi and U, total and partial Kf ;
M.A. Lone et al. Entry D0592.003: Kerma-rates in Air at 125 cm from Be(d,xn) source.
After an overview of Kerma data available in EXFOR and published in the literature (Table), the
following proposals have been made:
compile articles with neutron KERMA factors listed in Table;
revisit and eventually correct Entry 22507 (include data from the later publication, correct units)
and Entry 22811 (correct main reference).
Table. The KERMA data published in literature but missing in EXFOR
Target
Reaction Energy
Source
Lab Reference
Recommen
dation
C, Mg, Fe 14.7 MeV D-T
Univ. of
Kansas
C. Wuu and L. Milavickas, "Determination of the Kerma
Factors in Tissue-equivalent Plastic. C, Mg, and Fe for
14.7 MeV Neutrons,"
Med. Phys. 14(6), 1007 (1987)
compile in
EXFOR
C, Mg, Fe 15.0 MeV
D-T
LLNL
E. Goldberg, D.R. Slaughter and R.H. Howell,
“Experimental Determination of Kerma Factors at E ≈ 15
MeV”,
LLL Report UCID-17789, 1978
compile in
EXFOR
C 14.1 MeV
15, 17.8
MeV
19.8 MeV
RTNS-I
LLNL
P.M. DeLuca, Jr., H.H. Barschall, R.C. Haight, and J.C.
McDonald, ‘‘Kerma factor of carbon for 14.1 MeV
neutrons’,
Radiation Research 100, 78–86 (1984) P.M. DeLuca, Jr., H.H. Barschall, R.C. Haight, and J.C.
McDonald, ‘‘Measured neutron carbon kerma factors from
14.1 MeV to 18 MeV,’’ Proc. of 5th Symp. Neutron
Dosim., v I: Luxembourg, 1985, No. EUR 9762 EN, pp.
193–200.
P.M. DeLuca, Jr., H.H. Barschall, M. Burhoe, and R.C.
Haight, ‘‘Carbon kerma factor for 18- and 20-MeV
neutrons,’’
Nucl. Sci. Eng. 94 (1986) 192-198
compile in
EXFOR
compile in
EXFOR
O, Al, Si 15, 17.5,
18.1, 19.1
MeV
RTNS-I
LLNL
P.M. DeLuca, H.H. Barschall, H.H. Sun,
R.C. Haight, ‘Kerma factor of Oxygen, Aluminium and
Silicon for 15 and 20 MeV neutrons
Radiat. Protect. Dosimetry 23 (1988) 27
compile in
EXFOR
C 14.1 MeV D-T
LLNL R.C. Haight, S.M. Grimes et al.
NSE 87 (1984) 41 compile in
EXFOR H
C, N,O
25.8, 50.0,
63.1 MeV
27.4, 39.7,
60.7 MeV
7Li(p,n)
Crocker
Nucl. Lab.
Uni. of
CA
J.L. Romero, F.P. Brady, and T.S. Subramanian, ‘‘Neutron
induced charged particle spectra and kerma from 25 to 60
MeV,’’
Santa Fe - 1985, v. 1, pp. 687–699
compile in
EXFOR

18
Target
Reaction Energy
Source
Lab Reference
Recommen
dation
C, O, Si
C, Mg, Fe
18, 23, 25
MeV
18, 23, 25
MeV
(Data on
Graph)
T(d,n)
Uni. of
Wisconsin
C.L. Hartmann, P.M. DeLuca, Jr., and D.W. Pearson,
‘Measurement of neutron kerma factors in C, O, and Si at
18, 23, and 25 MeV,’
Radiat. Protect. Dosim. 44, 25 (1992)
C.L. Hartmann, P.M. DeLuca Jr., D.W. Pearson,
‘Measurement of C, Mg and Fe Kerma Factors and the 19
F(n,2n)18
F Cross Section for 18 to 27 MeV Neutrons’
ND-1991, Jülich, pp. 589-591
C.L. Hartmann, “Measurements of Neutron Kerma Factors
at 18, 23 and 25 MeV”,
Ph.D. Thesis, University of Wisconsin, Madison, 1991
compile in
EXFOR
Mg, Si, Fe
O
25 to 85
MeV
34 to 66
MeV
WNR by
ToF
LANL
and
PSI
W.D. Newhauser, “Neutron Kerma Factor Measurements
in the 25 MeV to 85 MeV Neutron Energy Range”,
Ph.D. Thesis, University of Wisconsin, Madison, 1995
here
Abstract: Medical Physics 22(1995)2128
compile in
EXFOR
C
C
42.5, 62.7,
72.8 MeV
26.5 - 72.8
MeV
Cyclotron
Li(p,n)
Louvain-
la-Neuve
I. Slypen, V. Corcalciuc and J.P. Meulders, ‘Kerma values
deduced from neutron-induced charged-particle spectra of
carbon from 40-MeV to 75-MeV’
Phys. in Med. and Biol. 40, 73–82 (1995) I. Slypen, S. Benck, J.P. Meulders, V. Corcalciuc,
‘Experimental partial and total kerma coefficients for
carbon deduced from microscopic cross sections at incident
neutron energies below 75 MeV”
Phys. in Med. and Biol. 45 (2000) 577
compile in
EXFOR
compile in
EXFOR
H, C, O, N,
A-150, TE-
M, TE-P,
H2O, ICRU
muscle,
H
3.0 to 72.8
MeV
29.0 to 72.8
MeV
Cyclotron
Li(p,n)
Louvain-
la-Neuve
J.P. Meulders, S. Benck, I. Slypen, V. Corcalciuc, ‘Experimental kerma coefficients of biologically important
materials at neutron energies below 75 MeV’,
Medical Physics 27, 2541 (2000)
V. Corcalciuc, S. Benck, R. Malu, J.P. Meulders, I. Slypen,
“Experimental hydrogen kerma factors for incident neutron
energies from 25 to 75 MeV,
Phys. in Med. and Biology 44(1999)719
compile in
EXFOR
compile in
EXFOR
12C(n,n’3α) 11 - 35
MeV
9Be(d,n)
Louvain-
la-Neuve
B. Antolkovic, L. Slaus and D. Plenkovic, “Experimental
Determination of the Kerma Factors for the Reaction 12
C(n,n'3a) at En = 10 - 35 MeV”,
Radiation Research 97(1984)253
compile in
EXFOR
12C(n,n’3α) 11.9 -19.0
MeV D(d,n),
T(d,n)
PTB
B. Antolkovic, G. Dietzes and H.Klein, “Secondary
Alpha Particle Spectra and partial Kerma Factors
of the reaction n+ 12C -> n + 3α”,
Radiation Protect. Dosimetry 44(1992)31
compile in
EXFOR
C, N, O,
Mg, Al, Si,
Fe, Zr, AlN,
Al2O3, Si02,
A-150
C and
A-150
plastic
5, 8, 15, 17,
34, 44, 66
MeV
26.3, 37.8
MeV
D(d,n)
T(d,n)
5-17MeV
PTB
9Be(p,xn)
34-66MeV
PSI
9Be(p,xn)
PSI,
Switzerlan
d
U.J. Schrewe, W.D. Newhauser, H.J. Brede, P.M. DeLuca,
“Experimental kerma coefficients and dose distributions of
C, N, O, Mg, Al, Si, Fe, Zr, A-150 plastic, Al2O3, AlN,
SiO2 and ZrO2 for neutron energies up to 66 MeV”,
Phys. Med. Biol. 45, 651 (2000) H. Schuhmacher, H.J. Brede, R. Henneck, A. Kunz, H.G.
Menzel, J.P. Meulders, P. Pihet, U.J. Schrewe,
‘Measurement of neutron kerma factors for carbon and A-
150 plastic at neutron energies of 26.3 and 37.8 MeV’
Phys. Med. Biol. 37, 1265–1281 (1992)
U.J. Schrewe, H.J. Brede et al.
‘Determination of Kerma Factors for A-150 plastic and
Carbon for neutron energies above 20 MeV’
ND-1991, Jülich, p. 586-594
compile in
EXFOR
compile in
EXFOR

19
Target
Reaction Energy
Source
Lab Reference
Recommen
dation
Mg
Al
C
13.9, 15.0,
19.0 MeV
13.9, 15, 17,
19MeV
15, 17 MeV
T(d,n)
PTB
G. Buhler, H.G. Menzel, H. Schuhmacher, ‘Neutron kerma
factors for magnesium and aluminium measured with low-
pressure proportional counters’
Phys. Med. Biol. 31 (1986) 601
G. Buhler, H.G. Mentzel, H. Schuhmacher, S. Guldbakke,
5th Symp. Neutr. Dos., Munich, EUR-9762, p. 309
(1985)
compile in
EXFOR
C, A-150 13.9-20
MeV T(d,n)
PTB
P. Pihet, S. Guldbakke, H.G. Menzel and H. Schuhmacher,
‘Measurement of kerma factors for carbon and A-150
plastic: neutron energies from 13.9 to 20.0 MeV’
Phys. Med. Biol. 37, 1957 (1992)
compile in
EXFOR
N, O, Ca 18-26 MeV ??
Ohio
Univ.
M.S. Islam, R.W. Finlay, J.S. Petler, J. Rapaport, R.
Alarcon and J. Wierzbicki, ‘Neutron scattering cross
sections and partial kerma values for oxygen, nitrogen and
calcium at 18 < En < 60 MeV’
Phys. Med. Biol. 33, 315 (1988)
compile in
EXFOR
C 14.6 MeV T(d,n)
RTNS-II,
LLNL
J.C. McDonald, ‘‘Calorimetric measurements for the
carbon kerma factor for 14.6-MeV neutrons,’’
Radiation Research 109 (1987) 28–35
compile in
EXFOR
C
total and
partial
96 MeV 7Li(p,n)
TSL
Uppsala.
B.E. Bergenwall, A. Atac and S. Kullander, ‘Experimental
kerma coefficients for carbon deduced from microscopic
cross sections at 96MeV incident neutron energy”,
Phys. Med. Biol. 49, 4523 (2004)
P. Mermod, J. Blomgren, C. Johansson, A. Ohrn, M.
Osterlund, S. Pomp et al. "95 MeV neutron scattering
on hydrogen, deuterium, carbon, and oxygen",
Phys. Rev. C 74, 054002 (2006)
compile in
EXFOR
has to be
added to
23030
C
elastic and
ineal kf
E = 16.5 –
22 MeV T(d,n)
gas target
University
Uppsala.
N. Olsson, B. Trostell, E. Ramstroem, "Cross sections and
partial KERMA factors for elastic and inelastic neutron
scattering from Carbon in the energy range 16.5 - 22.0
MEV",
Int. Conf. Nucl. Data Sci. & Techn., Mito, 1988, 1045
has to be
added to
22098
? ?? ??? L.S. August, P. Shapiro, R.B. Theus, Cross Sections and
Yields for High Energy Neutron Source Reactions.
National Bureau of Standards Report NBSIR 77-1279,
pp. 31-34, 1977
???
2.6. Some problems of photonuclear data compilation and evaluation, V. Varlamov
Experimental photonuclear data research is a complicated problem for several reasons:
absence of intensive monoenergetic photon beams (experimentalists are forced to use special
methods for production of quasimonoenergetic photon beams or to use special mathematical
methods for unfolding the results obtained using electron bremsstrahlung);
photoneutron reaction contribution as a main part of Giant Dipole Resonance (experimentalists are
forced to detect neutrons using detectors with low efficiency and not sufficient accuracy for
measurements of neutron energies);
direct methods of neutron registration frequently lead to missing contributions of accompanying
protons (because of low and close values of the correspondent reaction thresholds);
activation methods have many restrictions due to the properties of final nucleus decay.

20
As a result we have many data with significant systematic uncertainties obtained with the different
experimental measurement methods and/or data processing procedures. Therefore, there are many
problems in photonuclear data compilation and evaluation.
1. Total reaction SF1(G,SF3)SF4,,SIG) definition
In many sources of information a definition (, Sn) is used for neutron yield reaction (,Sn) = (,1n) +
2(,2n) + 3(,3n) - SF1(G,X)0-NN-1,,SIG), but in many others – for total photoneutron reaction (,Sn)
= (,1n) + (,2n) + (,3n) - SF1(G,X)0-NN-1,UNW,SIG).
Therefore, the compiler should be very careful (, Sn).
2. Partial reaction SF1(G,N(2N)(3N))SF4,,SIG) definition
In experiments with the direct identification of the reaction via final nucleus SF4 using the method of
induced activity the final nuclei are different, having different spectra of de-excitation g-quanta and,
therefore, SF4 defines SF3: (,1n), (,2n), (,3n), etc.
In experiments using the direct neutron multiplicity sorting methods, (,1n) and (,2n) reactions are
separated by detection of neutrons with different energy and therefore SF3 defines SF4. In such cases,
reactions with different outgoing particles can occur at the same energies: not (,1n) -
SF1(G,N)SF4,,SIG) but (,1n) + (,1np) – [SF1(G,N)SF4,,SIG)+ SF1(G,N+P)SF4p,,SIG)] and possibly
more [(,1n) + (,1n1p) + (,1n2p)], etc.
Therefore, the compiler should be very careful in partial reaction definition.
3. Systematic disagreements of data obtained with bremsstrahlung and quasimonoenergetic
annihilation photons.
3.1“Direct” measurement versus Inverse unfolding
One can measure only the reaction yield Y – folding of a cross section investigated with continuous -
spectrum using bremsstrahlung. The cross section is the result of solving the inverse unfolding task
using one of the special mathematical methods (photon difference, inverse matrix, least structure,
Penfold–Leiss, Tikhonov regularization, reduction, etc.) in accordance with the quasimonoenergetic
presentation of effective –quanta spectrum with a definite energy resolution equal to the width of line
in effective –spectrum.
An alternative to bremsstrahlung unfolding “direct” method of quasimonoenergetic annihilation photons
is the three step difference procedure: i) measurement of reaction yield Yp with spectrum as the sum of
photons from positron annihilation and bremsstrahlung, ii) measurement of yield Ye with photons from
electron bremsstrahlung, iii) subtraction of second result from the first one and definition the result Yp-
Ye as cross section with resolution equal to annihilation line. However, this is impossible: difference
between two results with bad resolution could not produce results with good resolution. If yes – that
would be the “perpetuum mobile”. As a result almost all cross sections obtained using annihilation
photons look like smoothed version of those obtained using the bremsstrahlung unfolding.
The difference of two yields is yield Yp-Ye = Y, not a cross section. Additional unfolding with
simulated -spectrum leads to a cross section close to that obtained using bremsstrahlung unfolding. The
real resolution of annihilation photons experiments is 4-6 time worse in comparison with annihilation
line width.
Therefore, there are the problems for compilers and evaluators: if Yp-Ye is interpreted as cross section
(INC-SOURE) (QMPH)) its resolution should be described as noticeably worse. If Ys-Ye = Y (not
(QMPH) but not (BRST)) additional unfolding is needed.

21
3.2 Systematic disagreements of partial photoneutron reaction cross sections obtained using
annihilation n photons in different laboratories.
The majority of partial reaction cross sections was obtained using annihilation photons at the Livermore
(USA) and Saclay (France) laboratories. Both laboratories employed the same assumption that the
neutron spectra of (, 1n), (, 2n) and (, 3n) reactions, and the methods for neutron kinetic energy
measurement used for multiplicity determination are quite different. Systematic discrepancies (up to
100 %) in partial photoneutron reaction cross sections are well–known: in many cases for the same
nuclei the (, 1n) reaction cross sections are noticeably larger at Saclay, but the (, 2n) cross sections
vice versa at Livermore.
Some objective criteria for data reliability were found out for the transitional multiplicity functions –
the ratios of the definite partial reaction cross sections (, in) to the neutron yield reaction cross section
(,Sn) = [(,1n) + 2(,2n) + 3(,3n) + …]. According to the definition F2 = (,2n)/(,Sn) cannot
exceed 0.50 in magnitude: larger value means a physically incorrect determination of (, 2n) and of
(,1n) reactions cross sections. The regions of physically unreliable values F2 > 0.50 (too large (,2n))
correlate with unreliable negative values (too small) in the (, 1n) reaction cross section.
Correspondingly, F1 should < 1.00, F3 < 0.33, F4 < 0.25, F5 < 0.20, F6 < 0.17, F7 < 0.14, etc. If these
functions (ratios) or Fi go beyond absolute limits mentioned that means that neutron multiplicity sorting
was erroneous.
Investigations of 90,91,94
Zr, 115
In, 112–124
Sn, 159
Tb, 165
Ho, 181
Ta, 188,189,190,192
Os, 197
Au and 208
Pb
experimental data obtained using neutron multiplicity sorting show that as a rule of thumb they do not
satisfy proposed criteria of data reliability. A new method of evaluation based on the well–tested data
combined with a theoretical model of photonuclear reactions was proposed as a method of satisfied
introduced criteria. Initial data include experimental neutron yield reaction cross sections exp
(, Sn) and
neutron multiplicity sorting functions calculated in the model Fitheor:
eval(,in) = Fi
theor exp
(,Sn).
That means that the competition of partial reactions (,1n), (,2n), (,3n),… is in accordance with
equations of the model and the correspondent sum of evaluated partial reaction cross sections –
eval
(,Sn) = eval
(,1n) + 2eval
(,2n) + 3eval
(,3n) – is equal to the experimental exp
(,Sn).
Data evaluated using this approach noticeably disagree with both Saclay and Livermore data but agree
with the data obtained using alternative activation method.
That means that many well-known experimental partial photoneutron reaction cross sections are not
reliable and should be re-measured and/or evaluated using appropriate data reliability criteria.
2.7. Compilation of neutron data in the resolved resonance region measured by TOF method.
Spectrometers’ response function, V. Semkova
The nuclear data for the neutron-induced reaction in the resonance range have been extensively
compiled in EXFOR. However, in many cases only the resonance parameters are reported. Some
experimentalists have provided also raw data such as transmission and capture yields. The time-of-flight
spectra are valuable for future analysis (reanalysis, simultaneous analysis) and compilation of them has
been desired of the NRCD community for many decades. Proper analyses require additional
experimental information such as sample thickness (affecting self- shielding, multiple collisions) and
response function (RF). The spectrometers’ response functions are needed for comparison of data
measured at different experimental facilities. The resolution broadening has to be applied to evaluated
data in order to compare experimental data with the evaluation. A template was developed at the
Consultants' Meeting “EXFOR Data in Resonance Region and Spectrometer Response Function” that

22
includes all essential information for a time-of-flight measurement. The template is available at the
https://www-nds.iaea.org/index-meeting-crp/CM-RF-2013/ webpage and compilers are advised to use it
in order to request and compile information from the experimentalists. In addition, the main uncertainty
components have to be identified and the correlated and uncorrelated components have to be reported
separately, preferably based on the AGS-concept.
During the Meeting, possibilities for the compilation in EXFOR of the TOF spectrometer response
functions which is required for the neutron spectroscopy applications were discussed. The broadening
components and the intrinsic widths of resonances are usually non-Gaussian and, therefore, need to be
taken into account by a full convolution of the corresponding distributions. The RF consists of a number
of independent contributions: the distribution of the pulsed charged particle beam, serving as a start of
the time-of-flight measurement; the neutron producing target and moderator ensemble; interactions in
the sample and detector ensemble; electronic noise from the signal processing and data acquisition
system; the widths of the data binning. In the R-matrix codes (SAMMY, REFIT), the RFs are presented
by analytical expressions that contain a number of components. The parameterization for the specific
facility/experiment is usually obtained by a fitting procedure. Some experimentalists have recently
submitted the analytical functions and the fitting parameters for their experiments to EXFOR. For some
facilities the RFs have been determined by Monte Carlo simulations. While a parameterized analytical
function may in some cases be an adequate description of a RF, nowadays Monte Carlo simulations can
provide the RF in a detailed way. Storage of the RF in EXFOR in numerical form or possibly even as
input file for a Monte Carlo description or R-matrix analysis codes would preserve this information in a
sustainable way. The following recommendations for the development of the RF compilation rules in
EXFOR were discussed during the Meeting:
Best solution for target/moderator: matrix of (En, d) (use a dense enough grid for En and for d);
Flexibility: allow also (En, t) or even (En, E’) matrices (code input is often as (En, t));
Flexibility: allow additional components in either time (pulse width), distance, or energy;
For existing measurements, also supply support for analytical expressions;
Possibility to associate several RFs with a measurement (for example, target/moderator + pulse
width + sample/detector);
Define unique and informative tags for RFs, allowing for possible upgrades of a particular RF.
2.8. Neutron source spectra format. EXFOR formats and rules: present status and proposals for
neutron source data storage, O. Gritzay
The following proposal for the source spectral information storage in EXFOR was suggested in
INDC(NDS)-0590 to introduce into EXFOR new special ENTRY/SUBENTRY for neutron spectrum.
New: type of spectrum and its characteristic should be entered in numeric data type using separate
SUBENTRY or ENTRY for neutron spectrum if the spectrum is commonly applied to measurements
performed at the neutron source.
1. Use special form of REACTION to define the neutron source (see table below) with the proper
modifier SPD to REACTION SF8.
2. Use DATA to enter the numerical spectral data.
3. Data that are averaged over broad incident-projectile energy spectrum and entered into the
EXFOR system, should be labelled by the keyword INC-SOURCE with use of all relevant
keywords from the Inc-Source Dictionary (#19) and the cross-reference to the EXFOR
entry/subentry with these numerical spectral data.
4. This cross-reference must be coded as an eight-digit integer

23
Unfortunately, this proposal was not realized.
We continue to use the following rules:
LEXOR:
Spectrum Average
Cross sections averaged over a broad incident-projectile energy spectrum may be entered into EXFOR
using the proper modifier to REACTION SF8. The type of spectrum and its characteristic should be
entered in free text under the information-identifier keyword INC-SPECT.
The following spectrum types are defined:
1. Maxwellian Average: Modifier MXW
2. The spectrum temperature should be given, if known. For thermal Maxwellian spectrum
averaged data, see Thermal Neutron Energies.
3. Epithermal Spectrum Average: Modifier EPI
4. The energy quoted will be, typically the low energy cut off.
5. Fission-Neutron Spectrum Average: Modifier FIS
6. For details, see Fission-Neutron Spectra.
7. Fast Reactor Spectrum Average: Modifier FST
8. Bremsstrahlung Spectrum Average: Modifier BRA
9. The energy quoted will be, typically, EN-MAX, or EN-MIN with EN-MAX.
10. Average over “good resolution” Bremsstrahlung Spectrum: Modifier BRS
11. The energy quoted will be, typically, EN with EN-RSL.
12. Spectrum Average (unspecified Spectrum): Modifier SPA
13. Used for all other spectra, e.g., thermal reactor spectra. Care should be taken to compile only
those data that would be of value to the user of EXFOR.
EXFOR Formats Manual (Chapter 7):
INFORMATION-IDENTIFIER KEYWORDS AND CODING RULES
INC-SPECT. Provides information on the characteristics and resolution of the incident-projectile
beam. See also LEXFOR, Incident-Projectile Energy.
1. Must be present when a spectrum average modifier (e.g., MXW, SPA, or FIS) is present in
REACTION SF8. See also LEXFOR, Spectrum Average. Otherwise its use is optional. No coded
information.
However even if the data for the incident spectrum are provided in the compilation the spectrum
retrieval is not easy and plotting is not possible with the current compilation rules.
Free text presentation of the incident spectrum makes the search difficult and plotting capabilities of the
retrieval system cannot be applied. Such presentation is often lengthy. For example, in Subentry
22850001 it has 699 lines (from 769 lines); in Subentry 23075001 it has 230 lines (from 326 lines). The
length of the text can be up to thousands of lines in case of spectra for average cross sections measured
by proton recoil counters using the NFBT. If several spectra are compiled in free text it is very difficult
to find where one ends and the next spectrum starts. is not convenient.
Based on the proposal given in the beginning the following revision of the LEXFOR manual is
proposed:

24
Spectrum Average
Cross sections averaged over a broad incident-projectile energy spectrum may be entered into EXFOR
using the proper modifier to REACTION SF8. The type of spectrum and its characteristic should be
entered in free text under the information-identifier keyword INC-SPECT or in numeric data type
using separate special SUBENTRY or ENTRY.
Data that are averaged over broad incident-projectile energy spectrum and entered into the EXFOR
system, should be labelled with the code DEP under the keyword STATUS, if the spectrum is entered
into the EXFOR system in numeric data type.
In these special SUBENTRY/ ENTRY
1) use a special form of REACTION to define the neutron source (see table below) with the proper
modifier SPD to REACTION SF8;
2) use DATA to enter the numerical spectral data.
Dependent Data
Data that are deduced by a trivial operation from other data sets entered into the EXFOR System or
data, that are averaged over broad incident-projectile energy spectrum entered into the EXFOR system
in numeric data type (using special SUBENTRY/ENTRY) should be labelled with the code DEP under
the keyword STATUS. Free text under STATUS and/or ANALYSIS should give information as to how
the data were deduced. Cross reference to the EXFOR entries from which the data were deduced or to
the EXFOR entries with spectrum in numeric data type must be coded as an eight-digit integer
following the code.
The EXFOR rules for INC-SPECT and INC-SOURCE remain the same.
The following coding is proposed in order to define the neutron source by REACTION:
REACTION is a reaction by which neutrons are generated.
SF1 – target, SF2 – incident particle (SF2=0 for spontaneous fission),
SF3 – outgoing particle/product X (SF3=F for spontaneous fission),
SF4 – outgoing neutron 0-NN-1,
SF6 – Differential with energy of outgoing particle (neutron),
SF8 – SF8=SPD – Spectrum Description, SPD/REL Relative data (ARB-UNITS)
SF9 – CALC/EXP Calculated/Experimental data
Name of neutron source In INC-SPECT SF1-SF8 in REACTION
in SubEntry with SF8= SPD
Alpha-Beryllium A-BE 4-BE-9(A,X)0-NN-1,, DE,,SPD
Americium-Beryllium ns AM-BE 4-BE-9(A,X)0-NN-1,, DE,,SPD ?
Spont. fission of Californium-252 CF252 98-CF-252(0,F)0-NN-1,, DE,,SPD
Spont. fission of Curium-244 CM244 96-CM-244(0,F) 0-NN-1,, DE,,SPD
Spont. fission of Curium-246 CM246 96-CM-246(0,F) 0-NN-1,, DE,,SPD
Spont. fission of Curium-248 CM248 96-CM-248(0,F) 0-NN-1,, DE,,SPD
Deuteron-Beryllium D-BE 4-BE-9(D,X)0-NN-1,, DE,,SPD
Deuteron-Carbon 12 D-C12 6-C-12(D,X) 0-NN-1,, DE,,SPD
Deuteron-Carbon 14 D-C14 6-C-14(D,X) 0-NN-1,, DE,,SPD

25
Name of neutron source In INC-SPECT SF1-SF8 in REACTION
in SubEntry with SF8= SPD
Deuteron-Deuterium D-D 1-H-2(D,X) 0-NN-1,, DE,,SPD
Deuteron-Lithium D-LI 3-LI-0(D,X) 0-NN-1,, DE,,SPD
Deuteron-Lithium 7 D-LI7 3-LI-7(D,X) 0-NN-1,, DE,,SPD
Deuteron-Nitrogen 14 D-N14 7-N-14(D,X) 0-NN-1,, DE,,SPD
Deuteron-Nitrogen 15 D-N15 7-N-15(D,X) 0-NN-1,, DE,,SPD
Deuteron-Tritium D-T 1-H-3(D,X) 0-NN-1,, DE,,SPD
Evaporation neutrons EVAP 13-Al-0(P,X) 0-NN-1,, DE,,SPD
74-W-0(P,X) 0-NN-1,, DE,,SPD
82-Pb-0(P,X) 0-NN-1,, DE,,SPD
92-U-0(D,X) 0-NN-1,, DE,,SPD
…
Nuclear explosive device EXPLO Entries with SPA are absent in EXFOR.
Time-of-flight method was used
Proton-Beryllium P-BE 4-BE-9(P, X) 0-NN-1,, DE,,SPD
Proton-Deuterium P-D 1-H-2(P, X) 0-NN-1,, DE,,SPD
Photo-neutron PHOTO 1-H-2(G,X) 0-NN-1,, DE,,SPD
13-Al-0(G,X) 0-NN-1,, DE,,SPD
92-U-0(G,X) 0-NN-1,, DE,,SPD
...
Proton-Lithium 7 P-LI7 3-LI-7(P,X) 0-NN-1,, DE,,SPD
Polarized neutron source POLNS Entries with SPA are absent in EXFOR.
Proton-Tritium P-T 1-H-3(P,X) 0-NN-1,, DE,,SPD
Plutonium-Beryllium ns AM-BE 4-BE-9(A,X) 0-NN-1,, DE,,SPD ?
Spont. fission of Plutonium-240 PU240 94-PU-240(0,F) 0-NN-1,, DE,,SPD
Spont. fission of Plutonium-242 PU242 94-PU-242(0,F) 0-NN-1,, DE,,SPD
Reactor REAC 92-U-235(N,X) 0-NN-1,, DE,,SPD
or 92-U-0(N,X) 0-NN-1,, DE,,SPD
Thermal column THCOL 92-U-235(N,X) 0-NN-1,, DE,,SPD
Thorium-Beryllium ns TH-BE 4-BE-9(A,X) 0-NN-1,, DE,,SPD ?
An example of a compilation of an experiment with filtered neutron beam is given below:
ENTRY 32238 20140507 32238 0 1
SUBENT 32238001 20140507 32238 1 1
BIB 12 35 32238 1 2
INSTITUTE (4UKRIJD,4UKRUKR)4UKRUKR - State Scientific-Engineering 32238 1 3
Center for Control and Emergency Response, Kyiv 32238 1 4
REFERENCE (C,2012KYIV,,430,2013) 32238 1 5
AUTHOR (O.O.Gritzay, A.K.Grymalo, V.V.Kolotyi, V.A.Pshenychnyi, V.P.Shakhov, V.M.Venedyktov)
TITLE Determination of total neutron cross section of 52Cr with using average energy 32238 1 9
shift method for filtered neutron beam 32238 1 10
FACILITY (REAC,4UKRIJD) Reactor WWR-M 32238 1 12
INC-SOURCE (REAC) Neutron filter installed in horizontal channel of the reactor. 32238 1 13
Filter components: S-116.53 g/cm2, 32238 1 14
58Ni-81.42g/cm2,V-24.44g/cm2,Al-5.4g/cm2,10B-0.5g/cm2. 32238 1 15
The calculated energy and width of the neutron line (95% response function) after 32238 1 16
this filter are: 59 (+1.2, -6.7) keV. 32238 1 17
Calculated and experimental spectra after this filter are presented 32238 1 19
in 32238002 and 32238003. 32238 1 20
INC-SPECT The initial neutron line with the average energy 59 keV produces at the 32238 1 21
scattering angles 15, 20 and 25 ADEG the scattered neutron lines with the average 32238 1 22

26
energies 55, 52, 48.4 keV and 58.6, 58.3, 58 keV if neutrons are scattered by 32238 1 23
hydrogen and carbon, respectively. Thickness of the used scattering-samples C and 32238 1 25
CH2 was 10.02+-0.01 and 4.52+-0.01 mm. 32238 1 26
METHOD (FNB,TRN) Transmission measurement of the scattered filtered neutrons. 32238 1 28
DETECTOR (PROPC) The proton recoil detector LND-281 (gas filling H+CH4+N2, 32238 1 30
diameter-38.1 mm length-254.0 mm, gas pressure-3240 torr) 32238 1 31
SAMPLE 52Cr sample was made of a metal powder, loaded into aluminum container. 32238 1 33
A thickness of the 52Cr sample was 0.0173+-0.0002 atoms/barn. 32238 1 34
STATUS (TABLE) From text 32238 1 36
HISTORY (20140425) UKRNDC 32238 1 37
ENDBIB 35 0 32238 1 38
NOCOMMON 0 0 32238 1 39
ENDSUBENT 38 0 32238 199999
SUBENT 32238002 20140507 32238 2 1
BIB 1 8 32238 2 2
REACTION (92-U-235(N,X)0-NN-1,,DE,,SPA/REL,CALC) 32238 2 3
Calculated was done by FILTER-7 using JENDL-3.3 (58Ni-81.42 g/cm2, 10B-0.5 g/cm2, 32238 2 4
11B-0.088 g/cm2, 27Al-5.4 g/cm2, Vnat-24.44 g/cm2), CENDL-2(Snat-116.53 g/cm2). 32238 2 5
Calculated energy line is 58.98 keV, purity about 95%. The limits of 95% response 32238 2 7
function for the 59 keV filter spectrum were defined as 52.111 to 60.319 keV. 32238 2 9
ENDBIB 8 0 32238 2 11
COMMON 2 3 32238 2 12
EN-MIN EN-MAX 32238 2 13
EV MEV 32238 2 14
1.e-5 20. 32238 2 15
ENDCOMMON 3 0 32238 2 16
DATA 2 1201 32238 2 17
E DATA 32238 2 18
KEV ARB-UNITS 32238 2 19
40.5499 .318100E-01 32238 2 20
40.6795 .370900E-01 32238 2 21
…
61.5046 .689100E-01 32238 2 1219
61.5322 .474500E-01 32238 2 1220
ENDDATA 1203 0 32238 2 1221
ENDSUBENT 1220 0 32238 299999
SUBENT 32238003 20140507 32238 3 1
BIB 1 1 32238 3 2
REACTION (92-U-235(N,X)0-NN-1,,DE,,SPA/REL,EXP) 32238 3 3
ENDBIB 1 0 32238 3 4
COMMON 2 3 32238 3 5
EN-MIN EN-MAX 32238 3 6
EV MEV 32238 3 7
1.e-5 20. 32238 3 8
ENDCOMMON 3 0 32238 3 9
DATA 3 240 32238 3 10
E DATA DATA-ERR 32238 3 11
KEV NO-DIM NO-DIM 32238 3 12
39.9696 2.8626 0.0320 32238 3 13
40.0953 2.7958 0.0301 32238 3 14
…
69.8826 1.0589 0.1184 32238 3 251
70.0083 0.9470 0.0985 32238 3 252
ENDDATA 242 0 32238 3 253
ENDSUBENT 252 0 32238 399999
SUBENT 32238004 20140507 32238 4 1
BIB 5 24 32238 4 2
REACTION (24-CR-52(N,TOT),,SIG,,SPA) 32238 4 3
INC-SOURCE (REAC) 32238 4 4
STATUS (DEP,32238002)Calculated neutron spectrum after filter 32238 4 5
(DEP,32238003)Experimental neutron spectrum after filter 32238 4 6
(DEP,32238005) Scattered neutron spectrum at the angle 15 ADEG (55 keV) 32238 4 8
calculated by the MCNP 4C code 32238 4 9
(DEP,32238006) Scattered neutron spectrum at the angle 20 ADEG (52 keV) 32238 4 10
calculated by the MCNP 4C code 32238 4 11
(DEP,32238007)Scattered neutron spectrum at the angle 25 ADEG (48.8 keV) 32238 4 12
calculated by the MCNP 4C code 32238 4 13
COMMENT Correction connected with existence in the neutron scattered spectrum on 32238 4 14
CH2 neutrons scattered on carbon was done. A correction on the self-shielded effect 32238 4 15
was not be done for the measured values of the total cross sections of 52Cr. 32238 4 16
The rough estimation, done by the MCNP 4C code calc., shown that the difference 32238 4 18
between the total cross sections at these energies and the observed self-shielded 32238 4 20
cross sections may rich 2-6%. 32238 4 21
ERR-ANALYS Total error includes: 32238 4 22

27
- statistical error of the transmission measurements; 32238 4 23
- measurement errors of dimension and weight of the sample; 32238 4 24
- error due to presence of impurities in the sample. 32238 4 25
ENDBIB 24 0 32238 4 27
NOCOMMON 0 0 32238 4 28
DATA 3 3 32238 4 29
EN DATA ERR-T 32238 4 30
KEV B B 32238 4 31
48.8 5.94 0.49 32238 4 32
52. 18.29 0.89 32238 4 33
55. 9.27 0.51 32238 4 34
ENDDATA 5 0 32238 4 35
ENDSUBENT 34 0 32238 499999
SUBENT 32238005 20140507 32238 5 1
BIB 1 3 32238 5 2
REACTION (92-U-235(N,X)0-NN-1,,DE,,SPA/REL,CALC) 32238 5 3 <-SPD
Scattered neutron spectrum at angle 15 deg. (55 keV) calculated by the MCNP 4C code 32238 5 4
ENDBIB 3 0 32238 5 6
COMMON 2 3 32238 5 7
EN-MIN EN-MAX 32238 5 8
EV MEV 32238 5 9
1.e-5 20. 32238 5 10
ENDCOMMON 3 0 32238 5 11
DATA 2 248 32238 5 12
E DATA 32238 5 13
KEV ARB-UNITS 32238 5 14
40.006 0.108 32238 5 15
40.087 0.095 32238 5 16
…
59.969 0.065 32238 5 261
60.050 0.063 32238 5 262
ENDDATA 250 0 32238 5 263
ENDSUBENT 262 0 32238 599999
SUBENT 32238006 20140507 32238 6 1
BIB 1 3 32238 6 2
REACTION (92-U-235(N,X)0-NN-1,,DE,,SPA/REL,CALC) 32238 6 3 <-SPD
Scattered neutron spectrum at angle 20 deg. (52 keV) calc. by the MCNP 4C code 32238 6 4
ENDBIB 3 0 32238 6 6
COMMON 2 3 32238 6 7
EN-MIN EN-MAX 32238 6 8
EV MEV 32238 6 9
1.e-5 20. 32238 6 10
ENDCOMMON 3 0 32238 6 11
DATA 2 248 32238 6 12
E DATA 32238 6 13
KEV ARB-UNITS 32238 6 14
40.006 0.116 32238 6 15
40.087 0.156 32238 6 16
…
59.969 0.038 32238 6 261
60.050 0.010 32238 6 262
ENDDATA 250 0 32238 6 263
ENDSUBENT 262 0 32238 699999
SUBENT 32238007 20140507 32238 7 1
BIB 1 3 32238 7 2
REACTION (92-U-235(N,X)0-NN-1,,DE,,SPA/REL,CALC) 32238 7 3 <-SPD
Scattered neutron spectrum at angle 25 deg. (48.8 keV) calc. by the MCNP 4C code 32238 7 4
ENDBIB 3 0 32238 7 6
COMMON 2 3 32238 7 7
EN-MIN EN-MAX 32238 7 8
EV MEV 32238 7 9
1.e-5 20. 32238 7 10
ENDCOMMON 3 0 32238 7 11
DATA 2 309 32238 7 12
E DATA 32238 7 13
EV ARB-UNITS 32238 7 14
35.056 0.110 32238 7 15
35.137 0.115 32238 7 16
…
59.969 0.031 32238 7 322
60.050 0.014 32238 7 323
ENDDATA 311 0 32238 7 324
ENDSUBENT 323 0 32238 799999
ENDENTRY 7

28
2.9. Nuclear astrophysics data. Calculations of nuclear astrophysics and californium neutron
cross section uncertainties using ENDF/B-VII.1, JEFF-3.1.2, JENDL-4.0 and low-fidelity
covariances, B. Pritychenko
Nuclear astrophysics and californium fission neutron spectrum averaged cross sections and their
uncertainties for ENDF materials have been calculated. Absolute values were deduced with Maxwellian
and Mannhart spectra, while uncertainties are based on ENDF/B-VII.1, JEFF-3.1.2, JENDL-4.0 and
Low-Fidelity covariances. These quantities are compared with available data, independent benchmarks,
EXFOR library, and analyzed for a wide range of cases. Recommendations for neutron cross section
covariances are given and implications are discussed. These findings are published in Nucl. Data Sheets
123, 119 (2015).
2.10. Structure of software on graphic data processing for the EXFOR data library, G. Pikulina,
S.Taova, S. Dunaeva
The previous version of InpGraph was designed more than 10 years ago. It was developed for our
internal needs only. The main advantage of this version is a special processing procedure that provides
compilation of image data of old images into EXFOR format. But the old version of InpGraph demands
additional training of users as a strict order of digitizing operations is needed. This fact decreases the
number of its potential users.
Nowadays the user’s interface requirements have radically changed. So, we have decided to follow
modern trends and create a user friendly interface.
The main idea was to design an intuitively understandable interface with the convenient tools for data
digitizing. We tried to implement an approach of “identical user’s reactions on identical user’s actions”.
Also we decided to use Wizard technology as an additional helper function for step instructions and
hints during digitizing.
We implemented a selection of possible values from lists, automatic searching and automatic input,
automatic checking on the input stage to minimize manual data input volume and to decrease possible
error quantities.
This work was taken up two years ago.
We have analyzed different digitizing software (GetData Graph Digitizer, Graph2Digit, G3Date,
Grafula) including GSYS and GDgraph.
We took into account the experience of the previous version use, feedbacks and proposals of the users.
We developed a flexible structure of InpGraph, new version and its internal data. Improvement and
modification of our software are simpler for implementation now.
An algorithm of image processing for the EXFOR data base is implemented as a sequence of the
following steps:
1. Import image into the program environment;
2. Edit the image if it is necessary;
3. Input service information as the EXFOR format demands;
4. Set axes, their names, units, directions;
5. Digitize data curves;
6. Process data and obtain physical data values;
7. Save compiled data in the EXFOR file.

29
The InpGraph structure makes it possible to return at any digitizing stage and then edit the input data.
This version of InpGraph does not require a strict order of operations.
We kept all advantages of the previous version of InpGraph in the new one:
special math software compiles image data form old sources of low quality;
digitizing and quantization errors are calculated;
check of scale correctness is provided at the stage of data input and while creating the
EXFOR file;
traditional lens with separate points division is used for digitization:
consequent creation of service files (AXS, SRC) with a possibility of their correction is
supported;
EXFOR-oriented data treatment including EXFOR format of the output file is implemented.
Summary of the new features of InpGraph:
Operation of the initial data image loading is implemented in three ways: open any image format
file, paste an image from clipboard or capture a part of screen.
Input of service information has been optimized: EXFOR Dictionaries are used now.
Procedure of data digitizing has been modified: automatic marking of axes has been
implemented, editing of point positions and using of different colors and markers has been
provided.
Strict order of digitization is optional now. User can add any amount of abscissa and ordinate
axes at any digitizing stage. Every axis has its own name. While digitizing curves, the user
should select axes for every curve from the list available.
Results of digitizing are stored in files with EXF extension. Service files with the extensions
AXS, SRC are also created during compilation. Special edit windows are provided to make
corrections (if necessary) in these files.
Thus, the new InpGraph version has all the advantages of the old one. We have tried to make it more
convenient for the users. Now we are presenting the beta-version of InpGraph 3.0. Feedback and
proposals from users is welcome and will all be taken into account. We are going to continue this
development.
2.11. Introduction to the digitization software GDgraph, Guochang Chen (Yongli Jin, Jimin
Wang, CNDC, China)
1. Introduction
GDgraph is a software for digitization. Since 1997, CNDC has been devoted to develop a software for
digitization. The first version of digitization software GDGraph was developed and released in 2000
using VC++ language. Five years later, we collected much feedback information on update and bugs of
this software. The 2nd
version of GDGraph software was released at 2006, in which the whole software
was re-written using a Perl computer language to obtain more comfortable conditions for programming
and updating. The version 3.0, 4.0 and 5.0 of GDGraph was released in 2011, 2012 and 2013,
respectively.
2. Main feature of GDGraph5.0
(1) Operating system: WindowsXP or the later version of Windows.
(2) Intuitive and light GUI: Provides Chinese and English version GUI.
(3) Supports image format: such as PNG, GIF, BMP and JPEG etc.
(4) The image can be automatically fit to the GUI windowwith zoom-in or zoom-out manually together

30
with the digitizing X, Y axis.
(5) Allows to rotate the image and set a rotation angle with degree unit.
(6) The maximum digitizing data group number is three, and the colour, size and shape of each group
can be defined by user using “Settings” function.
(7) Randomly adds the digitizing point and move it by mouse or cursor keys.
(8) Output data can be saved as a data file or at clipboard.
(9) Import data function enables to reuse the former digitizing data or compare with other data group
easily.
(10) X, Y axes: Select or set a unit for X, Y data by user is available. Allows to digitize X, Y error with
symmetry or asymmetry mode and move it using mouse or cursor keys, and set a fix value with relative
(%) or absolute mode.
(11) Magnifying glass function: magnifies the local area of the image, and the window size can be set
from 200% to 800% and be moved by mouse. The partial image in the magnifying glass window can be
magnified by 2 or 4 times.
(12) Setting the colour, size and shape of digitizing point, the background with or without gridding
lines, output digitizing numerical data format is available.
(13) Project function: It is used to save an image, digitizing results with other settings as a project file
*.GDP for checking and modification in the future.
(14) Remark function is applied to keep some marks and memo text for checking, modification and
memory by user.
3. Basic Functions of GDGraph5.0
3.1. Loading an image file
There have been some options to load an image. One is using “Load Graph File” from the “File” menu
in the menu bar. Select an image file (as PNG, GIF, BMP or JPEG etc.) from a file dialog box in a new
window and load the image with original size as default. Another way is to directly copy an image
using clipboard from other file such as MS Word, PDF, etc. If an image file is successfully loaded, the
image is displayed on the main panel as shown in Fig. 1. It is allowed to rotate with an setting angle,
zoom in, zoom out, auto fit to the GUI window and revert the image size.
Fig. 1: An image loads on the main panel.

31
3.2. Setting axes
Use cross lines to set the X-Y axis, and adjust the square symbols of the starting, middle and ending
positions of X-Y axis to fit the image one. Then select the X-Y axis type as Linear-Linear, Linear-Log,
Log-Linear or Log-Log. According to the cross line positions, fill in the starting and ending value of X-
Y axes, and select or fill in units for X-Y axes at “Coordinate System” in “Control Panel” for
identifying the digitizing data in the output data file, respectively. When we set or adjust the positions
of axis, there exists an orthogonal frame to assist confirmation of the position of axes. When you finish
setting the axis, you will see a window as shown in Fig. 2.
Fig. 2: Window after setting axes with squares.
3.3. Digitizing the data and their uncertainties
Activate the check box “Add points” to start digitization process. If you need to digitize more than one
group points, please select which group you want to digitize or modify the original digitizing results. If
you click on the image in the data input mode, a digitizing data point is added on the image. Continue to
click the image until all the data points are added. When you finish adding the data points, you will see
a window as shown in part (a) in Fig. 3.
The function of digitizing data point error is available with asymmetric or symmetric now. First of all,
disable the “Add points” mode. Then, to select each error mode for X/Y with asymmetric or symmetric.
The default error mode of X/Y is asymmetric. To set a symmetric error for X or Y, first select X-axis or
Y-axis at “Axis” list box in “Errors” part, then click “Symmetric” check box. After that, click a data
point to activate it which will make 4 red square symbols appear around it. In this mode, move data
point by mouse or cursor keys or set a fix value as X-Y error. The left and right square symbols
represent X-Err-/X-Err+, and the bottom and top symbols represent Y-Err-/Y-Err+. If you obtain the
information of X-Y uncertainty from paper or other data sources, you can directly fill in a fixed value as
X-Y uncertainty with relative (%, in percent) or absolute mode. You can directly use the mouse to pull
one of four red squares to obtain X-Y error. On the other hand, you can apply “Arrows4Errors” function
using cursor keys to move one of four red squares to proper position. After inputting errors, you will see
a window as shown in part (b) of the Fig. 3. After digitizing one point, the “Pageup” or “Pagedown”
key can be used to activate the previous or next data point.

32
(a) Reading the data points (b) Reading the data errors
Fig. 3: Window after reading the data points and errors.
3.4. Outputting the digitizing result
Select “Save Data File” from the “File” menu or directly use “Ctrl+C” to copy all digitizing results to
clipboard and paste to other applications. The output data are in exponential or floating formats, and the
number of digits can be set using the “Settings” function. Each data can be set as 11 columns to fit
EXFOR format requirements. The output file contains the information of each group No., number of
data points, name of each column and digitizing data. Each group output contains X, Y, Y-Err+, Y-Err-,
X-Err-, and X-Err+ as shown in Fig. 4.
Fig. 4: An example of outputting numerical data file.
4. Conclusion
Since 1997, the digitization software GDgraph has been developed to fit the requirements of evaluation,
measurement and EXFOR compilation. From the old software to the present version 5.0, GDgraph does
mainly fit the requirements, although some modifications and additions of new functions are needed.

33
2.12. Status of the compiled Neutron Spectra in EXFOR. Summary of discussions held at the
Workshop and further developments, S. Simakov, N. Otuka, V. Semkova, V. Zerkin
1. History
The issue of compilation of Neutron Spectra in EXFOR was initially addressed at the IAEA
Consultants' Meeting on “Neutron Sources Spectra for EXFOR” (13- 15 April 2011, IAEA), see:
- Summary Report INDC(NDS)-0590
- Presentations: https://www-nds.iaea.org/index-meeting-crp/CM-2011_web/ .
2. Current status of EXFOR
NDS has searched the EXFOR database for Entries with Neutron and Photon Source Spectra
information (energy distribution) which are collected under the keyword INC-SPECT.
The non-monoenergetic neutron sources are used for the measurements of Spectrum Averaged cross
sections (SPA), fission yields and other physical quantities. This information is coded in the
REACTION string, the numerical data are compiled in block DATA in the same Entry.
The results of search are summarised in Table 1 (around 17 Entries were found with the source energy
distribution in INC-SPECT) and in Table 2 (no energy spectra, however with some additional
information about neutron source).
Table 1. Entries with the neutron source energy distribution after keyword INC-SPECT.
INC-
SOURCE
Lab
First Author
n-Source
description
EXFOR Entries with INC-SPECT
having n-Source spectral information
Reactor facilities
REAC AERE, Dhaka
M.S. Uddin
TRIGA Mark II
LEU fuel, core
31733
http://www-nds.iaea.org/EXFOR/31733.002 REAC KUR,
I. Kimura
6Li-D convertor
behind C-column
22214
http://www-nds.iaea.org/EXFOR/22214.007 REAC TOK, Tokyo
H. Harada
YAYOI Reactor,
Glory hole
23075
http://www-nds.iaea.org/EXFOR/23075.002 REAC CEA, Cadarache
A. Cricchio
Rapsodie fast reactor
fuel pins
21816
http://www-nds.iaea.org/EXFOR/21816.002 REAC INL, Idaho
I. Glagolenko
EBR-II,
control rods
31686
http://www-nds.iaea.org/EXFOR/31686.002 REAC IPPE, Obninsk
V.I. Ivanov
BR-5,
PuO2 core
40308
http://www-nds.iaea.org/EXFOR/40308.007 REAC IPPE, Obninsk
G.V. Anikin
beam from BR-5,
Shapes of 6 n-lines ?
40080
http://www-nds.iaea.org/EXFOR/40080.001
Radioactive sources
AM-BE Bangladesh
S. Qaim
Am-Be in
polyethylene
31724
http://www-nds.iaea.org/EXFOR/31724.002
Accelerator based sources
P-LI7 TIT, Tokyo
T. Matsumoto
thick 7Li(p,n)
Ep = 1.9 – 2.3 MeV
22850
http://www-nds.iaea.org/EXFOR/22850.005 P-LI7 TIT, Tokyo
K.Terada
thick 7Li(p,n)
Ep = 1.9, ?? MeV
23187
http://www-nds.iaea.org/EXFOR/23187.003 P-LI7 TIT, Tokyo
T. Wang
thin 7Li(p,n)
Ep = 1.9, 2.3 MeV
23103
http://www-nds.iaea.org/EXFOR/23103.002

34
INC-
SOURCE
Lab
First Author
n-Source
description
EXFOR Entries with INC-SPECT
having n-Source spectral information
P-LI7 Manipal
H. Naik
thin 7Li(p,n)
Ep = 5.6 MeV
33033
http://www-nds.iaea.org/EXFOR/33033.004 P-LI7 KFK, Karlsruhe
F. Kaeppeler
thick 7Li(p,n) O1963
http://www-nds.iaea.org/EXFOR/O1963.002
this source was used to measure many (n,γ) SPA,
e.g. http://www-nds.iaea.org/EXFOR/22996.003
(link to O1963 should be included ?) P-LI7 TSL, Uppsala
R. Bevilacqua
thin 7Li(p,n)
Ep = 179 MeV
23129
http://www-nds.iaea.org/EXFOR/23129.002
(should be comp. as separated p-Li spectrum ?) P-BE9 WERC, Japan
M.S. Uddin
Be(p,xn)
Ep = 7.7 MeV
23238
http://www-nds.iaea.org/EXFOR/23238.002
(4 energy groups flux is given) D-BE9 ANL
S. Liskien
thick 9Be(d,xn)
Ed = 7 MeV
21857
http://www-nds.iaea.org/EXFOR/21857.002 SPALL JINR, Dubna
C. Bhatia
Pb + U blanket
Ed = 1.6 GeV
41529
http://www-nds.iaea.org/EXFOR/41529.002
41565
http://www-nds.iaea.org/EXFOR/41565.002 D-D
D-T FNG, Frascati
M. Pillon
solid TiT, D targets
Ed = 0.3 MeV
23127
http://www-nds.iaea.org/EXFOR/23127.002
(n-spectra is available - has to be compiled)
Table 2. Entries which do not have source energy distribution in INC-SPECT, however provide some numerical
information about neutron filed. INC-
SOURCE
Lab
First Author
n-Source
description
EXFOR Entries with INC-SPECT
having n-Source spectral information
P-LI7
P-T
IRMM, Geel
E. Birgersson
7LiF(p,n), T(p,n)
Ep = MeV
23054
http://www-nds.iaea.org/EXFOR/23054.002
(only neutron energy resolution is given …)
D-D Mexico
E. Chavez
D(d,xn)
Ed = 3.7 -5.2 MeV
31687
http://www-nds.iaea.org/EXFOR/31687.002
(only dependence of En vs. Angle is given)
REAC ILL, Grenoble
A. Letourneau
High Flux reactor,
2 channels in moder.
22941
http://www-nds.iaea.org/EXFOR/22941.002
(only total and thermal fluxes)
D-BE9 Julich
S. Qaim
thick 9Be(d,xn)
Ed=9.7,14,30,53MeV
There are many Entries with S.Qaim’s SPA1
(n-spectra have to be referred or compiled)
D-D
D-T
IRRM, Geel
M. Pillon
solid TiT, gas D,
Ed = 7 - 25 MeV
23142
http://www-nds.iaea.org/EXFOR/23142.002
(only Emin, Emax, Emean are given)
REAC IJD, Kyiv
O. Gritzay
WWR-M
filtered n-beam
32216
http://www-nds.iaea.org/EXFOR/32216.002
(Emean, and Yields of the main and satellite
lines are given, shapes have to be compiled)
Comments to Tables 1 and 2: italic font – incident spectra were found and compiled after Workshop.

35
Other Entries which have some information on the incident spectrum but do not contain energy
distribution in INC-SPECT:
11467; 20139; 20436; 20534; 20735; 21812; 22007; 22089; 22105; 22340; 22392; 22658; 22661;
22748; 22794; 22837; 22838; 22858; 22882; 22903; 23027; 23067; 23078; 23105; 23222; 40063;
40476; 40924; C0228; C1516; G0002; M0536; O0291.
3. Progress of work on inclusion of Neutron Spectra in EXFOR (after Workshop)
The spectrum averaged cross sections measured by A. Zvonarev at the fast reactor assembly BR-1
(IPPE) were compiled early in 41068. After the workshop this Entry was updated by CJD:
- 14 group energy spectrum from the authors' publication was added under INC-SPECT,
- reference to ICSBEP( https://www.oecd-nea.org/science/wpncs/icsbep/) was added where this
assembly (including the MCNP deck for the spectrum calculation) is described as a Benchmark
FUND-IPPE-FR-MULT-RRR-001.
Several Incident Neutron Spectra (Figs. 1 and 2) were received from the authors and will be included in
EXFOR:
- FNG facility at Frascati, D-D and D-T n-sources (M. Pillon), Entry 23127;
- D-Be n-sources at FZJ Julich (S. Qaim et al.). The overview of spectra used in his measurements
see in INDC(NDS)-0590, p. 35 and the summary prepared by NDS see in Table 3.
Fig. 1. Neutron spectra from D-T and D-D sources
received in Nov 2014 from M. Pillon
(175 groups presentation).
Fig. 2. Neutron spectra from D-Be sources received
from S. Qaim et al. at 9.7 and 53 MeV
(51 points).
0 2 4 6 8 10 12 14 1610
2
103
104
105
106
107
108
109
1010
SPA from 23127
207Pb(n,p)
207Tl
208Pb(n,p)
208Tl
(ENDF/B-VII.1)
204Pb(n,n')
204mPb
(IRDFF-1.05)
T(d,n)D(d,n)
Neu
tro
n S
pectr
um
, 1
/cm
2/M
eV
/s
Neutron Energy, MeV
FNG: D-T and D-D Neutron Spectra at 0o
10-5
10-4
10-3
10-2
10-1
100
101
Cro
ss S
ectio
n,
b
0 10 20 30 40 50 6010
-1
100
101
102
103
Ed= 53 MeV
Ed= 9.72 MeV
D0055.002
9Be(d,xn) source
Neutron Energy, MeV
received from S.Qaim
Spectr
al Y
ield
, n/c
m2/M
eV
/C

36
Table 3. Information for the d(Be) neutron spectra applied for the spectrum average cross sections measurements performed at Institut
fur Nuklearchemie, Forschungszentrum Julich GmbH, D-52425 Julich, Germany and corresponding EXFOR compilations.
Reference Ed, MeV n-Spectrum
Data / Units
Incident spectrum
additional information EXFOR Entry
How n-Spectra are
compiled now
NP/A,100,537,1967 53.8 Table
n/(μC MeV sr)
O1924
http://www-nds.iaea.org/EXFOR/O1924.002
REACTION
(4-BE-9(D,X)0-NN-
,,TTY/PY/DA/DE)
NP/A,329,63,1979 53.8 Text
n/(μC MeV sr)
Adopted from NP/A,100,537,1967
and Phys.Med.Biol.20(1975)235
Num. data provided by S.M Qaim
21009
http://www-nds.iaea.org/EXFOR/21009.003
EN-MEAN = 22.5MEV ;
EN-RSL-FW = 15.8 MEV
RCA,62,107,1993 53.8 Text
n/(μC MeV sr)
Adopted from NP/A,100,537,1967
and Phys.Med.Biol.20(1975)235
Num. data provided by S.M Qaim
22708
http://www-nds.iaea.org/EXFOR/22708.002
Data compiled without SF8=SPA
EN=53 MEV
NP/A,410,421,1983 53.8 Text
n/(μC MeV sr)
Adopted from NP/A,100,537,1967
and Phys.Med.Biol.20(1975)235
Num. data provided by S.M Qaim
21916
http://www-nds.iaea.org/EXFOR/21916
EN = 22.5MEV ;
EN-RSL-HW = 7.9 MEV
JIN,36,3639,1974 53.8 Figure
n/(μC MeV sr)
Adopted from NP/A,100,537,1967
and Phys.Med.Biol.20(1975)235
Num. data provided by S.M Qaim
20524
http://www-nds.iaea.org/EXFOR/20524
EN-APRX = 22.5 MeV
ARI,30,3,1979 53.8 Text From NP/A,100,537,1967
Num. data provided by S.M Qaim
21878
http://www-nds.iaea.org/EXFOR/21878
EN = 22.5MEV ;
EN-RSL-HW = 7.9 MEV
NP/A,295,150,1978 53.8 Text From NP/A,100,537,1967
Num. data provided by S.M Qaim
20840
http://www-nds.iaea.org/EXFOR/20840
EN-DUMMY = 22.5 MEV
NSE,91,162,1985 17.5, 20,
22.5, 25,
27.5 30
Tables
n/(cm2s MeV)
21988 (Cross sections determined from the
SPA measured at given d(Be) spectra)
http://www-nds.iaea.org/EXFOR/21988
no information given
91JUELIC,,297,199
1
20 and
25
Text From NSE,91,162,1985 22444
http://www-nds.iaea.org/EXFOR/22444
EN-MIN = 2 MEV
NP/A,423,130,1984 30 Figure
n/(sr μCs MeV)
21934
http://www-nds.iaea.org/EXFOR/21934
EN-DUMMY 12 MeV
76GARMIS,,589,1
97606
30 Figure
n/(sr μC s MeV)
20721
http://www-nds.iaea.org/EXFOR/20721
EN-DUMMY = 11.5 MEV
BNL-NCS-
51245,539,1980
30 Figure
n/(sr μA s MeV)
21649
http://www-nds.iaea.org/EXFOR/21649
EN-DUMMY = 20 MeV
RCA,51,49,1990 31 Figure
cm-1
s-1
rel.scale
30977
http://www-nds.iaea.org/EXFOR/30977
EN-DUMMY = 10 MEV

37
Reference Ed, MeV n-Spectrum
Data / Units
Incident spectrum
additional information EXFOR Entry
How n-Spectra are
compiled now
NIM/A,404,373,19
98
9.72 ATOMKI
Figure
n/(cm2s MeV)
d(Be) spectrum compiled in D0055
http://www-nds.iaea.org/EXFOR/D0055.002
REACTION
(4-BE-9(D,N)5-B-
10,,TTY/MLT/DE,,REL)
Data compiled in 31495
http://www-nds.iaea.org/EXFOR/31495.016
http://www-nds.iaea.org/EXFOR/31495.040
EN-MEAN = 4.3 MEV
13.55
Juelich
Figure
arbitrary units
ARI,64,717,2006
RCA,92,183,2004
14 Figure
arbitrary units
From NIM/A,404(1998)373 22857
http://www-nds.iaea.org/EXFOR/22857
EN-DUMMY = 3 MeV
ARI,54,655,2001 14 Text From NIM/A,404(1998)373 22664
http://www-nds.iaea.org/EXFOR/22664.011
EN-MEAN = 13.6 MeV
INDC(GER)-
049,10,2003
14 Text From NIM/A,404(1998)373 22832
http://www-nds.iaea.org/EXFOR/22832
EN-MEAN = 14 MeV

38
4. Summary of the discussion at this Workshop.
Following two Alternatives for the Neutron source compilation were considered
(highlighted in red - new for EXFOR).
First Alternative: use the REACTION string for incident spectrum, i.e.
create new special SubEntry to code the incident Spectrum as Reaction string:
REACTION (U-238-SRC(0,0),,DE,,SPD)
which will specify Spectrum for already existing SubEntry with reaction SPA cross
section coded by proper spectrum code SF8 = MXA, EPI, FIS, FSR, BRA, SPA
in REACTION (6-C-12(N,TOT) , , , ,SPA
Second Alternative: continue to use INC–SPECT for incident spectrum, i.e.
store spectrum information (data, reference or link to file with spectrum) after keyword
INC-SPECT [or extended keyword INC-SPECT(DE,…) for searching, plotting etc. ]
as a free text (spectrum itself and how it was obtained), e.g.:
E Sp or (E, Sp, Npoints) to be readable by retrieving system eV 1/eV
10000. .0001
..… ……
or as a link to other database or file, or as a text explaining where to find data, e.g.:
- to File with spectrum if the spectrum array is rather long;
- to research reactor spectra database IRDFF-2002 (https://www-nds.iaea.org/irdf2002/data/irdf2002_spectra.dat):
from G.P.Lamaze 13153, B.M.Oliver 13752 to ISNF spectrum
from A.Fabry 20948, A.Hannan 20950, I.Garlea 30452, 30568 to Sig-Sig spectrum
from Y.Harker 10218, E.P.Lippincott 13756 to CFRMF spectrum
from K.Kobayashi 21589, K.Kobayashi 20693 to YAYOI spectrum
- to evaluated libraries or Standards,
e.g. to PFNS of 252
C(s.f.) or 235
U(n,f) sources;
- to criticals' database ICSBEP (https://www.oecd-nea.org/science/wpncs/icsbep/):
e.g. to Benchmark FUND-IPPE-FR-MULT-RRR-001 from A. Zvonarev 41068.
2.13. EXFOR Web Editor, V. Zerkin
A new project “Light EXFOR Web Editor” is presented, the current stage of implementation
was demonstrated, the possible development is discussed. The idea of the project is to re-use
existing software, such as: Web presentation of an EXFOR files as interactive tree X4± and
Reference checker, and extend them by editing features. The Editor will operate on the user’s
side only in the Web browser; it could be used with and without Internet connection. For the
moment, it is a “Pilot” project; plans and details of the project are not yet fully clarified and
fixed.
Summary of the discussions
The NDS project “Light EXFOR Web Editor” was supported by NNDC (B. Pritychenko) and
other participants as an alternative of EXFOR-Editor and software independent from:
operating system, commercial system components, internal policy of organizations (of
nuclear data centers), etc.

39
3. Summary of discussions and recommendations
The workshop has facilitated the best software, EXFOR compilation practices, and facilitated
exchange between the different NRDC centers. This exchange will provide an increase in
compilation productivity and overall quality improvements of the EXFOR library. Several
presentations have led to extensive discussions, and produced valuable suggestions that are
listed below in chronological order.
1. Some comments on EXFOR compilations, N. Otuka:
1.1. Binary heavy ion case: both nuclei should have E-LVL1 and E-LVL2 tags.
Compilers should not omit such information.
1.2. N. Otuka and O. Schwerer should clarify the difference between the alternative and
interdependent results and update the manual.
1.3. Compilers are discouraged to use FLAG to distinguish the alternative results.
1.4. Compilers are recommended to delete unnecessary keywords from the deleted
entries.
1.5. Compilers are encouraged to use concise free text statements.
1.6. Compilers should make important alterations more visible using the keyword
HISTORY.
2. Compilations of beta-delayed neutron emission data. V. Semkova:
2.1. IAEA/Compilers should review a consistency of the old compilations with new rules
for beta-delayed neutrons, and for TOF measurements.
2.2. Substantial problems should trigger the recompilation of existing entries.
3. EXFOR compilations for CIELO project. B. Pritychenko:
3.1. Compilers should follow the NRDC action A56, and assign a high priority for six
CIELO materials UNOBT data compilations; perhaps deletion of “empty” subentries,
and general cleaning of irrelevant data.
3.2. General revision of the updated entries by the whole network.
3.3. EXFOR compilations should be performed in close contacts with the evaluators, and
experimentalists. Contacts with the CSEWG and other groups are encouraged.
3.4. Recent problems with EXFOR editor installation on Windows 7 triggered a request
for a Web-based EXFOR editor that can be implemented using the platform-
independent solutions by V. Zerkin. This, complementary, editor will provide an
alternative route for non-Windows compilers.
3.5. Nuclear data community has requested the IAEA to produce two different Email
distribution lists: EXFOR general and compilation-specific lists.
3.6. NNDC strongly supports the IAEA-led effort on electronic library creation. It can be
a joint project between two organizations, and include all EXFOR and NSR
publications. Copyrights restrictions will represent a certain challenge for this
project.
3.7. Data transfer from EXFOR to NSR should proceed according to the NRDC action
A84.
4. Results on the 100
Mo(p,2n)99m
Tc cross section measurements and possible systematic
errors. S. Takacs:
4.1. Decay data are important in EXFOR compilations: compilers should contact authors
if problems are found.
4.2. Recommended data: compilers can include author’s recommendations in the
compilation.
4.3. Compilers should be aware that systematic errors are present in the experimental
data.

40
4.4. S. Takacs & N. Otuka should revisit the definition of yields, old entries on TTY, and
propose corrections for reaction codes.
5. Kerma factors in EXFOR: actual status and missing published results. S. Simakov:
Compilers are encouraged to add 20 publications on Kerma factors, and revise 2 existing
EXFOR entries 22507 and 22811.
6. Some problems of photonuclear data compilation and evaluation. V. Varlamov:
6.1. Compilers should be careful in partial and total photonuclear reaction definition due
to possible contribution of protons in photoneutron reactions and vice versa of
neutrons in photoproton reactions.
6.2. Users and evaluators should be very careful with photonuclear data because
monochromatic gamma sources do not exist; this introduces additional systematic
errors.
6.3. Many photonuclear data sets need to be reexamined.
7. Compilation of neutron data in the resolved resonance region measured by TOF method.
Spectrometers’ response function, V. Semkova:
ORELA data and resolution function should be recovered by the NNDC according to the
NRDC action A36: B. Pritychenko.
8. Neutron source spectra format, O. Gritzay:
O. Gritzay should prepare a new proposal for neutron spectra compilations and distribute
it among the NRDC members.
9. Nuclear astrophysics data. Calculations of nuclear astrophysics and californium neutron
cross section uncertainties using ENDF/B-VII.1, JEFF-3.1.2, JENDL-4.0 and low-fidelity
covariances, B. Pritychenko:
B. Pritychenko & N. Otuka should generate a nuclear astrophysics priority list for the
NRDC network based on the KADONIS stellar nucleosynthesis library and other sources.
10. Structure of software on graphic data processing for EXFOR data library, G. Pikulina:
- Software developers should make improvements to curve digitizers according to
user’s comments. This suggestion is applicable for all network digitizers.
- Compilers are encouraged to eliminate error analysis correction from EXFOR
compilations, per S. Dunaeva suggestion.
11. Additional presentation on EXFOR software and editing tools, V. Zerkin:
- It will be highly-beneficial for all if the IAEA-EXFOR interface will provide a
“Text Google Search” option.
- Workshop attendees strongly support and appreciate the effort on checking codes
by V. Zerkin.
Finally, several EXFOR compilations were produced, and discussed by the workshop
attendees before the workshop was adjourned. The workshop organizers and attendees will
continue their work at home institutions until the next NRDC meeting.

APPENDIX I
41
Workshop on
Compilation for Experimental Nuclear Reaction Data Base EXFOR
6 – 10 October 2014, Vienna, Austria
Meeting Room: M0E10
AGENDA
(Coffee breaks morning /
afternoon as appropriate)
Monday, 6 October 2014
9:30 – 12:30
1.1 Welcome address 10 min R. Forrest
1.2 Self-introduction 15 min All
1.3 Announcement 5 min K. Nathani
1.4 Objectives of the workshop 10 min V. Semkova
1.5 Some comments on EXFOR compilation. 150 min N. Otsuka
12:30 – 14:00 Lunch break
14:00 – 18:00
1.6 Compilation of beta-delayed neutron emission data. 60 min V. Semkova
1.7 Compilation exercises on beta-delayed neutron
emission data
180 min All
Tuesday, 7 October 2014
9:00 – 13:00
Review of the compilation exercise of 6th
October 30 min V. Semkova
N. Otsuka
2.1 EXFOR compilations for CIELO project 60 min B. Pritychenko
2.2 Results on the 100
Mo(p,2n)99m
Tc cross section
measurements and possible systematic errors.
Definition of radioisotope thick target yields.
60 min S. Takacs
2.3 Kerma factors in EXFOR: actual status and missing
published results.
60 min S.P. Simakov
13:00 – 14:00 Lunch break
14:00 – 18:00
2.4 Compilation exercises on charged particle-induced
data and Kerma factors.
240 min All

APPENDIX I
42
Wednesday, 8 October 2014
9:00 – 13:00
Review of the compilation exercises of 7th
October 45 min S. Takacs
S.P. Simakov
N. Otsuka
3.1 Some problems of photonuclear data compilation and
evaluation.
45 min V. Varlamov
3.2 Compilation of neutron data in resolved resonance
region measured by TOF method. Spectrometers’
response function.
45 min V. Semkova
3.3 Neutron source spectra format. 45 min O. Gritzay
13:00 – 14:00 Lunch break
14:00 – 18:00
3.4 Compilation exercises on neutron-induced and
photonuclear data.
240 min All
Thursday, 9 October 2014
9:00 – 13:00
4.1 Nuclear astrophysics data. Calculations of nuclear
astrophysics and californium neutron cross section
uncertainties using ENDF/B-VII.1, JEFF-3.1.2,
JENDL-4.0 and low-fidelity covariances.
60 min B. Pritychenko
4.2 Structure of software on graphic data processing for
the EXFOR data library.
30 min G. Pikulina
4.3 User’s interface of a program on graphic data
processing for the EXFOR data library: approaches,
solutions, capabilities.
30 min S. Taova
4.4 Introduction of digitization software GDgraph. 30 min Chen Guochang
4.5 Digitization software GSYS. 30 min D. Ichinkhorloo
4.6 Digitization capabilities of Origin 9.0. 30 min B.
Marcinkevicius
13:00 – 14:00 Lunch break
14:00 – 18:00
4.7 Digitization tools and compilation exercises on nuclear
astrophysics data.
240 All
Friday, 10 October 2014
9:00 –
5.1 Review of the compilation exercises of 8th
and 9th
October
B. Pritychenko
V. Varlamov
N. Otsuka
5.2 Discussions.
5.3 Closing of the meeting

APPENDIX II
43
LIST OF PARTICIPANTS
AUSTRIA
Otto Schwerer
Gumpendorferstrasse 9/18
1060 Vienna
Tel.: +43 1 586 1351
Mobile: +43 676 7755839
E-mail: [email protected]
CHINA
Guochang Chen
China Nuclear Data Center
China Institute of Atomic Energy
P.O.Box 275-41
Beijing 102413
Tel.: +86 10 69358604
Fax: +86 10 69358119
E-mail: [email protected]
HUNGARY
Sandor Takacs
Institute of Nuclear Research
Hungarian Academy of Sciences
Bem ter 18/c
H-4001 Debrecen
Tel.: +36 52 509200
Fax: +36 52 416181
E-mail: [email protected]
JAPAN
Dagvadorj Ichinkhorloo
Hokkaido University
Nuclear Research Data Center
Kita-ku, Kita-10, Nishi-8
Sapporo 060-0810
Tel.: +81 (11) 706-3818
Fax: +81 (11) 706-3724
E-mail: [email protected]
KAZAKHSTAN
Nurzat Kenzhebayev
Physical-Technical Department
Al-Farabi Kazakh National University
Room 319
Almaty 050022
Tel.: +7 727 377 3458
E-mail: [email protected]
RUSSIAN FEDERATION
Marina Mikhailiukova
Institute for Physics and Power Engineering
Bondarenko Sq. 1
Kaluga Region
249033 Obninsk
Tel.: +7 484 3998779
Fax: +7 484 3968225
E-mail: [email protected]
RUSSIAN FEDERATION
Galina Pikulina
Russia Federal Nuclear Center
All Russia Scientific Research
Institute of Experimental Physics
607188, Sarov
Nizhnii Novgorod Region
Tel.: +7 83130 27779
Fax: +7 83130 45569
E-mail: [email protected]
RUSSIAN FEDERATION
Sophiya Taova
Russian Federal Nuclear Center
All Russia Scientific Research Institute
of Experimental Physics
607188, Sarov
Nizhnii Novgorod Region
Tel.: +7 83130 27779
Fax: +7 83130 45569
E-mail: [email protected]
APPENDIX II
44
RUSSIAN FEDERATION
Vladimir Varlamov
Centre for PhotonuclearEksperimentov
Skobeltsyn Institute of Nuclear Physics
Lomonosov Moscow State University
119991 Moscow
Tel.: +7 495 939 3483
Fax: +7 495 939 0896
E-mail: [email protected]
UKRAINE
Olena Gritzay
Ukrainian Nuclear Data Center
Institute for Nuclear Research
Prospekt Nauky 47
03680 Kyiv
Tel.: +380 44 525 3987
Fax: +380 44 525 4463
Email: [email protected]
UNITED STATES OF AMERICA
Boris Pritychenko
National Nuclear Data Center
Brookhaven National Laboratory
Bldg 197D, P/O. Box 5000
Upton NY 11973-5000
Tel.: +1 631-344-5091
Fax: +1 631-344-2806
E-mail: [email protected]
IAEA
Valentina Semkova (Scientific Secretary)
Nuclear Data Section
Division of Physical and Chemical Sciences
Tel.: +43 1 2600 21727
Fax: +43 1 2600 7 21727
E-mail [email protected]
IAEA
Naohiko Otsuka
Nuclear Data Section
Division of Physical and Chemical Sciences
Tel.: +43 1 2600 21715
Fax: +43 1 2600 7 21715
E-mail: [email protected]
IAEA
Stanislav Simakov
Nuclear Data Section
Division of Physical and Chemical Sciences
Tel.: +43 1 2600 21717
Fax: +43 1 2600 7 21717
E-mail: [email protected]
IAEA
Viktor Zerkin
Nuclear Data Section
Division of Physical and Chemical Sciences
Tel.: +43 1 2600 21714
Fax: +43 1 2600 7 21714
E-mail: [email protected]


Nuclear Data Section
International Atomic Energy Agency
Vienna International Centre, P.O. Box 100
A-1400 Vienna, Austria
E-mail: [email protected]
Fax: (43-1) 26007
Telephone: (43-1) 2600 21725
Web: http://www-nds.iaea.org