summer 2010 gems & gemology lab notes - gia · spring 2010 lab notes, pp. 51–52). recently,...
TRANSCRIPT
140 LAB NOTES GEMS & GEMOLOGY SUMMER 2010
Unusual Polyphase InclusionsIn CORUNDUM
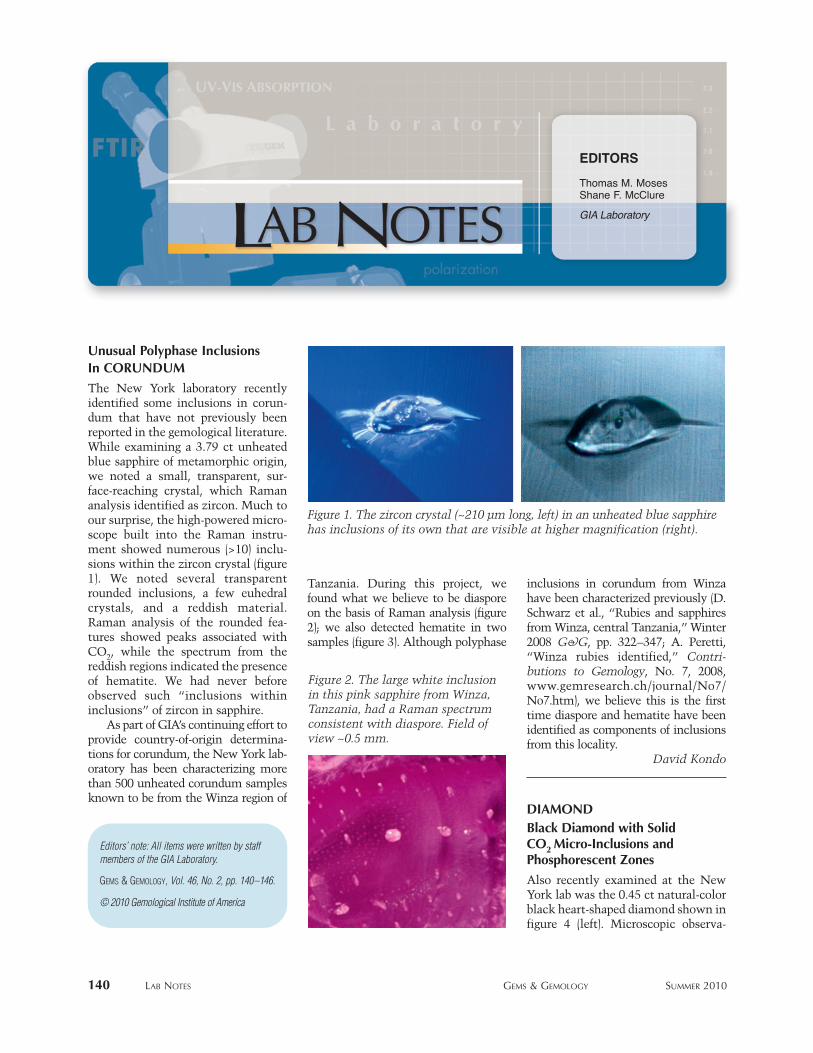
The New York laboratory recentlyidentified some inclusions in corun-dum that have not previously beenreported in the gemological literature.While examining a 3.79 ct unheatedblue sapphire of metamorphic origin,we noted a small, transparent, sur-face-reaching crystal, which Ramananalysis identified as zircon. Much toour surprise, the high-powered micro-scope built into the Raman instru-ment showed numerous (>10) inclu-sions within the zircon crystal (figure1). We noted several transparentrounded inclusions, a few euhedralcrystals, and a reddish material.Raman analysis of the rounded fea-tures showed peaks associated withCO2, while the spectrum from thereddish regions indicated the presenceof hematite. We had never beforeobserved such “inclusions withininclusions” of zircon in sapphire.
As part of GIA’s continuing effort toprovide country-of-origin determina-tions for corundum, the New York lab-oratory has been characterizing morethan 500 unheated corundum samplesknown to be from the Winza region of
Tanzania. During this project, wefound what we believe to be diasporeon the basis of Raman analysis (figure2); we also detected hematite in twosamples (figure 3). Although polyphase
inclusions in corundum from Winzahave been characterized previously (D.Schwarz et al., “Rubies and sapphiresfrom Winza, central Tanzania,” Winter2008 G&G, pp. 322–347; A. Peretti,“Winza rubies identified,” Contri -butions to Gemology, No. 7, 2008,www.gemresearch.ch/journal/No7/No7.htm), we believe this is the firsttime diaspore and hematite have beenidentified as components of inclusionsfrom this locality.
David Kondo
DIAMONDBlack Diamond with SolidCO2 Micro-Inclusions andPhosphorescent Zones
Also recently examined at the NewYork lab was the 0.45 ct natural-colorblack heart-shaped diamond shown infigure 4 (left). Microscopic observa-
EDITORS
Thomas M. MosesShane F. McClure
GIA Laboratory
© 2010 Gemological Institute of America
GEMS & GEMOLOGY, Vol. 46, No. 2, pp. 140–146.
Editors’ note: All items were written by staffmembers of the GIA Laboratory.
Figure 1. The zircon crystal (~210 µm long, left) in an unheated blue sapphirehas inclusions of its own that are visible at higher magnification (right).
Figure 2. The large white inclusionin this pink sapphire from Winza,Tanzania, had a Raman spectrumconsistent with diaspore. Field ofview ~0.5 mm.

LAB NOTES GEMS & GEMOLOGY SUMMER 2010 141
tion revealed an abundance of clouds,and higher magnification showedclusters of round, disc-like inclusions~32 µm across (figure 4, right). This isthe first time we had observed suchfeatures in a black diamond, whichderives its color from its inclusions.
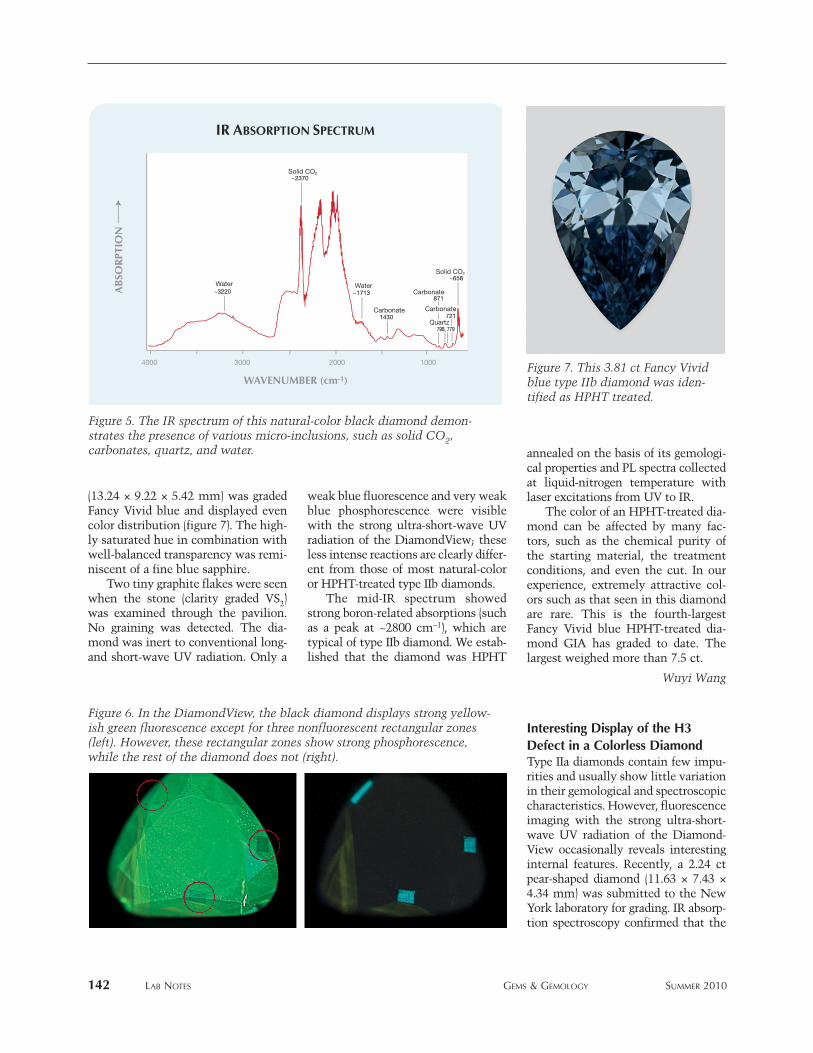
Due to time constraints, we did nothave the opportunity to identify theseinclusions using Raman microspec-troscopy. However, the mid-infrared(IR) spectrum demonstrated that thediamond’s major impurity was solidCO2, with dominant absorption peaksat ~2370 and ~658 cm−1 (figure 5).Features associated with micro-inclu-sions such as silicates and apatite alsowere observed, at 1055 and 575 cm−1,respectively (though not visible in fig-ure 5). Sharp absorption bands at 871and 721 cm−1, together with a broad
band at 1430 cm−1, suggested the pres-ence of carbonates. Quartz absorptionbands detected at 798 and 779 cm−1
were shifted from their normal posi-tions. This diamond also containedhydrous components, as revealed by abroad band at ~3220 cm−1 that indicatedasymmetric OH− stretching (see D. A.Zedgenizov et al., “Carbonatitic meltsin cuboid diamonds from Udachnayakimberlite pipe [Yakutia]: Evidencefrom vibrational spectros copy,” Miner -alogical Magazine, Vol. 68, No. 1, 2004,pp. 61–73). Another broad band at~1713 cm−1 may be related to the H2O-bending mode. Small hydrogen bandswere observed at 4703 and 3107 cm−1.These features are not common in gem-quality diamonds. Absorption bands inthe 1300–1000 cm−1 region suggestedthis was a type Ia stone.
When examined with the strongultra-short-wave (~225 nm) ultravio-let radiation of the DiamondView,most of the stone fluoresced strongyellowish green, but there were threerectangular nonfluorescent zones (fig-ure 6, left). Unlike the rest of the dia-mond, these zones exhibited strongphosphorescence (figure 6, right).Photoluminescence (PL) spectroscopyusing 488 and 633 nm lasers showedsimilar features for both these zonesand the fluorescent areas, but a fewPL bands—such as at 511, 572, 696.2,and 739 nm—were observed only inthe nonfluorescent zones. The assign-ment for these bands is not clear, butthey may be related to the unusualphosphorescence. The clouds in thediamond were confined to the {100}crystal plane in the dominant yellow-ish green fluorescent area, while thephosphorescent zones were formed in{111} directions.
This black diamond offered a valu-able opportunity to study the geologicconditions of diamond growth. Themicro-inclusions of solid CO2 andwater—which we have seen onlyrarely in gem-quality diamonds—sug-gested that this diamond formed fromcarbonate-rich melts. Internal pres-sure from these volatiles caused thequartz absorption bands to shift,which further suggests that thesemicro-inclusions were trapped duringthe diamond’s growth.
Paul Johnson and Kyaw Soe Moe
Fancy Vivid Blue HPHT-Treated Diamond
As we have noted previously, manynatural type IIb blue diamonds havegray or brown overtones that can beremoved by high-pressure, high-tem-perature (HPHT) annealing, thusenhancing the blue color (see, e.g.,Spring 2010 Lab Notes, pp. 51–52).Recently, the New York laboratoryexamined one such diamond with ahue more saturated than most otherHPHT-treated blue diamonds wehave tested.
The 3.81 ct pear-shaped diamond
Figure 3. For these inclusions in a violetish blue sapphire (left) and apink sapphire (right, taken with a Raman microscope)—both fromWinza—Raman spectra for the red regions matched hema tite. Fields ofview 1.2 and 0.15 mm, respectively.
Figure 4. This 0.45 ct black diamond (left) contains abundant microscopicclouds. With high magnification (112.5×), clusters of round, disc-likeinclusions are also seen (right).
142 LAB NOTES GEMS & GEMOLOGY SUMMER 2010
(13.24 × 9.22 × 5.42 mm) was gradedFancy Vivid blue and displayed evencolor distribution (figure 7). The high-ly saturated hue in combination withwell-balanced transparency was remi-niscent of a fine blue sapphire.
Two tiny graphite flakes were seenwhen the stone (clarity graded VS2)was examined through the pavilion.No graining was detected. The dia-mond was inert to conventional long-and short-wave UV radiation. Only a
weak blue fluorescence and very weakblue phosphorescence were visiblewith the strong ultra-short-wave UVradiation of the DiamondView; theseless intense reactions are clearly differ-ent from those of most natural-coloror HPHT-treated type IIb diamonds.
The mid-IR spectrum showedstrong boron-related absorptions (suchas a peak at ~2800 cm−1), which aretypical of type IIb diamond. We estab-lished that the diamond was HPHT
annealed on the basis of its gemologi-cal properties and PL spectra collectedat liquid-nitrogen temperature withlaser excitations from UV to IR.
The color of an HPHT-treated dia-mond can be affected by many fac-tors, such as the chemical purity ofthe starting material, the treatmentconditions, and even the cut. In ourexperience, extremely attractive col-ors such as that seen in this diamondare rare. This is the fourth-largestFancy Vivid blue HPHT-treated dia-mond GIA has graded to date. Thelargest weighed more than 7.5 ct.
Wuyi Wang
Interesting Display of the H3Defect in a Colorless DiamondType IIa diamonds contain few impu-rities and usually show little variationin their gemological and spectroscopiccharacteristics. However, fluorescenceimaging with the strong ultra-short-wave UV radiation of the Diamond - View occasionally reveals interestinginternal features. Recently, a 2.24 ctpear-shaped diamond (11.63 × 7.43 ×4.34 mm) was submitted to the NewYork laboratory for grading. IR absorp-tion spectroscopy confirmed that the
IR ABSORPTION SPECTRUM
WAVENUMBER (cm-1)
Solid CO2
4000 3000 2000 1000
WaterCarbonate
Carbonate
Water
Solid CO2
Carbonate
Quartz
AB
SOR
PTIO
N
~2370
~3220 ~1713871
1430 721
798, 779
~658
Figure 5. The IR spectrum of this natural-color black diamond demon-strates the presence of various micro-inclusions, such as solid CO2,carbonates, quartz, and water.
Figure 6. In the DiamondView, the black diamond displays strong yellow-ish green fluorescence except for three nonfluorescent rectangular zones(left). However, these rectangular zones show strong phosphorescence,while the rest of the diamond does not (right).
Figure 7. This 3.81 ct Fancy Vividblue type IIb diamond was iden-tified as HPHT treated.

LAB NOTES GEMS & GEMOLOGY SUMMER 2010 143
E-color, internally flawless stone wasa typical type IIa diamond, with noimpurity-related defects.
A striking feature displayed in theDiamondView was the stone’s domi-nant blue fluorescence with unusualgreen patterns. Depending on thedirection of observation, these greenregions showed fern-like, flame-like,or distorted vein structures over theentire pavilion (e.g., figure 8). We alsoobserved strong blue phosphores-cence in the DiamondView.
PL spectroscopy at liquid-nitrogentemperature with 488 nm laser exci-tation showed relatively strong emis-sion from the H3 optical center witha zero-phonon line (ZPL) at 503.2 nm,weak emission from NV0 at 575.0nm, and a sharp peak at 648.2 nm (fig-ure 9). The 648.2 nm emission is verylikely a boron-related defect, and typeIIa diamonds with this emission oftendisplay strong blue phosphorescence.The unusually strong H3 emission,together with the distinctive patternsobserved in the DiamondView,demonstrated that the green fluores-cence is caused by the H3 optical cen-ter (see, e.g., Spring 2010 Lab Notes,pp. 49–50).
Such an interesting pattern of H3distribution in a type IIa diamond israre. The formation mechanism isnot fully understood, but it could berelated to the presence of latticeimpurities (such as A-form nitrogenand vacancies) in a specific crystalorientation.
Erica Emerson and Wuyi Wang
CVD SYNTHETIC DIAMOND Over One Carat
Single-crystal synthetic diamondsgrown by chemical vapor deposition(CVD) are occasionally submitted tothe GIA Laboratory for identificationand grading reports. For the first time,the New York laboratory has identi-fied a near-colorless CVD syntheticdiamond larger than one carat thatwas submitted for grading.
The 1.05 ct pear shape (9.81 × 5.95
× 3.06 mm) was color-graded as equiv-alent to G (figure 10). In addition topinpoint inclusions, it containedsome feathers and fractures along thegirdle, and its clarity grade was equiv-alent to I1. No fluorescence wasobserved when it was exposed to con-ventional long- and short-wave UVradiation. The mid-IR absorptionspectrum showed no absorption inthe one-phonon region and no hydro-gen-related absorption, which classi-fied it as type IIa. (It is unusual to
Figure 8. These DiamondView images of a 2.24 ct colorless type IIa diamond display the H3defect in fern-like (left), flame-like (center), and distorted vein (right) structures.
PL SPECTRUM
WAVELENGTH (nm)
500 520 540 560 580 600 620 640
575.0
NV0
648.2
503.2H3
Dia
mon
d R
aman
INTE
NSI
TY
Figure 9. The 2.24 ct colorless diamond’s PL spectrum shows a relativelystrong emission from the H3 center.

144 LAB NOTES GEMS & GEMOLOGY SUMMER 2010
encounter a “white” CVD-grown dia-mond without H-related absorption at3123 cm−1.) Images taken with theDiamondView showed strong pinkfluorescence with some irregularlyshaped areas of blue fluorescence (fig-ure 11). PL spectra collected at liquid-nitrogen temperature with laser exci-tations from the UV to IR regionsrevealed features typical of CVD syn-thetic diamond: strong emissionsfrom NV centers, a doublet at 596.5and 597.1 nm, and [Si-V]− doublet
emissions at 736.6 and 736.9 nm. Thegemological and spectroscopic fea-tures confirmed that this sample wasa CVD synthetic diamond.
It is clear that larger, better-qualityCVD synthetic diamonds are being pro-duced as there is continued improve-ment in the growth techniques.
Wuyi Wang and Kyaw Soe Moe
Synthetic Diopside inManufactured GLASSManufactured glasses are familiar gemsimulants, and are usually identifiableby included gas bubbles. If the glasshas begun to devitrify, however, itmay contain natural-appearing crys-talline inclusions, so identificationmay be confusing for all but the mostexperienced gemologists. Devitri -fication usually occurs in coloredglasses, which contain additional ele-ments that increase the likelihood ofdeveloping crystals. These crystalstypically nucleate on gas bubbles orforeign particles in the glass (J. I.Koivula, “A photolexicon of inclu-sion-related terms for today’s gemmol-ogist: Part 27,” Canadian Gem mo -logist, Vol. 17, No. 2, 1996, p. 40).
The Carlsbad laboratory recently
examined an unusual example of thisphenomenon. The standard gemolog-ical properties (RI of 1.52 and hydro-static SG of 2.55) were consistentwith manufactured glass. The piecedisplayed three distinct color zones:greenish blue, green, and essentiallycolorless. The colorless zone ranthrough the green area and containednumerous well-formed blocky greencrystals, several of which had strong-ly saturated green cores (e.g., figure12). Raman analysis identified thecrystals as diopside. Because thesegreen synthetic diopside crystals onlyoccurred in the colorless area, theyappeared to have caused a “chro-mophore cannibalization” effect onthe originally green glass, renderingthose portions of the sample color-less. Energy-dispersive X-ray fluores-cence analysis of the host confirmedthe presence of chromium, the likelychromophore of both the green por-tion of the glass and the syntheticdiopside crystals.
Also present were elongated color-less crystals, which Raman analysisidentified as wollastonite. Theseappeared to be the initial devitrifica-tion product, followed by the synthet-ic diopside crystals, which were com-monly distributed along the length ofthe synthetic wollastonites (again, seefigure 12). Irregularities along the syn-thetic wollastonite crystals likelyserved as nucleation sites for the syn-thetic diopside.
While synthetic wollastonite hasbeen reported previously in manufac-tured glass (H. A. Hänni et al., “Aglass imitation of blue chalcedony,”Journal of Gemmology, Vol. 27, No.5, 2001, pp. 275–285), this is the firsttime we have seen synthetic diopsideas a devitrification product.
Nathan Renfro and John Koivula
Green Be-Diffused SAPPHIREBeryllium diffusion can produce awide range of colors in corundum. TheCarlsbad laboratory routinely encoun-ters blue, yellow, orange, pink, and redexamples. Green is one of the more
Figure 10. This G-color CVD syn-thetic diamond weighs 1.05 ct.
Figure 11. When exposed to thestrong short-wave UV radiationof the DiamondView, the 1.05 ctCVD synthetic diamond displaysstrong pink fluorescence withirregular areas of blue.
Figure 12. Synthetic diopsidecrystals decorate an elongatedcolorless rod of synthetic wollas-tonite in a piece of manufacturedglass. Magnified 70×.

LAB NOTES GEMS & GEMOLOGY SUMMER 2010 145
unusual colors for this material, espe-cially in larger sizes, but we recentlyexamined a 14.20 ct sample that wasberyllium diffused (figure 13).
The standard gemological proper-ties for this stone were consistentwith corundum. Microscopic exami-nation revealed particulate clouds,flux-healed “fingerprints,” discoid-like fractures, and planar growth fea-tures. The desk-model spectroscopeshowed strong iron-related absorptioncentered at 450 nm. As expected,immersion displayed alternating blueand yellow color zones, a commonfeature in green sapphires.
Beryllium diffusion was firstdetected in the early 2000s because ofsurface-conformal color zoning inorangy pink to pinkish orange sap-phires. However, the vast majority ofBe-diffused corundum currently beingprocessed does not show this type ofzoning because the stones are diffusedall the way through. Nevertheless,microscopic examination can offerclues to the likelihood of Be diffusion,such as synthetic overgrowth, signifi-cantly altered crystal inclusions, andlocalized blue zones of internal diffu-sion (caused by the release of Ti frominclusions such as rutile into the Fe-containing corundum host). Whilethese clues alone are not proof of Bediffusion, their presence does suggesthigh-temperature heat treatment (seeJ. L. Emmett et al., “Beryllium diffu-
sion of ruby and sapphire,” Summer2003 G&G, pp. 84–135).
The GIA Laboratory uses laserablation–inductively coupled plas-ma–mass spectrometry (LA-ICP-MS)to test all heat-treated corundum forthe presence of beryllium. This stone,which had features consistent withheat treatment, was no exception.LA-ICP-MS indicated an average Beconcentration of just over 13 ppmw(27 ppma), enough to dramaticallyalter the color.
The appearance in the market-place of this large green Be-diffusedsapphire reinforces the need to send allsuspect stones to a qualified laborato-ry for chemical analysis. Micro scopicevidence of high-temperature treat-ment can raise suspicion of Be diffu-sion, but chemical analysis by a tech-nique capable of detecting traces of Beis necessary to confirm the treatment.
Nathan Renfro
Heat-Treated SPINELThis spring, the New York laboratoryexamined a 17.02 ct reddish orangeoval modified brilliant (figure 14) thatwas singly refractive, had an RI of 1.719and SG of 3.59, and displayed a series ofchrome lines with the desk-modelspectroscope—all properties consistentwith spinel. Magnification revealed
particulates and strings of minuteinclusions (figure 15). These were rem-iniscent of boehmite in spinel (see E. J.Gübelin and J. I. Koivula, Photoatlas ofInclusions in Gemstones, Opinio Ver -lag, Basel, Switzer land, 1986, p. 375),which suggested a natural origin. A fewsmall expansion halos or “blebs” ema-nating from the strings of inclusionsindicated that the stone might havebeen subjected to heat.
Since first experimenting on heat-treated Tanzanian spinels in 2005, theGIA Laboratory has tested several hun-
Figure 13. Chemical analysisrevealed that this 14.20 ct greensapphire had been treated byberyllium diffusion.
Figure 14. Based on standardgemological observations andadvanced testing, this 17.02 ctreddish orange oval modifiedbrilliant was identified as aheated natural spinel.
Figure 15. The internal features observed in the reddish orange spinel werelimited to particulates and strings of minute inclusions.
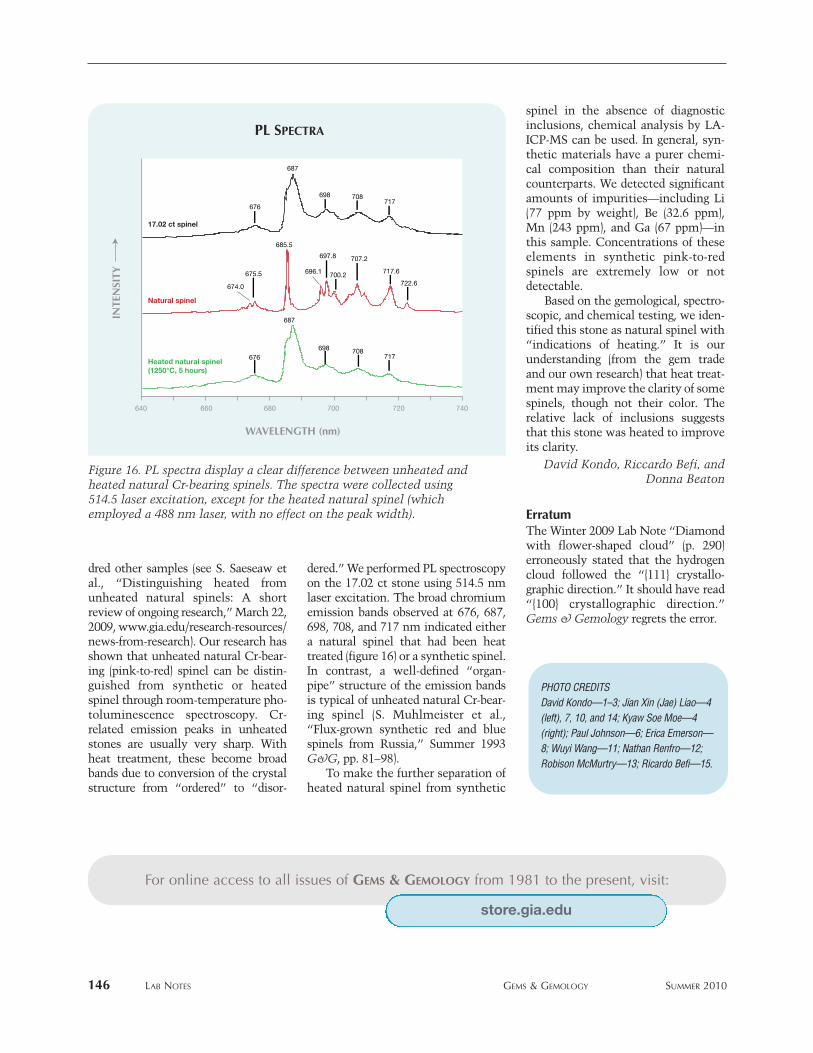
dred other samples (see S. Saeseaw etal., “Distinguishing heated fromunheated natural spinels: A shortreview of ongoing research,” March 22,2009, www.gia.edu/research-resources/news-from-research). Our research hasshown that unheated natural Cr-bear-ing (pink-to-red) spinel can be distin-guished from synthetic or heatedspinel through room-temperature pho-toluminescence spectroscopy. Cr-related emission peaks in unheatedstones are usually very sharp. Withheat treatment, these become broadbands due to conversion of the crystalstructure from “ordered” to “disor-
dered.” We performed PL spectros copyon the 17.02 ct stone using 514.5 nmlaser excitation. The broad chromiumemission bands observed at 676, 687,698, 708, and 717 nm indicated eithera natural spinel that had been heattreated (figure 16) or a synthetic spinel.In contrast, a well-defined “organ-pipe” structure of the emission bandsis typical of unheated natural Cr-bear-ing spinel (S. Muhlmeister et al.,“Flux-grown synthetic red and bluespinels from Russia,” Summer 1993G&G, pp. 81–98).
To make the further separation ofheated natural spinel from synthetic
spinel in the absence of diagnosticinclusions, chemical analysis by LA-ICP-MS can be used. In general, syn-thetic materials have a purer chemi-cal composition than their naturalcounterparts. We detected significantamounts of impurities—including Li(77 ppm by weight), Be (32.6 ppm),Mn (243 ppm), and Ga (67 ppm)—inthis sample. Concentrations of theseelements in synthetic pink-to-redspinels are extremely low or notdetectable.
Based on the gemological, spectro-scopic, and chemical testing, we iden-tified this stone as natural spinel with“indications of heating.” It is ourunderstanding (from the gem tradeand our own research) that heat treat-ment may improve the clarity of somespinels, though not their color. Therelative lack of inclusions suggeststhat this stone was heated to improveits clarity.
David Kondo, Riccardo Befi, andDonna Beaton
ErratumThe Winter 2009 Lab Note “Diamondwith flower-shaped cloud” (p. 290)erroneously stated that the hydrogencloud followed the “{111} crystallo-graphic direction.” It should have read“{100} crystallographic direction.”Gems & Gemology regrets the error.
146 LAB NOTES GEMS & GEMOLOGY SUMMER 2010
PHOTO CREDITSDavid Kondo—1–3; Jian Xin (Jae) Liao—4(left), 7, 10, and 14; Kyaw Soe Moe—4(right); Paul Johnson—6; Erica Emerson—8; Wuyi Wang—11; Nathan Renfro—12;Robison McMurtry—13; Ricardo Befi—15.
WAVELENGTH (nm)
640 660 680 700 720 740
PL SPECTRA
676
687
698 708717
674.0
675.5
685.5
696.1
697.8
700.2
707.2
717.6
722.6
676
687
698 708717
Natural spinel
INTE
NSI
TY
17.02 ct spinel
Heated natural spinel(1250°C, 5 hours)
Figure 16. PL spectra display a clear difference between unheated andheated natural Cr-bearing spinels. The spectra were collected using514.5 laser excitation, except for the heated natural spinel (whichemployed a 488 nm laser, with no effect on the peak width).
store.gia.edu
For online access to all issues of GEMS & GEMOLOGY from 1981 to the present, visit: