summer committee meetings. yoram bauman sightline institute
TRANSCRIPT

Summer Committee Meetings

Yoram BaumanSightline Institute

Carbon tax revenues Tax cuts0
1000
2000
3000
4000
5000
6000
Cumulative BC Carbon Tax Revenues and Tax Cuts 2008 – 2014
$5.0 Bn
$5.7 Bn
$ 3112 M Business Tax Cuts
$ 1221 M Personal Income Tax Cuts
$ 997 M Low Income Tax Credit
$ 108 M Other Personal Tax Cuts$ 221 M Rural/Northern Benefit
Source: BC Budgets 2008-2013

2007 2008 2009 2010 201194
96
98
100
102
104
106
Real GDP Growth Relative to 2007 (2007=100)
BC
Canada
Source: CANSIM 379-0025
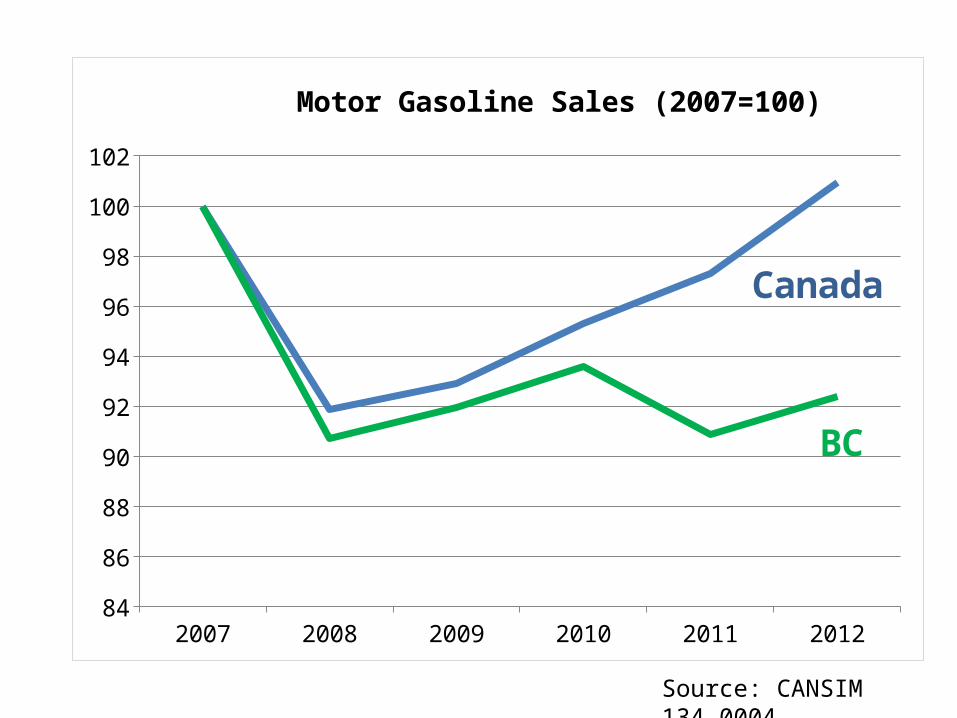
2007 2008 2009 2010 2011 201284
86
88
90
92
94
96
98
100
102
Motor Gasoline Sales (2007=100)
BC
Canada
Source: CANSIM 134-0004

Learning from the Regions

Learning from the Regions

Bruce BraineAmerican Electric Power
Comparison of Hypothetical U.S. CO2Cap and Trade vs. Tax
Bruce H. Braine
VP – Strategic Policy Analysis
NARUC Summer Committee Meetings
July 23, 2013

Background
Federal CO2 legislation very unlikely in next 3-5 years.
Obama Administration moving forward on CO2 regulations (e.g. utility NSPS on new and existing sources) BUT likely insufficient to meet long-term (post-2020) CO2 goals and NOT cost-effective.
If policymakers determine more long term CO2 reductions needed, federal legislation (either carbon tax or “cap and trade”) would be required.
How do these two approaches compare?
10
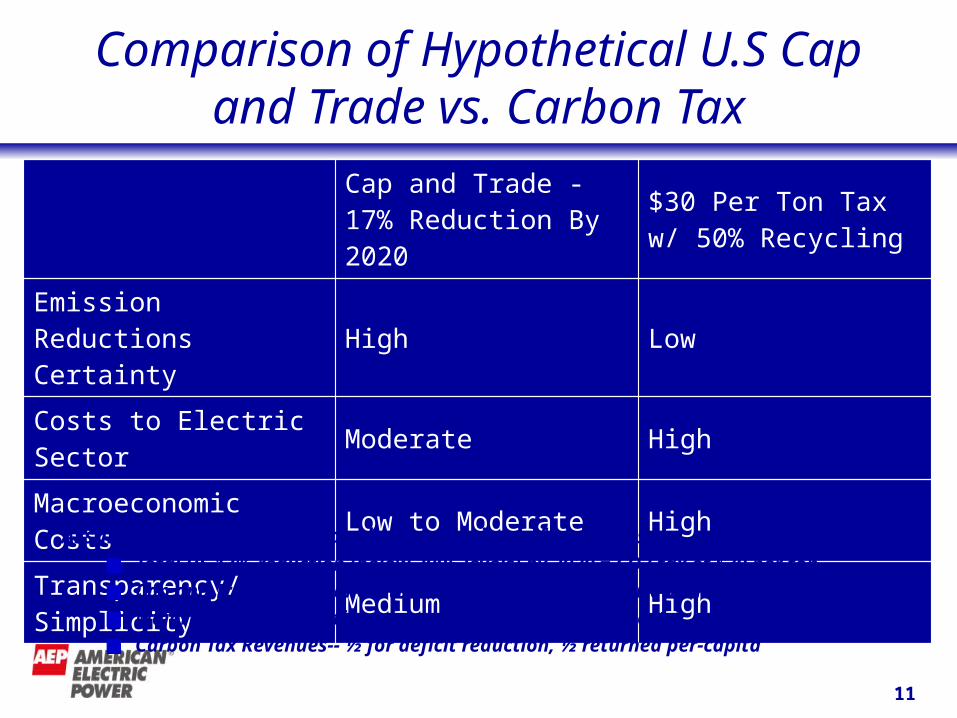
Comparison of Hypothetical U.S Cap and Trade vs. Carbon Tax
Cap and Trade - 17% Reduction By 2020
$30 Per Ton Tax w/ 50% Recycling
Emission Reductions Certainty High Low
Costs to Electric Sector Moderate High
Macroeconomic Costs Low to Moderate High
Transparency/Simplicity Medium High
11 11
Assumptions for ‘apples to apples’ comparison of programs:Total US 17% reduction (below 2005 levels) by 2020 = CO2 tax of $30 per ton
Cap and Trade w/ full allocation of allowances for electric utilities/customers
Majority of CO2 reductions come from/required from electric sector
Carbon Tax Revenues-- ½ for deficit reduction, ½ returned per-capita
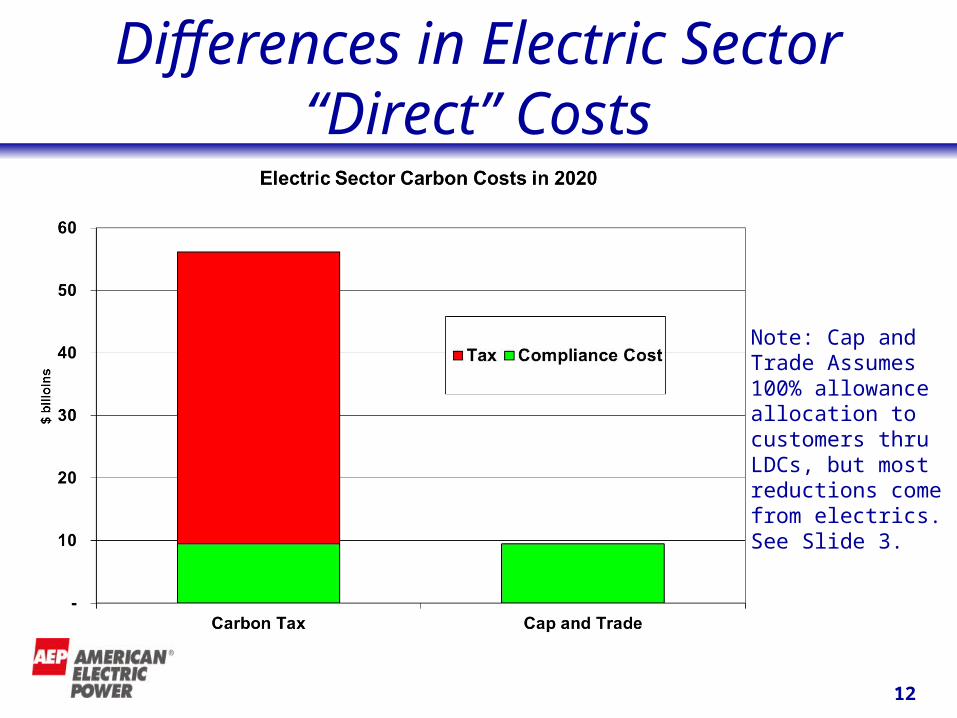
Differences in Electric Sector “Direct” Costs
12 12
Note: Cap and Trade Assumes 100% allowance allocation to customers thru LDCs, but most reductions come from electrics. See Slide 3.
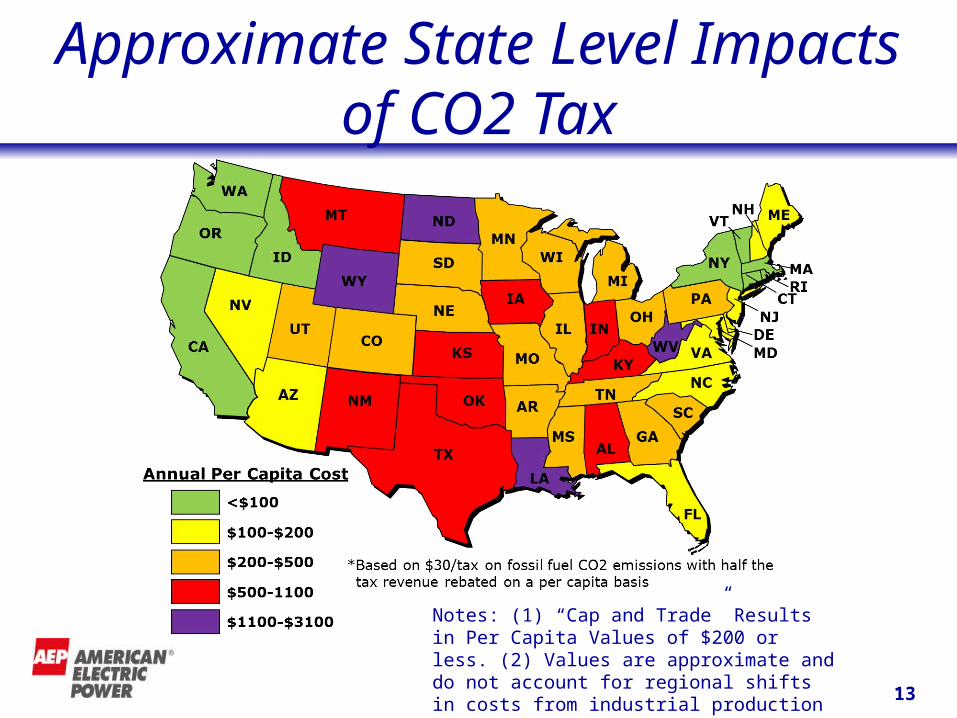
Approximate State Level Impacts of CO2 Tax
13 13
Notes: (1) “Cap and Trade” Results in Per Capita Values of $200 or less. (2) Values are approximate and do not account for regional shifts in costs from industrial production and/or exports.

Positive Track Record for Cap and Trade
U.S. Acid Rain Program European Union GHG ETS
14 14
Source: European Environmental Agency
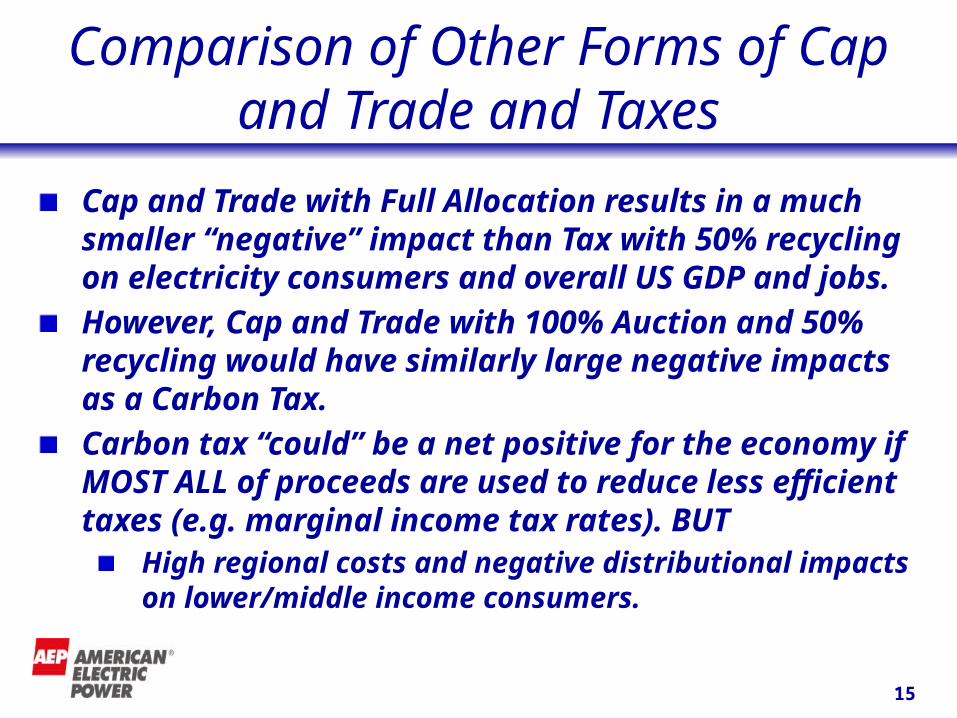
Comparison of Other Forms of Cap and Trade and Taxes
Cap and Trade with Full Allocation results in a much smaller “negative” impact than Tax with 50% recycling on electricity consumers and overall US GDP and jobs.
However, Cap and Trade with 100% Auction and 50% recycling would have similarly large negative impacts as a Carbon Tax.
Carbon tax “could” be a net positive for the economy if MOST ALL of proceeds are used to reduce less efficient taxes (e.g. marginal income tax rates). BUT
High regional costs and negative distributional impacts on lower/middle income consumers.
15 15

Learning from the Regions