summer fuels outlook - eia.gov fuels outlook . ... estimated to have been 14% higher than at the...
TRANSCRIPT
U.S. Energy Information Administration | Short-Term Energy Outlook April 2018 1
April 2018
Summer Fuels Outlook
This outlook focuses on prices and consumption of gasoline, diesel, and electricity (see Summer Fuels Outlook motor gasoline table and electricity table). The use of these fuels typically peaks during the summer months.
Gasoline and diesel
U.S. Motor Gasoline. EIA considers the summer season for gasoline and diesel to run from April through September. EIA expects the retail price of regular-grade gasoline will average $2.74 per gallon (gal) during summer 2018, up from an average of $2.41/gal last summer. Gasoline prices are forecast to be higher this summer compared with last year primarily because of Brent crude oil prices, which are expected to average $12 per barrel (b) higher than during last summer. Monthly average retail prices of gasoline are forecast to remain largely flat through the summer, averaging $2.78/gal from April through June before gradually falling to $2.65/gal by September.
Daily and weekly national average prices of gasoline can differ significantly from monthly and seasonal averages. Significant differences also exist across regions, with monthly average prices in some areas exceeding the national average price by up to 50 cents/gal. Unplanned refinery outages or other disruptions to supply can also lead to regional product prices rising above the forecast levels. EIA forecasts average summer retail gasoline prices to range from a high of $3.22/gal in Petroleum Administration for Defense District (PADD) 5, the West Coast, to a low of $2.45/gal in PADD 3, the Gulf Coast.
Because gasoline taxes and retail distribution costs are generally stable, movements in gasoline and diesel prices are primarily the result of changes in crude oil prices and wholesale margins.
The Brent crude oil price is forecast to average $63/b ($1.50/gal) this summer, compared with an average of $51/b ($1.21/gal) last summer. Any difference between actual crude oil prices and EIA’s forecast would likely be reflected in the retail price of fuel at the pump. Absent other factors specific to the gasoline and diesel fuel markets, each dollar per barrel of sustained price change in crude oil compared with the forecast translates into a 2.4-cent-per-gallon change in product prices.
EIA expects wholesale gasoline margins (the difference between the wholesale price of gasoline and the Brent crude oil price) will average 46 cents/gal this summer, which would be 2 cents/gal lower than last summer and 1 cent/gal higher than the previous five-summer average. Wholesale margins are forecast to be lower this summer compared with last summer primarily

U.S. Energy Information Administration | Short-Term Energy Outlook April 2018 2
because of flattening gasoline demand growth as a result of rising gasoline prices and increasing fuel efficiency.
The market’s expectation of uncertainty in monthly average gasoline prices is reflected in the pricing and implied volatility of futures and options contracts. New York Harbor reformulated blendstock for oxygenate blending (RBOB) futures contracts for July 2018 delivery that were traded over the five-day period ending April 5 averaged $1.98/gal. The probability that the RBOB futures price will exceed $2.25/gal (consistent with a U.S. average regular gasoline retail price above $3.00/gal) in July 2018 is 12%. The probability that the RBOB futures price will fall below $1.75/gal (consistent with a U.S. average regular gasoline retail price below $2.50/gal) is 15%.
For all of 2018, the average regular-grade gasoline retail price is forecast to be $2.64/gal and gasoline retail prices for all grades is forecast to average $2.76/gal, which would result in the average U.S. household spending about $190 more on motor fuel in 2018 compared with 2017. This increase would be the second consecutive annual increase in motor fuel expenditures, after four years of declining expenditures from 2013–16. Average household motor fuel expenses in 2018 are forecast to be similar to the average annual expenditures from 2008–17.
For summer 2018, EIA forecasts motor gasoline consumption to average 9.56 million barrels per day (b/d), up almost 20,000 b/d (0.2%) compared with last summer’s record high. Highway travel is forecast to be 1.3% higher than last summer. The effect of the increase in highway travel is expected to be partially offset by a 1.2% increase in fleet-wide vehicle fuel efficiency.
Finished motor gasoline is supplied by four sources: domestic refinery output, fuel ethanol blending, imports of gasoline and gasoline blending components, and withdrawals from primary inventories. EIA expects that domestic refinery production, including gasoline blendstock output, will be about 170,000 b/d higher this summer than last summer. Fuel ethanol blending into gasoline this summer is projected to increase by about 10,000 b/d from last summer’s level to 960,000 b/d, which would be 10.1% of total gasoline consumption. Projected total gasoline net imports (including blending components) are down by 130,000 b/d from last summer’s level. The rate of gasoline stock withdrawals is projected to be about 30,000 b/d lower than last summer. With the slower withdrawal rate of gasoline stocks, stocks are expected to end the summer driving season about 2% higher than last year.
At the beginning of the summer driving season (April 1), total gasoline stocks were 237.8 million barrels, 1.1 million barrels lower than a year ago but 5.4 million barrels above the previous five-year average for beginning-of-season stocks. This summer, the total gasoline stock draw is projected to average about 54,000 b/d. Total gasoline inventories are projected to end the summer at 228.0 million barrels, 4.2 million barrels above last year’s level at that time and 6.2 million barrels above the previous five-year average. Stock withdrawals have become an increasingly significant source of motor gasoline supply for the summer season in recent years, having averaged 58,000 b/d during the summers from 2013–17 and 83,000 b/d last summer, compared with an average of 38,000 b/d during the 10 summers from 2003–12.
U.S. Energy Information Administration | Short-Term Energy Outlook April 2018 3
Diesel Fuel. Forecast consumption of distillate fuel, which includes diesel fuel and heating oil, averages 4.0 million b/d this summer. This level is 100,000 b/d (2.7%) higher than last summer’s consumption and would mark the highest summer distillate consumption since 2007, when consumption reached 4.1 million b/d. This growth is mainly driven by a combination of higher economic growth, industrial output, and international trade activity, all of which contribute to higher trucking activity. High crude oil and natural gas production also could contribute to diesel consumption growth. Increases in drilling activity leads to higher consumption of distillate fuel, which is used to operate and transport drilling rigs. U.S. crude oil production in March 2018 is estimated to have been 14% higher than at the same time last year, and active oil drilling rigs were more than 20% higher. U.S. oil production is forecast to increase another 4% by the end of September, leading to potentially higher demand for diesel fuel.
Distillate fuel is supplied by four sources: domestic refinery output, biodiesel blending, withdrawals from primary inventories, and imports. EIA expects refinery output of distillate fuel to average 5.3 million b/d this summer, up 250,000 b/d from last summer. The production of biodiesel is forecast to average about 140,000 b/d this summer, up more than 30,000 b/d from last summer. Projected net exports of distillate fuel average 1.3 million b/d this summer, down about 10,000 b/d from last summer.
Distillate inventories are estimated to have started the summer at 129.2 million barrels. This level is lower than the 151.1 million barrels recorded at the start of last summer and 5.5 million barrels below the previous five-year average. Distillate inventories typically build during the summer season in preparation for the winter heating season. This summer, the build is forecast to average about 69,000 b/d, up from the 74,000 b/d draw recorded last summer and higher than the five-year average summer build of 38,000 b/d. Forecast end-of-summer stocks are 141.8 million barrels, up from the 137.5 million barrels recorded at the end of last summer and similar to the five-year end-of-summer average.
Forecast wholesale diesel fuel margins average 48 cents/gal this summer, 7 cents/gal higher than last summer’s level and 6 cents/gal higher than the previous five-summer average. Diesel margins are forecast to be higher than in recent years because of the continuing growth in U.S. distillate consumption.
Although diesel margins are expected to be higher this summer than last summer, a buildout of refinery capacity geared toward diesel production in the past several years is expected to provide ample distillate fuel supplies and to moderate significant further upward pressure on distillate margins.
With higher wholesale diesel margins and crude oil prices, retail diesel prices are forecast to be higher this summer compared with last year. Diesel fuel retail prices are projected to average $2.92/gal this summer, up from an average of $2.59/gal last summer but still below the previous five-year average of $3.09/gal.
U.S. Energy Information Administration | Short-Term Energy Outlook April 2018 4
Electricity
EIA considers the summer electricity generation period to run from June through August. Total retail sales of electricity in the United States typically peak in July or August, primarily because of air conditioning use in the residential and commercial sectors. According to projections from the National Oceanic and Atmospheric Administration (NOAA), U.S. cooling degree days from June–August this summer are expected to be 1.7% higher than last summer but 0.9% lower than the previous 10-year summer average.
EIA expects the typical U.S. residential customer will use an average of 1,055 kilowatthours of electricity per month this summer, about 1% more than the same period last year, as a result of warmer forecast temperatures. Compared with last summer, this summer’s temperatures are forecast to be warmer throughout the eastern area of the country but milder in the western states. Summer-over-summer changes in average household electricity usage range from 6% less consumption in the Pacific states to 5% more consumption in New England.
The average U.S. residential electricity price from June–August is expected to be 2.3% higher than last summer, primarily as a result of higher generation fuel costs. Retail electricity rates are also rising as utilities increase their investment in transmission infrastructure. Prices are expected to be higher this summer in all regions of the country, ranging from a forecast 1.6% increase in the West South Central Census division to a 3.8% increase in New England.
Higher electricity prices combined with increased consumption in some regions contribute to EIA’s expectation that typical retail electricity bills will be higher this summer than last summer. EIA forecasts the typical U.S. residential electricity bill will average $142 per month this summer, which is 3.4% more than last summer. The typical customer’s summer electricity bill varies throughout the country, depending on the need for air conditioning. In the Pacific states, electricity bills are forecast to average $113/month (4.5% lower than last summer), and in the West South Central area, forecast bills average $166/month (4.7% higher).
Expected warmer summer temperatures contribute to higher forecast levels of U.S. total generation, averaging 12.7 terawatthours per day in June, July, and August, which is 2.1% above average U.S. generation last summer. Natural gas fuels the largest share of generation by the electric power sector, supplying a forecast 36% of total U.S. generation this summer, up from 34% last summer. In contrast, coal-fired power plants are forecast to supply 30% of total electricity generation, compared with 32% last summer. Nuclear power fuels a forecast 19% share of generation, the same as last summer. The share of generation from conventional hydropower is forecast to be 7% this summer, which is unchanged from last summer, while added wind capacity boosts its share of generation to 5% from 4% last summer.
EIA expects the cost of natural gas to electric generators to be relatively similar this summer compared with last year. The forecast share of natural gas-fired generation rises while coal declines, primarily as a result of the expected changes in the nation’s mix of electric generating capacity. The electric power sector is expanding its fleet of generating units powered by natural gas, with 13 gigawatts of new capacity scheduled to be online by the end of August 2018
U.S. Energy Information Administration | Short-Term Energy Outlook April 2018 5
compared with the same month last year. In contrast, the total amount of U.S. coal capacity in August this year will be about 11 gigawatts lower than last summer as a result of recent retirements of coal power plants, especially in Texas.
This report was prepared by the U.S. Energy Information Administration (EIA), the statistical and analytical agency within the U.S. Department of Energy. By law, EIA's data, analyses, and forecasts are independent of approval by any other officer or employee of the United States Government. The views in this report therefore should not be construed as representing those of the U.S. Department of Energy or other federal agencies.
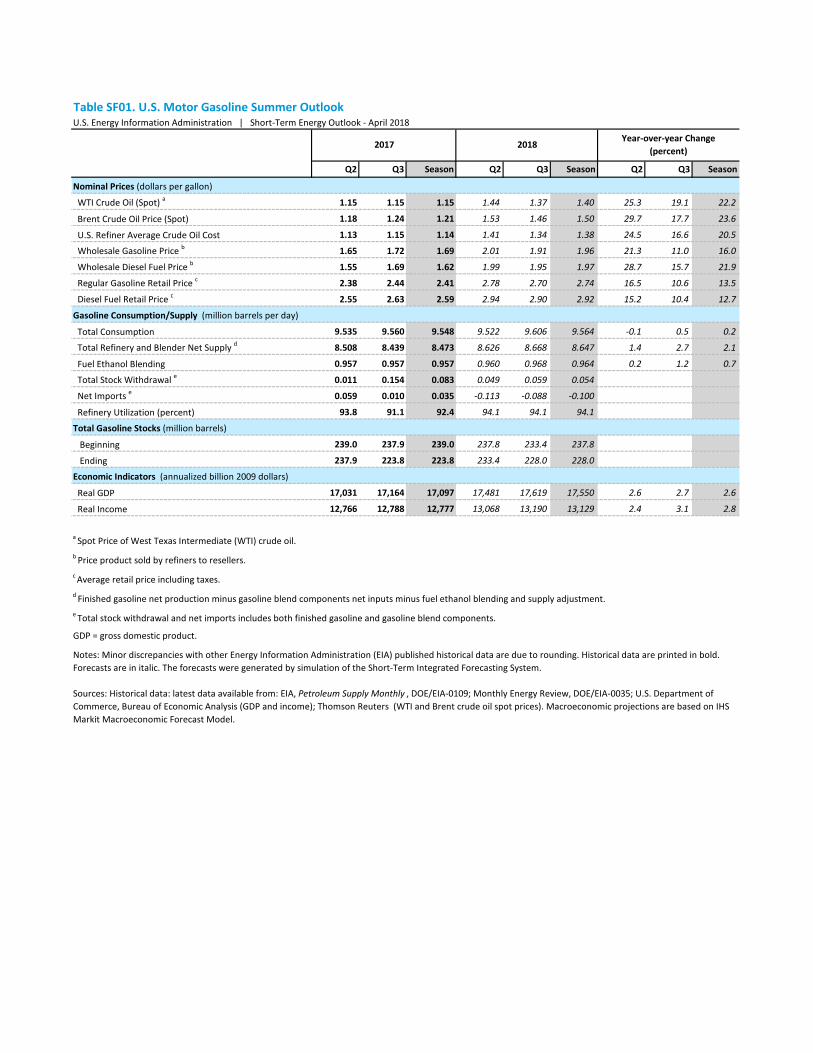
Table SF01. U.S. Motor Gasoline Summer Outlook
Q2 Q3 Season Q2 Q3 Season Q2 Q3 Season
Nominal Prices (dollars per gallon)
WTI Crude Oil (Spot) a 1.15 1.15 1.15 1.44 1.37 1.40 25.3 19.1 22.2
Brent Crude Oil Price (Spot) 1.18 1.24 1.21 1.53 1.46 1.50 29.7 17.7 23.6
U.S. Refiner Average Crude Oil Cost 1.13 1.15 1.14 1.41 1.34 1.38 24.5 16.6 20.5
Wholesale Gasoline Price b 1.65 1.72 1.69 2.01 1.91 1.96 21.3 11.0 16.0
Wholesale Diesel Fuel Price b 1.55 1.69 1.62 1.99 1.95 1.97 28.7 15.7 21.9
Regular Gasoline Retail Price c 2.38 2.44 2.41 2.78 2.70 2.74 16.5 10.6 13.5
Diesel Fuel Retail Price c 2.55 2.63 2.59 2.94 2.90 2.92 15.2 10.4 12.7
Gasoline Consumption/Supply (million barrels per day)
Total Consumption 9.535 9.560 9.548 9.522 9.606 9.564 -0.1 0.5 0.2
Total Refinery and Blender Net Supply d 8.508 8.439 8.473 8.626 8.668 8.647 1.4 2.7 2.1
Fuel Ethanol Blending 0.957 0.957 0.957 0.960 0.968 0.964 0.2 1.2 0.7
Total Stock Withdrawal e 0.011 0.154 0.083 0.049 0.059 0.054
Net Imports e 0.059 0.010 0.035 -0.113 -0.088 -0.100
Refinery Utilization (percent) 93.8 91.1 92.4 94.1 94.1 94.1
Total Gasoline Stocks (million barrels)
Beginning 239.0 237.9 239.0 237.8 233.4 237.8
Ending 237.9 223.8 223.8 233.4 228.0 228.0
Economic Indicators (annualized billion 2009 dollars)
Real GDP 17,031 17,164 17,097 17,481 17,619 17,550 2.6 2.7 2.6
Real Income 12,766 12,788 12,777 13,068 13,190 13,129 2.4 3.1 2.8
2017 2018
a Spot Price of West Texas Intermediate (WTI) crude oil.
Year-over-year Change(percent)
U.S. Energy Information Administration | Short-Term Energy Outlook - April 2018
Sources: Historical data: latest data available from: EIA, Petroleum Supply Monthly , DOE/EIA-0109; Monthly Energy Review, DOE/EIA-0035; U.S. Department of Commerce, Bureau of Economic Analysis (GDP and income); Thomson Reuters (WTI and Brent crude oil spot prices). Macroeconomic projections are based on IHS Markit Macroeconomic Forecast Model.
e Total stock withdrawal and net imports includes both finished gasoline and gasoline blend components.
GDP = gross domestic product.
Notes: Minor discrepancies with other Energy Information Administration (EIA) published historical data are due to rounding. Historical data are printed in bold. Forecasts are in italic. The forecasts were generated by simulation of the Short-Term Integrated Forecasting System.
b Price product sold by refiners to resellers.c Average retail price including taxes.d Finished gasoline net production minus gasoline blend components net inputs minus fuel ethanol blending and supply adjustment.
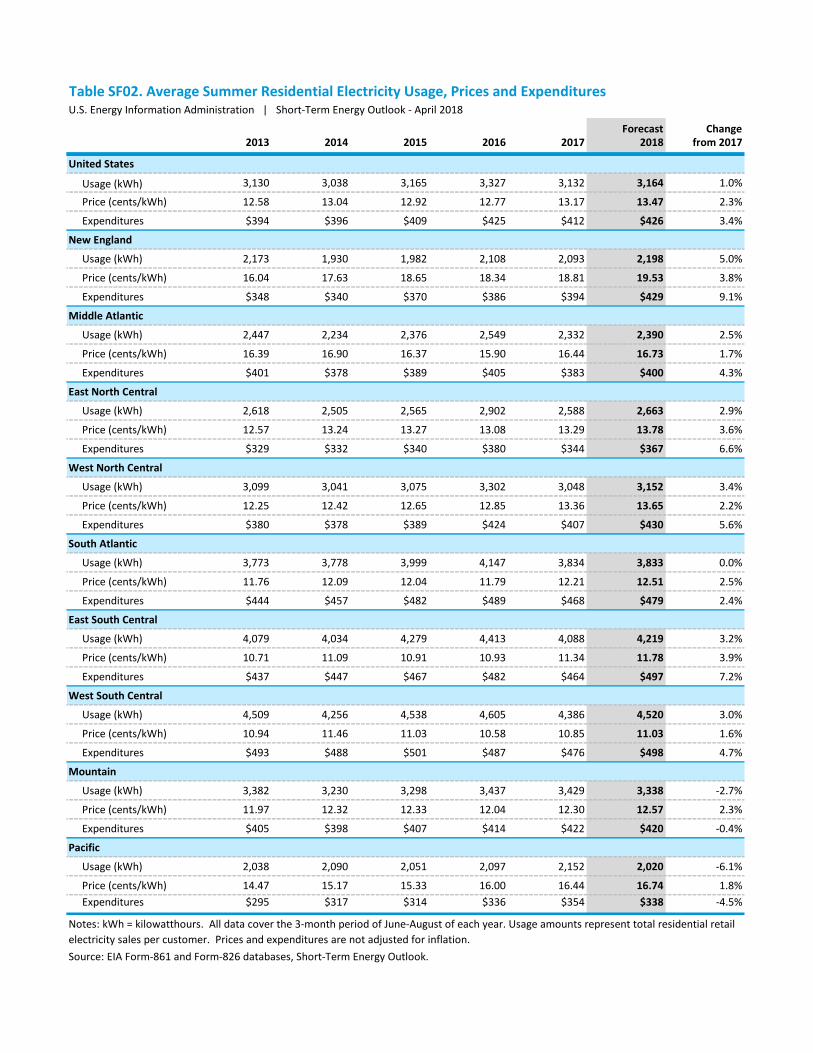
Forecast Change2013 2014 2015 2016 2017 2018 from 2017
United States
Usage (kWh) 3,130 3,038 3,165 3,327 3,132 3,164 1.0%
Price (cents/kWh) 12.58 13.04 12.92 12.77 13.17 13.47 2.3%
Expenditures $394 $396 $409 $425 $412 $426 3.4%
New England
Usage (kWh) 2,173 1,930 1,982 2,108 2,093 2,198 5.0%
Price (cents/kWh) 16.04 17.63 18.65 18.34 18.81 19.53 3.8%
Expenditures $348 $340 $370 $386 $394 $429 9.1%
Middle Atlantic
Usage (kWh) 2,447 2,234 2,376 2,549 2,332 2,390 2.5%
Price (cents/kWh) 16.39 16.90 16.37 15.90 16.44 16.73 1.7%
Expenditures $401 $378 $389 $405 $383 $400 4.3%
East North Central
Usage (kWh) 2,618 2,505 2,565 2,902 2,588 2,663 2.9%
Price (cents/kWh) 12.57 13.24 13.27 13.08 13.29 13.78 3.6%
Expenditures $329 $332 $340 $380 $344 $367 6.6%
West North Central
Usage (kWh) 3,099 3,041 3,075 3,302 3,048 3,152 3.4%
Price (cents/kWh) 12.25 12.42 12.65 12.85 13.36 13.65 2.2%
Expenditures $380 $378 $389 $424 $407 $430 5.6%
South Atlantic
Usage (kWh) 3,773 3,778 3,999 4,147 3,834 3,833 0.0%
Price (cents/kWh) 11.76 12.09 12.04 11.79 12.21 12.51 2.5%
Expenditures $444 $457 $482 $489 $468 $479 2.4%
East South Central
Usage (kWh) 4,079 4,034 4,279 4,413 4,088 4,219 3.2%
Price (cents/kWh) 10.71 11.09 10.91 10.93 11.34 11.78 3.9%
Expenditures $437 $447 $467 $482 $464 $497 7.2%
West South Central
Usage (kWh) 4,509 4,256 4,538 4,605 4,386 4,520 3.0%
Price (cents/kWh) 10.94 11.46 11.03 10.58 10.85 11.03 1.6%
Expenditures $493 $488 $501 $487 $476 $498 4.7%
Mountain
Usage (kWh) 3,382 3,230 3,298 3,437 3,429 3,338 -2.7%
Price (cents/kWh) 11.97 12.32 12.33 12.04 12.30 12.57 2.3%
Expenditures $405 $398 $407 $414 $422 $420 -0.4%
Pacific
Usage (kWh) 2,038 2,090 2,051 2,097 2,152 2,020 -6.1%
Price (cents/kWh) 14.47 15.17 15.33 16.00 16.44 16.74 1.8% Expenditures $295 $317 $314 $336 $354 $338 -4.5%
Table SF02. Average Summer Residential Electricity Usage, Prices and ExpendituresU.S. Energy Information Administration | Short-Term Energy Outlook - April 2018
Notes: kWh = kilowatthours. All data cover the 3-month period of June-August of each year. Usage amounts represent total residential retail electricity sales per customer. Prices and expenditures are not adjusted for inflation.Source: EIA Form-861 and Form-826 databases, Short-Term Energy Outlook.
www.eia.govU.S. Energy Information Administration Independent Statistics & Analysis
April 10, 2018
2018 Summer Fuels Outlook
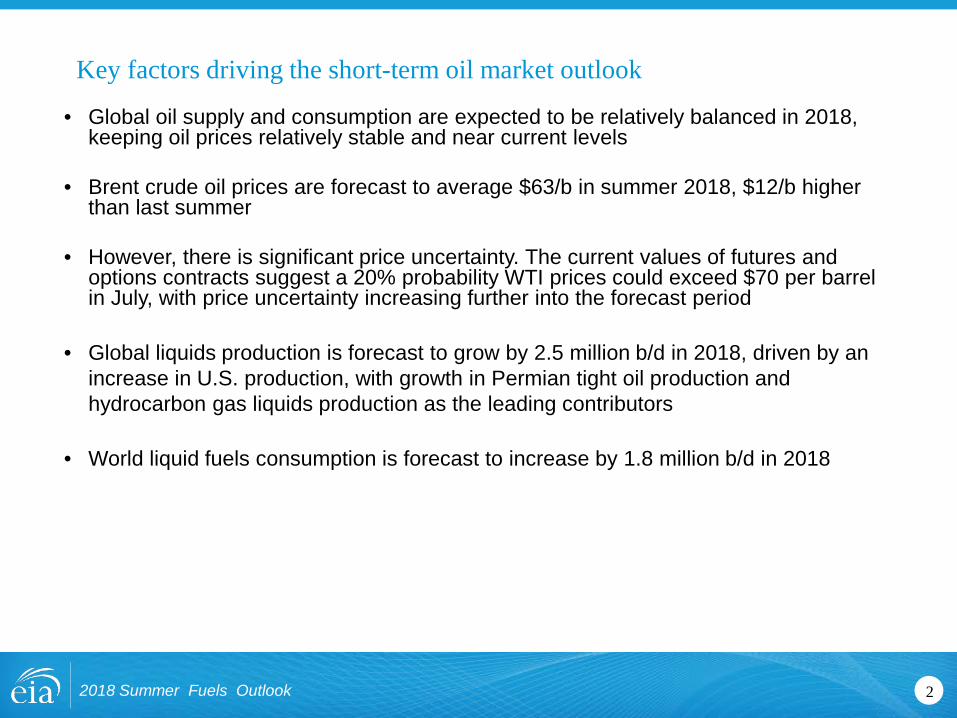
Key factors driving the short-term oil market outlook
• Global oil supply and consumption are expected to be relatively balanced in 2018, keeping oil prices relatively stable and near current levels
• Brent crude oil prices are forecast to average $63/b in summer 2018, $12/b higher than last summer
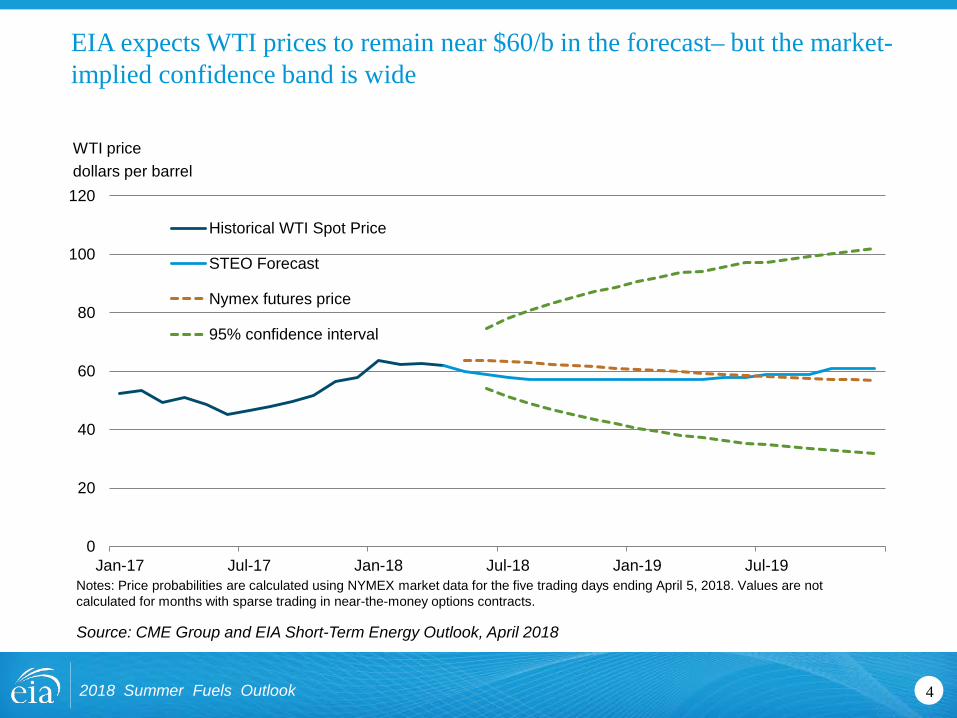
• However, there is significant price uncertainty. The current values of futures and options contracts suggest a 20% probability WTI prices could exceed $70 per barrel in July, with price uncertainty increasing further into the forecast period
• Global liquids production is forecast to grow by 2.5 million b/d in 2018, driven by an increase in U.S. production, with growth in Permian tight oil production and hydrocarbon gas liquids production as the leading contributors
• World liquid fuels consumption is forecast to increase by 1.8 million b/d in 2018
22018 Summer Fuels Outlook
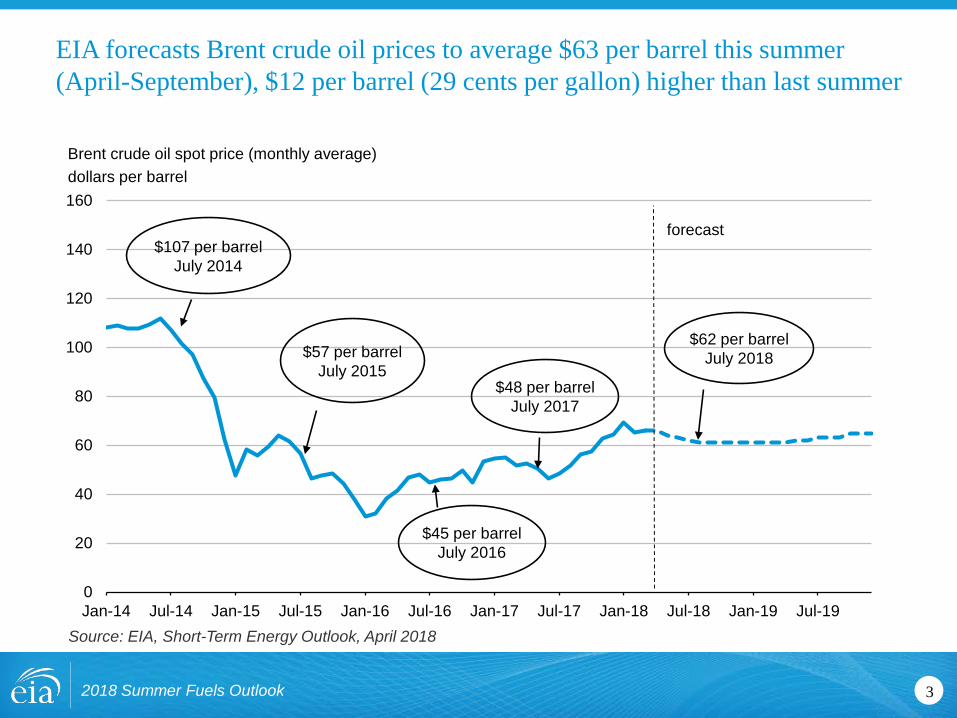
EIA forecasts Brent crude oil prices to average $63 per barrel this summer (April-September), $12 per barrel (29 cents per gallon) higher than last summer
Source: EIA, Short-Term Energy Outlook, April 2018
3
0
20
40
60
80
100
120
140
160
Jan-14 Jul-14 Jan-15 Jul-15 Jan-16 Jul-16 Jan-17 Jul-17 Jan-18 Jul-18 Jan-19 Jul-19
forecast
$45 per barrelJuly 2016
$48 per barrelJuly 2017
$62 per barrelJuly 2018
$107 per barrelJuly 2014
$57 per barrelJuly 2015
Brent crude oil spot price (monthly average)dollars per barrel
2018 Summer Fuels Outlook
0
20
40
60
80
100
120
Jan-17 Jul-17 Jan-18 Jul-18 Jan-19 Jul-19
Historical WTI Spot Price
STEO Forecast
Nymex futures price
95% confidence interval
Notes: Price probabilities are calculated using NYMEX market data for the five trading days ending April 5, 2018. Values are not calculated for months with sparse trading in near-the-money options contracts.
Source: CME Group and EIA Short-Term Energy Outlook, April 2018
42018 Summer Fuels Outlook
EIA expects WTI prices to remain near $60/b in the forecast– but the market-implied confidence band is wide
WTI pricedollars per barrel
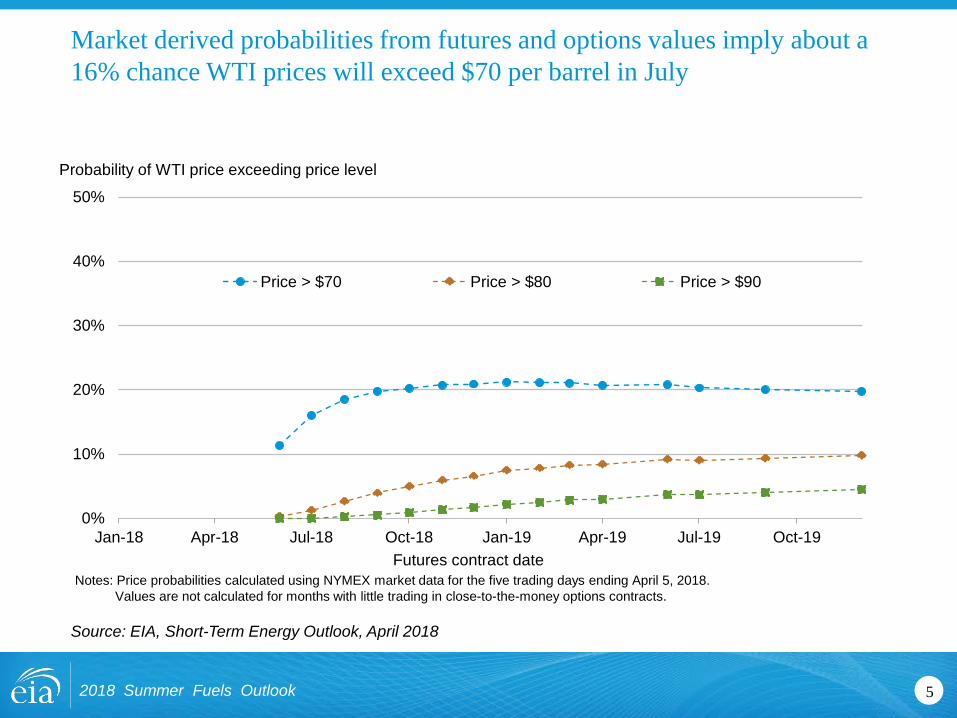
Market derived probabilities from futures and options values imply about a 16% chance WTI prices will exceed $70 per barrel in July
Source: EIA, Short-Term Energy Outlook, April 2018
52018 Summer Fuels Outlook
0%
10%
20%
30%
40%
50%
Jan-18 Apr-18 Jul-18 Oct-18 Jan-19 Apr-19 Jul-19 Oct-19
Price > $70 Price > $80 Price > $90
Notes: Price probabilities calculated using NYMEX market data for the five trading days ending April 5, 2018.Values are not calculated for months with little trading in close-to-the-money options contracts.
Futures contract date
Probability of WTI price exceeding price level
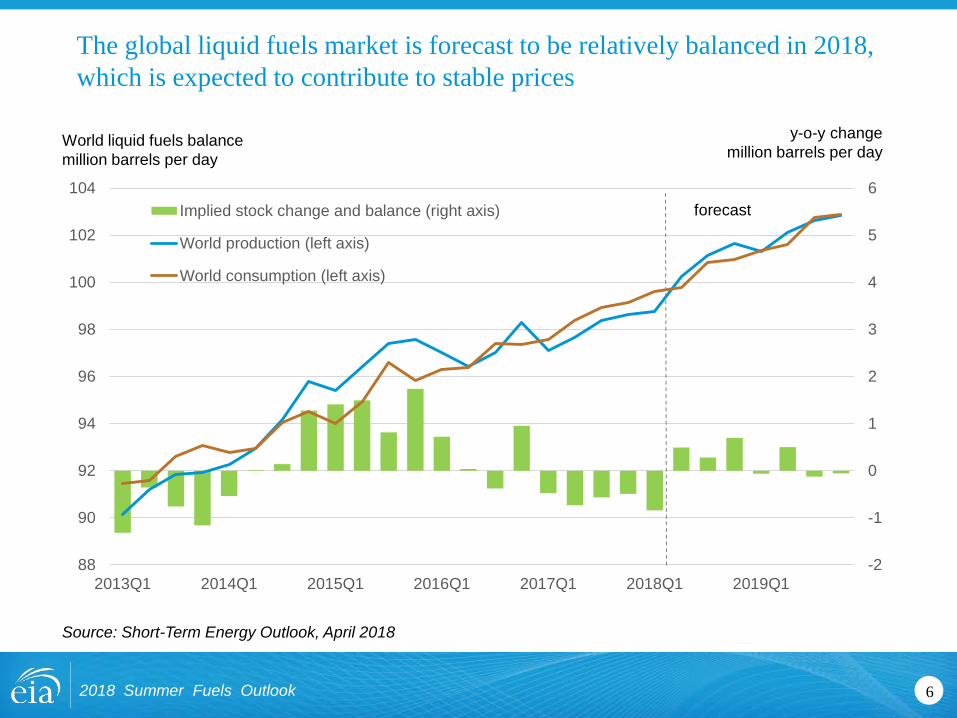
The global liquid fuels market is forecast to be relatively balanced in 2018, which is expected to contribute to stable prices
-2
-1
0
1
2
3
4
5
6
88
90
92
94
96
98
100
102
104
2013Q1 2014Q1 2015Q1 2016Q1 2017Q1 2018Q1 2019Q1
Implied stock change and balance (right axis)
World production (left axis)
World consumption (left axis)
forecast
Source: Short-Term Energy Outlook, April 2018
62018 Summer Fuels Outlook
World liquid fuels balancemillion barrels per day
y-o-y changemillion barrels per day
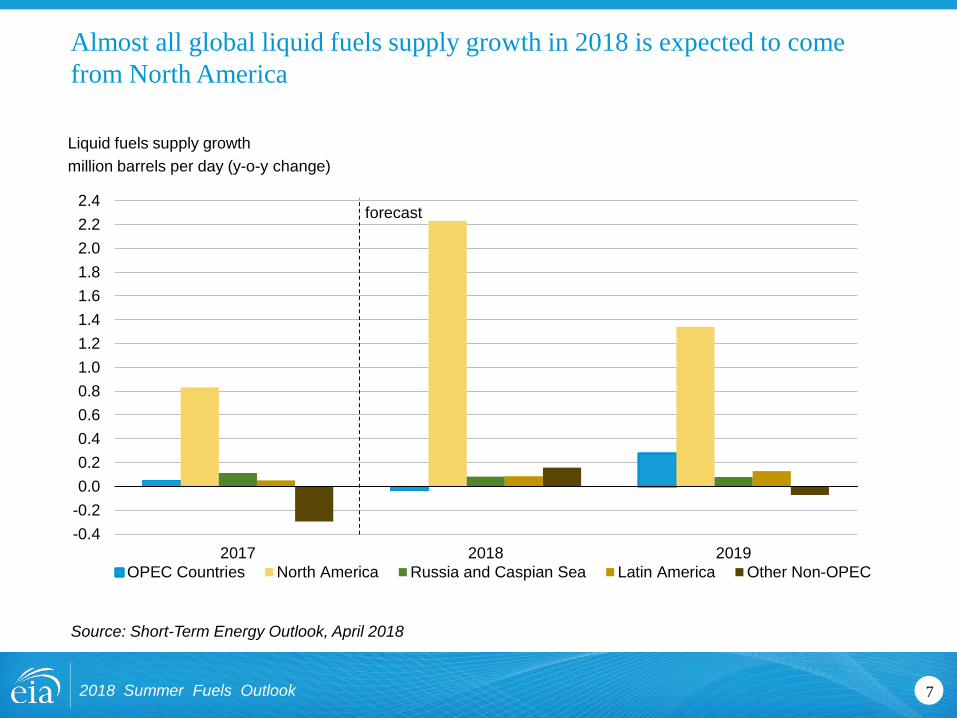
Almost all global liquid fuels supply growth in 2018 is expected to come from North America
-0.4-0.20.00.20.40.60.81.01.21.41.61.82.02.22.4
2017 2018 2019OPEC Countries North America Russia and Caspian Sea Latin America Other Non-OPEC
forecast
72018 Summer Fuels Outlook
Liquid fuels supply growthmillion barrels per day (y-o-y change)
Source: Short-Term Energy Outlook, April 2018
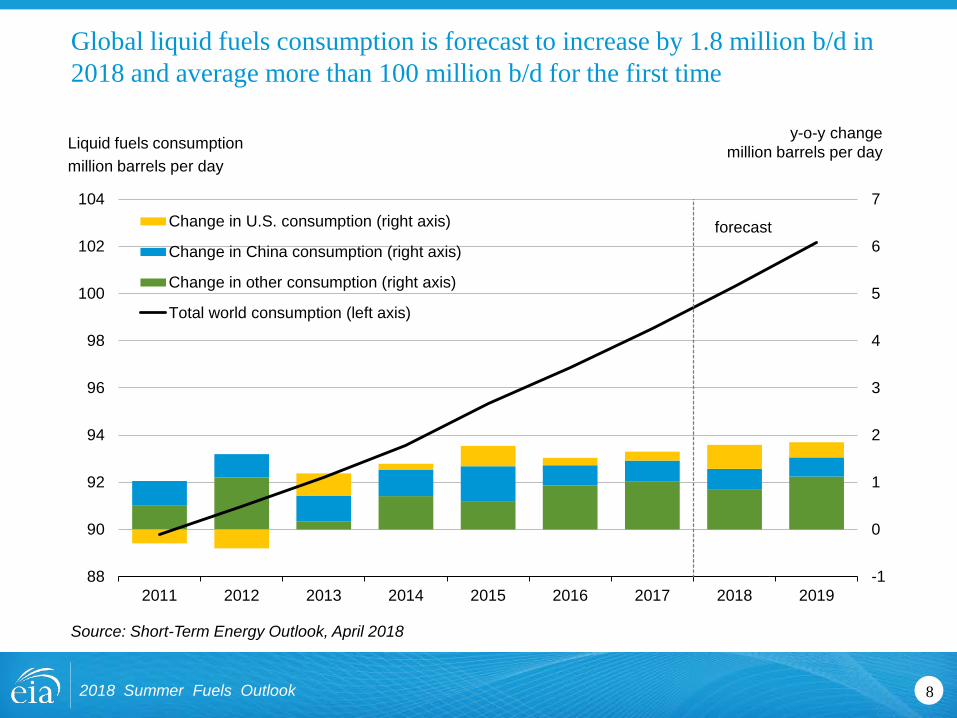
Global liquid fuels consumption is forecast to increase by 1.8 million b/d in 2018 and average more than 100 million b/d for the first time
82018 Summer Fuels Outlook
Liquid fuels consumptionmillion barrels per day
y-o-y changemillion barrels per day
-1
0
1
2
3
4
5
6
7
88
90
92
94
96
98
100
102
104
2011 2012 2013 2014 2015 2016 2017 2018 2019
Change in U.S. consumption (right axis)
Change in China consumption (right axis)
Change in other consumption (right axis)
Total world consumption (left axis)
forecast
Source: Short-Term Energy Outlook, April 2018
Key takeaways for the summer 2018 (April-September) outlook for U.S. gasoline, diesel, and electricity
• Higher Brent crude oil spot prices contribute to gasoline retail prices and retail diesel prices that average 33 cents/gallon higher than last summer
• However, last summer’s retail gasoline prices were the second lowest since 2005, and retail gasoline prices this summer are still expected to be 15 cents/gallon lower than the average price from the previous five summers of $2.89/gallon
• This summer, gasoline consumption is forecast to be 0.2% higher than last year’s record level summer consumption, as the effects of higher retail prices are more than offset by employment and income growth, which contribute to increasing highway travel
• Electricity consumption is expected to be higher than last summer based on the assumption of slightly warmer temperatures than last summer, which, along with higher electricity prices, leads to an expected increase in summer electricity expenditures of 3.4%
92018 Summer Fuels Outlook
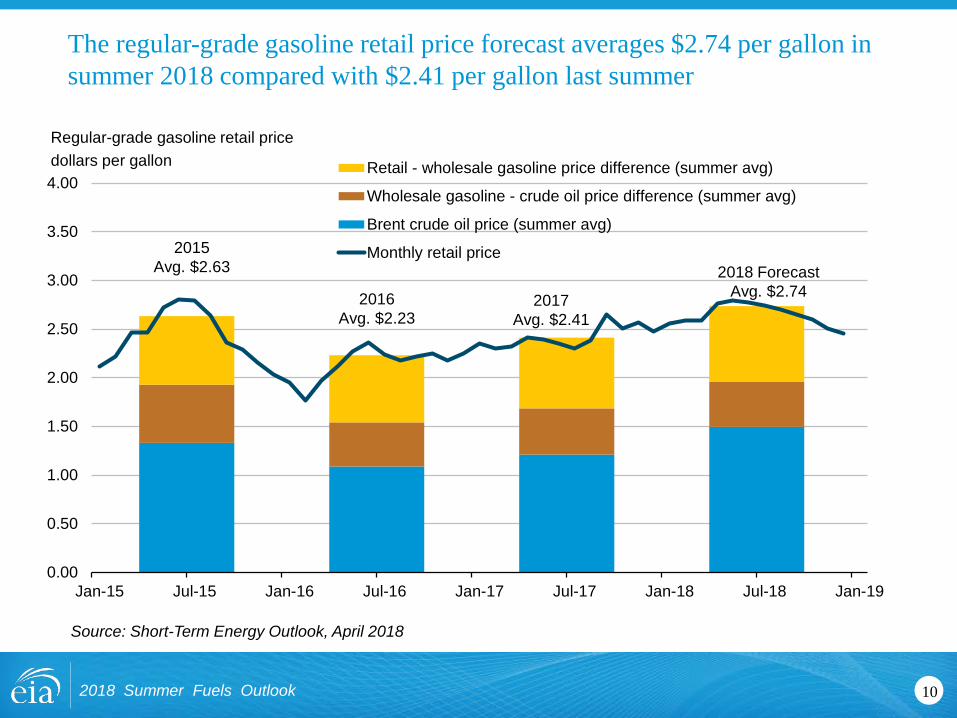
The regular-grade gasoline retail price forecast averages $2.74 per gallon in summer 2018 compared with $2.41 per gallon last summer
102018 Summer Fuels Outlook
0.00
0.50
1.00
1.50
2.00
2.50
3.00
3.50
4.00
Jan-15 Jul-15 Jan-16 Jul-16 Jan-17 Jul-17 Jan-18 Jul-18 Jan-19
Retail - wholesale gasoline price difference (summer avg)
Wholesale gasoline - crude oil price difference (summer avg)
Brent crude oil price (summer avg)
Monthly retail price2015Avg. $2.63
2016Avg. $2.23
2017Avg. $2.41
2018 ForecastAvg. $2.74
Regular-grade gasoline retail pricedollars per gallon
Source: Short-Term Energy Outlook, April 2018
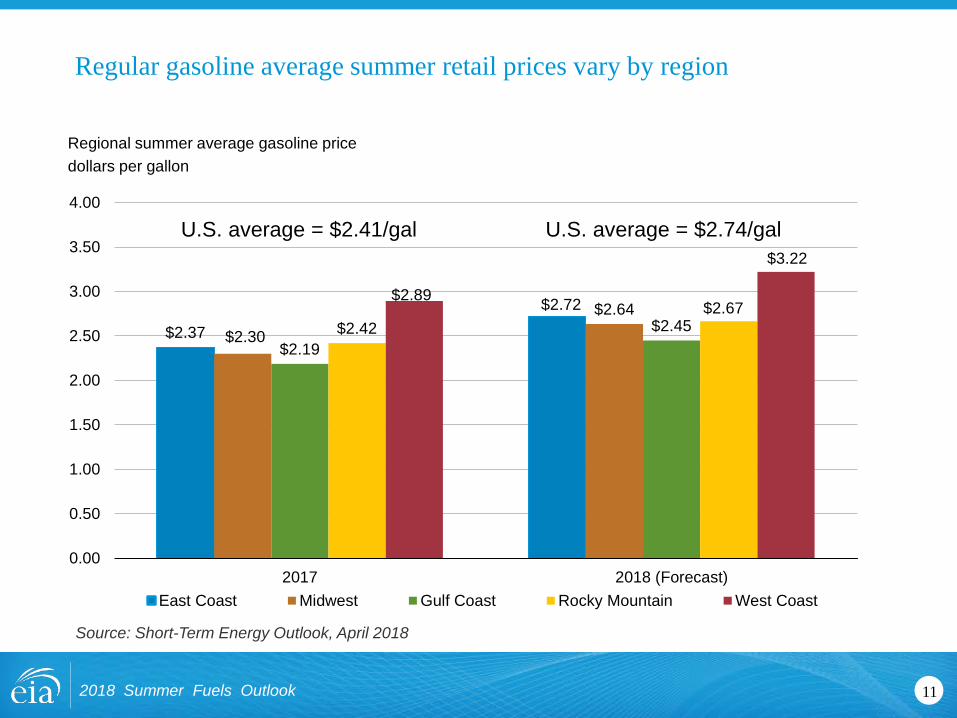
Regular gasoline average summer retail prices vary by region
$2.37
$2.72
$2.30
$2.64
$2.19$2.45$2.42
$2.67$2.89
$3.22
0.00
0.50
1.00
1.50
2.00
2.50
3.00
3.50
4.00
2017 2018 (Forecast)East Coast Midwest Gulf Coast Rocky Mountain West Coast
U.S. average = $2.41/gal U.S. average = $2.74/gal
Source: Short-Term Energy Outlook, April 2018
112018 Summer Fuels Outlook
Regional summer average gasoline pricedollars per gallon
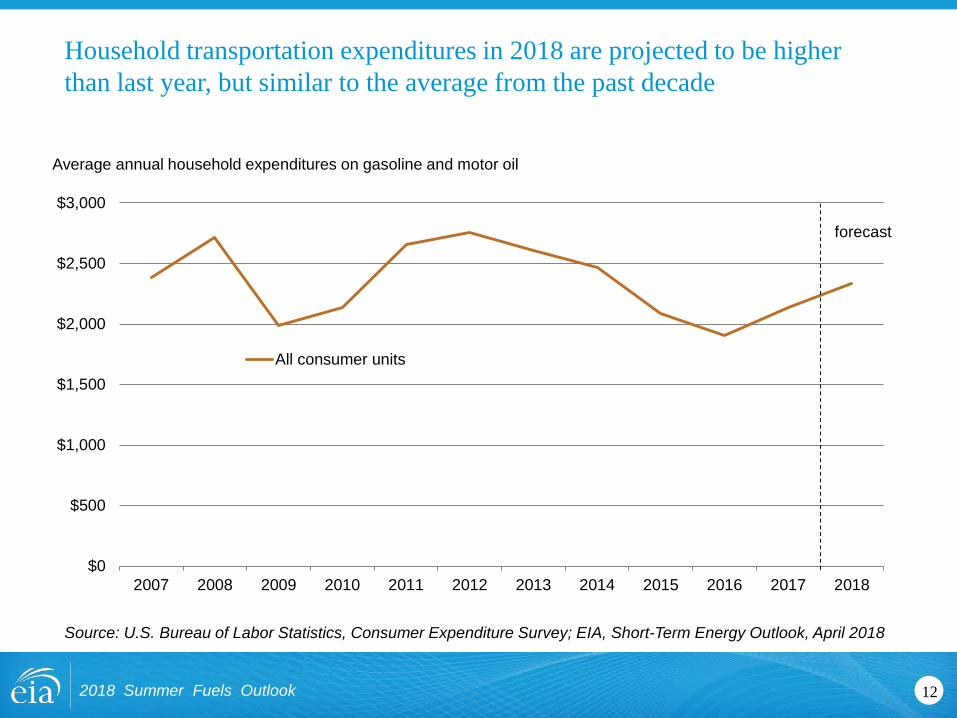
Household transportation expenditures in 2018 are projected to be higher than last year, but similar to the average from the past decade
Average annual household expenditures on gasoline and motor oil
Source: U.S. Bureau of Labor Statistics, Consumer Expenditure Survey; EIA, Short-Term Energy Outlook, April 2018
122018 Summer Fuels Outlook
$0
$500
$1,000
$1,500
$2,000
$2,500
$3,000
2007 2008 2009 2010 2011 2012 2013 2014 2015 2016 2017 2018
All consumer units
forecast

Higher forecast gasoline supply offsets forecasted increases in consumption and lower net imports
0.050.02
0.140.17
0.01 0.01
0.00 -0.03
-0.10-0.13
-0.3
-0.2
-0.1
0.0
0.1
0.2
0.3
2017 2018
Gasoline Consumption Refinery and blender net supply Ethanol blending Stock draw Net imports
forecast
Source: Short-Term Energy Outlook, April 2018
132018 Summer Fuels Outlook
Supply and consumption of gasolinemillion barrels per day (y-o-y changes)

The summer retail diesel price forecast averages $2.92 per gallon, up 33 cents per gallon from last summer
142018 Summer Fuels Outlook
0.00
0.50
1.00
1.50
2.00
2.50
3.00
3.50
4.00
Jan-15 Jul-15 Jan-16 Jul-16 Jan-17 Jul-17 Jan-18 Jul-18
Retail - wholesale diesel price difference (summer avg)Wholesale diesel - crude oil price difference (summer avg)Brent crude oil price (summer avg)Monthly retail price2015
Avg. $2.74
2016Avg. $2.34
2017Avg. $2.59
2018 ForecastAvg. $2.92
Diesel retail pricedollars per gallon
Source: Short-Term Energy Outlook, April 2018
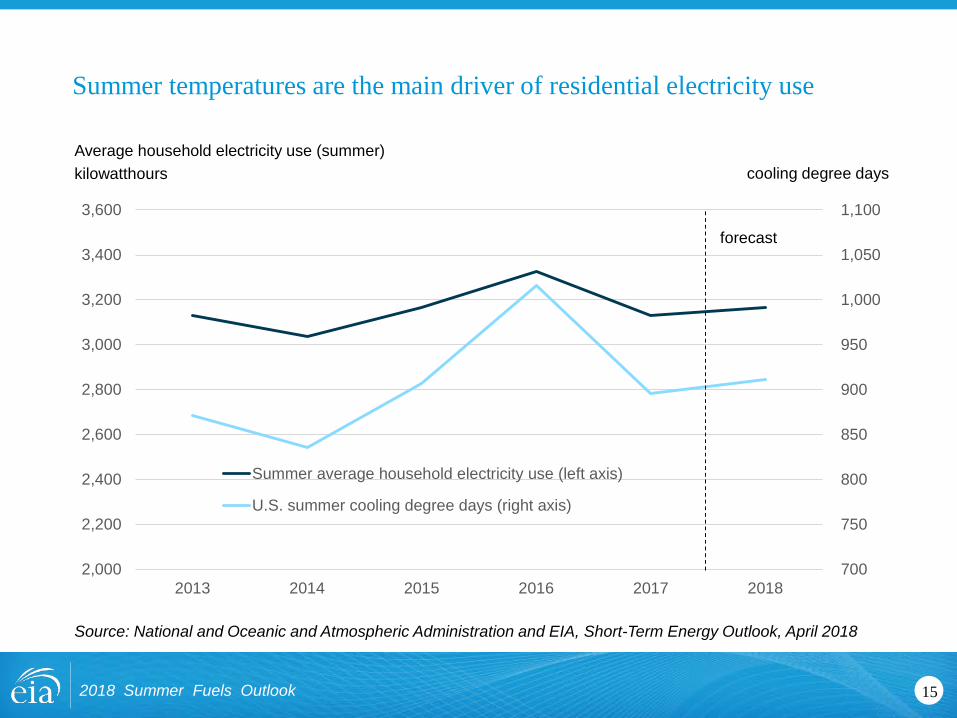
Summer temperatures are the main driver of residential electricity use
Source: National and Oceanic and Atmospheric Administration and EIA, Short-Term Energy Outlook, April 2018
152018 Summer Fuels Outlook
Average household electricity use (summer)kilowatthours
700
750
800
850
900
950
1,000
1,050
1,100
2,000
2,200
2,400
2,600
2,800
3,000
3,200
3,400
3,600
2013 2014 2015 2016 2017 2018
Summer average household electricity use (left axis)
U.S. summer cooling degree days (right axis)
forecast
cooling degree days
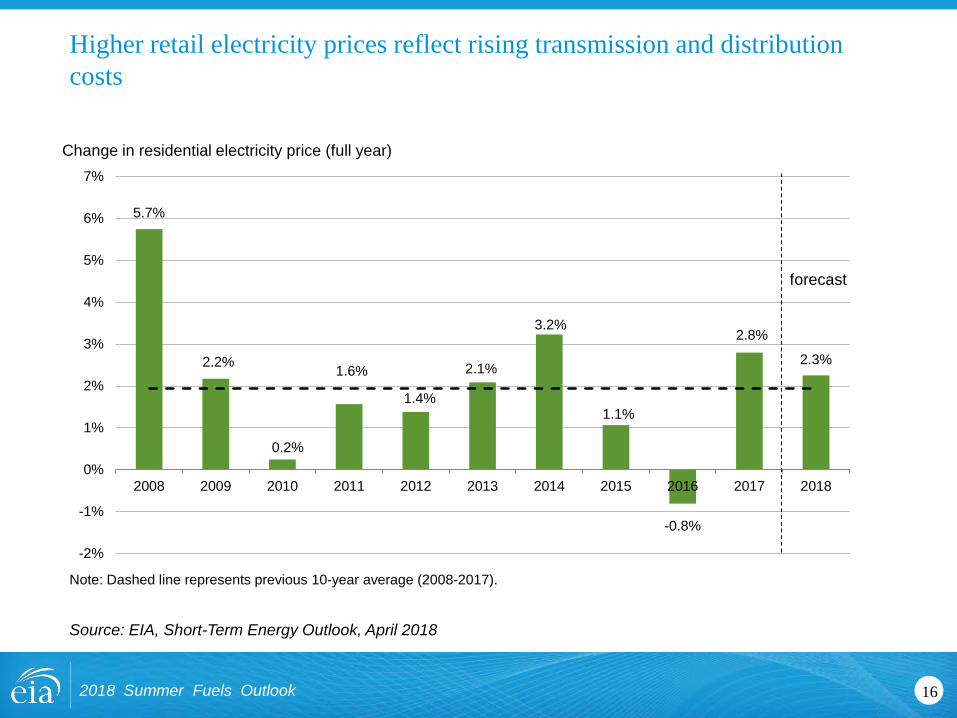
Higher retail electricity prices reflect rising transmission and distribution costs
5.7%
2.2%
0.2%
1.6%
1.4%
2.1%
3.2%
1.1%
-0.8%
2.8%
2.3%
-2%
-1%
0%
1%
2%
3%
4%
5%
6%
7%
2008 2009 2010 2011 2012 2013 2014 2015 2016 2017 2018
forecast
Note: Dashed line represents previous 10-year average (2008-2017).
Source: EIA, Short-Term Energy Outlook, April 2018
162018 Summer Fuels Outlook
Change in residential electricity price (full year)
For more information
2018 Summer Fuels Outlook 17
U.S. Energy Information Administration home page | www.eia.gov
Short-Term Energy Outlook | http://www.eia.gov/outlooks/steo
Annual Energy Outlook | http://www.eia.gov/outlooks/aeo
International Energy Outlook | http://www.eia.gov/outlooks/ieo
Monthly Energy Review | https://www.eia.gov/totalenergy/data/monthly
Today in Energy | www.eia.gov/todayinenergy