summer school on tectonic-magmatic interactionthora/summer2003/abstracts_july9.pdf · summer school...
TRANSCRIPT

Nordic Volcanological Institute report 0303
Summer School on Tectonic-Magmatic Interaction
31 August – 8 September, 2003
Geysir, South Iceland
Abstract volume
Thóra Árnadóttir and Freysteinn Sigmundsson (editors) Nordic Volcanological Institute
Ridge 2000 Program, National Science Foundation, USA NorFA (Nordic Academy for Advanced Study)
RANNÍS (Icelandic Center for Research)

"U.S. participation in this workshop and publication of this document were funded as part of the Ridge 2000 Program, which is supported by
the U.S. National Science Foundation Grant No. 0116823. Any opinions, findings, and conclusions or recommendations expressed in this material are those of the author(s) and do not necessarily reflect
the views of the National Science Foundation." Abstracts should be cited, for example, as : Endo, E., A real-time GPS magma detection system, Summer school on Tectonic-Magmatic Interaction, 31 August – 8 September, 2003, Geysir, South Iceland, p. 14, Nordic Volcanological Institute report 0303, Reykjavik, Iceland, 2003.
2003 Iceland Summer School 1

Abstracts Janet Baran, James Cochran, Suzanne Carbotte, Relationship between Axial Morphology and Axial Magma Chamber Distribution along the Southeast Indian Ridge Chris J. Bean, Gareth S. O Brien and Ivan Lokmer, Lattice-Granular Numerical Modelling of Seismic Waves Induced by Pressure Changes in a Fluid-Filled Conduit Tanya M. Blacic and J. S. McClain, Earthquake relocation beneath the Lassen Peak region in Northeastern California using cross-correlation and the double-difference method Lillemor Claesson, The “prediction in hindsight” of an M 5.8 earthquake at Húsavík on September 16th, 2002 Cees-Jan de Hoog, K.H. Hattori, Oxidized mantle under Mount Pinatubo, Philippines: implications for sulfur transport and degassing Emily K. Desmarais and Paul Segall, Transient ground motion associated with the January 30, 1997 dike intrusion at Kilauea Volcano, Hawaii Tim H. Dixon, Peter La Femina, Jackie E. Dixon, Rocco Malservisi, and G. Ofeagbu, Did the February-March 2000 Hekla Eruption Trigger the June 2000 South Iceland Seismic Zone Earthquakes? Elliot Endo, A Real-time GPS Magma Detection System David A. Ferrill, Alan P. Morris, Darrell W. Sims, Danielle Y. Wyrick, Deborah J. Waiting, and Nathan M. Franklin, Dilational Normal Faults in Iceland: Analogs for Normal Faults on Mars and Mechanism for Pit Chain Development Jacqueline S. Floyd, Maya Tolstoy, John Mutter, and Chris Scholz , Seismotectonics of Mid-Ocean Ridge Propagation in Hess Deep Stephanie Flude, Dave McGarvie, Ray Burgess, Subglacial Rhyolites from Kerlingarfjoll, Iceland: Geochemical Evolution and Preliminary Eruption Ages Halldór Geirsson, Þóra Árnadóttir, Erik Sturkell, Freysteinn Sigmundsson, Páll Einarsson, and Thierry Villemin, Continuous GPS observations in Iceland Sigurlaug Hjaltadóttir, Kristín Vogfjörð, and Ragnar Slunga, Relative locations of earthquakes in SW-Iceland
2003 Iceland Summer School 2
Dorthe Hegnet Holm and J. Richard Wilson, Textural variations in a large contact metamorphosed metabasaltic inclusion in the Fongen-Hyllingen Intrusion, Norway -a result of mountain-building in the Scandinavian Caledonides Fredrik Holm, R.G. Trønnes, K. Grönvold, H. Karlsson, H. Torfason, Petrology and geochemistry of the Esjufjöll central volcano, SE Iceland Kristín Jónsdóttir, R. Bödvarsson, R. Slunga, Microearthquakes in the Katla volcanic system, South Iceland Sigurjón Jónsson, Paul Segall, Rikke Pedersen, and Grímur Björnsson, What controls aftershock decay in South Iceland?
Karin Josephsen and J. Richard Wilson, Origin of modal layering in the Fongen-Hyllingen Intrusion, Norway Simon A. Kattenhorn, Upward Growth of Normal Faults in Southwest Iceland: Driven By Dike Magmatism? Peter C. La Femina , Tim Dixon, Erik Sturkell, Thóra Árnadóttir, and Freysteinn Sigmundsson, GPS Derived Velocity Field across the Eastern Volcanic Zone, Iceland Mattias Lindman, Possible strain precursors for the June 2000 earthquakes south Iceland– a study of crustal deformation 1984-1995 Arto V. Luttinen, Geochemical tracing of the Karoo mantle plume: Jurassic ferropicrites and Fe-rich olivine tholeiites from Dronning Maud Land, Antarctica
Elena A. Miranda, Barbara E. John, B. Ronald Frost, Structural development of an oceanic detachment fault system, Atlantis Bank, Southwest Indian Ridge W. Jason Morgan, Coulomb-Failure Modeling of Rift Grabens Susan E. Owen, R. Burgman, Mechanics of the 1975 Kalapana, Hawaii, earthquake Carolina Pagli and Freysteinn Sigmundsson, Subsidence at Askja volcano, North Iceland: InSAR Observations and Different Modeling Approaches Rikke Pedersen, Freysteinn Sigmundsson and Søren Bom Nielsen, Different styles of magmatic-tectonic interaction: Two recent examples from Iceland Virginie Pinel and Claude Jaupart, Magma transport beneath a volcanic edifice Michael P. Poland, Lu, Zhong, and Wicks Jr., Charles W, InSAR observations of surface deformation associated with the 2002 eruptions of Nyriagongo and Nyamulagira volcanoes, Democratic Republic of Congo, Africa Fred F. Pollitz, Transient rheology of the uppermost mantle beneath the Mojave Desert, California
2003 Iceland Summer School 3
Dominique Richard, Susan E. Owen, Freysteinn Sigmundsson, Dike models of tiltmeter data from the 1984 rifting event at Krafla, Iceland: Indication of a vertical component to the propagation direction Heidi Ritterbusch and Paul Martin Holm, Aspects of the volcanology and geochemistry of the weakly peralkaline rhyolitic Thorsmörk Ignimbrite in relation to the volcanism of the South Volcanic Flank Zone, South Iceland Ivan.P.Savov, C.Connor, M. D’Antonio, R.Djrbashian, and K.Kelley, Volcano- tectonic interactions in NW Armenia - results from petrology, geochemistry and quaternary volcano and fault distribution John J. Sánchez, and Stephen R. McNutt, Intermediate-Term Declines in Seismicity at Mt. Veniaminof and Mt. Wrangell Volcanoes, Alaska, Following the Mw 7.9 Denali Fault Earthquake Heidi Soosalu, and Páll Einarsson, Low-frequency earthquakes at the Torfajökull volcano, south Iceland Nicki F Stevens, Susan Ellis, Geoff Wadge and Charles A Williams, Mechanisms of localized flank deformation in the Valle Del Bove, Mount Etna, Sicily, from SAR interferometry and finite element modeling Erik Sturkell, Crustal deformation and magma dynamics of Icelandic volcanoes Elske van Dalfsen, and Hazel Rymer, Unrest at Askja Caldera; Evidence from gravity and ground-deformation. Thomas R. Walter and Falk Amelung, Volcano spreading earthquakes may adjust and cause Mauna Loa eruptions. Shimon Wdowinski, Large-scale tectonic-magmatic interaction in the central Andes Jennifer N. Weller, C.B. Connor, and A. Kharakhanian, Collision–related volcanism in Armenia: Example of the competing roles of volcanism and faulting in accommodation of tectonic stress Cindy Werner, and S. Brantley, CO2 Emissions from the Yellowstone Volcanic System
2003 Iceland Summer School 4
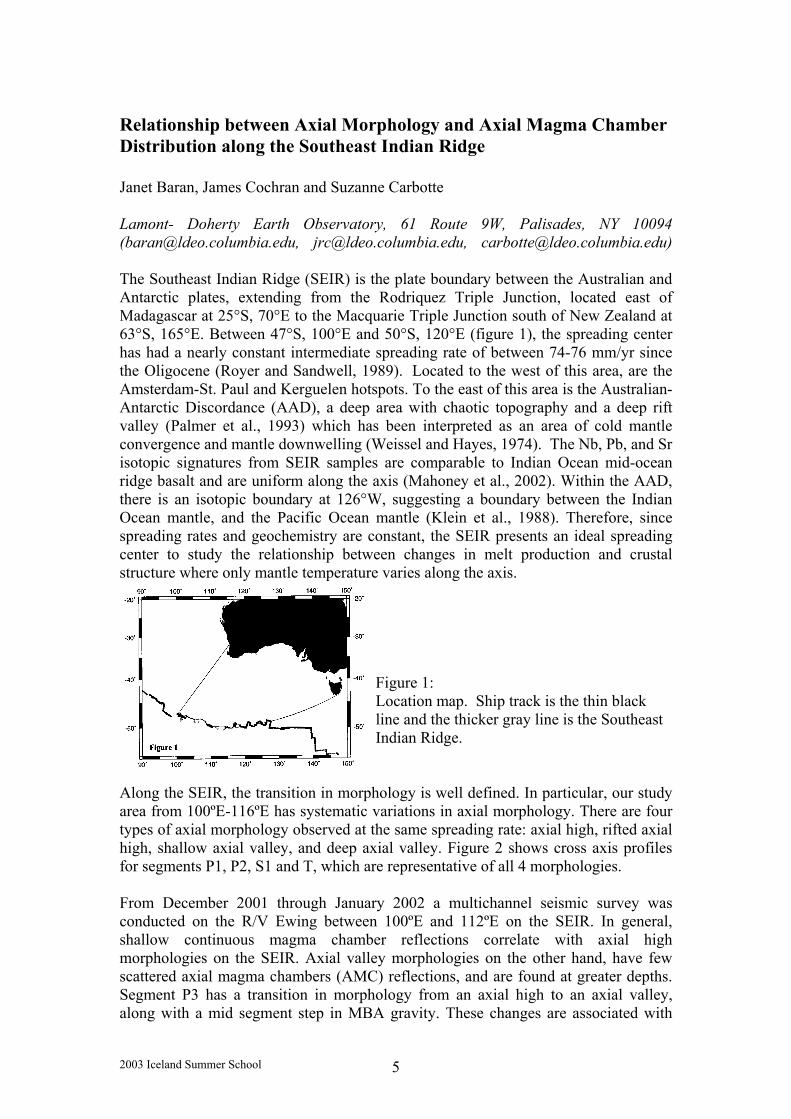
Relationship between Axial Morphology and Axial Magma Chamber Distribution along the Southeast Indian Ridge Janet Baran, James Cochran and Suzanne Carbotte Lamont- Doherty Earth Observatory, 61 Route 9W, Palisades, NY 10094 ([email protected], [email protected], [email protected]) The Southeast Indian Ridge (SEIR) is the plate boundary between the Australian and Antarctic plates, extending from the Rodriquez Triple Junction, located east of Madagascar at 25°S, 70°E to the Macquarie Triple Junction south of New Zealand at 63°S, 165°E. Between 47°S, 100°E and 50°S, 120°E (figure 1), the spreading center has had a nearly constant intermediate spreading rate of between 74-76 mm/yr since the Oligocene (Royer and Sandwell, 1989). Located to the west of this area, are the Amsterdam-St. Paul and Kerguelen hotspots. To the east of this area is the Australian-Antarctic Discordance (AAD), a deep area with chaotic topography and a deep rift valley (Palmer et al., 1993) which has been interpreted as an area of cold mantle convergence and mantle downwelling (Weissel and Hayes, 1974). The Nb, Pb, and Sr isotopic signatures from SEIR samples are comparable to Indian Ocean mid-ocean ridge basalt and are uniform along the axis (Mahoney et al., 2002). Within the AAD, there is an isotopic boundary at 126°W, suggesting a boundary between the Indian Ocean mantle, and the Pacific Ocean mantle (Klein et al., 1988). Therefore, since spreading rates and geochemistry are constant, the SEIR presents an ideal spreading center to study the relationship between changes in melt production and crustal structure where only mantle temperature varies along the axis.
Figure 1: Location map. Ship track is the thin black line and the thicker gray line is the Southeast Indian Ridge.
Along the SEIR, the transition in morphology is well defined. In particular, our study area from 100ºE-116ºE has systematic variations in axial morphology. There are four types of axial morphology observed at the same spreading rate: axial high, rifted axial high, shallow axial valley, and deep axial valley. Figure 2 shows cross axis profiles for segments P1, P2, S1 and T, which are representative of all 4 morphologies. From December 2001 through January 2002 a multichannel seismic survey was conducted on the R/V Ewing between 100ºE and 112ºE on the SEIR. In general, shallow continuous magma chamber reflections correlate with axial high morphologies on the SEIR. Axial valley morphologies on the other hand, have few scattered axial magma chambers (AMC) reflections, and are found at greater depths. Segment P3 has a transition in morphology from an axial high to an axial valley, along with a mid segment step in MBA gravity. These changes are associated with
2003 Iceland Summer School 5
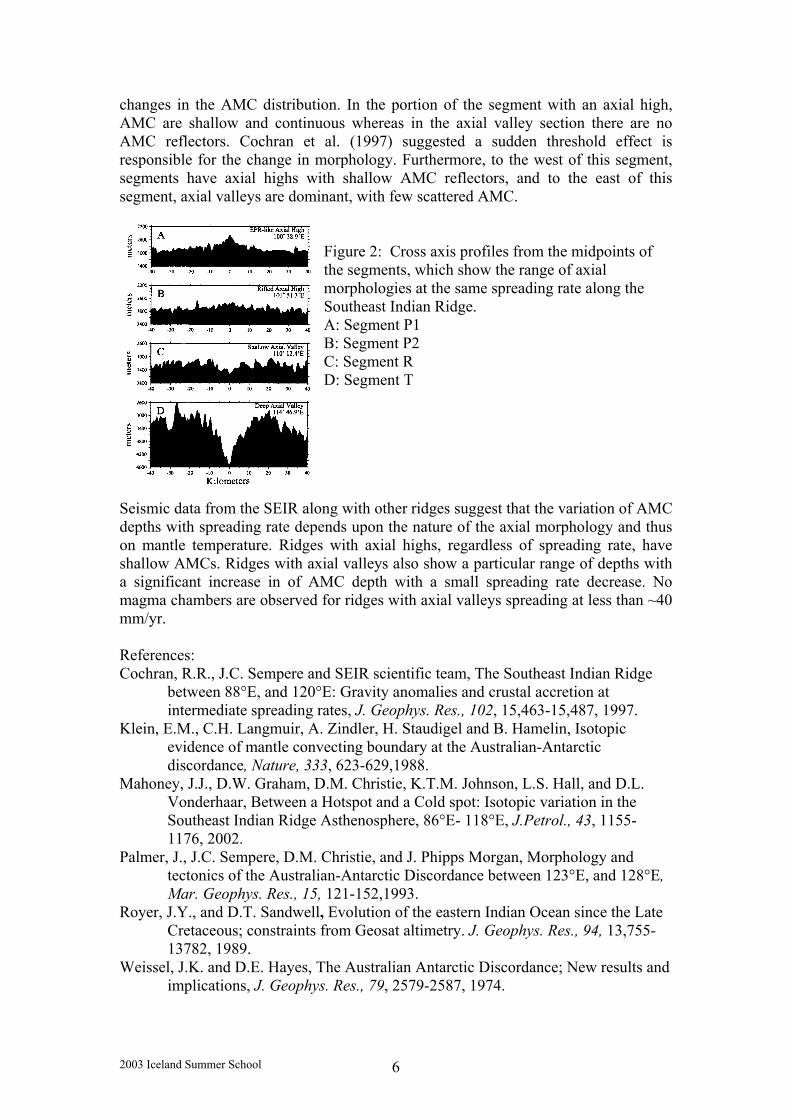
changes in the AMC distribution. In the portion of the segment with an axial high, AMC are shallow and continuous whereas in the axial valley section there are no AMC reflectors. Cochran et al. (1997) suggested a sudden threshold effect is responsible for the change in morphology. Furthermore, to the west of this segment, segments have axial highs with shallow AMC reflectors, and to the east of this segment, axial valleys are dominant, with few scattered AMC.
Figure 2: Cross axis profiles from the midpoints of the segments, which show the range of axial morphologies at the same spreading rate along the Southeast Indian Ridge. A: Segment P1 B: Segment P2 C: Segment R D: Segment T
Seismic data from the SEIR along with other ridges suggest that the variation of AMC depths with spreading rate depends upon the nature of the axial morphology and thus on mantle temperature. Ridges with axial highs, regardless of spreading rate, have shallow AMCs. Ridges with axial valleys also show a particular range of depths with a significant increase in of AMC depth with a small spreading rate decrease. No magma chambers are observed for ridges with axial valleys spreading at less than ~40 mm/yr. References: Cochran, R.R., J.C. Sempere and SEIR scientific team, The Southeast Indian Ridge
between 88°E, and 120°E: Gravity anomalies and crustal accretion at intermediate spreading rates, J. Geophys. Res., 102, 15,463-15,487, 1997.
Klein, E.M., C.H. Langmuir, A. Zindler, H. Staudigel and B. Hamelin, Isotopic evidence of mantle convecting boundary at the Australian-Antarctic discordance, Nature, 333, 623-629,1988.
Mahoney, J.J., D.W. Graham, D.M. Christie, K.T.M. Johnson, L.S. Hall, and D.L. Vonderhaar, Between a Hotspot and a Cold spot: Isotopic variation in the Southeast Indian Ridge Asthenosphere, 86°E- 118°E, J.Petrol., 43, 1155-1176, 2002.
Palmer, J., J.C. Sempere, D.M. Christie, and J. Phipps Morgan, Morphology and tectonics of the Australian-Antarctic Discordance between 123°E, and 128°E, Mar. Geophys. Res., 15, 121-152,1993.
Royer, J.Y., and D.T. Sandwell, Evolution of the eastern Indian Ocean since the Late Cretaceous; constraints from Geosat altimetry. J. Geophys. Res., 94, 13,755-13782, 1989.
Weissel, J.K. and D.E. Hayes, The Australian Antarctic Discordance; New results and implications, J. Geophys. Res., 79, 2579-2587, 1974.
2003 Iceland Summer School 6

Lattice-Granular Numerical Modelling of Seismic Waves Induced by Pressure Changes in a Fluid-Filled Conduit Chris J. Bean, Gareth S. O Brien and Ivan Lokmer Seismology and Computational Rock Physics Group, Dept. of Geology, University College Dublin, Belfield, Dublin 4, IRELAND ([email protected]) It is now well established that fluid-rock interactions can play an important role in producing seismic signals in volcanic regions. However the development of realistic fluid-rock models is hampered by the need to include multi-phase fluids, heterogeneous rock properties and complex geometrical fluid conduits. Here we introduce a coupled lattice-granular scheme for modelling fluid-rock mechanical interactions. The method allows us to model wave propagation through an irregular fluid-filled conduit in heterogeneous media. Waves can be initiated by either pressure changes in the fluid or elastic deformation of the host rock. In the heterogeneous host rock, we use a particle-based scheme for modelling wave propagation. This scheme is accurate when compared to finite-difference solutions to the wave equation, with the added advantage that the model can be placed in an ambient stress field and can readily handle boundary conditions at fracture interfaces. The viscous fluid is modelled using the lattice Boltzmann method for fluid flow. This scheme can model acoustic wave propagation in an arbitrary porous medium. The schemes are coupled at the fluid-rock boundaries through an exchange of momentum and matching of the velocity of the fluid and rock at the interfaces. Both these schemes are discrete and are not based on continuum mechanics hence they allow for the introduction of a high degree of heterogeneity. We present initial results of 2D wave propagation as a consequence of pressure changes in a viscous fluid and fluid displacement in a conduit. Earthquake relocation beneath the Lassen Peak region in Northeastern California using cross-correlation and the double-difference method. Tanya M. Blacic1 and J. S. McClain 1 Geology Department, University of California at Davis, 1 Shields Avenue, Davis, CA 95616 ( [email protected]) Only two Cascade volcanoes have erupted in the last 100 years: Mount St. Helens and Lassen Peak. Numerous studies have been carried out at Mount St. Helens since its eruption in 1980 with the aim of defining the magmatic plumbing system below the volcano. Comparatively few such studies have been undertaken at Lassen Peak. Because of the recent volcanic activity and the presence of numerous active hydrothermal features, the Lassen region provides an intriguing setting for the investigation of a number of questions relating to magma storage and transport: (1) Is there magma in the crust beneath Lassen Peak? (2) What is the geographic
2003 Iceland Summer School 7
distribution, depth, and size of the magma storage region? (3) How does the location of earthquakes relate to the location of magma? (4) Are earthquake clusters near Lassen Peak related to magma processes/movement or tectonism? The first step in an attempt to answer these questions has been to obtain improved hypocentral locations. We have undertaken a combined waveform cross-correlation and earthquake hypocenter relocation study using the recently released hypoDD computer code developed by Waldhauser and Ellsworth (2000). The double-difference technique used in hypoDD has been shown to minimize error due to un-modeled velocity structure without the use of station corrections (Waldhauser and Ellsworth, 2000). This method can incorporate P- and S-wave differential travel times derived from catalog travel-time picks and/or from cross-correlated arrival waveforms. Our data set consists of 3,233 earthquakes with magnitude greater than 1.0 occurring from January 1, 1980, to January 1, 2003, in the Lassen region (defined as the area from 121° to 122°W longitude and 40° to 41°N latitude). Initial results of hypoDD event relocation using only the catalog travel-times show focusing of what was previously a diffuse event cloud at Lassen Peak into three primary clusters. Interestingly, none of these clusters are centered directly below Lassen Peak. Two clusters are located ~2 and ~4 km southwest of Lassen Peak. The average depth of the events in these two clusters is ~6 km. The third cluster is ~2 km southeast of Lassen Peak. This cluster is not as well defined as the western clusters and the events were located at slightly shallower depths (~5 km). Our initial results also show some alignment of earthquakes along previously un-mapped lineaments while many mapped faults do not show any recent activity. We expect even greater definition in the location of events in the Lassen Peak region after completing cross-correlation and relocation of the combined data set. These results contribute to the long-term goal of this project: to combine an examination of new earthquake hypocenter locations, including long-period events, with an interpretation of a local earthquake seismic tomography study to construct a conceptual model of the magma storage system beneath the Lassen volcanic center. Reference: Waldhauser, F. and Ellsworth, W. L. “A Double-Difference Earthquake Location Algorithm: Method and Application to the Northern Hayward Fault, California,” Bulletin of the Seismological Society of America, Vol. 90, no. 6, pp. 1353-1368, December, 2000. The “prediction in hindsight” of an M 5.8 earthquake at Húsavík on September 16th, 2002 Lillemor Claesson Department of Geology and Geochemistry, Stockholm University, S-106 91 Stockholm, Sweden ([email protected])
Earthquake prediction studies usually focus on changes in physical parameters along active fault zones. More recently, various geochemical methods have been evaluated as possible earthquake precursors. Hydrogeochemical precursors of earthquakes include fluid migration caused by seismotectonic activities. Seismic monitoring has revealed that with increasing stress build up in a rock volume
2003 Iceland Summer School 8
preceding an earthquake, pore shape-change, alignment and connectivity enhances fluid-rock interaction (1-2). Accordingly, the geochemistry of water circulating through the crust in seismically active areas should respond to stress increase already prior to earthquake activity within the affected rock volume. The number of studies reporting chemical changes in hot spring waters and wells, occurring a few days to several months before a seismic event (3-5) supports the view that ground water respond sensitively to crustal strain already prior to earthquake activity. Consequently, hydrogeochemical variances caused by seismotectonic activities should be detectable in waters at susceptible locations, and therefore serve as earthquake precursors.
To test this hypothesis a hydrogeochemcial monitoring program was initiated in the north of Iceland in the Tjörnes Fracture Zone (TFZ), which forms a broad fault zone on the Mid-Atlantic Ridge and represents one of the most seismically active areas on Iceland. One water sample is collected on a weekly basis from the 1500 m deep geothermal well HU-01, situated within the Húsavík geothermal field immediately next to the Húsavík-Flatey Fault, and analysed for major and trace elements and stable isotopes.
On September 16th 2002 at 18.48 (GMT) an M 5.8 earthquake occurred close to the Grímsey Lineament at latitude 66.95575°N and longitude 18.44668°W about 70 km north of borehole HU-01. This earthquake was followed by a swarm of M 2-3 aftershocks. The analysed water samples from HU-01 display changes in several major and trace elements after but also before the onset of earthquake activity. The analysed geochemical tracers can be assigned to one of three groups according to their response to the earthquake. The first group of tracers (As, Cd, Cr, Ge, Mg, Ni, P, Pb, Ti, W, Y and Zn) show no detectable response either before or after the earthquake. The second group of tracers (δ34S, F, Cl, NO3, Br, SO4, Bo, Ba, Ca, Ga, Hf, K, Li, Na, Rb, S, Si and Sr) show detectable changes immediately after the earthquake, but no change before the earthquake. The third group of tracers (δ18O, δD, Cu, Zn and Fe) show detectable changes before the earthquake and are therefore potential precursors.
The Cu concentration in the fluid displays a 6-fold increase over a 4-week period before the earthquake. The concentration of Zn in the fluid shows an 8-fold increase and an abrupt decrease back to average levels during the same period. The concentration of Fe in fluid exhibit a 3-fold increase and a decrease back to average over a 4-week period before the earthquake. δ18O displays a slight positive shift, coupled with an almost negligible shift in δD during the 3-week period before the earthquake, and significant negative shifts directly after the earthquake. Since element concentration variations do not show any correlation with rainfall data, the observed changes must be related to the earthquake activity along the Grímsey Lineament (Claesson et al., in prep.). The increase in Cu, Zn and Fe concentrations prior to the earthquake is expected since the concentrations of these elements have been shown experimentally to increase due to interaction between basalt and hydrothermal fluids (6). The slight increase in δ18O prior to the earthquake could be explained by accelerated interaction between the fluid and basalt at higher temperatures (δ18O ≈ +6 ‰) (7). The decrease in δ18O immediately after the earthquake may record tapping of a deeper reservoir with older water and therefore more negative δ18O. The even more negative δD values after the earthquake records a rapid influx of either older or purer ice age meteoric water. The relatively high concentrations of cationic and anionic species in the fluid at Húsavík reflect fluid/rock exchange during the (>10, 000 years) residence time of the fluid in the basaltic host rock. The increase in some cationic and anionic species after the earthquake can be explained by influx of older or purer ice
2003 Iceland Summer School 9

age meteoric water, because either the residence time was longer or the fluid is less diluted by younger meteoric waters. The relative shifts of δ18O and δD are consistent with the replacement (or partial replacement) of one meteoric reservoir with another.
The geochemical results from site HU-01 in the TFZ are the outcome from a small scale weekly monitoring program. Nevertheless, the observed geochemical changes at HU-01 are detectable and possibly explained by the mixing and/or switching of fluid source reservoirs, and because they occur several weeks before the earthquake they indicate that hydrogeochemical changes in fluids in active fault zones might serve as valuable earthquake prediction tools. References: 1. S.V. Zatsepin, S. Crampin, 1997. Modelling the compliance of crustal rock: I – response of shear-wave splitting to differential stress. Geophys. J. Int. 129, 477-494. 2. S. Crampin, 1998. Stress-forecasting: a viable alternative to earthquake prediction in a dynamic Earth. Trans. R Soc Edinburgh. Earth Sci. 89, 121-133. 3. S, Nishizawa, G, Igarashi, Y, Sano, E, Shoto, S, Tasaka, Y, Sasaki, 1998. Radon, Cl-, and SO4
2- anomalies in hot spring waters associated with the 1995 earthquake swarm off the east coast of the Izu Peninsula, central Japan. Appl Geochem. 13, 89-94. 4. R. Favara, F. Grassa, S. Inguagiatto, M. Valenza, 2001. Hydrogeochemistry and stable isotopes of thermal springs: earthquake-related chemical changes along Belice Fault (Western Sicily). Appl. Geochem. 16, 1-17. 5. P. Theodorsson, P. Einarsson, GI. Gudjonsson, 2002. Radon monitoring in the South Iceland seismic zone and anomalies prior to the earthquake sequence in June 2000. The 25th Nordic Geological Winter Meeting, Abstract Volume 213. 6. J.S. Seewald, W.E. Seyfried, 1990. The effect of temperature on metal mobility in subseafloor hydrothermal systems: constraints from basalt alteration experiments. Earth Planet. Sci. Lett. 101, 388-403. 7. H.P. Taylor, 1968. The oxygen isotope geochemistry of igneous rocks. Contrib. Mineral. Petrol. 19, 1-71. 8. L. Claesson, A. Skelton, C. Graham, M. Mörth, C. Dietl. Geochemical monitoring of fluid flow in active fault zones – a new method of earthquake prediction. (In prep) Solicited to Science.
2003 Iceland Summer School 10

Oxidized mantle under Mount Pinatubo, Philippines: implications for sulfur transport and degassing
J.C.M. de Hoog1,2, K.H. Hattori2
1 Dept. of Earth Sciences, Gothenburg University, Gothenburg, Sweden. 2 Dept. of Earth Sciences, University of Ottawa, Ontario, Canada
The cataclysmic eruption of Mount Pinatubo on June 15th, 1991, was one of the largest of the 20th century and emitted the largest sulfur cloud observed so far. It was preceded by the discharge of andesitic scoria and extrusion of dome-forming andesite. These andesitic rocks are a product of magma mixing during the injection of basaltic magma into the shallow felsic magma reservoir, which probably triggered the eruption [1]. The hybrid eruption products contain mafic fragments (~51 wt% SiO2) consisting of olivine-amphibole basalt with phenocrysts of hornblende, clinopyroxene, plagioclase, olivine, Fe-Ti oxides, and groundmass glass. Olivine is Ca-bearing (0.17 wt% CaO) and Mg-rich (Fo86-88), and contains inclusions of Cr-spinel that are rich in Fe3+ and Ti. It is overgrown and partially replaced by amphibole. Amphibole also occurs as small phenocrysts, which contain abundant melt inclusions. The melt inclusions show linear compositional arrays with two end members; rhyolitic melt (~ 75 wt% SiO2) and andesitic melt (~ 62 wt%SiO2)(Fig.1). These are interpreted to be mixing lines of two different melt because they are distinctly different from the trends expected from fractional crystallization; the melt inclusions were trapped in amphibole during the mixing of basaltic and dacitic magmas. The melt in the basaltic magma was andesitic in composition, suggesting that the basaltic magma had already 30-40 vol% crystals at the time of magma mixing.
Fig.1. Al2O3-SiO2 variation diagram showing the compositions of whole rock and melt inclusions in amphibole.
The least evolved melt inclusions contain high S (>1700 ppm) with ~85% of S as
SO42- (Fig.2). This corresponds to the oxidation condition of NNO+1.3 (±0.5) of the
melt. High oxidation condition of the primitive mafic magma is further confirmed by the compositions of olivine and chromite enclosed in olivine cores. Spinel-olivine oxybarometry suggests that the mafic magma was intrinsically oxidized (NNO+1.45)(Fig.3). The oxidation condition of the mafic magma is comparable to that of the dacitic magma (NNO+1.6, [2]). The mixing between felsic and mafic magmas was not accompanied by a significant change in the oxidation state of the magma. Instead, the oxidized state of the dacitic magma likely reflects that of the primitive mafic magma and the source region of the sub-arc mantle. As a corollary, models that relate the excess sulfur discharge during the eruption to changes in
2003 Iceland Summer School 11

oxidation and sulfur solubility during magma mixing (e.g., [3]) are not applicable to Pinatubo. Oxidized mafic melt can effectively scavenge sulfide S in the source mantle as the solubility of S is high in oxidized melt. Furthermore, oxidized mafic magmas lose little S as immiscible sulfide S at deep crustal levels. Instead, oxidized magmas discharge S as SO2 during their ascent. Thus, oxidized mafic melt is an efficient medium for the transfer of S from the mantle to shallow crustal levels and the atmosphere. At Pinatubo, the SO2 discharged from mafic magma was incorporated into the felsic magma and immiscible aqueous fluids in the overlying felsic magma chamber. This S
dissolved in the aqueous fluids was likely the source of S that was discharged to the atmosphere during the cataclysmic eruption [4]. The findings from Mount Pinatubo suggest that the sub-arc mantle is locally oxidized and that oxidized felsic magmas in arcs likely reflect oxidized state of the primitive magmas and the sub-arc mantle. Higher than average sulfur fluxes can be expected in these areas.
Fig. 2. Variation of S with SiO2 in bulk rock and melt inclusions. High S contents in dacite
and andesite are related to the presence of primary anhydrite. Note the high sulfur
contents of the least-evolved melt inclusions.
References: [1] Pallister JS, Hoblitt RP, Reyes AG (1992) A basalt trigger for the 1991 eruptions of Pinatubo volcano? Nature 356, 426-428; [2] Scaillet B, Evans BW (1999) The 15 June 1991 eruption of Mount Pinatubo. I. Phase equilibria and pre-eruption P–T– ƒO2–ƒH2O conditions of the dacite magma. J Petrol 40, 381-411; [3] Kress V (1997) Magma mixing as a source for Pinatubo sulfur. Nature 389, 591-593; [4]Wallace PJ, Gerlach TM (1994) Magmatic vapor source for sulfur dioxide released during volcanic eruptions: evidence from Mount Pinatubo. Science
Fig.3. Temperatures and oxidation states of dacite, basalt and hybrid andesite of the Pinatubo 1991 eruption. Basalt values are based on olivine-chromite equilibriua (symbols), the low T estimates being the result of re-equilibration after mixing. Values of primitive magmas in other arcs are included for comparison.
2003 Iceland Summer School 12

Transient ground motion associated with the January 30, 1997 dike intrusion at Kilauea Volcano, Hawaii Emily K. Desmarais and Paul Segall Department of Geophysics, Stanford, CA 94305 ([email protected]) There is a visible transient in GPS timeseries following the onset of tremor and subsequent January 1997 dike intrusion in the East Rift Zone on Kilauea Volcano, Hawaii. We invert continuous and campaign GPS data using an extended Kalman filter for a Mogi source under Kilauea, opening of a dike in the East Rift Zone and slip on a decollment under the south flank. The extended Kalman filter allows us to estimate transient slip and rate at each epoch to gain a greater understanding of the time dependence of deformation before, during and after the eruption. This study will model post eruptive deformation as the crust accommodates the opening of the dike. Did the February-March 2000 Hekla Eruption Trigger the June 2000 South Iceland Seismic Zone Earthquakes? Tim H. Dixon (1), P. La Femina (1), J. E. Dixon (1), R. Malservisi (1), G. Ofeagbu (2) (1) University of Miami ([email protected]), (2) Southwest Research Institute The February 26-March 8 2000 eruption at Hekla volcano was followed ~3 months later by significant seismicity in the South Iceland Seismic Zone (SISZ), with two Ms 6.6 events on June 17 and June 21, 2000 occuring about 35 km to the west. Here we investigate the possibility that the 2000 Hekla eruption may have triggered the first SISZ earthquake. In this kind of triggering model, it is assumed that the earthquake would have occurred anyway, but the sequence of events at Hekla influenced the timing. Hekla last erupted in 1991, and is believed to have undergone fairly rapid re-inflation in the early and mid-1990’s. The extra pressure associated with this inflation increased the resolved normal stress on north-south striking bookshelf faults of the nearby SISZ, delaying onset of seismicity. The subsequent rapid deflation associated with the 2000 eruption decreased the resolved normal stress, triggering the earthquake.
To demonstrate that such a model is possible, we must first show that the magnitude of stress change is significant. Second, we must demonstrate that the timing of events is consistent with known physical conditions. Calculations of static coulomb stress changes in an elastic half space suggest that, for plausible pressure changes at the Hekla magma chamber during eruption, stress changes on the fault could be large enough to trigger the event. However, the more than 3 months time lag is too long to be explained by standard stress propagation in elastic media (triggered events would be expected to follow the main event within a few hours). Poroelastic
2003 Iceland Summer School 13
effects could delay onset of triggered slip, but likely by no more than a few weeks. We investigated the possible role of viscoelasticity in modulating the timing of stress changes associated with the Hekla eruption, using a simple two-dimensional finite element model. For an 8 km deep magma chamber, effects associated with rheological layering (viscoelastic lower crust/upper mantle) do not appear to play a critical role, at least for the short time scales considered here. However, the presence of a viscoelastic shell around the magma chamber (representing a thermal boundary zone) may be significant: for a 1 km thick shell, 0.5 bar stress change at the fault occurs 3 months after the eruption if shell viscosity is 5x10¹⁵ - 1x10¹⁶ Pa s. This is considerably lower than gabbroic material near its solidus temperature (~1x10¹⁸ Pa s), but is plausible if a “mush” zone of crystals plus liquid is present in the boundary zone of the magma chamber. A Real-time GPS Magma Detection System Elliot Endo U.S. Geological Survey, 1300 SE Cardinal Ct, Bldg 10, Suite 100, Vancouver, WA 98683 ([email protected]) In 1998 the U.S. Geological Survey’s Volcano Hazards Program began a project to install 14 continuous GPS stations in the Long Valley caldera and Mono-Inyo Craters areas of California, U.S.A. The installation phase of the project was completed in 2001. A subset of the network is used for real-time GPS processing once every 5 seconds. An initial attempt to use internal GPS receiver real-time processing on one baseline was not satisfactory because of inconsistent results and limitations of the internal microprocessor. Next, we evaluated a commercially available PC program that produces real-time results using a processing technique called triple-differencing with Kalman filtering. The program is a big improvement over internal GPS receiver processing and has a flexible graphical user interface. One of the program’s outputs is a relative displacement vector. The initial configuration of the GPS network did not allow the use of a reference station outside the boundary of the caldera, so displacement vectors did not reflect the absolute displacements. In late 2000 we experimented processing baselines for intra-caldera GPS stations relative to a station outside the caldera with good results. The present real-time GPS network configuration includes 4 stations in the caldera and the reference station outside the caldera. We expect the real-time GPS network to detect any future migration of magma in the active part of the caldera. It is hoped that displacement vectors will define the center of inflation and the depth of magma in the shallow crust.
2003 Iceland Summer School 14

Dilational Normal Faults in Iceland: Analogs for Normal Faults on Mars and Mechanism for Pit Chain Development David A. Ferrill1, Alan P. Morris2, Darrell W. Sims1, Danielle Y. Wyrick1, Deborah J. Waiting1, and Nathan M. Franklin1
1 CNWRA, Southwest Research Institute®, 6220 Culebra Road, San Antonio, TX 78238, USA ([email protected]) 2 Department of Earth and Environmental Science, University of Texas at San Antonio, San Antonio, TX 78249, USA Remotely sensed data provide detailed images of surface fault patterns on Mars, and illustrate features, such as pit chains, that are commonly associated with extensional fault systems on Mars. However, details such as fault dip can only be determined in rare cases on Mars. In this study, we use normal faulting in Iceland as analogs to provide insights into faulting on Mars and the related processes of fault dilation and pit chain development. Faults initiate along orientations that are controlled by the magnitudes and orientations of the effective principal stresses and mechanical properties of the faulted rocks, at the time of failure. Failure angle is defined as the angle between the failure plane and the maximum principal compressive stress at the time of failure. In extensional tectonic settings, failure at low differential effective stress (which is typical at shallow depths) and with tensile minimum principal effective stress, may be in the tensile mode. Tensile failure produces fractures with failure angles of 0Ε that experience wall-normal extensional displacement. Failure at high differential stress, or where minimum principal effective stress is compressive, is typically in the shear mode, producing fractures that are oblique to the maximum principal stress, with wall-parallel shear displacement. The transition zone between tensile and shear failure mode, where the normal stress on the failure surface is tensile and the shear stress is non-zero, is termed hybrid mode. Hybrid mode faults have low failure angles (> 0) and wall-oblique displacement. Rocks that are resistant to deformation are termed competent and generally have lower failure angles than less competent rocks. In horizontally stratified rock sequences that include layers with different competencies, the combination of failure mode switching and variable failure angles resulting from competence contrasts commonly leads to refracted fault geometries. In the case of normal faults developed in such circumstances, fault slip parallel to the less steep fault segments causes dilation along steeper fault segments, which in turn can produce cavities. In Iceland, faults in basalt exposed at the surface are typically nearly vertical and are dilational, producing fissures at the surface, tectonic caverns, and linear depressions into which lava can fall forming pseudo-dikes. Heave and throw relationships indicate that fault dips become less steep at depth, thus these faults are refracted. Where such faults are covered by unconsolidated alluvium or colluvium, collapse of this unconsolidated material into the dilational fault segments may have produced chains of surficial pits. Faults with similar dilational geometry in limestones act as channels for vadose and phreatic groundwater flow, and as sites of mineralization. Similarly,
2003 Iceland Summer School 15
dilational faults in Iceland are likely groundwater flow pathways and loci for dike intrusion. Map patterns of extensional fault systems on Mars bear a striking resemblance to extensional fault systems on Earth. Icelandic faults are especially analogous to those of many areas of Mars because the volcanic stratigraphy is likely similar to the near surface stratigraphy of much of Mars. Pit crater chains are a common and enigmatic surface feature of Mars, and similar features have been recorded in Iceland associated with extensional fault systems. Pit crater chains on Mars and other planets have become virtually synonymous with, and are commonly regarded as direct evidence for, underlying dikes. However, explanations of pit crater chains require the creation of near surface void space, which is not necessarily expected associated with dike intrusion. We have demonstrated, using physical analog modeling techniques, the development of pit crater chains above developing fissures associated with dilational normal faulting. Dilational normal faults produce near surface void space, which can explain the development of pit chains associated with extensional faults in Iceland and Mars. Seismotectonics of Mid-Ocean Ridge Propagation in Hess Deep Jacqueline S. Floyd, Maya Tolstoy, John Mutter, and Chris Scholz Lamont-Doherty Earth Observatory, Columbia University, Palisades, NY ([email protected])
Hydroacoustic data from the eastern equatorial Pacific reveal low-magnitude seismicity concentrated at the propagating tip of the Galapagos Rise in Hess Deep. The patterns of seismicity and faulting are similar to those observed in the process zone of laboratory-scale propagating tensile cracks. Because the fracture energy, required for propagation, scales with crack length and process zone size, it follows that ridges can propagate stably in the brittle crust without exceptional resisting forces as proposed by previous models based on linear elastic fracture mechanics. The results suggest that three-dimensional models that incorporate inelastic deformation are needed to more realistically model deformation processes at the propagating ridge tip.
2003 Iceland Summer School 16
Subglacial Rhyolites from Kerlingarfjoll, Iceland: Geochemical Evolution and Preliminary Eruption Ages Stephanie Fludea, Dave McGarvieb, Ray Burgessa a Department of Earth Sciences, University of Manchester, UK ([email protected]) b The Open University, Boar Lane, Leeds, UK Kerlingarfjoll is an Icelandic central volcanic complex which is dominated by subglacial basaltic and rhyolitic eruptives. A Holocene basalt eruption on its northern margins indicates that it is still considered active. Although subglacial rhyolites are found throughout the complex, they are concentrated into two clusters, a western and an eastern, which suggests a focussing of magmatic and eruptive activity. Recent research on the geochemical evolution of the western cluster has provided two new findings: (1) that each eruptive unit possesses a unique geochemical fingerprint; and (2) that two distinct magmatic lineages are present. From this has developed a follow-up research project to determine eruption ages (Ar-Ar), the aim of which is to investigate the link between geochemical trends and rate-dependent factors (eg. magma productivity, eruption frequency). This presentation will provide a synthesis of the geochemical trends that have been recognised in these subglacial rhyolites, and will present preliminary Ar-Ar dates. Plans for further work will be outlined, the most crucial of which will involve providing better age determinations, as these will provide the foundation for the first detailed study to be made of rhyolitic magma evolution through time at an Icelandic rift zone central volcanic complex. Continuous GPS observations in Iceland Halldór Geirsson (1), Þóra Árnadóttir (2), Erik Sturkell (1), Freysteinn Sigmundsson (2), Páll Einarsson (3), and Thierry Villemin (4) (1) Icelandic Meteorological Office, Bústaðarvegur 9, 150 Reykjavík, Iceland ([email protected]) (2) Nordic Volcanological Institute, Grensásvegur 50, 108 Reykjavík, Iceland (3) Science Institute, University of Iceland, Hofsvallagata 53, 107 Reykjavík, Iceland (4) LGCA, Univ. de Savoie, Campus scientifique, 73376 Le Bourget du Lac Cedex, France The Icelandic Meteorological Office operates a network called ISGPS of continuous GPS stations to monitor crustal movements in active tectonic and volcanic areas in Iceland. The network was initiated as a collaborative project in 1999, and presently there are 17 continuous GPS stations in Iceland, of which 14 belong to the ISGPS network, two are IGS stations and one is operated by the National Land Survey of Iceland The design of the ISGPS network is aimed towards simplicity, robustness and
2003 Iceland Summer School 17

cost-efficiency. The number of electric components in the field is minimized and we use a stainless steel quadripod monument design to achieve high monument stability. Data from the ISGPS stations are automatically downloaded and processed on a daily basis. We use the Bernese V4.2 software to process the data. The data are initially processed using predicted satellite orbits, and then reprocessed with CODE final orbits. The time series from most ISGPS stations are dominated by motion caused by plate spreading, in general agreement with the NUVEL-1A plate motion model. Discrepancies are observed at stations which are within the plate boundary deformation zone or close to volcanic deformation sources. Time series from stations located near Katla volcano indicate there is a slow pressure increase beneath the volcano. Transient signals attributed to an eruption in Hekla in February 2000, are observed. The nearest station, located 50 km from Hekla, recorded 7 mm horizontal motion towards Hekla during the eruption. 4 months later, two magnitude Mw = 6.5 and Mw = 6.4 earthquakes spaced 17 km apart occurred in the South Iceland Seismic Zone. Although most of the ISGPS stations were not located close to the epicenters, a clear deformation signal was detected at all operational stations. The coseismic displacements for the latter earthquake fit well to a source model based on network GPS measurements. The observed displacements for the former event include deformation from triggered events on Reykjanes Peninsula. Relative locations of earthquakes in SW-Iceland
Sigurlaug Hjaltadóttir (1), Kristín Vogfjörð (1), and Ragnar Slunga (2) (1) Icelandic Meteorological Office ([email protected]), (2) University of Uppsala, Sweden Approximately eight thousand routinely analyzed microearthquakes in SW-Iceland from the year 2000, which were induced by the two Mw=6.5 earthquakes in the SISZ, will be relocated with relative location methods. This procedure can improve location accuracy significantly, to the order of tens of meters. Several subsurface faults in southwest Iceland were illuminated by the increased microearthquake activity folowing the two large events. These faults will be mapped with the relatively located events. The depth distribution of the activity will be interpreted with respect to the tectonics in the area, i.e. the intersection of the South Icelandic Seismic Zone, the Western Volcanic Zone and the Reykjanes Peninsula. Special attention will also be paid to the geothermal areas within the sector in order to examine their effect on the depth distribution of the events.
2003 Iceland Summer School 18

Textural variations in a large contact metamorphosed metabasaltic inclusion in the Fongen-Hyllingen Intrusion, Norway -a result of mountain-building in the Scandinavian Caledonides Dorthe Hegnet Holm and J. Richard Wilson Department of Earth Sciences, University of Aarhus, C. F. Møllers Allé 110, DK-8000 Århus C, Denmark ([email protected]) The 160 km2 Fongen-Hyllingen Intrusion (FHI) is situated 60 km south of Trondheim. It was emplaced about 426 Ma during mountain-building in the Scandinavian Caledonides. Emplacement took place at a depth of 10-14 km, close to the lithological contact between metabasalts and metapelites. The intrusion consists dominantly of modally layered gabbroic and dioritic cumulates. Raft-like country rock inclusions (dominantly of metabasaltic hornfels) are abundant, especially in the lower part of the Layered Series. Deformation during late stages of the Caledonian Orogeny resulted in exposure of the entire Layered Series. Abundant primary igneous features are preserved despite subsequent deformation and regional metamorphism.
A detailed study of textural variations in a very large (> 500 m thick), metabasaltic hornfels inclusion has been carried out. The inclusion is located near the top of Fongen Mountain. Its lower contact is concordant with modal layering in the Fongen-Hyllingen cumulates. The inclusion is dominated by granular metabasaltic hornfels, but shows a wide variety of textural features including coarse grained, ultramafic and leucogabbroic wispy lenses. Some outcrops have a streaky appearance with lenses of fine-grained granoblastic metabasalts in a gabbroic matrix. A 10 m-thick interval in the middle of the inclusion consists of well-layered mafic and felsic gabbroic intervals alternating with more massive, finer grained granular metabasalts. The upper part of the inclusion contains globular patches of granoblastic metabasalts in a gabbroic matrix. Layering is concordant with the base of the inclusion and modal layering in the Fongen-Hyllingen cumulates. The observed features are ascribed to processes related to contact metamorphism. The extensive partial melting required to explain the genesis of some textures is surprising considering that the metabasaltic inclusion has about the same bulk composition as the host magma. The role of a volatile phase must have been important to lower the solidus temperature of the metabasalts. The locally well-developed layering in the inclusion required either extensive partial melting with subsequent organisation into layers or extensive solid-state diffusion.
2003 Iceland Summer School 19
Petrology and geochemistry of the Esjufjöll central volcano, SE Iceland Fredrik Holm1,2, R.G. Trønnes1, K. Grönvold1, H. Karlsson3, H. Torfason4 1Nordic Volcanological Institute, University of Iceland, Grensásvegur 50, IS-108 Reykjavik, Iceland ([email protected]) 2Department of geology and geochemistry, University of Stockholm, Sweden
3Department of Geosciences, Texas Tech University, Lubbock, Texas, USA 2Icelandic Institute of Natural History, Reykjavik, Iceland
Esjufjöll is a young (< 0,78 Ma) flank zone volcano, resting unconformably on Tertiary tholeiitic basement 40-50 km east of the nearest Icelandic rift zone. Most of the volcano, including a large caldera (~ 40 km2), is covered by the Vatnajökull ice sheet. Only parts of the south-eastern flank of the volcano are exposed in the form of four NW-SE trending ridges (Vesturbjörg, Skálabjörg, Esjubjörg and Austurbjörg). A possible eruption in 1927 constitutes the only description of historical activity, although a swarm of small tremors, that could indicate magma movements, were registered in October 2002.
The Icelandic flank zone volcanism is characterized by mildly alkaline and transitional tholeiitic products, in contrast to the tholeiitic rift zone volcanism. The alkaline lavas represent either incipient or waning volcanism in off-rift or propagating rift environments, whereas the main crustal accretion occurs by tholeiitic volcanism within the rift zones.
Esjufjöll is located in the Eastern Volcanic Flank Zone (EVFZ), between the Öræfajökull and Snæfell central volcanoes, located 30 km SSW and 75 km NE of Esjufjöll, respectively. All of the EVFZ volcanoes have erupted mildly alkaline to transitional lavas and pyroclastics, enriched in incompatible trace elements. With its location to the east of the currently active Eastern and Northern Rift Zones, the EVFZ seems to represent an incipient rift zone. Hence, Esjufjöll could be the initial phase in the formation of a rift zone that may eventually replace the currently active Eastern Rift Zone. A westward drift of the NE Atlantic plate boundary of 10-30 km/Ma relative to the surface expression of the Iceland plume causes periodic (5-8 Ma intervals) relocation of the Icelandic rift segments eastwards to new positions near the plume axis, which is currently under the NW part of Vatnajökull.
The exposed part of Esjufjöll is dominated by evolved, and mostly aphyric, basaltic rocks with 4-5 wt% MgO. Minor amounts of rhyolite occur near the northwestern margin of the exposed complex. The Esjufjöll basalts are mildly alkaline, with Na2O - 2 ≥ K2O, and highly enriched in the light rare earth elements and other large-ion lithophile elements. Additional HIMU-tendencies are demonstrated by positive ∆Nb-values [= 1.74 + log(Nb/Y) – 1.92 log(Zr/Y)] combined with elevated Nb, Ta, Hf, Ti and Zr and high U/Th ratios. The near-aphyric Esjufjöll basalts are further characterized by positive Eu- and Sr-abundance anomalies in chondrite-normalized REE-diagrams. The positive Sr-anomalies are also found in most other Icelandic basalts, including the most primitive picrites, indicating either the presence of recycled gabbroic cumulates from subducted oceanic lithosphere in the mantle source, or partial assimilation of widespread plagioclase-rich cumulates in the lower crust. The LILE- and HFSE-enriched character of the evolved basalts
2003 Iceland Summer School 20

demonstrates that even the primary melts were formed by relatively low-degree melting of sources with high proportions the fertile components of the Icelandic HIMU mantle. The ∆Nb-value reflects the mantle source and is insensitive to the degree of partial melting. NE Atlantic and Icelandic basalts have generally positive ∆Nb-values, whereas N-MORB and several other plume related OIB have negative values and fall below the Iceland array. The presence of slightly negative ∆Nb values in some of the Esjufjöll samples may be explained by the evolved and contaminated character of the basalts.
The inferred low to moderate degree of partial melting of the mantle under the EVFZ is consistent with the observed crustal thickness of about 35 km. The mantle potential temperature is probably also relatively low along the eastern periphery of the Iceland plume stem. The rise of the melt-producing mantle source may be limited by the Moho under the flank zones. In the actively spreading rift zone volcanic systems, however, the crustal separation may locally allow ascent of the melting source material to shallower crustal levels. The inferred shorter melting path beneath the EVFZ may limit the accumulated melt extraction to less than 10%, in accordance with the enriched nature of the volcanic products.
The evolved Esjufjöll basalts appear to be affected by anatectic contributions from hydrothermally altered rift zone tholeiites, as indicated by their δ18O-values of 4-5 ‰. With MgO-contents of 4.1-4.9 wt%, these δ18O-values are intermediate between those of the other flank zones, where little or no anatectic contributions can be seen and those of the rift zones, where the anatectic contributions are significant. Some plagioclase-assimilation may be supported by the positive Eu- and Sr-anomalies and the presence of primitive plagioclase xenocrysts (An80-90).
The Esjufjöll rhyolites differ from the other EVFZ rhyolites by having lower Al2O3 (< 12 %) and K2O (< 3 %) contents, similar to the rift zone rhyolites. These features are consistent with the intermediate δ18O-values of the evolved basalts. The rhyolitic magma generation probably involved considerable partial melting of hydrated basaltic crust in addition to fractional crystallization, and AFC-processes may generally be more important in Esjufjöll than in the other off-rift volcanic systems.
2003 Iceland Summer School 21

Microearthquakes in the Katla volcanic system, South Iceland Kristín Jónsdóttir, Reynir Bodvarsson, Ragnar Slunga Department of Earth Sciences, Geophysics, University of Uppsala, Villavägen 16, 75236 Uppsala ( [email protected]) The microearthquakes within the Katla volcanic system underneath the Myrdalsjokull ice cap in South Iceland are complex to analyze and rather different from most other microearthquake datasets in Iceland. In the routine analysis of the data from the SIL system which includes 8000 events in the area from the year of 1991 to 2002, there is a cutoff around M=3 in the magnitude distribution. This saturation in magnitude which is probably related to a weak crust, is very obvious in the data from the year of 2002, which is by far the most seismically active year from the beginning of earthquake recordings in the area. Some preliminary results of the analysis of these earthquakes show a well established b-value of 0.7-0.8 below saturation. Surface waves are observed in most events and indicate shallow source. Although the structure of the crust along the ray path from source to receiver in the area is presumably rather complex, some of the earthquake's properties can be related to double events, with a smaller earthquake preceding a larger event with 0.5-5 seconds interval or even multiple events and/or other source mechanisms. Strong low frequency of 2-7 Hz apparent in the events, along with the surface waves and the multiplicity of events, complicate the analysis. What controls aftershock decay in South Iceland? Sigurjón Jónsson1, Paul Segall2, Rikke Pedersen3, and Grímur Björnsson4
1Harvard University, Department of Earth and Planetary Sciences, 20 Oxford Street, Cambridge, MA 02138, USA ([email protected]) 2Geophysics Department, Stanford University, Stanford, CA 94305-2215, USA 3Nordic Volcanological Institute, Grensásvegur 50, 108 Reykjavík, Iceland 4National Energy Authority, Grensásvegur 9, 108 Reykjavík, Iceland Large earthquakes alter the stress in the surrounding crust leading to triggered quakes and aftershocks. Several time-dependent post-seismic processes can further alter the stress state and change the tendency for triggered events. Such processes include (1) afterslip on the mainshock rupture [Bürgmann et al., 2002], (2) viscous flow of the lower crust and upper mantle [Freed and Lin, 2001], (3) pore-fluid flow caused by the coseismic pore-pressure changes [Nur and Booker, 1972], and (4) delayed response of the triggered fault as predicted by rate and state friction [Dieterich, 1994]. Although it has proven difficult in many cases to distinguish between these post-seismic mechanisms, we present an example from South Iceland where geodetic measurements and modeling calculations can help us to do so. Satellite radar interferometric (InSAR) observations of post-seismic deformation after two Mw6.5 earthquakes in South Iceland are consistent with simple models of poro-elastic rebound during the first two months after the earthquakes, but inconsistent with
2003 Iceland Summer School 22

both afterslip models and visco-elastic relaxation [Jónsson et al., 2003]. Interferograms from subsequent periods show no significant signal. Afterslip is not a plausible explanation of the fringe pattern, as it would demand left-lateral back-slip as well as vertical slip, neither favored by Coulomb stress changes on the faults. Visco-elastic relaxation is also not plausible for two reasons: (1) the two month duration of the transient deformation would require very low viscosity (~1017 Pa s), and (2) the observed deformation is too localized near the faults to be explained by lower crustal or mantle processes. Our poro-elastic interpretation is further supported by water level changes observed in numerous boreholes throughout the epicentral region. The sign of the coseismic water level changes exhibits a quadrantal pattern consistent with the predicted undrained response. The post-seismic water level recoveries have a spatial distribution consistent with the InSAR observations. While the post-seismic behavior varies from well to well, the duration of the water level recovery of most wells is 1-3 months, consistent with the two month long deformation signal observed in the interferograms. Here we test whether the aftershock decay follows the predicted changes in effective stress, induced by poro-elastic effects, or if it is better explained by delayed triggering as predicted by rate and state friction. Off-fault aftershocks preferentially occur in the two quadrants that experienced coseismic decrease in compression on N-S oriented faults and post-seismic pore-pressure increase. However, the duration of the aftershock sequence is much longer than the 1-3 month duration of the pore-pressure transients. Extrapolation of the ongoing Omori-like decay predicts an aftershock duration of 3-4 years. Therefore, the aftershock decay does not seem to be controlled by pore-pressure changes near the faults, although interpretation is complicated because the InSAR data cannot constrain whether the poro-elastic rebound occurs only in the uppermost 2-3 km or down to the bottom of the seismogenic crust. The bulk of the aftershock activity occurs between 3 km and 10 km depth. If the permeability decreases significantly below 2-3 km then the deeper pore-pressure recovery would last longer, possibly 3-4 years like the aftershocks. The seismicity-rate model of Dieterich [1994] based on rate-state constitutive behavior, predicts that the aftershock duration depends upon stressing rate. We assume that the stressing rate can be approximated by -∆τ/tr, where ∆τ is the stress change on the mainshock rupture and tr is the average recurrence interval. For the SISZ, where similar events occur roughly every 100 years, this model predicts aftershock duration of 2-10 years, which is in reasonable accord with the observations. We conclude that the duration of the aftershock sequence is better explained by rate- and state-dependent processes acting at ‘receiver faults’ rather than by poro-elastic changes in effective stress. The different time scales of the pore-pressure changes (2 months) and the aftershock decay (3-4 years) seem to indicate that these processes are unrelated, although at present we can not rule out slower poro-elastic relaxation at depth. References: Bürgmann, R. et al., Time-space variable afterslip on and deep below the Izmit
earthquake rupture. Bull. Seismol. Soc. Am., 92, 126-137, 2002.
2003 Iceland Summer School 23
Dieterich, J., A constitutive law for rate of earthquake production and its application to earthquake clustering. J. Geophys. Res., 99, 2601–2618, 1994.
Freed, A. M., and J. Lin, Delayed triggering of the 1999 Hector Mine earthquake by viscoelastic stress transfer. Nature, 411, 180-183, 2001.
Jónsson, S., P. Segall, R. Pedersen, and G. Björnsson, Post-earthquake ground movements correlated to pore-pressure transients, Nature, in press 2003.
Nur, A., and J. R. Booker, Aftershocks caused by pore fluid flow? Science, 175, 885-887, 1972.
Origin of modal layering in the Fongen-Hyllingen Intrusion, Norway Karin Josephsen and J. Richard Wilson Department of Earth Sciences, University of Aarhus, Denmark ([email protected])
The 160 km2 Fongen-Hyllingen Intrusion (FHI), situated 60 km southeast of Trondheim, Norway, is one of the largest layered mafic intrusions in the Central Scandinavian Caledonides. The synorogenic intrusion was emplaced into folded metapelitic and metabasaltic country rocks (Fig. 1). It crystallised prior to the culmination of the Caledonian orogeny (in late Silurian) during which it was transported to its present location by eastward nappe translation. The intrusion is now situated in one of the uppermost nappe units in the Trondheim region. Deformation and erosion have revealed an advantageous section through the intrusion with exposure of both the roof and floor of the magma chamber and a ca. 4500m-thick sequence of layered cumulates. The cumulates show extreme cryptic variation (Fo73-0 and An63-01) and several major reversals with stratigraphic height have been identified, reflecting periodic magma replenishment events. Mineral parageneses in the contact metamorphic aureole of FHI indicate that emplacement took place at 3-4 kb at a depth of 10-14 km. A zircon U-Pb age of 426 ± 8
2 Ma is interpreted as dating the time of magmatic crystallisation of the final differentiates (Wilson & Sørensen, 1996).
2003 Iceland Summer School 24

Fig. 1: A) Location of the Fongen-Hyllingen Complex in Norway. B) Simplified geological map of the Fongen-Hyllingen Complex and its country rock envelop. Deformation and erosion have revealed a section through the complex with exposure of roof, floor and a possible feeder to the intrusion. C) Idealized subdivision of the layered series into evolutionary stages on the basis of mineral chemistry in profiles normal to the modal layering (after Wilson & Sørensen, 1996)
A major feature of FHI is the presence of an increasingly discordant relationship between modal- and cryptic layering approaching the southern margin. This discordant feature has been explained by crystallisation of compositionally zoned magma along an inclined floor (Fig. 2). This model involves in situ crystallisation and is incompatible with layer-forming theories involving large-scale crystal transport (crystal settling) and thermal convection (Wilson & Larsen, 1985).
his detailed study has focussed on a modally layered sequence of cumulates to
6,8 m-thick profile of layered cumulates, comprising 73 layers of 1-40 cm thickness (average thickness is 9-10 cm), has been sampled. This sample profile is located about
Fig. 2: Outline of the relationship between modal- and cryptic layering, near the southern margin of the Fongen-Hyllingen Intrusion.
Tevaluate the mechanism(s) involved in layer-formation. A
2003 Iceland Summer School 25
1 km above the base of the layered sequence in the northern part of the intrusion. Average mineral compositions of olivine, plagioclase and clinopyroxene in the profile are: Fo50, An48 and Mg#64. Orthopyroxene is locally present whereas magnetite and brown hornblende are constant accessories. A modal lamination parallel with layer boundaries is locally developed; no mineral lineation has been observed. Modally homogeneous layers and layers with graded modal compositions are more or less equally represented in the profile, but inversely graded layers (mafic top and felsic base) dominate over normally graded layers in the proportion 3:1. Lithologies span a wide range including anorthosites, various gabbroic rocks (gabbro, diorite, norite, gabbronorite and troctolite) and ultramafic rocks (dunite and websterite). The average composition of the rocks lies close to eutectic proportions in the Fo-Di-An system. It is noteworthy that the average modal composition of 2 m-thick intervals in the profile does not deviate significantly from that of the profile as a whole. This implies that the oscillatory process responsible for layer-formation returned to its “starting point” after crystallisation of ~2 m thick sequences. Plagioclases generally show reverse zoning with relatively sodic cores. The absence of any size-grading, the predominance of inversely graded layers and the
rge-scale crystallisation model for Fongen-Hyllingen Intrusion required by the
aaløe, S. (1978): The Origin of Igneous Layering. Mineralogical Magazine, v. 42, p. 64.
eries, Norway. Geological Magazine, v. 122, p. 97-121.
sevier, p.
pward Growth of Normal Faults in Southwest Iceland: Driven By ike Magmatism?
iences, University of Idaho, PO Box 443022, Moscow, ID 3844-3022 ([email protected])
west Iceland, vertical normal faults and joints are rranged into discrete curvilinear fracture zones separated by regions of little or no
ladiscordant relationship between modal and cryptic layering favour an in situ crystallisation process. This involves the oscillatory nucleation of mineral phases under slightly supercooled conditions, which presumably exist within a stagnant boundary layer of melt along the crystallisation front (Maaløe, 1978). This is strongly supported by the reversely zoned plagioclases whose cores represent slightly quenched compositions. References: M
533-5Wilson, J.R. & Larsen, S.B. (1985): Two-dimensional study of a layered intrusion: the
Hyllingen S
Wilson, J.R. & Sørensen, H.S. (1996): The Fongen-Hyllingen Layered Intrusive Complex in Cawthorn, R.G., ed., Layered Intrusions. Amsterdam, El303-329.
UD Simon A. Kattenhorn Dept. of Geological Sc8 On the Reykjanes Peninsula, southafracturing. The faults have typically been interpreted to have formed at the surface and then subsequently propagated downwards; however, surface geometries and
2003 Iceland Summer School 26

kinematic indicators suggest otherwise. For example, the faults are typically associated with narrow monoclinal folds that parallel the fault traces at the surface. Such folds could not have formed through drag effects because vertical fault surfaces are not in frictional contact. Individual fracture segments along the fault traces are commonly rotated out of the general trend of the fracture cluster, indicating oblique motion along subsurface normal faults and subsequent upward growth of echelon segments. This fault slip behavior implies a rotation of the stress field occurred during fault growth and evolution. These field observations have been combined with the results of fracture mechanics based numerical models to demonstrate that vertical normal faults propagated to the surface from below. In the subsurface, faults have typical normal fault dips (~60°); however, at depths of between 500 and 250 m, the reduction in confining stress allowed tension fractures to form at the upper tips of faults. These fractures subsequently propagated vertically towards the surface, inducing narrow monoclinal folds at the surface projection of the faults. The implication is that fault nucleation occurred at depth in the brittle crust in response to a driving mechanism that concentrated stress in the subsurface rather than at the surface of the Earth. A likely driving mechanism is dike intrusion from below, suggesting a link between magmatic activity and fault nucleation and subsequent growth history. Variations in magmatic activity may have affected local stress fields which thus showed temporal rotations that impacted on fault kinematics. GPS Derived Velocity Field across the Eastern Volcanic Zone, celand
Femina (1), Tim Dixon (1), Erik Sturkell (2), Thora Arnadottir (3) and reysteinn Sigmundsson (3)
, 4600 Rickenbacker Causeway, Miami, FL 33149 [email protected])
d ute, Reykjavik, Iceland
Eastern Volcanic Zone VZ), southeastern Iceland using Global Positioning System data collected in the
cial
rial d
stern
I Peter C. LaF (1) Geodesy Lab, UM-RSMAS(p(2) Department of Geophysics, Icelandic Meteorological Office, Reykjavik, Icelan(3) Nordic Volcanological Instit We have calculated the velocity of 45 sites located in the(Eperiod 1994-2002. Sites velocities were calculated using GIPSY 2.5 with non-fidusatellite ephemeris data from JPL. Site velocities were transformed into ITRF97 andlater calculated relative to the stable North America and Eurasian plates using the angular velocities of Sella et al., (2002). The velocity field covers the tectonically complex intersection of the EVZ and South Iceland Seismic Zone (SISZ), a sub-aeridge-transform intersection. The velocity field is influenced by several tectonic anvolcanic events, including; 1) the February – March 2000 eruption of Hekla volcano, 2) the June 17 and 21, 2000 M 6.6 SISZ earthquakes, 3) possible inflation and deflation at Torfajokull, and Katla volcanoes, 4) post glacial rebound associated with the retreat of the Vatnajokull glacier, and 5) long term spreading across the WeVolcanic (WVZ) and EVZ. Site velocities demonstrate approximately 15% and 85% of plate spreading accommodation across the WVZ and EVZ, respectively and in agreement with Sigmundsson et al., (1995). The influence of co- and post-
2003 Iceland Summer School 27
seismic/post-rifting/post-eruption viscoelastic relaxation of the lower crust mantle on the velocity field is the focus of ongoing research.
and upper
ossible strain precursors for the June 2000 earthquakes south
attias Lindman
epartment of Geosciences, Geophysics, University of Uppsala, Villavägen 16, 75236
he South Iceland Seismic Zone (SISZ) is a transform plate boundary between the
order to search for possible strain precursors for the June 2000 earthquakes
try to model the deformation in the area between the June 2000 faults by slip on a
is not straightforward to interpret the strain field between the future June 2000
PIceland– a study of crustal deformation 1984-1995 M DUppsala, Sweden (Email: [email protected]) TEurasian and the North American plates. In June 2000 two magnitude 6.6 earthquakes took place within the SISZ. Ingeodetic data from 1984 and 1995 was used to estimate principal strains of the crustal deformation field within SISZ in this time period (figure 1). In the western part of SISZ the estimated principal strains are influenced by the increased seismic activity and uplift in the Hengill area starting in 1994. Further east but west of the fault that ruptured June 21 the estimated strain field is relatively uniform except for the large principal strain at point 8422 and the variation in principal strain direction east and west of this point. Between the faults that would rupture in June 2000 the estimated principal strains vary highly, both when it comes to direction and magnitude. The uniform strain field predicted by the estimated principal strains show a good fit to the measured strains in some cases. In other cases the measured strains vary more rapidly with direction than the estimated uniform strain field. At point KALD for example, the measured strain varies from ~20 mm/km shortening to ~70 mm/km expansion over just ~10 degrees. This and other cases indicate very local deformation. Anumber of faults in a homogenous elastic half space shows a relatively good fit when it comes to the sign of the deformation but not the magnitude. This indicates that a large part of the deformation could be aseismic. Itfaults as precursors. But, the large principal strains with their varying directions in this area may be related to the preseismic phase of the crustal deformation cycles and thus represent intermediate- to long-term precursors for the June 17th earthquake. Due to spurious data no conclusions were drawn regarding the June 21st earthquake.
2003 Iceland Summer School 28

Figure 1. Deformation in South Iceland 1984-1995 in terms of principal strains at node points in the south Iceland geodetic network. The points KALD and 8422 are discussed in text. Light grey lines represent the June 2000 faults; darker grey lines show previously mapped faults. 10 microstrain = 10 mm/km. Geochemical tracing of the Karoo mantle plume: Jurassic ferropicrites and Fe-rich olivine tholeiites from Dronning Maud Land, Antarctica Arto V. Luttinen Department of Geology, P.O. Box 64, 00014-University of Helsinki, Finland ([email protected])
Although a plume origin has been advocated to the Jurassic continental flood basalt magmatism in the Karoo Large Igneous Province, plume-derived magma types have not been positively identified in the magmatic suite. Primitive, high-Mg picrite basalts from the Nuanetsi (Mwenezi) area of southeastern Zimbabwe have been previously considered to represent melting products of hot mantle plume material near the plume centre. Trace element and Nd and Os isotopic studies, however, strongly argue for a major (up to 50%) lithospheric component in them.
The Jurassic basalts of western Dronning Maud Land record an Antarctic extension of the Karoo province. Twelve olivine porphyritic dykes from Vestfjella and adjacent areas in western Dronning Maud Land comprise three intrusive suites with different textures, mineralogy, and geochemical compositions. Suites A and B are typified by unusually high TiO2 and FeOtot at given MgO and can be grouped as ferropicrites. They represent unusually primitive Karoo magma types and provide useful information on the mantle sources of Karoo magmatism. Suite C consists of olivine tholeiites, which have transitional TiO2 and FeOtot contents between those of ferropicrites and the spatially associated low-Ti flood basalt lavas. The studied suites can be subdivided to dykes with ‘normal’ and ‘enriched’ large ion lithophile element (LILE) contents. Those with normal LILE contents are characterized by smooth mantle-normalized patterns and resemble basalt types typically associated with
2003 Iceland Summer School 29
oceanic spreading centres and hotspots. Compared to other Karoo basalts, the studied dykes have exceptionally radiogenic 143Nd/144Nd and unradiogenic 87Sr/86Sr. Dykes B1 and C1 (normal LILE) yielded initial εNd (180 Ma) of +8.2 and +8.6 and εSr of –18.5 and –16.0, respectively. In comparison, dyke A1 has notably lower εNd (+3.6) and higher εSr (–4.7). Dykes A1, B1, and C1 have quite similar 206Pb/204Pb (18.29–18.39), but otherwise different lead isotopic compositions. They define a trend toward high 87Sr/86Sr (0.7030 to 0.7043), 207Pb/204Pb (15.52 to 15.60), and 208Pb/204Pb (37.97 to 38.49) and low εNd at almost constant 206Pb/204Pb. In comparison, the dykes with high LILE have significantly lower 206Pb/204Pb (17.75 to 18.04), but the Nd and Sr isotopic compositions are quite similar.
Several hotspots associate with the mid-ocean-ridge systems that developed around southern Africa after Gondwana break-up. Isotopic comparison of the Jurassic dolerites and present-day oceanic basalts from Southwest Indian Ocean and southern Atlantic Ocean shows that ferropicrite suite B is similar to typical MORB from these regions and also resembles OIB from the Marion hotspot. Olivine tholeiitic suite C also plots within or close to the field of MORB. Ferropicrite suite A is distinguished from most MORB by its low εNd and high εSr and 207Pb/204Pb and has clearly higher εSr and lower 206Pb/204Pb values than OIB from the Crozet, Marion, Bouvet, and Shona hotspots. However, it shows affinity to plume-influenced MORB from the Discovery anomaly, southern Atlantic Ocean. Overall, dykes A1, B1, and C1 define a trend that extends from the field of MORB towards the assumed composition of the enigmatic Discovery plume. The high-LILE dykes extend from this trend towards the fields of low-206Pb/204Pb high-LILE oceanic basalts from Indian Ocean. The origin of such LILE-enriched basalts remains controversial. Ferropicrites represent a rare rock type that has been only recently identified and linked to mantle plume activity during generation of large igneous provinces. Ferropicrite suite A exhibits the highest FeOtot and light REE contents combined with the lowest εNd values. The olivine tholeiitic suite C has the lowest FeOtot and light REE contents coupled with the highest εNd values and resembles MORB apart from their higher FeOtot concentrations at given MgO content. All of the studied dykes thus seem to include a Fe-rich component, presumably from the Karoo mantle plume. This plume component is highest in the OIB-like suite A and lowest, although still detectable, in the MORB-like suite C. The compositions of the ferropicrites and the Fe-rich olivine tholeiites may record mixing between enriched material from the plume axis and depleted asthenosphere. Suite C most closely resembles the depleted plume-derived component that has been proposed in previous studies of Karoo magmatism. Ferropicrite suites A and B record anomalous rock types in the Karoo province. Their emplacement was probably confined to late magmatic stage and recorded passage of the plume centre beneath the study area. The isotopic resemblance between suite A and modern plume-influenced basalts from southern Atlantic Ocean suggests that the Discovery hot spot may record the present position of the Karoo mantle
2003 Iceland Summer School 30

Structural development of an oceanic detachment fault system, Atlantis Bank, Southwest Indian Ridge Elena A. Miranda, Barbara E. John, B. Ronald Frost
Dept. of Geology and Geophysics, University of Wyoming, Laramie, Wyoming 82071 ([email protected])
In slow-spreading mid-ocean ridge environments, both magmatic and tectonic processes accommodate spreading, where the latter can be manifested as detachment fault systems. Atlantis Bank, an oceanic core complex formed ~11 Ma at the intersection of the ultra-slow-spreading Southwest Indian Ridge and the Atlantis II transform, is dissected by transform-parallel normal faults that provide unique cross-sections through all levels of the detachment fault system. Gabbro collected in ODP Hole 735B and with the manned submersible Shinkai 6500 from the footwall, hanging wall, and detachment fault surface provide details of the extensional fault system exposed over 36 km normal to the ridge axis, or greater than 3 m.y. of crustal accretion. Together the sample suite provides an ideal basis for interpreting the process of strain localization and fabric development associated with the formation of long-lived oceanic detachment faults.
Analysis of the in situ dive samples and continuous core from ODP Hole 735B indicate that the main shear zone associated with denudation and detachment faulting is > 500 m thick. The structurally deepest samples collected from the footwall are characterized by a 200 m-thick zone of granulite-grade (650° - 900° C) crystal-plastic deformation with varying intensity of fabric development from unfoliated to ultramylonitic. Many of these rocks exhibit a lower-temperature amphibolite- (450° - 650° C) or greenschist- (300° - 450° C) grade overprint. Structurally above the granulites lies a 300 m-thick zone of amphibolite-grade deformation with protomylonitic to mylonitic fabric. The amphibolites contain 20-30 mm-thick zones of high-strain mylonite that increase in number and decrease in thickness upward toward the detachment fault surface. Most amphibolites exhibit a semi-brittle to brittle greenschist-grade overprint. Samples from the localized slip plane or detachment fault surface are highly altered and deformed in both the ductile and brittle regimes. Cataclasites and breccias containing clasts of gabbro and diabase are common. The gabbro clasts within the breccia preserve the earlier high-temperature history, as they contain remnant σ-shaped porphyroclasts and folded ductile fabrics.
The granulite-grade rocks are characterized by crystal-plastic deformation of
plagioclase, orthopyroxene, clinopyroxene and olivine. Plagioclase exhibits fast grain-boundary migration (bulging) and finely recrystallized neoblasts; pyroxene porphyroclasts are bent and often develop recrystallized neoblasts; olivine exhibits deformation bands, undulose extinction and occasionally forms σ-shaped porphyroclasts. Two-pyroxene thermometry based on mineral composition data from orthopyroxene and clinopyroxene porphyroclast hosts and their exsolution lamellae in gabbro mylonite yield temperatures of 950° C. Equivalent analysis of adjacent recrystallized ortho- and clinopyroxene neoblasts yield temperatures 850° – 950° C.
2003 Iceland Summer School 31

Pyroxene porphyroclasts and their exsolution lamellae underwent ductile deformation after exsolution. Therefore, the temperature estimates may indicate the temperature during initiation of ductile deformation. As pyroxene neoblasts recrystallized during crystal-plastic deformation, these temperatures indicate that ductile deformation continued through 850° C. The greenschist-grade overprint of the granulite-grade rock, manifested by the foliation-parallel growth of green amphibole, chlorite and serpentine around plagioclase neoblasts, preserves a subsequent lower-temperature history. The microstructures of the detachment fault surface breccias and those of granulite-grade footwall rocks suggest that deformation initiated at high temperatures in the ductile regime, and continued through lower temperatures through the semi-brittle and brittle regimes as fault rocks were denuded along the detachment fault system. Models for the development of oceanic core complexes developed purely within the brittle regime clearly do not apply to the well-exposed and sampled Atlantis Bank region of the Southwest Indian Ridge.
References: Brodie, K.H. and Rutter, E.H., 1985. On the relationship between deformation and
metamorphism, with special reference to the behaviour of basic rocks: In Thompson, A.B. and Rubie, D. (eds), Kinetics, Textures and Deformation. Advances in Physical Geochemistry, v. 4, 138-179. Springer, New York.
Dick, H.J.B. et al., 2000. A long in situ section of the lower ocean crust: results of ODP Leg 176 drilling at the Southwest Indian Ridge: Earth and Planetary Science Letters, v. 179 (1) p. 31-51.
Karson, J.A., 1998. Internal structure of oceanic lithosphere: a perspective from tectonic windows, In Faulting and Magmatism at Mid-Ocean Ridges, Geophysical Monograph 106, p. 177-218.
Lindsley, D.H., 1983. Pyroxene thermometry: American Mineralogist, v. 68, p.477-493.
Lister, G. A., and G. S. Davis, 1989. The origin of metamorphic core complexes and detachment faults formed during Tertiary continental extension in the northern Colorado River region, U.S.A., Journal of Structural Geology, v. 11, 1-2, 65-94.
MacLeod, C.J., J. Escartin, D. Banerji, G.J. Banks, M. Gleeson, D.H.B. Irving, R.M. Lilly, A.M. McCaig, Y.Niu, S. Allerton, D.K. Smith, 2002. Direction geological evidence for oceanic detachment faulting: The Mid-Atlantic Ridge, 15°45’N: Geology, v. 30, 10, p. 879-882.
Mutter, J.C., and Karson, J.A., 1992. Structural processes at slow-spreading ridges: Science, v. 257, p. 627-634.
Passchier, C.W., and Trouw, R.A.J., 1998. Microtectonics, Springer: Berlin. 289 pages.
Shipboard Scientific Party, 1999. Leg 176 Summary. In Dick, H.J.B., Natland, J.B., Miller, D.J., et al., Proc. ODP, Init. Repts., 176; College Station TX (Ocean Drilling Program), p. 1-70.
Yokosuka/Shinkai 6500 Scientific Party, 2000. MODE ’98 Leg 4 Cruise Report; Atlantis II Fracture Zone, JAMSTEC, 221 pages.
Yokosuka/Shinkai 6500 Scientific Party, 2001-2002. ABCDE YK01-14 Preliminary Cruise Report; Investigation of Atlantis Bank and the SW Indian Ridge from 56° to 58° E, JAMSTEC, 463 pages.
2003 Iceland Summer School 32
Coulomb-Failure Modeling of Rift Grabens W. Jason Morgan Geosciences Dept, Princeton University, Princeton, NJ 08544-1003, USA If the upper several kilometers of the crust is regarded as a 'rubble' parameterized with a Coulomb Law of failure, then the characteristic features of a graben that forms over a vertical dike can be modeled with a finite element program. If the shear stress at a point exceeds the brittle limit, the shear modulus is reduced - the large resultant shear strain times the lowered shear modulus then equals the maximum allowed stress. There is no need to prescribe bounding faults in the finite element mesh in order to make the graben (as in Rubin and Pollard, Geology, 1988), the 'correct' width of the graben (~ 5 km) comes as a natural consequence of the 'Coulomb failure'. [There is also a hint as to why in the dike event we are studying (the 1978 extension/downdrop of the Kelduhverfi profile north of Krafla) the dike rose to only ~3 km depth. If the dike rose higher than this, it would enter the 'failure zone' in which it is no longer contained as a vertical dike. It would instead spread out almost as if it had entered the bottom of a body of water, forming a sill that would only lift the surface, not extend a graben. This suggests a test for future eruptions if graben deformation could be observed during an eruption.] The present model has a very simplistic rheology, the brittle failure limit is defined only by the depth ( ShearStress < .85 x density x gravity x depth ). We are working on a more realistic model where the body force due to gravity and the strains due to the previous extension history plus the new stress due to the dike injection are used to determine the brittle failure envelope. Mechanics of the 1975 Kalapana, Hawaii, earthquake Susan E. Owen (1), and Roland Bürgmann (2) (1) Department of Earth Sciences, University of Southern California, Los Angeles, California, 90089-0742 ([email protected])
(2) University of California-Berkeley, Department of Geology and Geophysics, 375 McCone Hall, Berkeley, California, 94720-4767
The active volcanoes of Hawaii are responsible for recurrent damaging
earthquakes, the most recent being the events of 1975 and 1989. Both earthquakes occurred beneath the structurally unstable south flank of Kilauea volcano, but also caused internal deformation of the south flank block and magma redistribution. Other volcanic flanks, especially those on oceanic shields, exhibit evidence for slumping and catastrophic gravity sliding during their growth. Benefiting from the dense seismometer network and rich geodetic database collected by the Hawaiian Volcano Observatory, we evaluate kinematic models of the 1975 Kalapana earthquake
2003 Iceland Summer School 33

deformation to improve our understanding of the processes that cause large volcanic edifices to fail. We hope to better understand the seismic hazard of Kilauea's south flank through rigorous analysis of geodetic data spanning this largest Hawaiian earthquake of the past century. Trilateration, leveling, and tilt measurements collected by the Hawaiian Volcano Observatory provide constraints on the nature and magnitude of deformation accompanying the 1975 Kalapana earthquake. Along the seacoast, as much as 8 m seaward displacement and 3 m of subsidence occurred. If the geodetic data are interpreted using standard elastic dislocation modeling, solving for distributed slip on the detachment plane, up to 35 m of seaward dip slip are required. This significantly exceeds the seismic moment of the M~7.2 event. However, in addition to detachment slip, up to 2.5 m of ground rupture was triggered along about 25 km of the steeply SE-dipping Hilina normal-fault system. The zone of largest horizontal and vertical geodetic displacements is downslope of the Hilina fault system. Analysis of detailed field measurements of surface offsets along the Hilina faults and the regional geodetic data suggest that the 1975 earthquake caused significant, shallowly rooted slumping and internal deformation of Kilauea's south flank. Deformation measurements near Kilauea’s summit show that significant volumes of magma were redistributed during the event. A small summit eruption immediately following the earthquake was followed by magma withdrawal and subsidence of Kilauea. Thus, the 1975 event consisted of a complex sequence that includes a large earthquake rupture at depth, shallow slumping and internal deformation of Kilauea's south flank, and redistribution of magma in Kilauea.
Subsidence at Askja volcano, North Iceland: InSAR Observations and Different Modeling Approaches Carolina Pagli (1,2) and Freysteinn Sigmundsson (2) (1) Science Institute, University of Iceland, (2) Nordic Volcanological Institute ([email protected])
The Askja central volcano is located on the divergent plate boundary in North Iceland. Last major rifting episode happened in Askja in 1874-1876, but the most recent eruption in Askja occurred in 1961. Askja has been continuously deforming since onset of crustal deformation studies in the area in 1966. Sturkell and Sigmundsson [2000] give an overview of deformation in the area, based on GPS and optical leveling tilt measurements. Subsidence of at least 75 cm from 1983 to 1998 occurred at the volcano without any eruptive activity.
In order to further study deformation around Askja, interferometric analysis of Synthetic Aperture Radar images (InSAR), acquired by the ERS-1and ERS-2 Satellites, have been conducted. The interferograms span the1992-2000 period and cover a large area in central Iceland. Deformation signal around Askja is clearly evident in five different interferograms from two different Track/Frame pairs. The interferograms cover all of the Askja area and span different time periods. The observed deformation signal consists of a concentric fringe pattern centered at the Askja caldera, slightly elongated in the north direction. The signal is time-progressive and thus more evident in the interferograms covering longer periods. In all the analyzed interferograms, the observed deformation signal is associated with
2003 Iceland Summer School 34
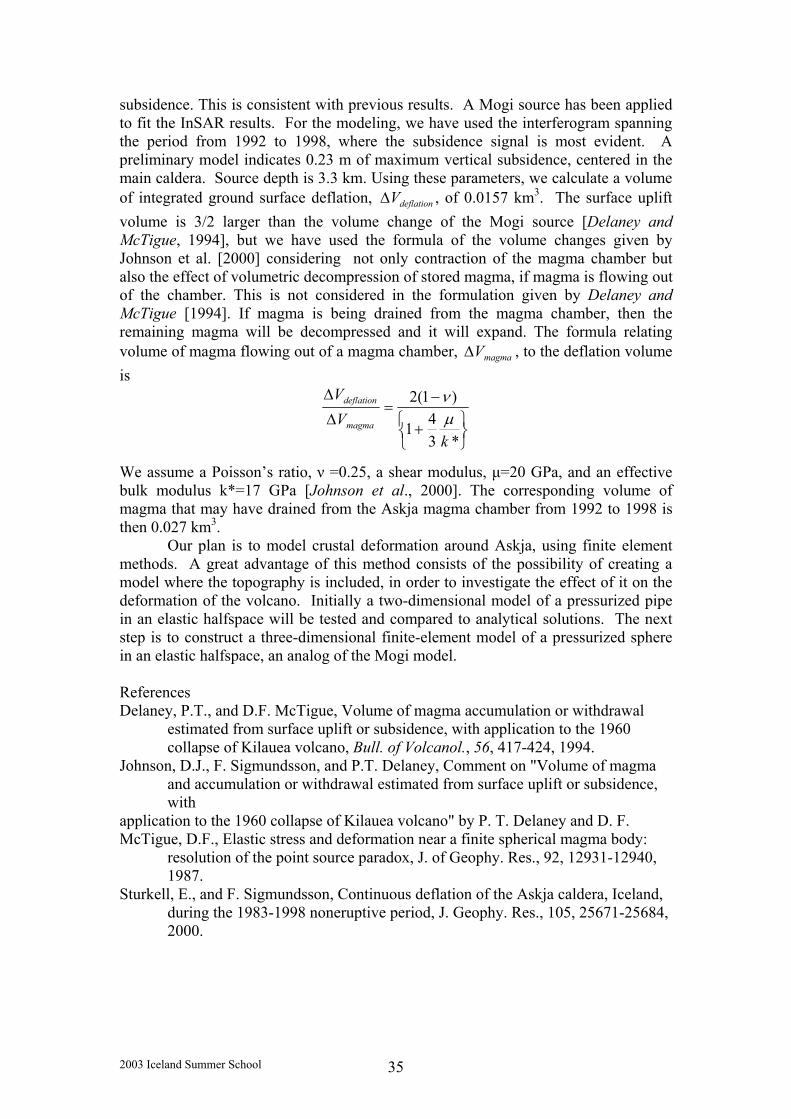
subsidence. This is consistent with previous results. A Mogi source has been applied to fit the InSAR results. For the modeling, we have used the interferogram spanning the period from 1992 to 1998, where the subsidence signal is most evident. A preliminary model indicates 0.23 m of maximum vertical subsidence, centered in the main caldera. Source depth is 3.3 km. Using these parameters, we calculate a volume of integrated ground surface deflation, deflationV∆ , of 0.0157 km3. The surface uplift volume is 3/2 larger than the volume change of the Mogi source [Delaney and McTigue, 1994], but we have used the formula of the volume changes given by Johnson et al. [2000] considering not only contraction of the magma chamber but also the effect of volumetric decompression of stored magma, if magma is flowing out of the chamber. This is not considered in the formulation given by Delaney and McTigue [1994]. If magma is being drained from the magma chamber, then the remaining magma will be decompressed and it will expand. The formula relating volume of magma flowing out of a magma chamber, magmaV∆ , to the deflation volume is
+
−=
∆
∆
*341
)1(2
kVV
magma
deflation
µν
We assume a Poisson’s ratio, ν =0.25, a shear modulus, µ=20 GPa, and an effective bulk modulus k*=17 GPa [Johnson et al., 2000]. The corresponding volume of magma that may have drained from the Askja magma chamber from 1992 to 1998 is then 0.027 km3.
Our plan is to model crustal deformation around Askja, using finite element methods. A great advantage of this method consists of the possibility of creating a model where the topography is included, in order to investigate the effect of it on the deformation of the volcano. Initially a two-dimensional model of a pressurized pipe in an elastic halfspace will be tested and compared to analytical solutions. The next step is to construct a three-dimensional finite-element model of a pressurized sphere in an elastic halfspace, an analog of the Mogi model.
References Delaney, P.T., and D.F. McTigue, Volume of magma accumulation or withdrawal
estimated from surface uplift or subsidence, with application to the 1960 collapse of Kilauea volcano, Bull. of Volcanol., 56, 417-424, 1994.
Johnson, D.J., F. Sigmundsson, and P.T. Delaney, Comment on "Volume of magma and accumulation or withdrawal estimated from surface uplift or subsidence, with
application to the 1960 collapse of Kilauea volcano" by P. T. Delaney and D. F. McTigue, D.F., Elastic stress and deformation near a finite spherical magma body:
resolution of the point source paradox, J. of Geophy. Res., 92, 12931-12940, 1987.
Sturkell, E., and F. Sigmundsson, Continuous deflation of the Askja caldera, Iceland, during the 1983-1998 noneruptive period, J. Geophy. Res., 105, 25671-25684, 2000.
2003 Iceland Summer School 35

Different styles of magmatic-tectonic interaction: Two recent examples from Iceland Rikke Pedersen1, Freysteinn Sigmundsson1 and Søren Bom Nielsen2
1Nordic Volcanological Institute, Reykjavik, Iceland (rikke@ hi.is) 2Department of Earth Sciences, Aarhus University, Århus, Denmark
We present crustal deformation measurements from Southern Iceland derived from a series of ERS-interferograms spanning the years 1993-2000. We focus here on the two active volcanic centers Hekla and Eyjafjallajökull, where the interferograms provide important new information on crustal deformation and ongoing processes.
Eyjafjallajökull is an icecap covered stratovolcano situated in, what is considered to be a propagating rift zone in southern Iceland. The volcano erupts infrequently, with only two known eruptions in historic time (last 1100 years). The eruptive products are alkaline in composition, with only small volumes produced in historic eruptions. The episodic activity of this system is illustrated by two intrusive episodes detected within the last decade, causing major concern in the local community. In 1994, and again in 1999, seismic unrest associated with magmatic intrusions occurred in the system. The main cluster of seismicity was in both cases spatially offset from the center of surface uplift. Surface deformation was detected not only by interferometry, but also by dry-tilt and GPS.
Good temporal resolution of the 1999 intrusive episode has been obtained through InSAR images. The resulting uplift amounts to about 20 cm in the LOS (line-of-sight) direction. Several of the interferograms cover the whole time-span of the 1999 intrusion, but a few image combinations cover different periods of the intrusive event. The data set enables us to follow the temporal development of crustal deformation created by the 1999 intrusion, and hence the growth of the intrusion itself through time.
Hekla is one of the most active volcanoes in Iceland, and appears to be continuously deforming. It is a fissure volcano situated at the intersection between the South Iceland Seismic Zone (SISZ) and the Eastern Volcanic Zone (EVZ). Since the first eruption in historic time, 1104 A.D., the volcano was in an eruption cycle with 1-2 eruptions per century, until it apparently terminated in an explosive eruption in 1947. The next eruption followed already in 1970, and Hekla has erupted roughly every 10 years since then (1980/81, 1991, 2000). Seismic activity is generally high just prior to and during eruptive episodes, but the volcano is basically aseismic in inter-eruptive periods. A strong correlation exists between the length of the inter-eruptive period and the SiO2 content of the eruptive products. All eruptions since 1970 have produced andesitic lavas (SiO2 ~55%), but older eruptions have resulted in evolved products with a SiO2 content as high as ~70%.
Interferograms covering the Hekla volcano and immediate surroundings display a composite deformation pattern. During inter-eruptive periods an area approximately 20 km in diameter (centered at the summit) subsides. The subsidence peaks on the most recent lava flows, due to cooling and compaction of the erupted material. Subsidence is however not confined within the areas covered by lava flows, but extends over a broader region. A subtle uplift signal (<1cm/yr) is seen circumscribing the subsidence. The uplift has a diameter of approximately 40 km, inverting to subsidence at about 20 km distance from the summit, as mentioned. This composite pattern of deformation can be interpreted as evidence of ongoing visco-
2003 Iceland Summer School 36
elastic lithospheric flexure, caused by gravitational loading. The load of eruptive products from Hekla appears to exceed the strength of the elastic lithosphere (the uppermost part of the crust that behaves in an elastic manner) in this area characterized by high heat-flow. An alternative explanation of the uplift bulge is that it is caused by gradual inflation of a deep seated magma storage area.
Eyjafjallajökull and Hekla show very different styles of magmatic-tectonic interaction, in spite of their proximity (40 km apart). Eyjafjallajökull seems to be a relatively cold structure with low melt production. The volcano deforms episodically, during intrusive events accompanied by seismic swarms. It rests on an elastic lithosphere capable of sustaining the load from the almost 1700 meter high volcanic cone (~200 km2), at least on the short timescales here explored. Hekla appears at the other end of the spectrum, as a warm structure, with continuous, aseismic, inter-eruptive deformation and high melt production. The Hekla area is characterized by a weak visco-elastic lithosphere, apparently incapable of sustaining the load from the ~1500 meter high volcanic cone (~150 km2) for even the few years here investigated. Magma transport beneath a volcanic edifice Virginie Pinel and Claude Jaupart Laboratoire de Dynamique des Systèmes Géologiques, Institut de Physique du Globe de Paris, 4 pl. Jussieu, 75 252 Paris Cedex 05, France ([email protected]) Rates and directions of dyke propagation depend on the total stress field which may not be lithostatic. Here, we quantify the stress field due to the load of a volcanic edifice at Earth's surface. This stress field may act to prevent upward propagating dykes from reaching the surface. Magma overpressures inside a rising dyke reach a maximum at a given depth which depends on the edifice shape and dimensions as well as on the density contrast between magma and surrounding crust. At this given depth, magma overpressure may trigger lateral dyke injection. A dyke propagating in the horizontal direction extends vertically and may lead to a fissure eruption at some distance from the edifice summit. InSAR observations of surface deformation associated with the 2002 eruptions of Nyriagongo and Nyamulagira volcanoes, Democratic Republic of Congo, Africa Michael P. Poland (1), Zhong Lu (2), and Charles W. Wicks Jr (3) (1)U.S. Geological Survey, Cascades Volcano Observatory, 1300 SE Cardinal Ct.,
Suite 100, Vancouver, WA 98683-9589, USA ([email protected]) (2) U.S. Geological Survey, EROS Data Center, Sioux Falls, SD 57198, USA (3) U.S. Geological Survey, MS 977, 345 Middlefield Road, Menlo Park, CA 94025,
USA
On January 17, 2002, an eruption of the frequently active east African volcano Nyiragongo sent lava flows into the city of Goma, 18 km to the south. About 13%
2003 Iceland Summer School 37

(4.5 km2) of the city was destroyed and several dozen people were killed. Co-eruptive activity monitored by the Goma Volcano Observatory included ~100 tectonic earthquakes with magnitude > 3.5 and subsidence in the entire rift system, reaching a maximum of ~50 cm in Goma along the shore of Lake Kivu between January and March 2002 (as reported by UN Office for the Coordination of Human Affairs response team). The subsidence may have initiated around January 12-14, as suggested by local reports of water level changes in Lake Kivu at that time. Although the extrusion of lava flows ended by January 18, intermittent volcanic activity at the summit of Nyiragongo persisted throughout 2002. Following a dramatic increase in seismicity, fissure eruptions occurred on July 25, 2002 on the N and S flanks of neighboring Nyamulagira volcano, a large shield located 14 km northwest of Nyiragongo. The eruption ended by September 27, 2002. Since that time, several large (> M5) tectonic earthquakes have occurred (two on 10/24/02 and one on 5/3/03), a seismic crisis was reported at Nyamulagira (early May, 2003), and lava lake activity and minor eruptions are ongoing at Nyiragongo.
InSAR data acquired by RADARSAT-1, ERS-1, and ERS-2 indicate dramatic co-eruptive deformation during the January and July 2002 activity and Nyiragongo and Nyamulagira volcanoes, respectively. From early 1997 until January 14th, 2002 no significant deformation was detected by InSAR (only subsidence of a lava flow erupted on the north flank of Nyamulagira during 1989-1991). Between January 14 and February 7, 2002, the deformation pattern changed significantly, with broad fringes across the Lake Kivu region and an area of tightly spaced fringes in the vicinity of Goma. After February little deformation is again apparent until the July-August time period, when dense fringes are apparent around the summit of Nyamulagira. Following that activity, InSAR results again reveal no deformation through November 2002, the time of the most recent data processed.
We believe that the InSAR data covering the January 2002 eruption of Nyiragongo volcano reveals a broad rifting event accompanied by shallow dike intrusion. Extension from rifting probably preceded the dike intrusion (based on observations of the pre-eruptive seismicity and changes in the level of Lake Kivu) and resulted in the opening of an old fracture system that transported degassed magma from the summit region of Nyiragongo to the low flanks of the volcano, where most of it was extruded as passive lava flows. The lack of significant widespread surface displacements both before and after the eruption indicates the rifting event occurred in a short time interval with little precursory or post-eruptive deformation. The inflation of Nyamulagira volcano in July-August may be the result of dike intrusion associated with the eruption that began on July 25, 2002. It is important to note that the InSAR results do not reveal surface deformation during time periods that include large tectonic earthquakes (October 2002) or minor eruptive activity (from January, 2002 to the present) at the two volcanoes. The results suggest that magmatism in the Lake Kivu region may be driven by episodic rifting events, and that background volcanism is not associated with major deformational events.
2003 Iceland Summer School 38
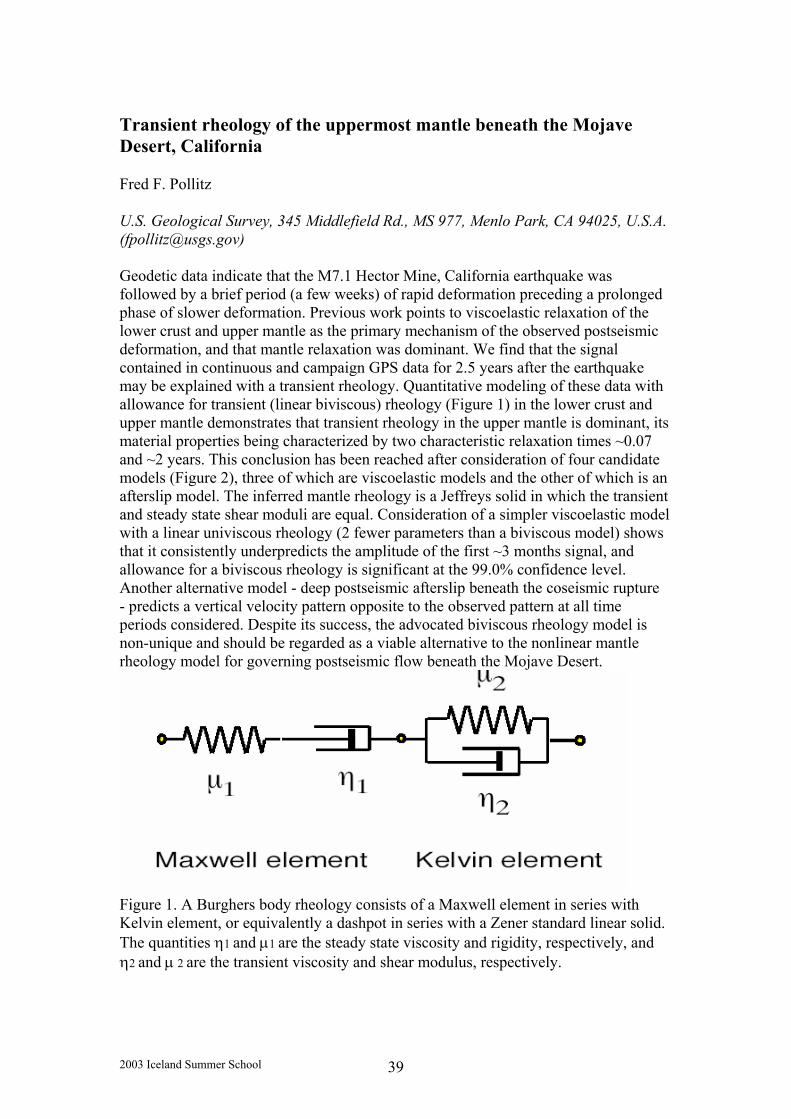
Transient rheology of the uppermost mantle beneath the Mojave Desert, California Fred F. Pollitz U.S. Geological Survey, 345 Middlefield Rd., MS 977, Menlo Park, CA 94025, U.S.A. ([email protected]) Geodetic data indicate that the M7.1 Hector Mine, California earthquake was followed by a brief period (a few weeks) of rapid deformation preceding a prolonged phase of slower deformation. Previous work points to viscoelastic relaxation of the lower crust and upper mantle as the primary mechanism of the observed postseismic deformation, and that mantle relaxation was dominant. We find that the signal contained in continuous and campaign GPS data for 2.5 years after the earthquake may be explained with a transient rheology. Quantitative modeling of these data with allowance for transient (linear biviscous) rheology (Figure 1) in the lower crust and upper mantle demonstrates that transient rheology in the upper mantle is dominant, its material properties being characterized by two characteristic relaxation times ~0.07 and ~2 years. This conclusion has been reached after consideration of four candidate models (Figure 2), three of which are viscoelastic models and the other of which is an afterslip model. The inferred mantle rheology is a Jeffreys solid in which the transient and steady state shear moduli are equal. Consideration of a simpler viscoelastic model with a linear univiscous rheology (2 fewer parameters than a biviscous model) shows that it consistently underpredicts the amplitude of the first ~3 months signal, and allowance for a biviscous rheology is significant at the 99.0% confidence level. Another alternative model - deep postseismic afterslip beneath the coseismic rupture - predicts a vertical velocity pattern opposite to the observed pattern at all time periods considered. Despite its success, the advocated biviscous rheology model is non-unique and should be regarded as a viable alternative to the nonlinear mantle rheology model for governing postseismic flow beneath the Mojave Desert.
Figure 1. A Burghers body rheology consists of a Maxwell element in series with Kelvin element, or equivalently a dashpot in series with a Zener standard linear solid. The quantities η1 and µ1 are the steady state viscosity and rigidity, respectively, and η2 and µ 2 are the transient viscosity and shear modulus, respectively.
2003 Iceland Summer School 39

2003 Iceland Summer School 40
Dike models of tiltmeter data from the 1984 rifting event at Krafla, Iceland: Indication of a vertical component to the propagation direction Dominique Richard1, Susan E. Owen1 and Freysteinn Sigmundsson2 1 Dept. of Earth Sciences, Univ. of Southern California, Los Angeles, CA 90089 ([email protected]) 2 Nordic Volcanological Institute, IS-108 Reykjavik, Iceland The September 4th 1984 Krafla fissure eruption occurred in northern Iceland during the 1975-1984 rifting episode. The surface deformation resulting from the propagation of the feeder dike was monitored by three continuously recording tiltmeters located around the southern end of the ~ 8.5 km long fissure, within the Krafla caldera. The tiltmeter time series (east and north components) was compared to models of dike propagation and magma chamber deflation by computing model tilt from both a growing dislocation (Okada, 1985) and a deflating Mogi source (Mogi, 1958) in an elastic half-space. Preliminary modeling results favored vertical dike propagation, indicating that there is an important vertical component to the propagation direction. To test these results, the resolution of the tiltmeter data will be evaluated by testing dike propagation models that combine lateral and vertical dike propagation. The results of the tiltmeter data modeling will also be compared to additional data sets such as EDM, leveling, and optical leveling tilt data, which constrain the geometry and opening of the fully propagated dike. Results from this study will improve our understanding of the magma transport mechanisms at Krafla and similar volcanic systems such as mid-ocean ridges. References: Mogi, K., Relations between the eruptions of various volcanoes and the deformations
of the ground surfaces around them. Bulletin of the Earthquake Research Institute, 36:99-134, 1958.
Okada, Y., Surface deformation due to shear and tensile faults in a half-space, Bull. Seismol. Soc. Am., 75: 1135-1154, 1985.
Aspects of the volcanology and geochemistry of the weakly peralkaline rhyolitic Thorsmörk Ignimbrite in relation to the volcanism of the South Volcanic Flank Zone, South Iceland Heidi Ritterbusch and Paul Martin Holm Geological Institute, Copenhagen University, Øster Voldgade 10, DK-1350, Copenhagen Denmark ([email protected]) The 55 Ka Thorsmörk Ignimbrite (TI), originate from the Tindfjallajökull Volcanic System (TJVS) and is situated in the northernmost part of the South Volcanic Flank Zone (SVFZ) in South Iceland, into which the active spreading of the Eastern Rift
2003 Iceland Summer School 41

Zone (ERZ) propagates. Based on field appearance, the ignimbrite was divided into four units, namely a basal unit, a black unit, a grey unit and a beige unit. The basal unit is interpreted as the remains of a pre-ignimbritic rhyolitic fall deposit, and the black, grey and beige units as parts of one cooling unit formed by different degrees of welding and devitrification (crystallization) of glass particles across an unknown number of pyroclastic flow units. The cooling unit is classified as an ignimbrite based on the relatively large content of pumice clasts and glass shards, the varying thickness, occurrence of eutaxitic texture, fossil fumaroles, welding and crude lateral and vertical grading in light pumice and heavy lithic clasts. Subglacial (mainly brittle) deformation of the ignimbrite occurred subsequent to cooling. Approximately 140 samples of the Thorsmörk ignimbrite and 10 samples of glassy rhyolite and obsidian lavas from the TJVS were collected.
TAS Diagram for particles in the Thorsmörk Ignimbrite
1,0
3,0
5,0
7,0
9,0
11,0
13,0
15,0
40,0 45,0 50,0 55,0 60,0 65,0 70,0 75,0 80,0SiO2 wt%
BLGL
BRGL
SC
PU
LG
TJVS rhyolite
TJVS Obsidian
TJSV Glass
Crystallized glassshards
Irvine andBaragar 1971
Five types of glass (brown glass shards (BRGL), black glass shards (BLGL), light coloured glass shards (LG), scoria clasts (SC) and pumice clasts (PU)) were analysed on electron microprobe in 32 samples. Glass in rhyolites from Tindfjallajökull was analysed in 3 samples and devitrified pseudomorfs after glass shards in 2 samples. The Wavelength Dispersive Method (WDS was used in order to enhance analytical precision, especially on the minor elements. Black glass shards are interpreted as altered (tachylite) brown glass shards or shards of scoria as no chemical component separates them from these two groups. Brown glass shards and scoria are mainly basaltic (BRGL) to andesitic and trachytic (SC) with SiO2 between 45 and 69 wt%. Major-element variation in SC is large within individual clasts, indicating mingling of possibly a basaltic and a trachytic to rhyolitic magma. Light glass shards and pumice clasts are trachytic to rhyolitic with SiO2 between 65 and 80 wt%, and agpaitic indices (AI = Na2O+K2O/Al2O3 in molar %)
2003 Iceland Summer School 42

between 0,44 and 1,16. More than ¾ of the data has AI ≥ 1,00 classifying these as weakly peralkaline (comenditic rhyolite). A negative trend in AI and total alkalis with higher SiO2 is defined by LG and PU, and is primarily caused by a decrease in Na2O. The cause of this is presently being studied. Microlites in pseudomorphs of glass particles (devitrified/crystallized glass shards) are primarily alkali feldspar and quartz. Phenocrysts in the ignimbrite are mainly alkali feldspar and grass-green clinopyroxene, with accessory apatite, zircon, oxides and sporadic olivine, aenigmatite and REE-minerals allanite and chevkinite. The presence of na-rich clinopyroxene and aenigmatite attests to the peralkaline character of the ignimbrite-forming magma. The TI and rhyolitic rocks of the TJVS bear a general transitional to weakly (per)alkaline signature, characteristic of the South Volcanic Flank Zone and their bulk chemistry resemble the bulk chemistry of rocks of the Torfajökull Volcanic System (TOVS), where some comenditic rhyolites have also been found. Initial results indicate influence on the formation of the ignimbrite-forming magma and eruption(s) of interaction of a transitional basaltic and a tholeiitic to transitional acidic magma rather than a straightforward evolution through fractional crystallization. This resembles the inferred petrogenesis for rocks from TOVS. Content of hybrid scoria clasts is larger in the upper beige, unwelded unit, indicating larger influence of magma mingling in later stages of the eruption history. The ignimbrite itself, being a pyroclastic flow deposit, is thought to have formed through a series of explosive eruptions initiated by an eruption causing the formation of a small rhyolitic fall-out deposit in parts of the area, followed by several discrete or one more or less continuous eruption(s) of varying explosivity. Secondary processes of compaction, welding and devitrification along with tertiary processes of erosion and deformation immediately followed the deposition of the ignimbrite. Volcano- tectonic interactions in NW Armenia- results from petrology, geochemistry and quaternary volcano and fault distribution Ivan P.Savov, C.Connor, M. D’Antonio, R.Djrbashian, K.Kelley Department of Geology, University of South Florida, Tampa, FL, USA ([email protected])
Armenian volcanoes occur within an active collisional setting involving the Anatolian, Arabian and Eurasian plates. Based on REVEL-2000, convergence between the Arabian and Eurasian plates in this region is approximately 13 cm yr-1 (azimuth 3 degrees). Although this margin lacks a subduction zone, volcanic activity is pervasive in Armenia, with over 600 mapped volcanic vents of predominately Quaternary age. This volcanism consists of distributed stratovolcanoes, cinder cones, lava domes, and spatter mounds, with products ranging from Plinian tephra deposits to aa lava flows. During the Fall, 2002, we conducted field work on the Oktemberian
2003 Iceland Summer School 43

Plateau, situated between the large calc-alkaline stratovolcano Mt.Ararat (Turkey) and the subalkaline ignimbrite-shield volcano Mt.Aragats (Armenia). Our primary goals were to document the petrogenesis of volcanic products on the Oktemberian Plateau and to consider mechanisms of magma generation in this unique tectonic setting, in light of our geochemical and petrologic analyses.
We collected volcanic rock samples from > 20 small Quaternary volcanic edifices on the Oktemberian Plateau. Our samples commonly have [Na2O+K2O] > 6 wt % and fall in the sub-alkaline field (ave.(CaO/[Na2O+K2O]) ~ 0.9). In total, they form a compositional trend from trachybasalts to trachydacites, but the majority of the samples are basalt- trachyandesites and trachyandesites. The silica content of these samples correlates positively with K2O, and negatively with MgO. SiO2 also shows positive correlation with Rb, Th, Zr and Ba, and negative correlation with Sc and V. The incompatible elements (e.g., Rb, La) are enriched in the more fractionated magmas, whereas the compatible elements (e.g., Cr, Sc) are accommodated in early crystallizing minerals. Such elemental variations with increasing SiO2 contents could be explained by fractional crystallization. On log-log Y versus Rb and Sm vs Rb bivariate diagrams, our samples follow positive trends typical for anhydrous crystallization conditions, which is confirmed by the commonly observed Pl+Px+Ol+Mt mineral assemblage. Based on flat pattern on the Rb/Th versus Th log-log bivariate diagram and the absence of crustal xenoliths in the lavas, we conclude that assimilation processes were not involved in the magmagenesis. Our samples exhibit strong U, Sr, Th, Be, Li, LILE and LREE enrichments (ave. [La/Sm] N= 4.38) relative to the immobile HFSE and HREE (ave. [Dy/Yb] N= 1.06). These patterns, along with high Th/Yb (ave ~2.9) and negative Nb and Ta anomalies relative to N-MORBs, suggest mantle source similar to that inferred for arc lavas.
All of the above, along with evidence from Sr and Nd isotopes, shows that the lavas erupting on the Oktemberian plateau were derived from deeply seated, enriched mantle sources. Such enriched mantle is suffering the effect of long-lasting (Jurassic to Mid Eocene) subduction. The lavas produced via melting of such mantle were directly erupted to the surface since they have no continental crust signatures and there are no sign of rhyolite dome development or caldera development on the plateau that would be indicative of large magma chambers with broad differentiation trends. Unlike, previous models of Armenian volcanism, we conclude that volcanism is not resulting from partial melting of crust, driven by overthickening of the continental crust in the collision zone.
The volcanic centers we have sampled are situated on both sides of the currently active large-scale strike-slip Sardarapat Fault and close to several related smaller strike-slip faults, responsible for opening of small pull-apart basins (Karakhanian et al., 2002). Such preexisting and complex network of faults provides the means of fast magma transit to the surface. Our dataset could also be used to evaluate recent models for the origin of rhyolite magmas put forward by Tamura and Tatsumi (2002).
References: Karakhanian, A., Djrbashian, R., Trifonov, V., Philip, H., Arakelian, S., Avagian, A.,
2002. Holocene-historical volcanism and active faults as natural factors for Armenia and adjacent countries, J.Volcanol.Geotherm.Res., 113: 319- 344.
Tamura, Y., and Tatsumi, Y., 2002. Remelting of an andesitic crust as a possible origin for rhyolitic magma in oceanic arcs: an example from thr Izu- Bonin Arc, J.Petrol., 43: 1029- 1047.
2003 Iceland Summer School 44

Intermediate-Term Declines in Seismicity at Mt. Veniaminof and Mt. Wrangell Volcanoes, Alaska, Following the Mw 7.9 Denali Fault Earthquake. John J. Sánchez, and Stephen R. McNutt Geophysical Institute, University of Alaska, Fairbanks 903 N. Koyukuk dr. Fairbanks, AK 99775 On November 3, 2002 an Mw 7.9 earthquake occurred on the Denali Fault in Alaska providing a unique opportunity to look for intermediate-term (days to weeks) responses of Alaskan volcanoes to shaking from a large regional earthquake. The Alaska Volcano Observatory (AVO) monitors 24 volcanoes with seismograph networks. We examined one station for each volcano, generally the closest (typically 5 km from the vent) unless noise, or other factors made the data unusable. Data were digitally filtered between 0.8 and 5 Hz to enhance the signal-to-noise ratio. Data for the period four weeks before to four weeks after the Mw7.9 earthquake were then plotted at a standard scale used for AVO routine monitoring. Mt. Veniaminof volcano, which has had recent mild eruptions and a rate of several dozen seismic events per day on station VNNF, suffered a drop in seismicity by a factor of two after the earthquake; this may have lasted for 15 days. Wrangell, the closest volcano to the epicenter, had a background rate of about 10 events per day. Data from station WANC could not be measured for 3 days after the Mw 7.9 earthquake because the large number and size of aftershocks precluded identification of local seismicity. For the following 30 days, however, its seismicity rate dropped by a factor of two. We infer that this change, albeit subtle, may be related to the earthquake. It is known that Wrangell increased its heat output after the Mw 9.2 Alaska earthquake of 1964 and again after the Ms 7.1 St.Elias earthquake of 1979. The other 22 volcanoes showed no changes in seismicity that can be attributable to the Mw 7.9 earthquake. We conclude that intermediate-term seismicity drops occurred at Mt. Wrangell and Mt. Veniaminof volcanoes, in strong contrast to cases of short-term triggered seismicity increases observed at volcanic systems such as Katmai, Mount Rainier, Yellowstone, The Geysers and Coso geothermal fields, and Mammoth Mountain. This suggests that fundamentally different mechanisms may be acting to modify seismicity at volcanoes.
2003 Iceland Summer School 45

Low-frequency earthquakes at the Torfajökull volcano, south Iceland Heidi Soosalu (1), and Páll Einarsson (2) (1) Nordic Volcanological Institute ([email protected]), (2)Science Institute, University of Iceland Torfajökull is a large rhyolitic volcano massif with a 12-km-diameter caldera and abundant high-temperature geothermal activity. It is located in the neovolcanic zone in south Iceland, at a junction where the eastern rift zone and a transform zone meet with the intraplate volcanic flank zone of south Iceland. The latest eruption at Torfajökull occurred about 500 years ago. Torfajökull is a source of persistent small-scale seismicity. Two types of earthquakes occur. High-frequency, ordinary looking, earthquakes are concentrated in the western part of the caldera and are distributed over a depth range of 0-13 km. The earthquakes have been observed to cluster around an aseismic body, with a centre at 8 km and a diameter of 4 km, which is interpreted as a cooling magma chamber. Small low-frequency earthquakes have been observed at Torfajökull since the installation of a local analogue seismograph station in 1985. They occur typically in swarms, in the most intensive ones up to 300 earthquakes per day have been observed. Single events also occur. The low-frequency events have the frequency content of about 1-3 Hz, and they are difficult to locate, because of the emergent nature of their phases. About 160 events were located during the years 1994-2000 using the Icelandic seismic network. Although these locations are not very exact, they mainly cluster in the south part of the Torfajökull caldera. A closer study of the low-frequency events was made in April-October 2002, with a network of 18 Güralp 6TD broadband seismometers in the Torfajökull area. No distinct swarm activity was observed during this period. It was revealed that very small (local magnitude typically < 1) low-frequency events occur almost on a daily basis. The locations made so far concentrate in the south part of the caldera, between two small glaciers there. Preliminary depth estimates fall in all levels in the upper 15 km. Near the earthquake cluster there are areas of intensive geothermal activity, to which the events may be linked. It is also possible that these earthquakes are associated with active magma in the south part of the Torfajökull caldera.
2003 Iceland Summer School 46
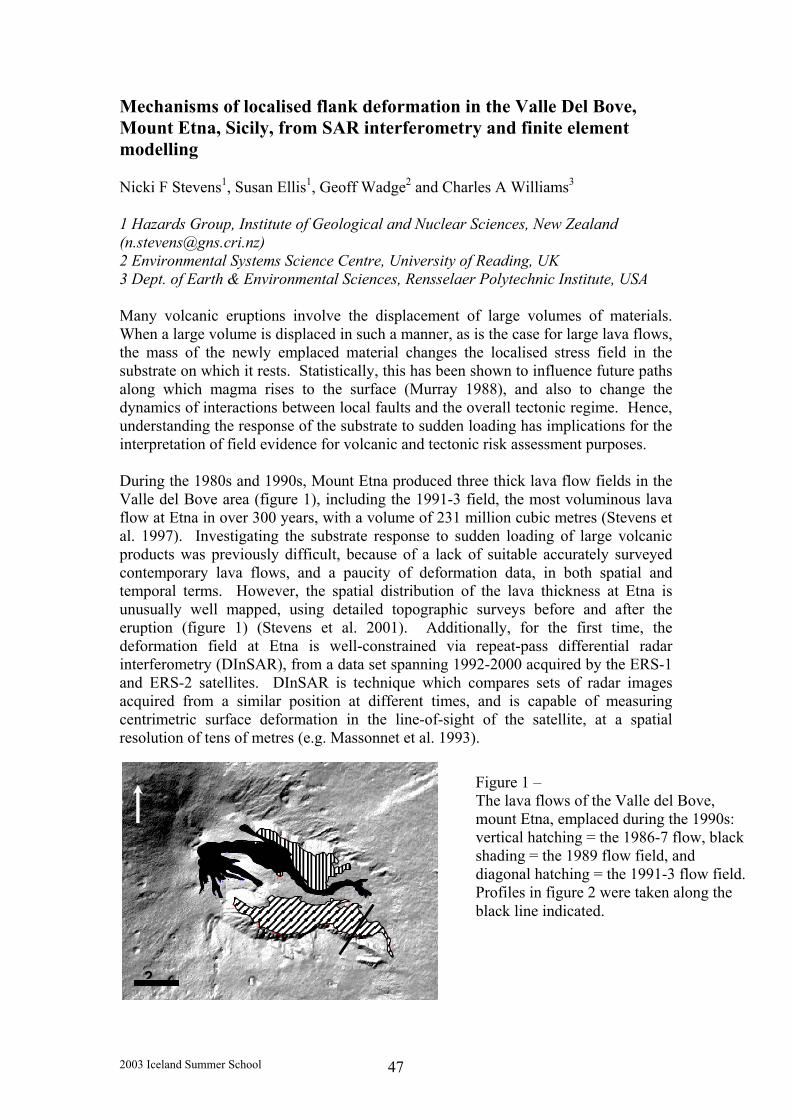
Mechanisms of localised flank deformation in the Valle Del Bove, Mount Etna, Sicily, from SAR interferometry and finite element modelling Nicki F Stevens1, Susan Ellis1, Geoff Wadge2 and Charles A Williams3 1 Hazards Group, Institute of Geological and Nuclear Sciences, New Zealand ([email protected]) 2 Environmental Systems Science Centre, University of Reading, UK 3 Dept. of Earth & Environmental Sciences, Rensselaer Polytechnic Institute, USA Many volcanic eruptions involve the displacement of large volumes of materials. When a large volume is displaced in such a manner, as is the case for large lava flows, the mass of the newly emplaced material changes the localised stress field in the substrate on which it rests. Statistically, this has been shown to influence future paths along which magma rises to the surface (Murray 1988), and also to change the dynamics of interactions between local faults and the overall tectonic regime. Hence, understanding the response of the substrate to sudden loading has implications for the interpretation of field evidence for volcanic and tectonic risk assessment purposes. During the 1980s and 1990s, Mount Etna produced three thick lava flow fields in the Valle del Bove area (figure 1), including the 1991-3 field, the most voluminous lava flow at Etna in over 300 years, with a volume of 231 million cubic metres (Stevens et al. 1997). Investigating the substrate response to sudden loading of large volcanic products was previously difficult, because of a lack of suitable accurately surveyed contemporary lava flows, and a paucity of deformation data, in both spatial and temporal terms. However, the spatial distribution of the lava thickness at Etna is unusually well mapped, using detailed topographic surveys before and after the eruption (figure 1) (Stevens et al. 2001). Additionally, for the first time, the deformation field at Etna is well-constrained via repeat-pass differential radar interferometry (DInSAR), from a data set spanning 1992-2000 acquired by the ERS-1 and ERS-2 satellites. DInSAR is technique which compares sets of radar images acquired from a similar position at different times, and is capable of measuring centrimetric surface deformation in the line-of-sight of the satellite, at a spatial resolution of tens of metres (e.g. Massonnet et al. 1993).
2
Figure 1 – The lava flows of the Valle del Bove, mount Etna, emplaced during the 1990s: vertical hatching = the 1986-7 flow, black shading = the 1989 flow field, and diagonal hatching = the 1991-3 flow field.Profiles in figure 2 were taken along the black line indicated.
2003 Iceland Summer School 47
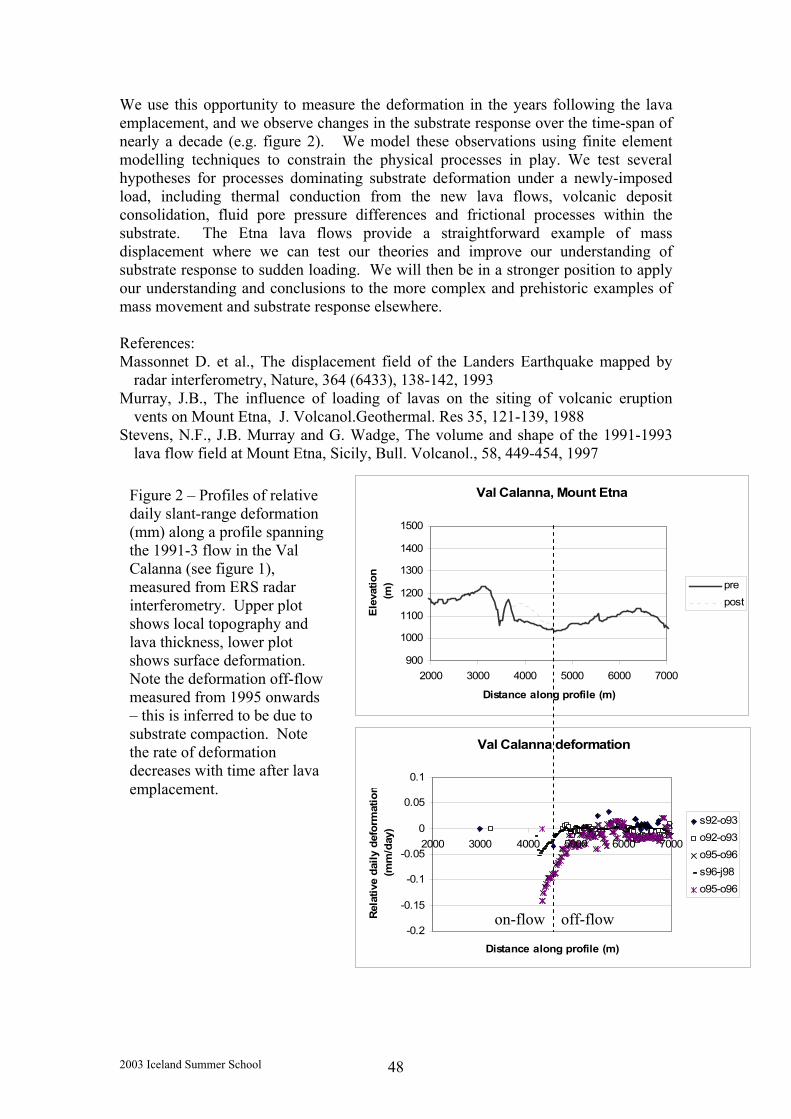
We use this opportunity to measure the deformation in the years following the lava emplacement, and we observe changes in the substrate response over the time-span of nearly a decade (e.g. figure 2). We model these observations using finite element modelling techniques to constrain the physical processes in play. We test several hypotheses for processes dominating substrate deformation under a newly-imposed load, including thermal conduction from the new lava flows, volcanic deposit consolidation, fluid pore pressure differences and frictional processes within the substrate. The Etna lava flows provide a straightforward example of mass displacement where we can test our theories and improve our understanding of substrate response to sudden loading. We will then be in a stronger position to apply our understanding and conclusions to the more complex and prehistoric examples of mass movement and substrate response elsewhere. References: Massonnet D. et al., The displacement field of the Landers Earthquake mapped by
radar interferometry, Nature, 364 (6433), 138-142, 1993 Murray, J.B., The influence of loading of lavas on the siting of volcanic eruption
vents on Mount Etna, J. Volcanol.Geothermal. Res 35, 121-139, 1988 Stevens, N.F., J.B. Murray and G. Wadge, The volume and shape of the 1991-1993
lava flow field at Mount Etna, Sicily, Bull. Volcanol., 58, 449-454, 1997
Val Calanna, Mount Etna
900
1000
1100
1200
1300
1400
1500
2000 3000 4000 5000 6000 7000
Distance along profile (m)
Ele
vatio
n (m
) prepost
Val Calanna deformation
-0.2
-0.15
-0.1
-0.05
0
0.05
0.1
2000 3000 4000 5000 6000 7000
Distance along profile (m)
Rela
tive
daily
def
orm
atio
n(m
m/d
ay)
s92-o93o92-o93o95-o96s96-j98o95-o96
on-flow off-flow
Figure 2 – Profiles of relative daily slant-range deformation (mm) along a profile spanning the 1991-3 flow in the Val Calanna (see figure 1), measured from ERS radar interferometry. Upper plot shows local topography and lava thickness, lower plot shows surface deformation. Note the deformation off-flow measured from 1995 onwards – this is inferred to be due to substrate compaction. Note the rate of deformation decreases with time after lava emplacement.
2003 Iceland Summer School 48

Crustal deformation and magma dynamics of Icelandic volcanoes Erik Sturkell Icelandic Meteorological Office, Reykjavík, Bústaðavegur 9, 150 Reykjavík, Iceland ([email protected]) Iceland is located across the mid Atlantic plate boundary and it is underlain by the Iceland mantle plume. Improvements in technology during the last three decades have allowed ever improving monitoring of magma movements in the roots of the Icelandic volcanoes. Seismic methods complemented with various geodetic methods, including levelling, GPS, volumetric strain and InSAR, have provided the most fruitful data. The longest time series extend from the mid-sixties to the present time. Magmatic processes have been detected in several volcanoes, including inflation and deflation, intrusion events, eruptions, and contraction due to cooling. The volcanoes Katla, Hekla and Grímsvötn stand out in eruption frequency, all of which are in the east volcanic zone. Katla, located at the tip of the propagating rift of the eastern volcanic zone, has shown some recent signs of unrest. A flash flood occurred in July 1999 from the Mýrdalsjökull ice cap covering Katla. This event was associated with changes in seismicity, bursts of volcanic tremor, the formation and deepening of ice cauldrons, and inflation, which is currently still in progress (spring 2003). At the same time inflation started in the neighbouring volcano, Eyjafjallajökull. Another inflation event occurred there in 1994, as shown by uplift and enhanced seismicity. The Grímsvötn volcano erupted in 1983 and 1998 and is now the most rapidly inflating volcano in Iceland. It has not yet reached its pre-1998 inflation level. Hekla, located at the intersection between the eastern volcanic zone and the south Iceland seismic zone, erupted in 1970, 1980, 1981, 1991 and 2000. Its inflation-deflation pattern is enigmatic and its short precursory time makes forecasting difficult. The large 1996 Gjálp eruption occurred between the central volcanoes Bárðarbunga and Grímsvötn. It was preceded by intensive seismic activity in Bárðarbunga and sparse GPS-measurements indicate deflation of that volcano. The Hengill volcano inflated by several cm between 1994 and 1998, accompanied by greatly increased seismicity. Torfajökull shows small amounts of deflation, while the volcanoes Askja and Krafla in the northern volcanic zone, which both comprise a shallow magma chamber (2.5-3.5 km depth), show continued, slow subsidence within the their calderas. Cooling of their shallow magma chambers most likely causes the slow deflation of these volcanoes. Torfajökull last erupted about 1480 AD, Askja erupted in 1961, and Krafla had a series of eruptions and dyking events in 1975-1984.
2003 Iceland Summer School 49

Unrest at Askja Caldera; Evidence from gravity and ground-deformation Elske van Dalfsen and Hazel Rymer Volcano Dynamics Group, Department of Earth Sciences, The Open University, Milton Keynes, MK7 6AA, ([email protected]) The combination of a divergent plate boundary and a mantle plume makes Iceland a unique place to study active volcanism1. Askja caldera, situated in the centre of Iceland, has been in a state of unrest for decades. This unrest occurs as a result of processes in a deep-lying magma chamber. Simultaneous measurements of ground deformation and gravity change at a few key stations may be used to identify magma chamber processes before conventional eruption precursors become apparent.
The volcanic centre hosts several calderas of which Askja is the largest (8 km across and 200-300 m deep). The youngest (4.5 km across), was formed in 1875 and holds lake Öskjuvatn. Microgravity measurements have been made at Askja since 1988 using LaCoste & Romberg meters2. Data points are grouped by area: caldera centre, Northern, and S-Eastern stations. Askja caldera has been continuously deflating from 1988 to 2002 at a rate of 2.5 cm per year (relative to the NE caldera rim)3.
Fig.1 Black dots represent stations of the micro-gravity network at Askja caldera.
Micro-gravity increased at all stations during these years, which is expected in an area of deflation. However, to interpret the data, height changes have to be taken into account. The Free Air gradient is the change of gravity with elevation, which is normally ~-308 µGal/m. At Askja the Free Air gradient varies ± 60 µGal/m related to density variations of subsurface structures, and therefore we measured it at each site. By multiplying the measured elevation change by the observed free-air gravity gradient, we calculated the gravity change we expected from height change alone. This is called the expected gravity change. It is compared to the observed (actual) gravity change and the residual (Net) gravity change is interpreted in terms of changes in subsurface mass.
µGal
µG
al
µGal
Fig.2 Observed gravity changes versus predicted gravity changes (striped) from 1988-2002 at the three areas.
2003 Iceland Summer School 50

From 1988-2002 with respect to the NE caldera rim, the South-eastern stations show a net micro-gravity increase of 32 µGal. The Northern and central stations show a net micro-gravity decrease of 15 µGal and 65 µGal respectively. This could be explained by magma drainage from the chamber. Drainage removes magma, resulting in mass decrease and thus gravity decrease.
We plot the deformation, which in this case is deflation, versus the gravity change in µGal in Fig.34. The observed gravity and elevation decrease at the central and Northern locations plot below the FAG. This can only be explained by sub surface mass decrease. Mass decrease could be caused by drainage of magma or a fall in the water table. In contrast, the observed net gravity increase in the SE plots above the FAG and can only be explained by mass increase. Mass increase could be caused by intrusion of dykes or a rise in the water table. Changes in mass caused by the variations in the water table are unlikely because there has been no significant change in hydrothermal activity at the surface. Also it is unlikely to have a
rise and a fall in water table, at neighbouring stations, at the same time. Therefore magma movement is more likely to be the process behind these changes.
reases.
Fig.3 The line represents the Free Air gradient. Data plotting above the FAG represent sub-surface mass increases and data falling below the FAG represent sub surface mass dec
SE
N & Centre
Following the Mogi model we calculated the volume change at the surface of the edifice from 1988-2002 to be -0.032 km3. This compares to a change in chamber volume of -0.021 km3. With only the deformation data it is impossible to identify what causes this volume decrease. With help of the micro-gravity data however we must conclude there has been a mass change because data deviate from the FAG. We can quantify this change looking at the gravitational effect of mass change at a spherical source beneath the surface, whose depth is much greater than its radius. The net mass change is -1.5 x 10¹⁰ kg from 1988-2002 which requires a volume of 0.0057 km3. Therefore at least 30% of the total volume decrease results from magma drainage from the chamber. The other 70% must results from processes which do not involve mass changes, like cooling and contraction. 1. Sigvaldason G. E. (2002) Volcanic and tectonic processes coinciding with glaciation and crustal rebound: an early Holocene rhyolitic eruption in the Dyngjufjoll volcanic centre and the formation of the Askja caldera, north Iceland. Bulletin of Volcanology 64(3-4), 192-205. 2. Rymer H. and Tryggvason E. (1993) Gravity and Elevation Changes at Askja, Iceland. Bulletin of Volcanology 55(5), 362-371. 3. Sturkell E. and Sigmundsson F. (2000) Continuous deflation of the Askja caldera, Iceland, during the 1983-1998 noneruptive period. Journal of Geophysical Research-Solid Earth 105(B11), 25671-25684.
2003 Iceland Summer School 51
4. Gottsmann J. and Rymer H. (2002) Deflation during caldera unrest: constraints on subsurface processes and hazard prediction from gravity -height data. Bulletin of Volcanology 64(5), 338-348. Volcano spreading earthquakes may adjust and cause Mauna Loa eruptions Thomas R. Walter and Falk Amelung Marine Geology and Geophysics, RSMAS - University of Miami, 4600 Rickenbacker Causeway, Miami, FL, 33149 ([email protected]) Each year thousands of seismic events shake the Island of Hawaii. Most of the earthquakes are small and related to magma migration, thus concentrate beneath the active volcanoes Mauna Loa and Kilauea. Earthquake swarms occur mostly co-eruptive near to the surface. Large earthquakes are often not directly related to magma movement within the edifice, but originate near the volcanoes base or from even deeper regions. Destructive earthquakes arise periodically on the island, accompanied or followed by voluminous eruptions of Mauna Loa or Kilauea. Once an eruption begins, the earthquakes usually diminish. We examined the eruptive history of Mauna Loa and the catalog of Hawaiian Earthquakes since 1823, and found a stunning correlation of large earthquake events and phases of eruptive activity. For instance, the Kaoiki earthquake of 1983 preceded the 220m³ eruption at Mauna Loa summit caldera and Northeast Rift Zone. The earthquakes at Mauna Loa´s southeast and southwest flank are thought to be driven by the volcano´s load itself; the edifice spreads gravitationally outward and thus causes deep sited episodic normal fault ruptures, mostly at depths greater than 5-6 km. Magnitudes reach i.e. M6.9 in 1951 and M6.0 in 1952 at the east flank (Kona earthquakes) and M6.0 in 1940 and M6.6 in 1983 at the southeast flank of Mauna Loa (Kaoiki fault zone). Simultaneously Mauna Loa eruptions occurred or were initiated somewhat afterwards. To understand the interaction between these gravity-driven earthquakes and Mauna Loa´s eruptive behavior, we performed 3-dimensional numerical models by the boundary element method, taking the topography of the entire edifice into account. Focal mechanism analysis of the M6.6 Kaoiki 83 earthquake verified near-horizontal fault slip planes of the hanging wall towards the sea; the eruption initiated in 3/1984. Our models illustrate that a 2-m displacement discontinuity at 6km below sea level, decreases the normal stress at the 1983 Mauna Loa fissure by .2MPa, whereas normal stress increases at Kilauea’s SW rift zone. The position of normal stress decrease almost perfectly matches the locality of the initial fissure opening at Mauna Loa in 1984. Since 1984 eruption, Mauna Loa volcano has been quiescent, until the inflation of the shallow magma reservoir was detected by ground deformation in 2002 and spring 2003. Hypothesized an earthquake occurs now similar to previous Kona or Kaoiki earthquakes, it may shake up Mauna Loa, reduce the normal stress on feeding systems and thus likely trigger another eruption. Kaoiki earthquakes with magnitudes from 5.5 to 6.6 occurred about once every 10 years; it seems that Mauna Loa is now overdue.
2003 Iceland Summer School 52
Large-scale tectonic-magmatic interaction in the central Andes Shimon Wdowinski Division of Geology and Geophysics, University of Miami, Miami, FL 33149-1098, USA ([email protected])
The integrated velocity field for the central Andes [Kendrick et al., 2001] combines GPS observations collected between January 1993 and March 2001 by the South America-Nazca Plate Project (SNAPP) [Norabuena et al., 1998] and central Andes GPS Project (CAP) [Bevis et al., 1999]. The observed field, which is defined in the stable South America reference frame, shows: (1) an eastward motion of the central Andes, roughly parallel to the South America-Nazca (SaNa) convergence direction, and (2) eastward decrease of the velocity magnitude reflecting elastic strain accumulation across the central Andes. A careful examination of the orientation of the observed velocities shows small but significant deviations of the observed field with respect the SaNa relative plate motion direction [e.g., REVEL – Sella et al., 2002] (Figure 1). The comparison shows that two domains can characterize the central Andes velocity field. In the northern domain the observed velocities are rotated southward with respect to the modeled ones, whereas in the southern domain the observed velocities are rotated northward. Overall, the observed velocity field is focused towards the center section of the central Andes. Bevis and Martel [2001] attributed the focusing of the velocity direction to oblique convergence along curved SaNa plate boundary and used a locked fault model to simulate the observed focusing near the trench. However, their model cannot explain the inland observed velocity focusing. Instead, I suggest that the observed velocity focus reflects along-strike variations in the mechanical strength of the Central Andes due to increased magmatism in the region. The very weak lithosphere of the central section of the central Andes absorbs more deformation than other segments of the Andes and, hence, deflects the velocity vectors towards the weaker region. Preliminary calculations using finite elements elastic plate models with variable strength show a similar deflection of the displacement field towards the weak zone; hence, the models support the hypothesis that increased magmatism in the central Andes affects the interseismic deformation field. References: Bevis, M., E. Kendrick, R. Smalley, T. Herring, J. Godoy, and F. Galban, Crustal
motion north and south of the Arica deflection: Comparing recent geodetic results from the Central Andes, Geochem. Geophys. Geosyst., 1, Paper 1999GC000011, 1999.
Bevis, M., and S. Martel, Oblique plate convergence and interseismic strain accumulation, Geochem. Geophys. Geosyst., 2000GC000125, 2001.
Kendrick, E., M. Bevis, R. Smalley, and B. Brooks, An integrated crustal velocity field for the Central Andes, Geochem. Geophys. Geosyst., 2, 10.1029/2001GC000191, 2001.
Norabuena, E., L. Leffler-Griffin, A. Mao, T. Dixon, S. Stein, I. Sacks, L. Ocala, and M. Ellis, Space geodetic observation of Nazca - South America convergence across the Central Andes, Science, 279, 358-362, 1998.
2003 Iceland Summer School 53

Sella, G.F., T.H. Dixon, and A. Mao, REVEL: A model for Recent plate velocities from space geodesy, J. Geophys. Res., 10.1029/2000JB000033, 2002.
Figure 1: Observed and modeled velocity vectors in the central Andes. The observed velocities are derived from GPS observations [Kendrick et al., 2001]. The modeled velocities use the REVEL plate velocity model [Sella et al., 2002] to calculate the expected SaNa convergence direction using the same magnitude as the observed velocities. The diagonal dashed line divides the central Andes into two domains along the direction of SaNa relative plate motion. In the northern domain the observed velocities are rotated southward with respect to the modeled ones, whereas in the southern domain the observed velocities are rotated northward.
Collision–related volcanism in Armenia: Example of the competing roles of volcanism and faulting in accommodation of tectonic stress
Jennifer N. Weller (1), C.B. Connor (1), and A. Kharakhanian (2) (1) Department of Geology, University of South Florida, Tampa, FL, USA ([email protected]) (2) Armenian National Academy of Sciences, Yerevan, Armenia Quaternary bimodal volcanism in Armenia is related to continental collision resulting from N-S convergence between the Eurasian and Arabian lithospheric plates at approximately 13 cm yr-1 (REVEL-2000; Sella et al., 2002). Volcanoes in Armenia
2003 Iceland Summer School 54

can be spatially sub-divided into two regional volcanic clusters: the Trans-Caucasian transverse uplift zone and the Ararat Depression (Figure 1). The Trans-Caucasian zone includes predominantly small-volume cinder cones, domes, and lava flow fields, all occurring along the right-lateral Sevan-Pembak and related fault systems. Within this zone, volcanic centers and continental scale strike-slip fault systems are closely correlated, with clusters concentrated in pull-apart regions along the fault system. Our ground magnetic studies in the Lake Sevan region indicate that cinder cone volcanism is closely correlated with normal faults even on a local scale in this area. In the Lake Sevan region, cinder cones occur in the hanging-walls of normal faults oblique to the overall NW trend of strike-slip faults. Our working hypothesis is that differences in the rates of silicic and basaltic volcanism in the Trans-Caucasian zone correlate with changes in the style and rate of crustal deformation. In contrast, volcanism in the Ararat Depression is more diffuse and less obviously associated with major fault zones. Nevertheless, ground magnetic mapping and geological studies in this area reveal that cinder cones and domes frequently are associates with local strike-slip faults, consistent with the idea (Hill, 1977) that fault and dike injection in this region are both working to accommodate crustal stress. Along the Sevan-Pembak fault system, high strain rates (evinced by the 1988 Spitak earthquake) are not fully accommodated by comparatively high rates of volcanism. Further from the plate boundary, in the Sadarapat basin, lower rates of volcanism are sufficient to better accommodate tectonic stresses and rates of fault slip are reduced.
This work has implications for hazard assessment. We are preparing hazard maps for future volcanic activity in the region, based on past patterns of volcanism and volcano-tectonic interaction. The distribution of Quaternary volcanoes in Armenia can be used to predict future volcanic activity as each event can be characterized as a ‘point process’. Such point processes can be represented as probability density functions. Kernel estimators were applied to volcano data from various regions in Armenia and probability surfaces were directly calculated from the locations and timing of past, discrete events (Figure 1). Such estimators were then applied to delineate patterns, such as clustering, that often occur in point distributions. Kernel estimators take point processes and create a smooth surface that reflects the likely location of future events if they are to occur. A kernel density function was then applied to estimate probable locations of future volcanism (Figure 2). As the resulting hazard maps are quite similar to those generated for other regions worldwide, we conclude that long-term volcanic hazards in Armenia are greater than in many areas of distributed volcanism and may be comparable to some subduction-zone volcanic arcs. References: Hill, D., 1977, A model for earthquake swarms, J. Geophys. Res., 82: 1347-1352. Sella, G.F., T. H. Dixon, A. Mao, 2002, REVEL: A model for Recent plate velocities from space geodesy, J. Geophys. Res., 107: 10.1029.
2003 Iceland Summer School 55
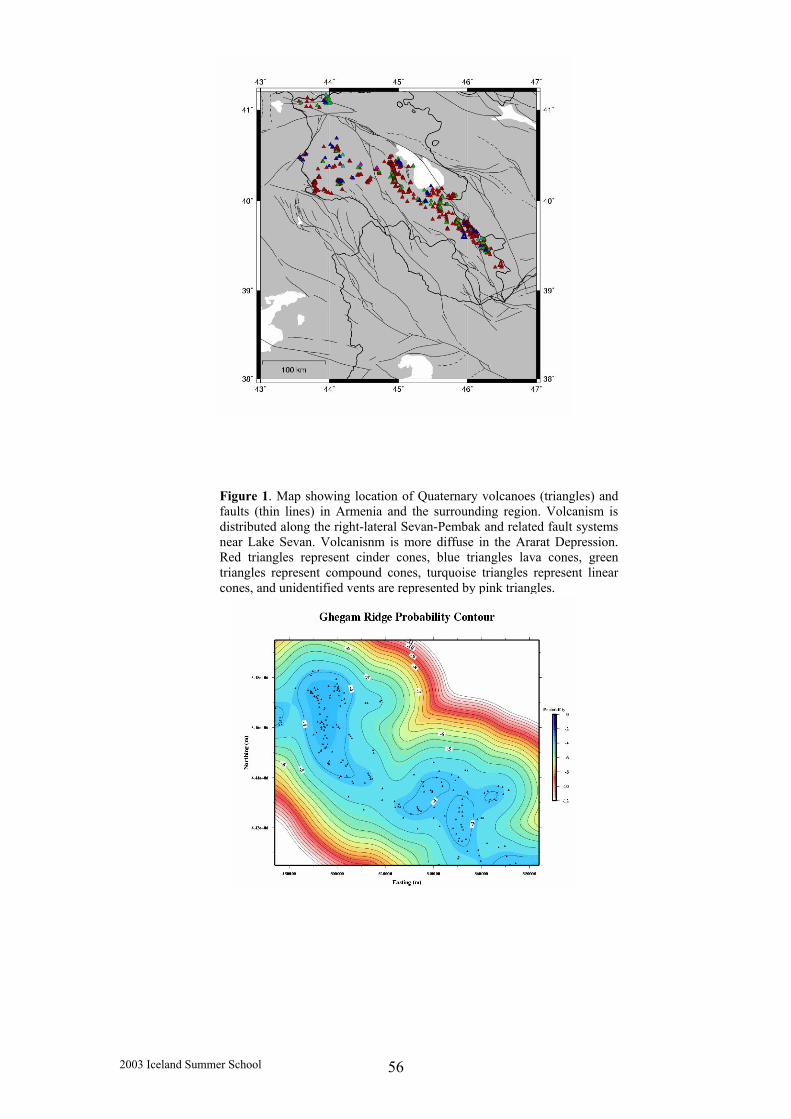
2003 Iceland Summ
Figure 1. Map showing location of Quaternary volcanoes (triangles) and faults (thin lines) in Armenia and the surrounding region. Volcanism is distributed along the right-lateral Sevan-Pembak and related fault systems near Lake Sevan. Volcanisnm is more diffuse in the Ararat Depression. Red triangles represent cinder cones, blue triangles lava cones, green triangles represent compound cones, turquoise triangles represent linear cones, and unidentified vents are represented by pink triangles.
e
Figure 2. Estimated probability of future volcanism in the Ghegam ridge area, Armenia. This contour plot was produced using a smoothing parameter of 6000 m and a contour interval of 0.05 events/km2.
r School 56
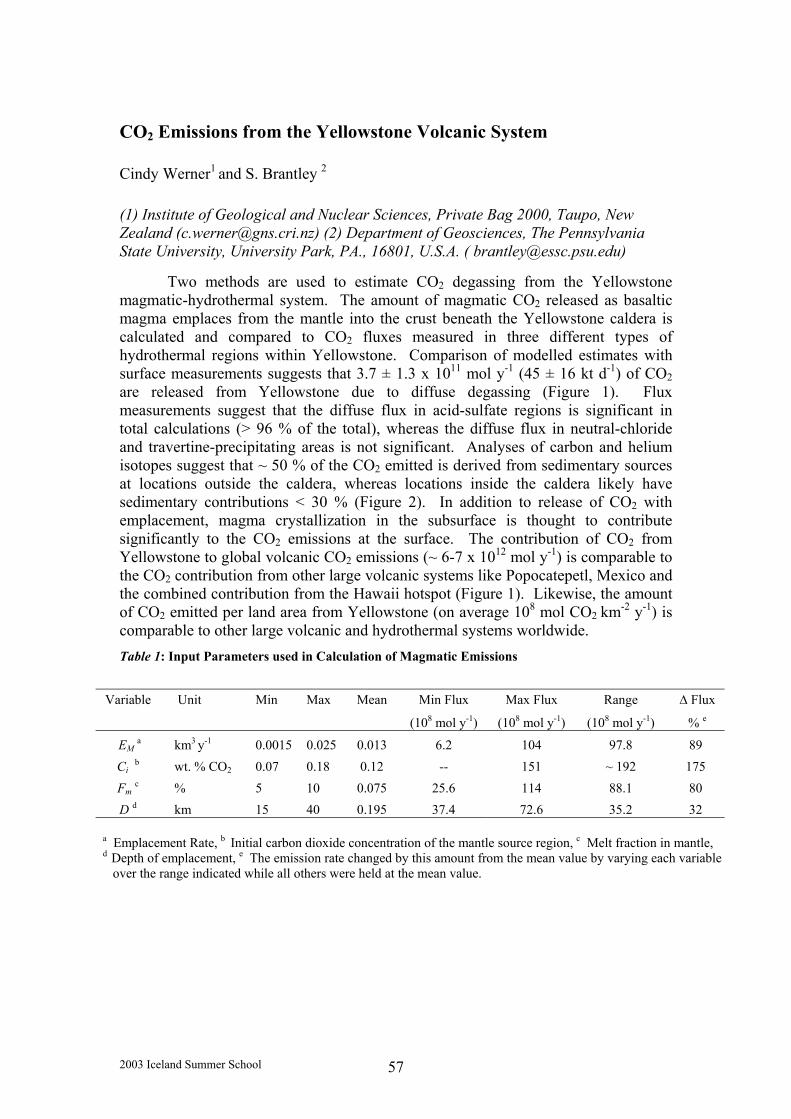
CO2 Emissions from the Yellowstone Volcanic System Cindy Werner1 and S. Brantley 2 (1) Institute of Geological and Nuclear Sciences, Private Bag 2000, Taupo, New Zealand ([email protected]) (2) Department of Geosciences, The Pennsylvania State University, University Park, PA., 16801, U.S.A. ( [email protected])
Two methods are used to estimate CO2 degassing from the Yellowstone magmatic-hydrothermal system. The amount of magmatic CO2 released as basaltic magma emplaces from the mantle into the crust beneath the Yellowstone caldera is calculated and compared to CO2 fluxes measured in three different types of hydrothermal regions within Yellowstone. Comparison of modelled estimates with surface measurements suggests that 3.7 ± 1.3 x 10¹¹ mol y-1 (45 ± 16 kt d-1) of CO2 are released from Yellowstone due to diffuse degassing (Figure 1). Flux measurements suggest that the diffuse flux in acid-sulfate regions is significant in total calculations (> 96 % of the total), whereas the diffuse flux in neutral-chloride and travertine-precipitating areas is not significant. Analyses of carbon and helium isotopes suggest that ~ 50 % of the CO2 emitted is derived from sedimentary sources at locations outside the caldera, whereas locations inside the caldera likely have sedimentary contributions < 30 % (Figure 2). In addition to release of CO2 with emplacement, magma crystallization in the subsurface is thought to contribute significantly to the CO2 emissions at the surface. The contribution of CO2 from Yellowstone to global volcanic CO2 emissions (~ 6-7 x 10¹² mol y-1) is comparable to the CO2 contribution from other large volcanic systems like Popocatepetl, Mexico and the combined contribution from the Hawaii hotspot (Figure 1). Likewise, the amount of CO2 emitted per land area from Yellowstone (on average 108 mol CO2 km-2 y-1) is comparable to other large volcanic and hydrothermal systems worldwide.
Table 1: Input Parameters used in Calculation of Magmatic Emissions
Variable Unit Min Max Mean Min Flux Max Flux Range ∆ Flux
(108 mol y-1) (108 mol y-1) (108 mol y-1) % e
EM a km3 y-1 0.0015 0.025 0.013 6.2 104 97.8 89 Ci b wt. % CO2 0.07 0.18 0.12 -- 151 ~ 192 175 Fm c % 5 10 0.075 25.6 114 88.1 80 D d km 15 40 0.195 37.4 72.6 35.2 32
a Emplacement Rate, b Initial carbon dioxide concentration of the mantle source region, c Melt fraction in mantle, d Depth of emplacement, e The emission rate changed by this amount from the mean value by varying each variable over the range indicated while all others were held at the mean value.
2003 Iceland Summer School 57

Figure 1: CO2 Emissions Modeled from Magma Ascent and Based on Measurement The dotted lines are the modelled CO2 emission rate plotted as a function of the emplacement rate of basalt magma from the mantle into the crust for different initial CO2 concentrations in the upper mantle. The arrows indicate the possible range of emplacement rates published in the literature. The range of magmatic emissions for Mud Volcano is shown at the bottom determined from detailed surface measurements and isotopic constraints. The shaded region for Yellowstone magmatic emissions was based on the range in the estimated total minus the average contribution from sedimentary sources (40 %) determined from isotopes. The emission rates for the other volcanic systems are from the following references: (a) [Brantley and Koepenick, 1995], (b) [Allard et al., 1991; Gerlach, 1991], (c) [Goff et al., 2001], (d) [Ryan, 2001; Gerlach et al., 2002], (e) [Brantley and Koepenick, 1995], (f) [Wardell et al., 2001], (g) [Chiodini et al., 2001], (h) [Seward and Kerrick, 1996b], (i) modified from [Werner et al., 2000a], and (j) [Gerlach et al., 2001].
Figure 2: C/3He as function of Carbon Isotopic Signature
The C/3He ratio is plotted as a function of the δ13C of CO2. Sedimentary isotopic signatures were chosen based on the isotopic signatures of organic gases released from sediments and from limestones that outcrop near Yellowstone. The mantle endmember was chosen as the most primitive sample collected in Yellowstone, and is shown by the two-component endmember mixing lines extending from it (dotted lines). All samples are consistent with the range observed at other hotspots [Trull et al, 1993]. Maximum sedimentary contributions were observed for Mammoth Hot Springs and the Lamar River valley and minimum contributions were observed at Mud Volcano. This work has been accepted for publication in Geochemistry, Geophysics, and Geosystems (G3) in 2003, authors indicated as above. Any correspondence should be directed to C. Werner ([email protected]).
2003 Iceland Summer School 58