summertime precipitation regimes associated with the sea breeze
TRANSCRIPT
Summertime Precipitation Regimes Associated with the Sea Breeze and Land Breezein Southern Mississippi and Eastern Louisiana
CHRISTOPHER M. HILL, PATRICK J. FITZPATRICK, JAMES H. CORBIN, YEE H. LAU
AND SACHIN K. BHATE
Northern Gulf Institute, Mississippi State University, Stennis Space Center, Mississippi
(Manuscript received 29 July 2009, in final form 4 May 2010)
ABSTRACT
This study assesses themonthly climatology of the timing and placement of convective precipitation events
induced by sea and land breezes in the Louisiana–Mississippi–Alabama region, and determines possible
reasons for the monthly differences. These objectives were achieved through surface wind climatologies and
radar composites from 2003 to 2005, supplemented by statistically significant tests. It is shown that June had
an easterly–southeasterly wind regime, whereas July and August featured more southerly flow. These wind
regimes may have influenced monthly diurnal wind patterns along the coast. While all months showed a
typical pattern of sea-breeze evolution, the land breeze demonstrated monthly variations off the Mississippi
and Louisiana coasts. July andAugust feature a westerly land breeze fromLouisiana, while theMississippi land
breeze was stronger in August than in July. A daily wind speed minimum offshore fromMississippi indicates
a local transition of influence from the land breeze to the sea breeze, and precedes the peak of the sea breeze
at the coastline by about 2 h. During the nighttime hours, radar composites show that precipitation is most
prevalent offshore of the Louisiana and Mississippi coastline. By 1100 central daylight time (CDT), pre-
cipitation is observed over coastal regions. Local afternoon precipitation is widespread throughout the inland
areas, while precipitation is minimal offshore. Statistical significance tests show that areal precipitation
coverage (APC) increases in mid- to late summer on the Mississippi coast are due to higher precipitable
water and, to a lesser extent, additional CAPE. Greater offshore APC in July and August results from the
influence of the local land-breeze setup. Convergence of a land breeze from eastern Louisiana and
a stronger land breeze from Mississippi provides the additional lift needed to generate convection over
a greater area.
1. Introduction
The sea-breeze circulation (SBC) has long been rec-
ognized as a significant mesoscale phenomenon affect-
ing weather conditions throughout coastal regions of the
world. According to the early works of Haurwitz (1947)
and Neumann (1951), the extent to which the discrete,
forward-propagating surface boundary of the SBC—
known as the sea-breeze front (SBF; see Table 1 for a list
of the key acronyms used in this paper)—migrates in-
land, and the manner in which it is oriented relative to
the coastline, depends on 1) the temperature gradient
between land and water, 2) the prevailing boundary layer
flow, 3) land elevation, and 4) the shape of the coastline.
Regional variations in coastal geography and topogra-
phy allow the SBC to take on different forms. Specialized
numerical models have been designed to simulate the
SBC for specific locations, accounting for the intricate
effects of coastal geography and topography (McPherson
1970; Pielke 1974; Anthes 1978; Steyn and Mckendry
1988; Arritt 1989). Modern mesoscale models also qual-
itatively capture regional features of the SBC (Case et al.
2002; Colby 2004; Etherton and Santos 2008). Islands
(Ramis et al. 1990), peninsulas (Wilson and Megenhardt
1997), mountainous coasts (Banta et al. 1993; Lu and
Turco 1994), and lake/river breezes (Physick and Byron-
Scott 1977; Simpson 1994) all alter SBCs and their asso-
ciated precipitations patterns. However, fewer studies
have investigated the land–sea breeze regime using land
and offshore in situ observations (Hawkins 1977; Sheng
et al. 2009) or with radar data. In particular, few clima-
tology studies exist that document the SBC and land-
breeze circulation (LBC) cycle along the north-central
Corresponding author address: Christopher M. Hill, Northern
Gulf Institute, Bldg. 1103, Rm. 108, Mississippi State University,
Stennis Space Center, MS 39529.
E-mail: [email protected]
DECEMBER 2010 H I L L ET AL . 1755
DOI: 10.1175/2010WAF2222340.1
� 2010 American Meteorological Society
coast of theGulf ofMexico (hereafter NCGC) using such
a network. Regional lightning studies present 24-h (Reap
1994) and annual (Steiger and Orville 2003) flash data
along the NCGC (which serve as a surrogate for convec-
tion) but do not convey the daily precipitation cycles. This
paper documents monthly wind and precipitation patterns
in this region associated with the SBC and LBC using in-
land and offshore in situ data supplemented by radar data.
The cause of the monthly precipitation variations is also
postulated from wind and thermodynamic data.
During the summertime, the semipermanent Bermuda
high anticyclone over the western Atlantic Ocean trans-
ports warm, moist air from over the Gulf of Mexico
throughout the southeasternUnited States.With a moist,
unstable air mass in place, an SBF encounters dynamic
perturbations of the boundary layer, such as horizontal
convective rolls, thunderstorm outflow boundaries, or
small lake or river breezes; unstable air parcels are
mechanically lifted; and convective cells are initiated
(Fovell 2005; Case et al. 2005;Wakimoto andAtkins 1994;
Atkins et al. 1995). Hence, the NCGC observes frequent
thunderstorm activity during the summer. The position
and orientation of an SBFwill determine the placement of
the associated convective cells, and the cells will generally
propagate with the SBF. In turn, the placement and ori-
entation of the SBF along theNCGCcan be dependent on
the direction of the prevailing, lower-tropospheric flow
(Medlin and Croft 1998; Smith et al. 2005; Lu et al. 2006).
The presence of the prevailing southerly (northerly) flow
typically leads to greater (less) inland migration of the
SBF and therefore greater (less) areal coverage of con-
vection along theNCGC.Conversely, a stronger (weaker)
SBC exists within prevailing northerly (southerly) flow.
An LBC is observed during the nighttime and within a
few hours after dawn. The cross-shore temperature gra-
dient associated with the LBC is less than that associated
with the SBC; hence, the LBC is weaker. As with the
SBC, convection can be observed with convergent flow
within an LBC; the convection within an LBC is primarily
situated over water (Neumann 1951; McPherson 1970).
Given the right-angular configuration of the Louisiana–
Mississippi coastline, the consequent orientation of cross-
shore temperature gradients along the coast, and the
nighttime decoupling of boundary layer flow over land
from the prevailing synoptic wind, a significant land-
breeze front (LBF)may emerge from theMississippi coast
and converge with surface-level synoptic flow over the
Mississippi–Alabama Shelf region of the Gulf of Mexico,
resulting in the development of clustered convection along
the LBF. The orthogonal convergence of the Mississippi
LBF with another LBF over eastern Louisiana is an al-
ternative mechanism by which clustered convection may
develop.
This paper is the result of data analysis spanning three
years that depicts the summertime SBC and LBC, and
associated convective precipitation, over coastal areas of
Mississippi and Louisiana. One purpose of this study is to
assess the monthly climatology of the timing and place-
ment of convective precipitation events induced by sea
and land breezes in the NCGC region. Another goal is to
ascertain the reasons that these monthly differences exist.
Both objectives are pursued using graphical analysis and
statistical significance tests of rain coverage, wind pat-
terns, and thermodynamic parameters. Since the skill of
the operational models in predicting the timing and loca-
tion of sea–land-breeze convection is low (Case et al.
2002), a secondary intent is to provide local forecasters,
who must still rely solely on current observations and
nowcasting, guidance from radar pattern recognition and
sounding variables. Both goals are assisted with monthly
radar composites andmultiple-regression analysis. Section
2 details the methodology used in this study. Section 3
presents the results of the study. Section 4 provides a dis-
cussion of the results and our conclusions.
2. Methodology
Hourly observations of wind direction, wind speed,
pressure, temperature, and dewpoint temperature are
examined from 21 surface stations and 6 buoys in the
region of interest, as are 12-h observations of wind, tem-
perature, and dewpoint temperature from the Slidell,
Louisiana (KLIX), rawinsonde station (see Fig. 1 and
Table 2), for June, July, and August (JJA) of 2003–05.
Additionally, the following parameters were derived
from the rawinsonde observations: convective available
potential energy (CAPE), K index (KI), and precipitable
water (PW) integrated between 1000 and 300 hPa. The
surface stations selected are National Weather Service
TABLE 1. Key acronyms and abbreviations used in the article.
Acronym Expansion
AL Alabama
APC Areal precipitation coverage
CAPE Convective available potential energy
CDT Central daylight time (UTC 2 5 h)
KI K index
LA Louisiana
LBC Land-breeze circulation
MS Mississippi
NCGC North-central Gulf of Mexico
NWS National Weather Service
PW Precipitable water
RAWS Remote Automated Weather Stations
SBC Sea-breeze circulation
SBF Sea-breeze front
SLB Sea and/or land breeze
1756 WEATHER AND FORECAST ING VOLUME 25
(NWS) synoptic stations; U.S. Department of Agriculture
(USDA) operated Remote Automated Weather Stations
(RAWS); moored and Coastal-Marine Automated Net-
work (C-MAN) buoys from the National Data Buoy
Center, Louisiana State University, and the University
of Southern Mississippi; and U.S. Geological Survey
(USGS) tide gauges. It is worth noting that these plat-
forms use slightly different wind-averaging procedures,
with the anemometer located at somewhat different
heights. The following wind-averaging and observation
heights were noted: NWS stations, 1 min at 10 m; RAWS,
10 min at 6 m; moored buoys, 8 min at 5 m; the Dauphin
Island, AlabamaC-MANbuoy (DPIA1), 2 min at 13.5 m;
and USGS stations, instantaneous (no averaging) at
5–6 m.
The frequency and distribution of convective pre-
cipitation are examined with the level-III long-range
base reflectivity product from the Weather Surveillance
Radar-1988 Doppler (WSR-88D) station based in KLIX,
the primary radar site for southern Mississippi, eastern
Louisiana, and the adjacent waters. The level-III WSR-
88D data were obtained from the National Climatic Data
Center.
Surface observations and WSR-88D data were quali-
tatively examined to narrow the focus of the JJA 2003–05
study period to those days on which an SBC or LBC is
likely to be present. Days were initially selected in which
synoptic charts indicated an environment favorable
for a SBC or LBC, such as a surface anticyclone posi-
tioned over the southeastern United States, resulting
in a first set of ‘‘minimally synoptic’’ days. Wind speed
values at 1200 UTC [0700 central daylight time (CDT),
where CDT 5 UTC 2 5 h] from the Slidell observing
station (KASD) were observed to be less than 3.4 m s21
(7.5 mi h21) for each of the initially selected days, en-
suring minimal synoptic influence. From an extensive
review of the level-III long-range reflectivity product
from KLIX, days were removed in which an organized
precipitation event or widespread airmass thunderstorm
activity potentially obscures the signals of the SBC or
LBC influence in the reflectivity pattern. Application
of aforementioned conditions reduces the study period
to 102 ‘‘sea- and/or land-breeze’’ (SLB) days, and im-
proves the probability that corresponding diurnal sig-
nals of wind and precipitation indicate the presence of
an SBC or LBC.
a. Surface and upper-air analysis
A monthly climatology is constructed from surface
and rawinsonde data for the SLB days during 2003–05.
Surface observations of temperature, wind speed, and
wind direction are averaged at each hour, and the ra-
winsonde data are averaged every 12 h. The average
hourly wind direction is obtained by
WD(t)5 tan�1(u/y)1 y, 0, u$ 0 : 360y$ 0, 180
� �;
u5 n�1�n
u(t)k k
y5 n�1�n
y(t)k k,(1)
where t represents the hour of day and n represents the
total number of SLB observations for time t. By normal-
izing the u and y components in each SLB observation of
wind, a speed bias of the averagewind direction is avoided.
To examine the variation of T (as a proxy for density),
average hourly temperature gradients ($T) are computed
for two cross-shore segments along the NCGC from the
following station pairs: 1) Gulfport–Biloxi International
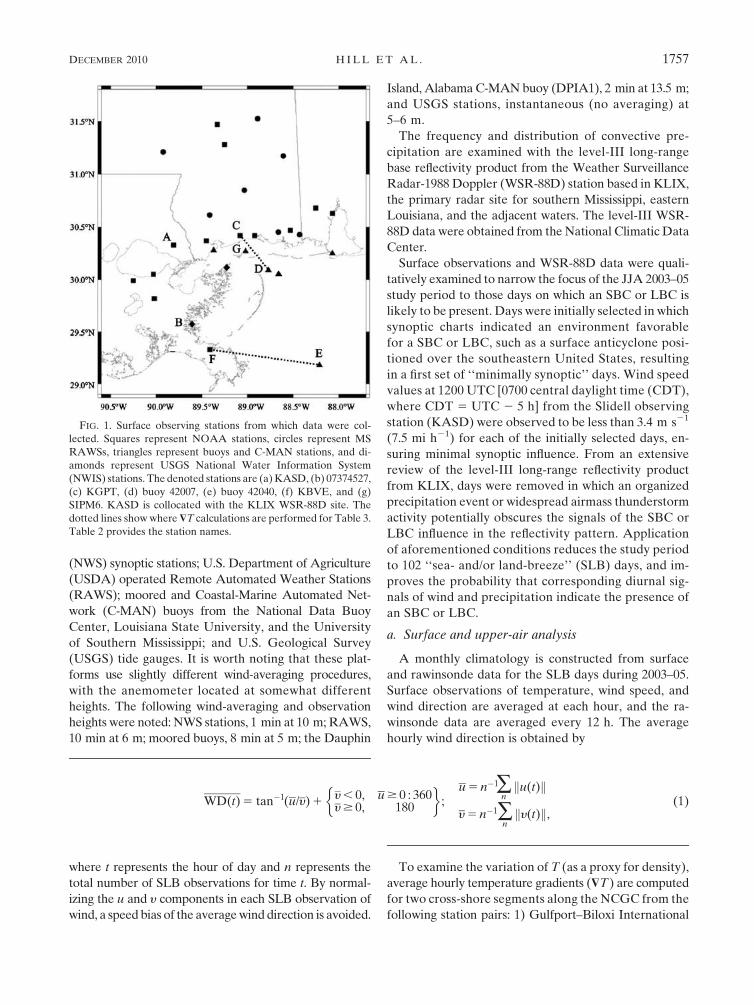
FIG. 1. Surface observing stations from which data were col-
lected. Squares represent NOAA stations, circles represent MS
RAWSs, triangles represent buoys and C-MAN stations, and di-
amonds represent USGS National Water Information System
(NWIS) stations. The denoted stations are (a)KASD, (b) 07374527,
(c) KGPT, (d) buoy 42007, (e) buoy 42040, (f) KBVE, and (g)
SIPM6. KASD is collocated with the KLIX WSR-88D site. The
dotted lines showwhere $T calculations are performed for Table 3.
Table 2 provides the station names.
DECEMBER 2010 H I L L ET AL . 1757
Airport (KGPT) to buoy 42007 and 2) Boothville,
Louisiana (KBVE), to buoy 42040 (see dashed lines in
Fig. 1). These four stations have a denser observation
history relative to other stations in the study region
(Table 2). With KGPT situated on the mainland, and
buoy 42007 situated relatively near the coastline, these
two stations constitute the best available station pair for
examining the daily evolution of surface $T on SLB days
for the NCGC region. The station pair of KBVE and
buoy 42040 is the best available pair for assessing the $Ttrend with any west–east-oriented SBC or LBC along the
southeastern Louisiana coast. Trends of $T between
KGPT and 42007, and between KBVE and 42040, are
compared against wind trends during case study days.
Additionally, the diurnal trend of $T averaged for SLB
days is compared against $T averaged for all days during
JJA 2003–05.
b. Radar analysis
The base reflectivity product of the KLIX WSR-88D
at the lowest scan angle (approximately 0.58) is used to
calculate an accumulated tabulation of 4-h rain-indicative
pixels with reflectivity $30 dBZ within a circular area
covered by the radar. A reflectivity value of 30 dBZ is
used as a threshold for convective precipitation, consistent
with Wilson and Megenhardt (1997). An examination of
radar images showed a decrease in detection of 30-dBZ
values beyond 240 km. At 240 km, the radar beam height
is approximately 5 km, and continues to increase in
altitude away fromKLIXwith the curvature of the earth.
Refraction and attenuation may also slightly impact the
reflectivity values. Therefore, the circular area of interest
is constrained with a radius of 240 km (150 mi). These
accumulated tabulated values are plotted for each 4-h
period of JJA to show the diurnal rainfall evolution for
each month.
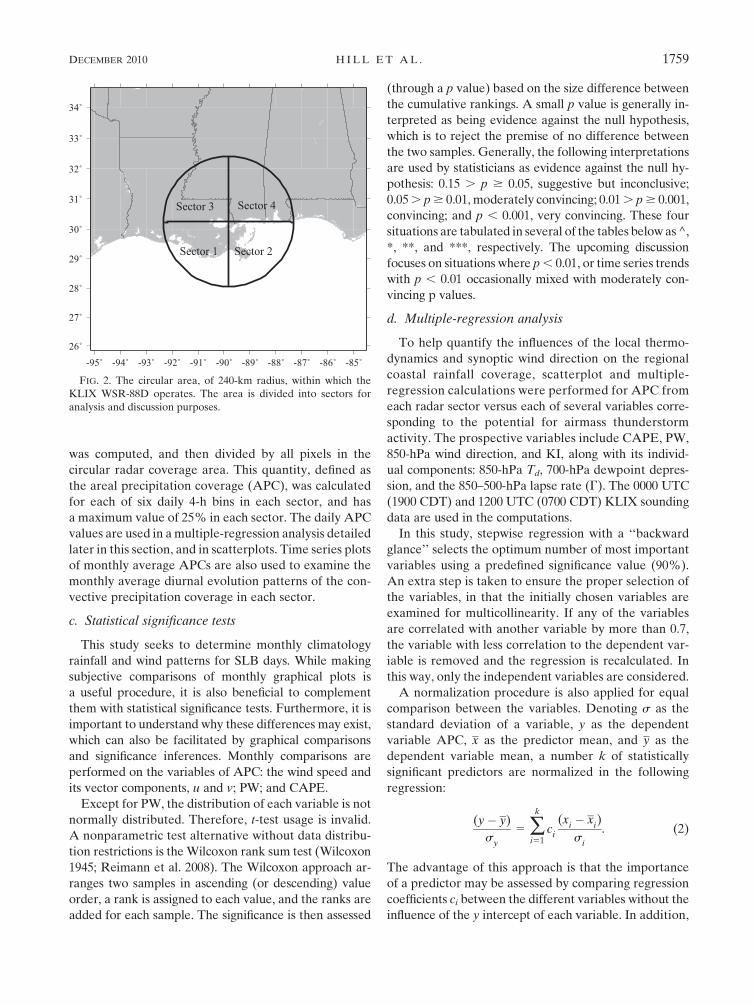
The circular radar region is divided into four quad-
rants, or sectors, to allow for a more geographically
specific analysis (Fig. 2). Sector 1 covers much of coastal
Louisiana and the adjacent waters of theGulf ofMexico.
Sector 2 includes the Chandeleur and Breton Sounds, as
well as theMississippi–Alabama shelf region of the Gulf
of Mexico, which is enclosed by the barrier islands of
Louisiana, Mississippi, and Alabama. Sector 3 primarily
covers inland portions of eastern Louisiana and south-
western Mississippi, including the alluvial soil regions
along the Mississippi River. Sector 4 primarily covers
southeastern Mississippi and southwestern Alabama.
To quantify the rainfall coverage in each sector, the
number of reflectivity pixels.30 dBZ over a 4-h period
TABLE 2. Land-based (NOAA, RAWS, USGS) and water-based stations from which observations were collected for JJA 2003–05. The
last column lists the total percentage of possible hourly observations recorded during the SLB period at each observing station.
Station ID Station name Lat, lon Possible SLB observations (%)
KBFM Mobile Downtown Airport, AL 30.638N, 88.078W 91.1
KMOB Mobile Regional Airport, AL 30.688N, 88.258W 92.7
KPQL Pascagoula/Lott International Airport, MS 30.478N, 88.538W 58.3
KBIX Biloxi/Keesler AFB, MS 30.428N, 88.928W 69.8
KGPT Gulfport–Biloxi International Airport, MS 30.428N, 89.088W 91.2
KHBG Hattiesburg/Chain Municipal Airport, MS 31.288N, 89.258W 78.9
KPIB Laurel/Hattiesburg Pine Belt, MS 31.478N, 89.338W 96.0
KHSA Bay St. Louis/Stennis International Airport, MS 30.378N, 89.458W 29.6
KBVE Boothville, LA 29.338N, 89.418W 99.1
KASD Slidell Airport, LA 30.358N, 89.828W 87.9
KNEW New Orleans Lakefront Airport, LA 30.058N, 90.038W 97.7
KNBG New Orleans/Alvin Callender Field NAS, LA 29.828N, 90.028W 57.6
KMSY New Orleans International Airport, LA 29.998N, 90.258W 99.1
NS234 Grand Bay, Jackson County, MS 30.438N, 88.438W 64.3
LKKM6 Greene County, MS 31.178N, 88.618W 66.9
SHCM6 Mississippi Sandhill Crane, Jackson County, MS 30.438N, 88.668W 97.3
LSUM6 Wausau, Wayne County, MS 31.528N, 88.898W 65.0
BLCM6 Black Creek, Stone County, MS 30.858N, 89.038W 97.5
RMAM6 Marion County, MS 31.218N, 89.928W 98.9
07374527 Northeast Bay Gardene, LA (USGS) 29.598N, 89.618W 79.8
3007220891501 Mississippi Sound at Grand Pass, LA (USGS) 30.128N, 89.258W 72.1
DPIA1 Dauphin Island 30.258N, 88.078W 99.8
42040 119 km S of Dauphin Island 29.188N, 88.218W 92.0
42067 USM3M01 (USM) 30.048N, 88.658W 31.8
42007 40 km SSE of Biloxi 30.098N, 88.778W 97.9
SIPM6 Ship Island Pass (LSU) 30.278N, 89.028W 5.8
WAVM6 Waveland (NOS) 30.288N, 89.378W 26.3
1758 WEATHER AND FORECAST ING VOLUME 25
was computed, and then divided by all pixels in the
circular radar coverage area. This quantity, defined as
the areal precipitation coverage (APC), was calculated
for each of six daily 4-h bins in each sector, and has
a maximum value of 25% in each sector. The daily APC
values are used in amultiple-regression analysis detailed
later in this section, and in scatterplots. Time series plots
of monthly average APCs are also used to examine the
monthly average diurnal evolution patterns of the con-
vective precipitation coverage in each sector.
c. Statistical significance tests
This study seeks to determine monthly climatology
rainfall and wind patterns for SLB days. While making
subjective comparisons of monthly graphical plots is
a useful procedure, it is also beneficial to complement
them with statistical significance tests. Furthermore, it is
important to understand why these differences may exist,
which can also be facilitated by graphical comparisons
and significance inferences. Monthly comparisons are
performed on the variables of APC: the wind speed and
its vector components, u and v; PW; and CAPE.
Except for PW, the distribution of each variable is not
normally distributed. Therefore, t-test usage is invalid.
A nonparametric test alternative without data distribu-
tion restrictions is theWilcoxon rank sum test (Wilcoxon
1945; Reimann et al. 2008). The Wilcoxon approach ar-
ranges two samples in ascending (or descending) value
order, a rank is assigned to each value, and the ranks are
added for each sample. The significance is then assessed
(through a p value) based on the size difference between
the cumulative rankings. A small p value is generally in-
terpreted as being evidence against the null hypothesis,
which is to reject the premise of no difference between
the two samples. Generally, the following interpretations
are used by statisticians as evidence against the null hy-
pothesis: 0.15 . p $ 0.05, suggestive but inconclusive;
0.05. p$ 0.01, moderately convincing; 0.01. p$ 0.001,
convincing; and p , 0.001, very convincing. These four
situations are tabulated in several of the tables below as ^,
*, **, and ***, respectively. The upcoming discussion
focuses on situations where p, 0.01, or time series trends
with p , 0.01 occasionally mixed with moderately con-
vincing p values.
d. Multiple-regression analysis
To help quantify the influences of the local thermo-
dynamics and synoptic wind direction on the regional
coastal rainfall coverage, scatterplot and multiple-
regression calculations were performed for APC from
each radar sector versus each of several variables corre-
sponding to the potential for airmass thunderstorm
activity. The prospective variables include CAPE, PW,
850-hPa wind direction, and KI, along with its individ-
ual components: 850-hPa Td, 700-hPa dewpoint depres-
sion, and the 850–500-hPa lapse rate (G). The 0000 UTC
(1900 CDT) and 1200 UTC (0700 CDT) KLIX sounding
data are used in the computations.
In this study, stepwise regression with a ‘‘backward
glance’’ selects the optimum number of most important
variables using a predefined significance value (90%).
An extra step is taken to ensure the proper selection of
the variables, in that the initially chosen variables are
examined for multicollinearity. If any of the variables
are correlated with another variable by more than 0.7,
the variable with less correlation to the dependent var-
iable is removed and the regression is recalculated. In
this way, only the independent variables are considered.
A normalization procedure is also applied for equal
comparison between the variables. Denoting s as the
standard deviation of a variable, y as the dependent
variable APC, x as the predictor mean, and y as the
dependent variable mean, a number k of statistically
significant predictors are normalized in the following
regression:
(y� y)
sy
5�k
i51ci
(xi� x
i)
si
. (2)
The advantage of this approach is that the importance
of a predictor may be assessed by comparing regression
coefficients ci between the different variables without the
influence of the y intercept of each variable. In addition,
FIG. 2. The circular area, of 240-km radius, within which the
KLIX WSR-88D operates. The area is divided into sectors for
analysis and discussion purposes.
DECEMBER 2010 H I L L ET AL . 1759
ximay be interpreted (to a first approximation) as a
‘‘threshold’’ value that distinguishes between the positive
(negative) contributions of a predictor for ci . 0 (ci , 0).
3. Results
a. Wind speed and direction
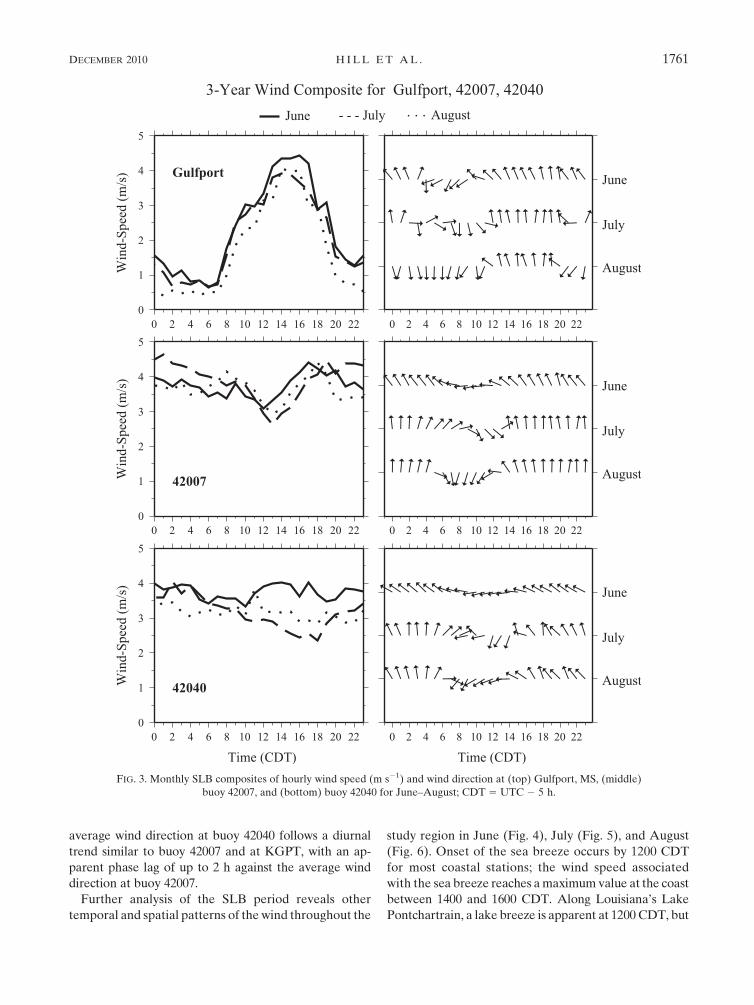
A distinct diurnal trend of the wind can be discerned
for SLB days over the area of interest, with some vari-
ation by month. In June, the wind at KGPT (represen-
tative of the Mississippi coast) veers throughout an
average SLB day, being primarily northerly during the
predawn hours and primarily from the south or south-
east during the afternoon (Fig. 3). The wind speed at
KGPT abruptly increases (decreases) soon after local
sunrise (sunset). At buoy 42007, the average wind is
primarily southeast, but it is more easterly and slower
during the latemorning. The average southeasterly wind
at buoy 42040 becomes more easterly in sequence with
buoy 42007, yet the wind speed at buoy 42040 is relatively
steady throughout an average day, measuring between
3.4 and 4.0 m s21. During the afternoon, the winds at the
coast and over the adjacent waters turn more southerly
and southeasterly, respectively, indicating the influence
of an SBC.
In July, general southerly flow replaces the easterly–
southeasterly wind regime of June. Significance tests for
zonal wind differences between June and July (Table 3)
consistently range from moderately convincing to con-
vincing for buoys 42007 and 42040 throughout the day,
aswell as from0900 to 1800CDTatKGPT. The frequent,
nocturnal calm wind at KGPT from 0100 to 0800 CDT
makes the significance tests difficult to apply (see Table 2
caption for more details). In addition, the average SLB
day in July shows a more discrete transition from LBC
to SBC. Convergence is noted between KGPT and buoy
42007 from 0200 to 0900 CDT. It is during this time that
the average wind at both stations acquires a westerly
component, which may indicate the presence of an LBC
along the eastern Louisiana coast. As the wind speed
increases at KGPT, the wind decreases and shifts to a
more northerly direction at buoy 42007 from 0900 to
1200 CDT. At buoy 42040, a similar northerly wind shift
takes place during 1200 to 1400 CDT. The northerly
direction of the wind at buoys 42007 and 42040 suggests
the influence of an LBC along theMississippi coast, but
corresponding p values are still high. The southerly
redirection of the wind at KGPT by 1200 CDT indicates
the beginning of an SBC. A cross-shore expansion of
the SBC is indicated by a southerly wind turn at buoy
42007 by 1400 CDT, and at buoy 42040 by 1500 CDT.
During the period of peak wind speed at KGPT (from
1200 to 1600 CDT), the wind speed at 42007 increases
from a local minimum toward a maximum at 1800 CDT.
Meanwhile, the wind speed at 42040 reaches a local
minimum, which contrasts with the more steady wind
speed in June; this difference is statistically significant
from 1300 to 1800 CDT.
In August, the most prominent feature is a stronger
LBC. Offshore winds occur at KGPT from 2000 to
1100 CDT, at 42007 from 0500 to 1200 CDT, and at 42040
from 0700 to 1200 CDT. The onset of the LBC offshore is
2–4 h earlier than in July. The LBC differences between
July and August are significantly different for meridional
winds at KGPT and 42007, as well as between June and
August. As in July, the August predominant flow is
southerly (note the statistically significant difference be-
tween June and August for zonal wind), and the winds at
buoys 42007 and 42040 exhibit a veering pattern, with
a persistent speed of 3–4 m s21 at buoy 42040. The wind
has a westerly component from 0400 to 0700 CDT,
and turns more northerly thereafter, in association with
the LBC. The sea breeze begins at KGPT at about
1200CDT, and the associated SBC spreads to buoy 42007
by about 1400 CDT. The wind at buoy 42040 turns more
southerly later in the afternoon, and is stronger than in
July, with hints of statistical significance.
It is worth noting that the inertial period, l, for the
region of study, defined by
l5t
2; t5
2p
V sinu, (3)
is approximately 24 h, where t is the pendulum day, V 5
7.292 3 1025 s21, and f ’ 308N. Buoys 42007 and 42040
both show a clockwise turn in July and August, which
suggests inertial forcing contributes to the evolution of
these wind fields (e.g., Rotunno 1983). Synoptic forcing
may be overwhelming the influence of inertial forcing
during the month of June. However, it is difficult to quan-
tify the role of inertial forcing relative to the contribution
of the evolving $T patterns and large-scale conditions,
and so this topic will require additional future research.
For all months, the average diurnal trend of the wind
speed at buoy 42007 has a phase lag of approximately
5–6 h compared to the wind speed trend at KGPT. The
average wind speed at buoy 42007 reaches a relative
maximum at about 0800 or 0900 CDT, a minimum at
about 1200 or 1300 CDT, and then another relative
maximum between 1700 and 1900 CDT. The wind speed
minimum at 42007 precedes the speed maximum at
KGPT by about 2 h as 42007 observes a transition to
more southerly flow. The average wind speed at buoy
42040measures no less than 2.2 m s21 and varies nomore
than 1.3 m s21 during an average SLB day. However, the
1760 WEATHER AND FORECAST ING VOLUME 25
average wind direction at buoy 42040 follows a diurnal
trend similar to buoy 42007 and at KGPT, with an ap-
parent phase lag of up to 2 h against the average wind
direction at buoy 42007.
Further analysis of the SLB period reveals other
temporal and spatial patterns of the wind throughout the
study region in June (Fig. 4), July (Fig. 5), and August
(Fig. 6). Onset of the sea breeze occurs by 1200 CDT
for most coastal stations; the wind speed associated
with the sea breeze reaches amaximumvalue at the coast
between 1400 and 1600 CDT. Along Louisiana’s Lake
Pontchartrain, a lake breeze is apparent at 1200 CDT, but
FIG. 3. Monthly SLB composites of hourly wind speed (m s21) and wind direction at (top) Gulfport, MS, (middle)
buoy 42007, and (bottom) buoy 42040 for June–August; CDT 5 UTC 2 5 h.
DECEMBER 2010 H I L L ET AL . 1761
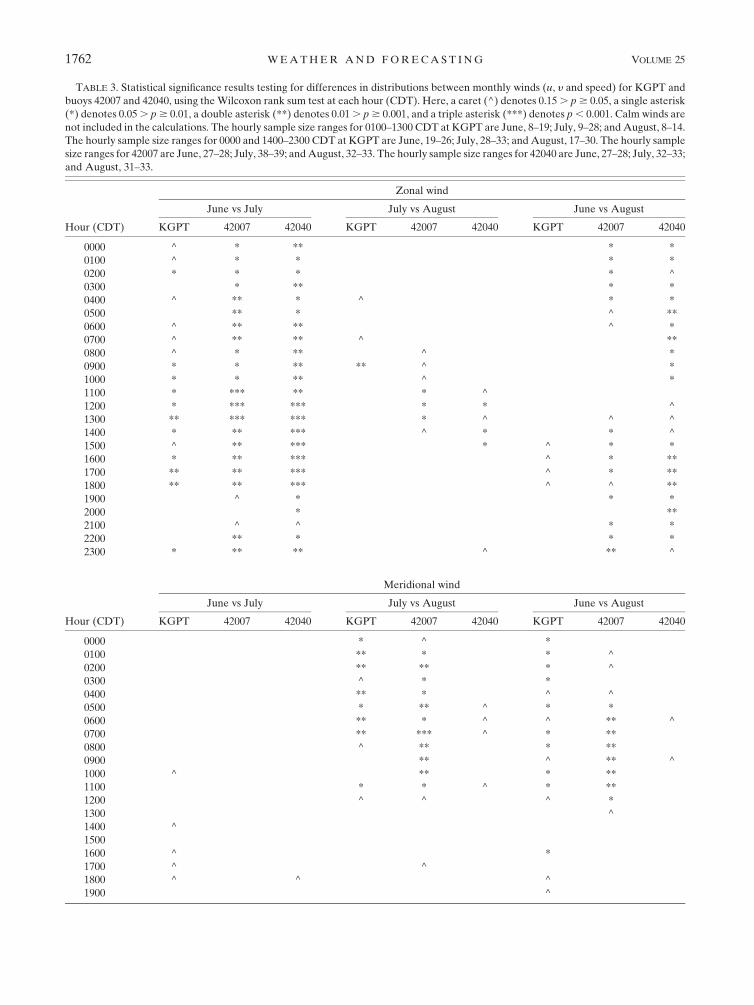
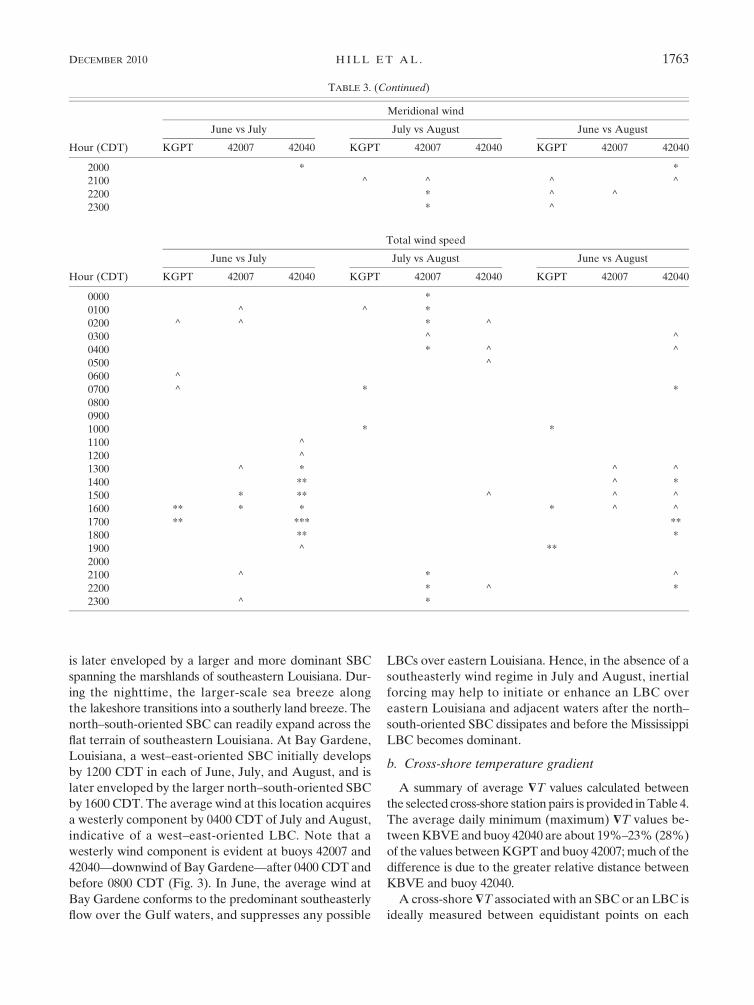
TABLE 3. Statistical significance results testing for differences in distributions between monthly winds (u, y and speed) for KGPT and
buoys 42007 and 42040, using theWilcoxon rank sum test at each hour (CDT). Here, a caret (^) denotes 0.15. p$ 0.05, a single asterisk
(*) denotes 0.05. p$ 0.01, a double asterisk (**) denotes 0.01. p$ 0.001, and a triple asterisk (***) denotes p, 0.001. Calm winds are
not included in the calculations. The hourly sample size ranges for 0100–1300 CDT at KGPT are June, 8–19; July, 9–28; and August, 8–14.
The hourly sample size ranges for 0000 and 1400–2300 CDT at KGPT are June, 19–26; July, 28–33; and August, 17–30. The hourly sample
size ranges for 42007 are June, 27–28; July, 38–39; andAugust, 32–33. The hourly sample size ranges for 42040 are June, 27–28; July, 32–33;
and August, 31–33.
Zonal wind
June vs July July vs August June vs August
Hour (CDT) KGPT 42007 42040 KGPT 42007 42040 KGPT 42007 42040
0000 ^ * ** * *
0100 ^ * * * *
0200 * * * * ^
0300 * ** * *
0400 ^ ** * ^ * *
0500 ** * ^ **
0600 ^ ** ** ^ *
0700 ^ ** ** ^ **
0800 ^ * ** ^ *
0900 * * ** ** ^ *
1000 * * ** ^ *
1100 * *** ** * ^
1200 * *** *** * * ^
1300 ** *** *** * ^ ^ ^
1400 * ** *** ^ * * ^
1500 ^ ** *** * ^ * *
1600 * ** *** ^ * **
1700 ** ** *** ^ * **
1800 ** ** *** ^ ^ **
1900 ^ * * *
2000 * **
2100 ^ ^ * *
2200 ** * * *
2300 * ** ** ^ ** ^
Meridional wind
June vs July July vs August June vs August
Hour (CDT) KGPT 42007 42040 KGPT 42007 42040 KGPT 42007 42040
0000 * ^ *
0100 ** * * ^
0200 ** ** * ^
0300 ^ * *
0400 ** * ^ ^
0500 * ** ^ * *
0600 ** * ^ ^ ** ^
0700 ** *** ^ * **
0800 ^ ** * **
0900 ** ^ ** ^
1000 ^ ** * **
1100 * * ^ * **
1200 ^ ^ ^ *
1300 ^
1400 ^
1500
1600 ^ *
1700 ^ ^
1800 ^ ^ ^
1900 ^
1762 WEATHER AND FORECAST ING VOLUME 25
is later enveloped by a larger and more dominant SBC
spanning the marshlands of southeastern Louisiana. Dur-
ing the nighttime, the larger-scale sea breeze along
the lakeshore transitions into a southerly land breeze. The
north–south-oriented SBC can readily expand across the
flat terrain of southeastern Louisiana. At Bay Gardene,
Louisiana, a west–east-oriented SBC initially develops
by 1200 CDT in each of June, July, and August, and is
later enveloped by the larger north–south-oriented SBC
by 1600 CDT. The average wind at this location acquires
a westerly component by 0400 CDT of July and August,
indicative of a west–east-oriented LBC. Note that a
westerly wind component is evident at buoys 42007 and
42040—downwind of BayGardene—after 0400 CDT and
before 0800 CDT (Fig. 3). In June, the average wind at
Bay Gardene conforms to the predominant southeasterly
flow over the Gulf waters, and suppresses any possible
LBCs over eastern Louisiana. Hence, in the absence of a
southeasterly wind regime in July and August, inertial
forcing may help to initiate or enhance an LBC over
eastern Louisiana and adjacent waters after the north–
south-oriented SBC dissipates and before the Mississippi
LBC becomes dominant.
b. Cross-shore temperature gradient
A summary of average $T values calculated between
the selected cross-shore station pairs is provided inTable 4.
The average daily minimum (maximum) $T values be-
tweenKBVEand buoy 42040 are about 19%–23% (28%)
of the values betweenKGPT and buoy 42007; much of the
difference is due to the greater relative distance between
KBVE and buoy 42040.
A cross-shore$T associated with an SBC or an LBC is
ideally measured between equidistant points on each
TABLE 3. (Continued)
Meridional wind
June vs July July vs August June vs August
Hour (CDT) KGPT 42007 42040 KGPT 42007 42040 KGPT 42007 42040
2000 * *
2100 ^ ^ ^ ^
2200 * ^ ^
2300 * ^
Total wind speed
June vs July July vs August June vs August
Hour (CDT) KGPT 42007 42040 KGPT 42007 42040 KGPT 42007 42040
0000 *
0100 ^ ^ *
0200 ^ ^ * ^
0300 ^ ^
0400 * ^ ^
0500 ^
0600 ^
0700 ^ * *
0800
0900
1000 * *
1100 ^
1200 ^
1300 ^ * ^ ^
1400 ** ^ *
1500 * ** ^ ^ ^
1600 ** * * * ^ ^
1700 ** *** **
1800 ** *
1900 ^ **
2000
2100 ^ * ^
2200 * ^ *
2300 ^ *
DECEMBER 2010 H I L L ET AL . 1763
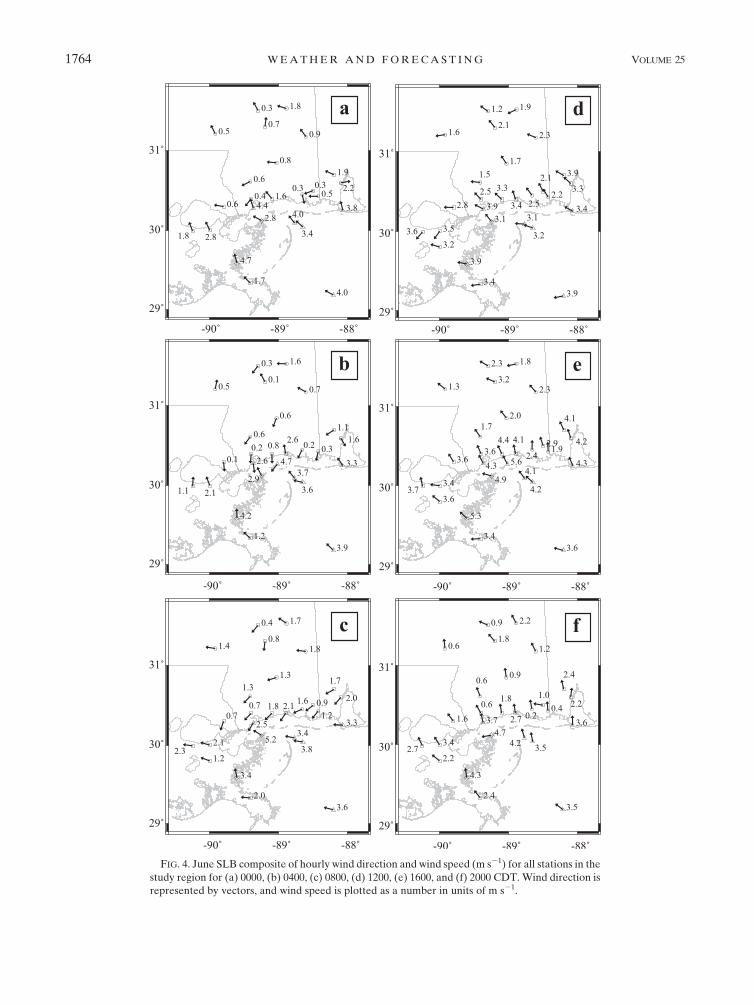
FIG. 4. June SLB composite of hourly wind direction and wind speed (m s21) for all stations in the
study region for (a) 0000, (b) 0400, (c) 0800, (d) 1200, (e) 1600, and (f) 2000 CDT. Wind direction is
represented by vectors, and wind speed is plotted as a number in units of m s21.
1764 WEATHER AND FORECAST ING VOLUME 25
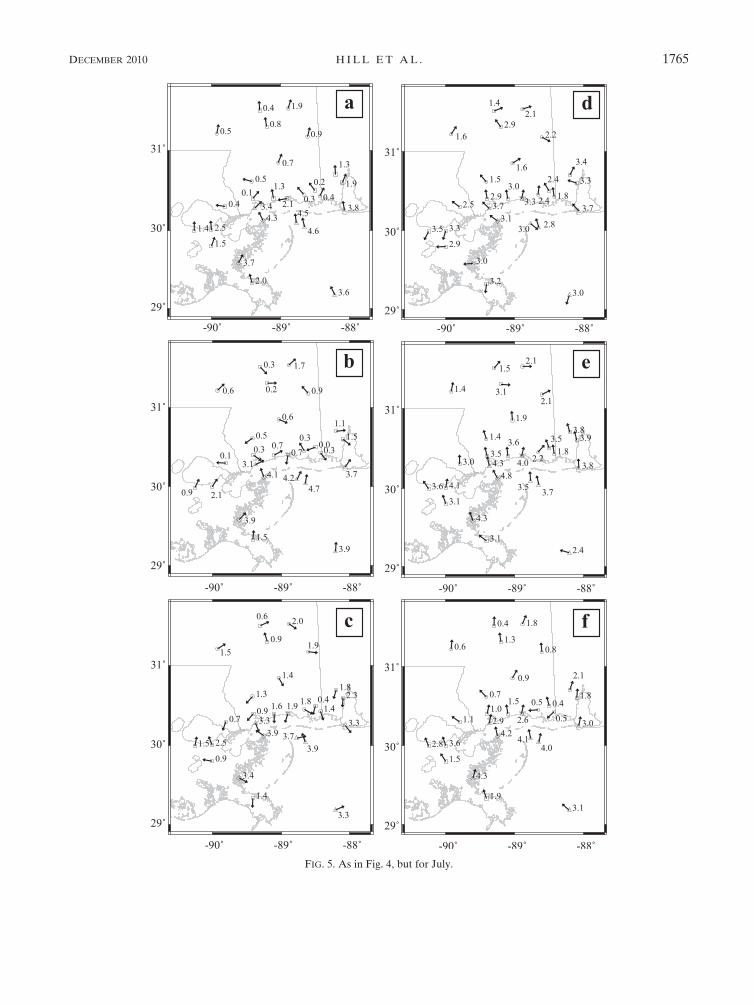
FIG. 5. As in Fig. 4, but for July.
DECEMBER 2010 H I L L ET AL . 1765
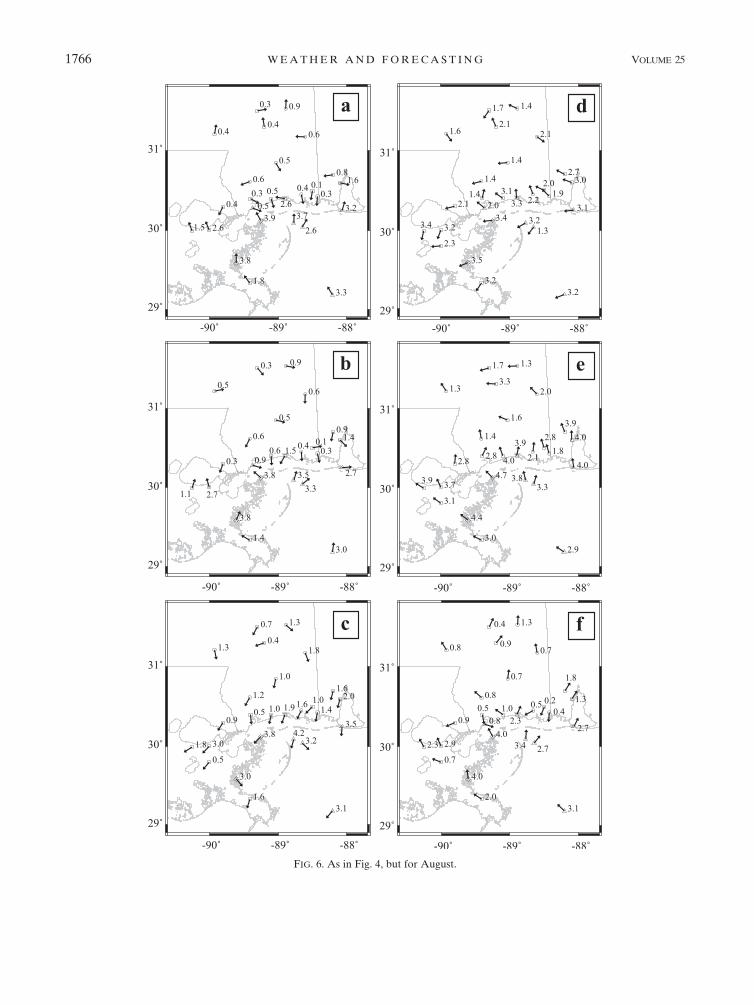
FIG. 6. As in Fig. 4, but for August.
1766 WEATHER AND FORECAST ING VOLUME 25
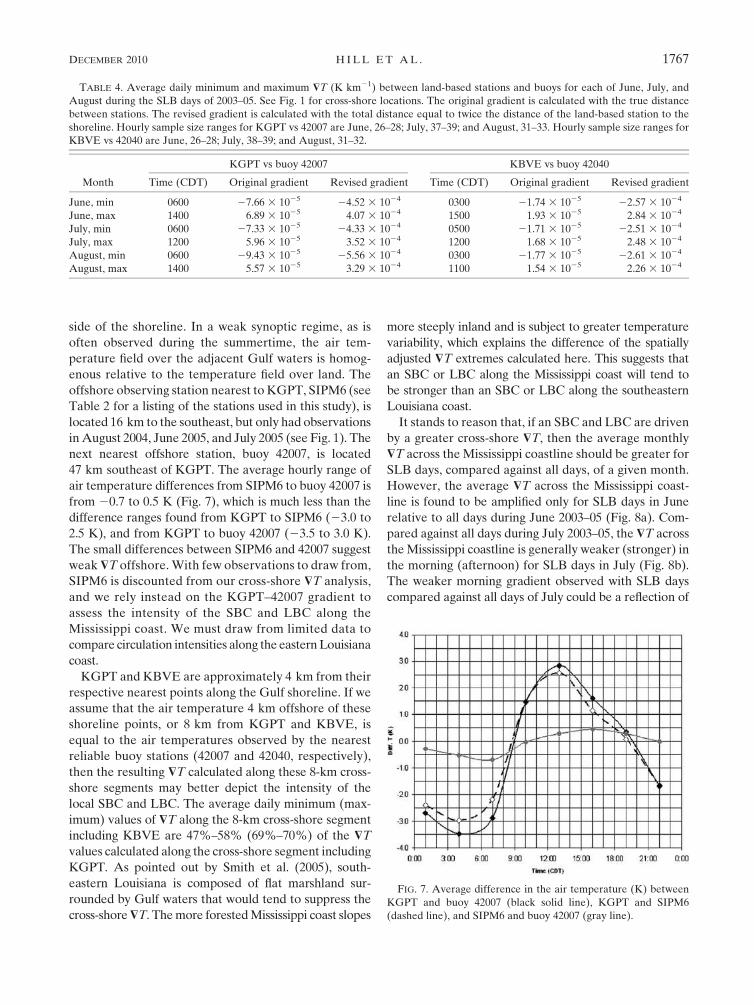
side of the shoreline. In a weak synoptic regime, as is
often observed during the summertime, the air tem-
perature field over the adjacent Gulf waters is homog-
enous relative to the temperature field over land. The
offshore observing station nearest to KGPT, SIPM6 (see
Table 2 for a listing of the stations used in this study), is
located 16 km to the southeast, but only had observations
inAugust 2004, June 2005, and July 2005 (see Fig. 1). The
next nearest offshore station, buoy 42007, is located
47 km southeast of KGPT. The average hourly range of
air temperature differences from SIPM6 to buoy 42007 is
from 20.7 to 0.5 K (Fig. 7), which is much less than the
difference ranges found from KGPT to SIPM6 (23.0 to
2.5 K), and from KGPT to buoy 42007 (23.5 to 3.0 K).
The small differences between SIPM6 and 42007 suggest
weak $T offshore.With few observations to draw from,
SIPM6 is discounted from our cross-shore $T analysis,
and we rely instead on the KGPT–42007 gradient to
assess the intensity of the SBC and LBC along the
Mississippi coast. We must draw from limited data to
compare circulation intensities along the easternLouisiana
coast.
KGPT and KBVE are approximately 4 km from their
respective nearest points along the Gulf shoreline. If we
assume that the air temperature 4 km offshore of these
shoreline points, or 8 km from KGPT and KBVE, is
equal to the air temperatures observed by the nearest
reliable buoy stations (42007 and 42040, respectively),
then the resulting $T calculated along these 8-km cross-
shore segments may better depict the intensity of the
local SBC and LBC. The average daily minimum (max-
imum) values of $T along the 8-km cross-shore segment
including KBVE are 47%–58% (69%–70%) of the $Tvalues calculated along the cross-shore segment including
KGPT. As pointed out by Smith et al. (2005), south-
eastern Louisiana is composed of flat marshland sur-
rounded by Gulf waters that would tend to suppress the
cross-shore$T. Themore forestedMississippi coast slopes
more steeply inland and is subject to greater temperature
variability, which explains the difference of the spatially
adjusted $T extremes calculated here. This suggests that
an SBC or LBC along the Mississippi coast will tend to
be stronger than an SBC or LBC along the southeastern
Louisiana coast.
It stands to reason that, if an SBC and LBC are driven
by a greater cross-shore $T, then the average monthly
$T across the Mississippi coastline should be greater for
SLB days, compared against all days, of a given month.
However, the average $T across the Mississippi coast-
line is found to be amplified only for SLB days in June
relative to all days during June 2003–05 (Fig. 8a). Com-
pared against all days during July 2003–05, the $T across
theMississippi coastline is generally weaker (stronger) in
the morning (afternoon) for SLB days in July (Fig. 8b).
The weaker morning gradient observed with SLB days
compared against all days of July could be a reflection of
TABLE 4. Average daily minimum and maximum $T (K km21) between land-based stations and buoys for each of June, July, and
August during the SLB days of 2003–05. See Fig. 1 for cross-shore locations. The original gradient is calculated with the true distance
between stations. The revised gradient is calculated with the total distance equal to twice the distance of the land-based station to the
shoreline. Hourly sample size ranges for KGPT vs 42007 are June, 26–28; July, 37–39; and August, 31–33. Hourly sample size ranges for
KBVE vs 42040 are June, 26–28; July, 38–39; and August, 31–32.
KGPT vs buoy 42007 KBVE vs buoy 42040
Month Time (CDT) Original gradient Revised gradient Time (CDT) Original gradient Revised gradient
June, min 0600 27.66 3 1025 24.52 3 1024 0300 21.74 3 1025 22.57 3 1024
June, max 1400 6.89 3 1025 4.07 3 1024 1500 1.93 3 1025 2.84 3 1024
July, min 0600 27.33 3 1025 24.33 3 1024 0500 21.71 3 1025 22.51 3 1024
July, max 1200 5.96 3 1025 3.52 3 1024 1200 1.68 3 1025 2.48 3 1024
August, min 0600 29.43 3 1025 25.56 3 1024 0300 21.77 3 1025 22.61 3 1024
August, max 1400 5.57 3 1025 3.29 3 1024 1100 1.54 3 1025 2.26 3 1024
FIG. 7. Average difference in the air temperature (K) between
KGPT and buoy 42007 (black solid line), KGPT and SIPM6
(dashed line), and SIPM6 and buoy 42007 (gray line).
DECEMBER 2010 H I L L ET AL . 1767
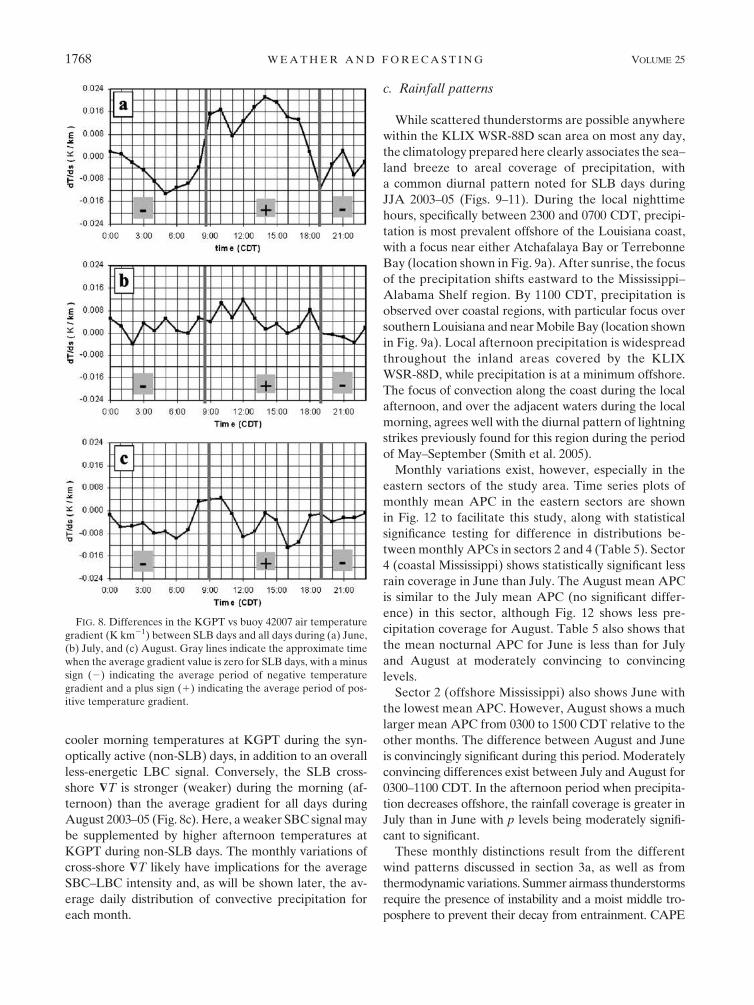
cooler morning temperatures at KGPT during the syn-
optically active (non-SLB) days, in addition to an overall
less-energetic LBC signal. Conversely, the SLB cross-
shore $T is stronger (weaker) during the morning (af-
ternoon) than the average gradient for all days during
August 2003–05 (Fig. 8c). Here, a weaker SBC signalmay
be supplemented by higher afternoon temperatures at
KGPT during non-SLB days. The monthly variations of
cross-shore $T likely have implications for the average
SBC–LBC intensity and, as will be shown later, the av-
erage daily distribution of convective precipitation for
each month.
c. Rainfall patterns
While scattered thunderstorms are possible anywhere
within the KLIX WSR-88D scan area on most any day,
the climatology prepared here clearly associates the sea–
land breeze to areal coverage of precipitation, with
a common diurnal pattern noted for SLB days during
JJA 2003–05 (Figs. 9–11). During the local nighttime
hours, specifically between 2300 and 0700 CDT, precipi-
tation is most prevalent offshore of the Louisiana coast,
with a focus near either Atchafalaya Bay or Terrebonne
Bay (location shown in Fig. 9a). After sunrise, the focus
of the precipitation shifts eastward to the Mississippi–
Alabama Shelf region. By 1100 CDT, precipitation is
observed over coastal regions, with particular focus over
southern Louisiana and nearMobile Bay (location shown
in Fig. 9a). Local afternoon precipitation is widespread
throughout the inland areas covered by the KLIX
WSR-88D, while precipitation is at a minimum offshore.
The focus of convection along the coast during the local
afternoon, and over the adjacent waters during the local
morning, agrees well with the diurnal pattern of lightning
strikes previously found for this region during the period
of May–September (Smith et al. 2005).
Monthly variations exist, however, especially in the
eastern sectors of the study area. Time series plots of
monthly mean APC in the eastern sectors are shown
in Fig. 12 to facilitate this study, along with statistical
significance testing for difference in distributions be-
tweenmonthly APCs in sectors 2 and 4 (Table 5). Sector
4 (coastal Mississippi) shows statistically significant less
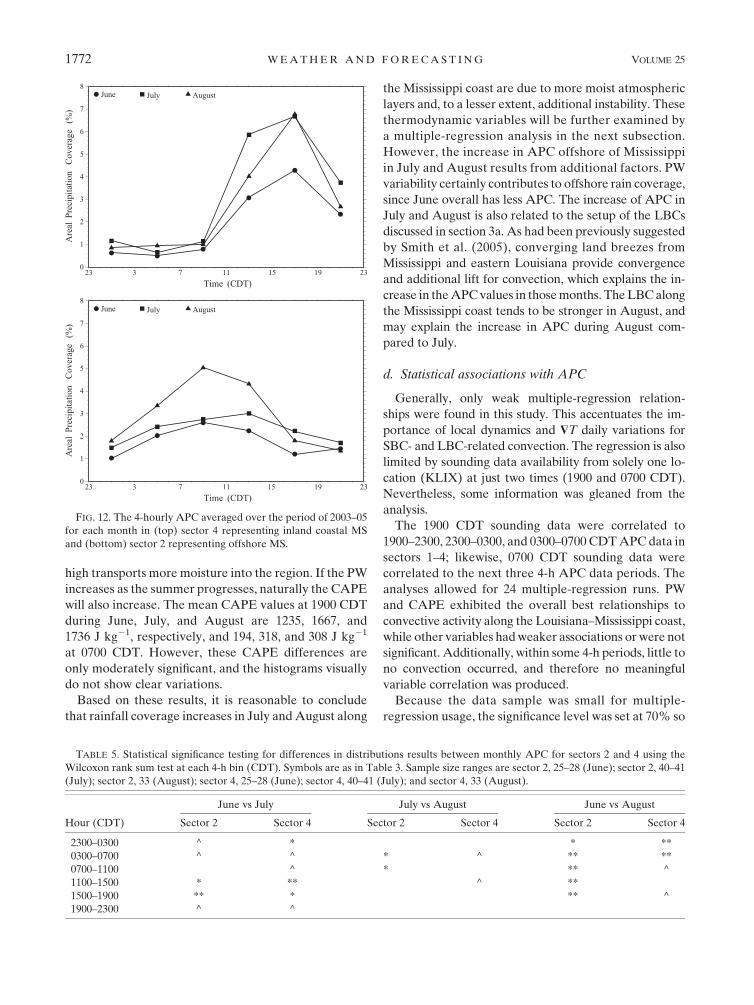
rain coverage in June than July. The August mean APC
is similar to the July mean APC (no significant differ-
ence) in this sector, although Fig. 12 shows less pre-
cipitation coverage for August. Table 5 also shows that
the mean nocturnal APC for June is less than for July
and August at moderately convincing to convincing
levels.
Sector 2 (offshore Mississippi) also shows June with
the lowest mean APC. However, August shows a much
larger mean APC from 0300 to 1500 CDT relative to the
other months. The difference between August and June
is convincingly significant during this period. Moderately
convincing differences exist between July and August for
0300–1100 CDT. In the afternoon period when precipita-
tion decreases offshore, the rainfall coverage is greater in
July than in June with p levels being moderately signifi-
cant to significant.
These monthly distinctions result from the different
wind patterns discussed in section 3a, as well as from
thermodynamic variations. Summer airmass thunderstorms
require the presence of instability and a moist middle tro-
posphere to prevent their decay from entrainment. CAPE
FIG. 8. Differences in the KGPT vs buoy 42007 air temperature
gradient (K km21) between SLB days and all days during (a) June,
(b) July, and (c) August. Gray lines indicate the approximate time
when the average gradient value is zero for SLB days, with a minus
sign (2) indicating the average period of negative temperature
gradient and a plus sign (1) indicating the average period of pos-
itive temperature gradient.
1768 WEATHER AND FORECAST ING VOLUME 25
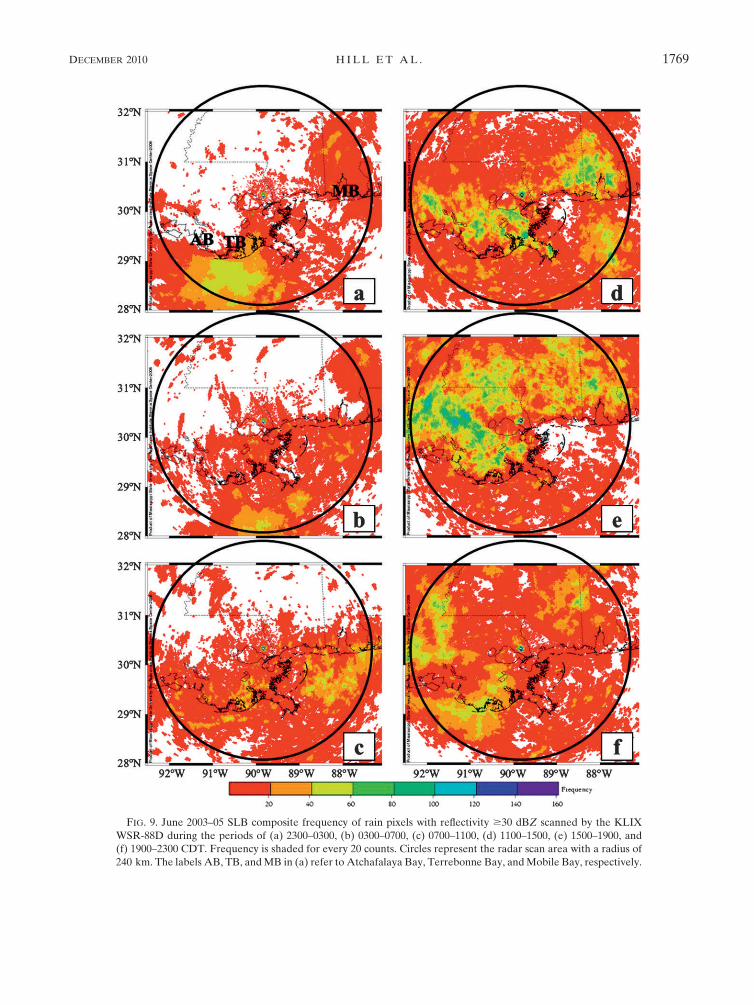
FIG. 9. June 2003–05 SLB composite frequency of rain pixels with reflectivity $30 dBZ scanned by the KLIX
WSR-88D during the periods of (a) 2300–0300, (b) 0300–0700, (c) 0700–1100, (d) 1100–1500, (e) 1500–1900, and
(f) 1900–2300 CDT. Frequency is shaded for every 20 counts. Circles represent the radar scan area with a radius of
240 km. The labels AB, TB, andMB in (a) refer to Atchafalaya Bay, Terrebonne Bay, andMobile Bay, respectively.
DECEMBER 2010 H I L L ET AL . 1769
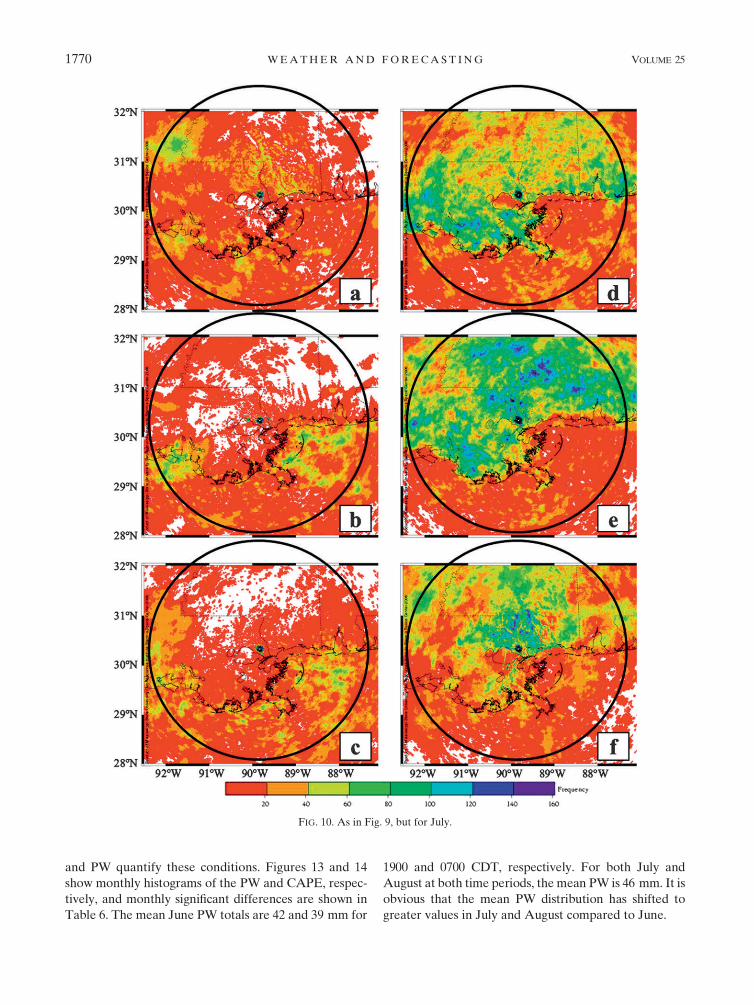
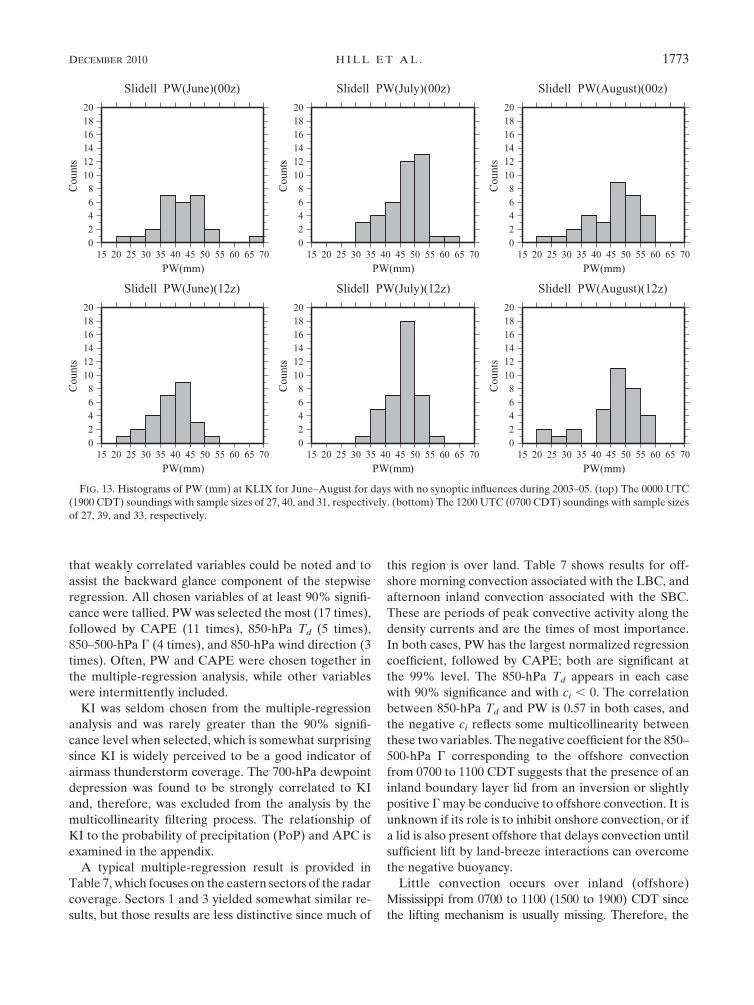
and PW quantify these conditions. Figures 13 and 14
show monthly histograms of the PW and CAPE, respec-
tively, and monthly significant differences are shown in
Table 6. The mean June PW totals are 42 and 39 mm for
1900 and 0700 CDT, respectively. For both July and
August at both time periods, the mean PW is 46 mm. It is
obvious that the mean PW distribution has shifted to
greater values in July and August compared to June.
FIG. 10. As in Fig. 9, but for July.
1770 WEATHER AND FORECAST ING VOLUME 25
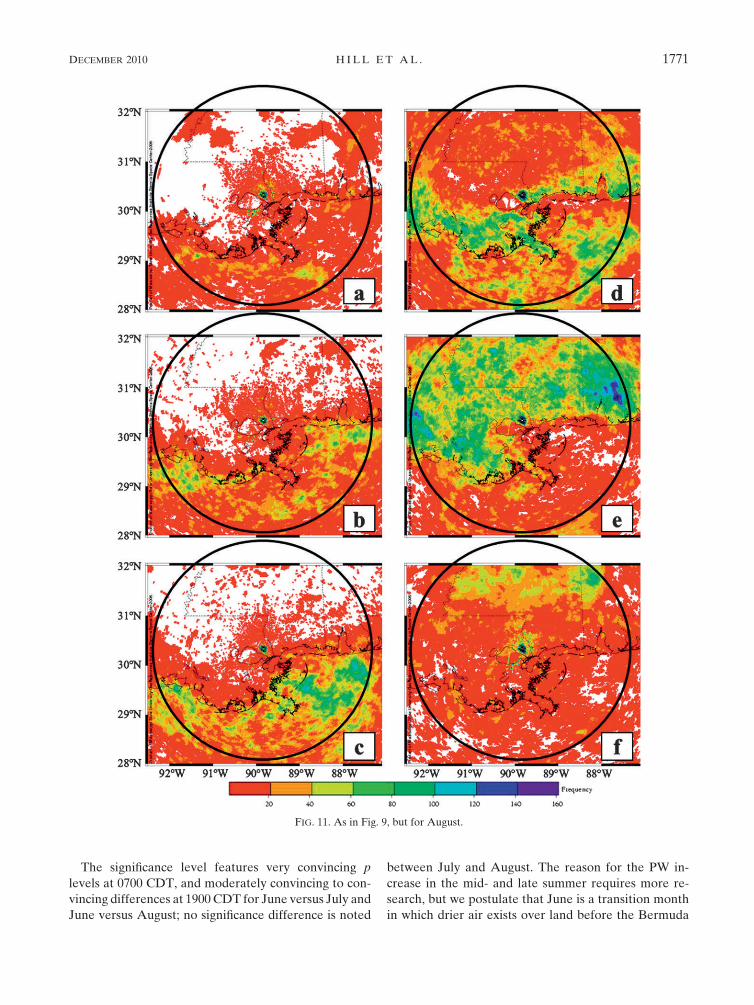
The significance level features very convincing p
levels at 0700 CDT, and moderately convincing to con-
vincing differences at 1900CDT for June versus July and
June versus August; no significance difference is noted
between July and August. The reason for the PW in-
crease in the mid- and late summer requires more re-
search, but we postulate that June is a transition month
in which drier air exists over land before the Bermuda
FIG. 11. As in Fig. 9, but for August.
DECEMBER 2010 H I L L ET AL . 1771
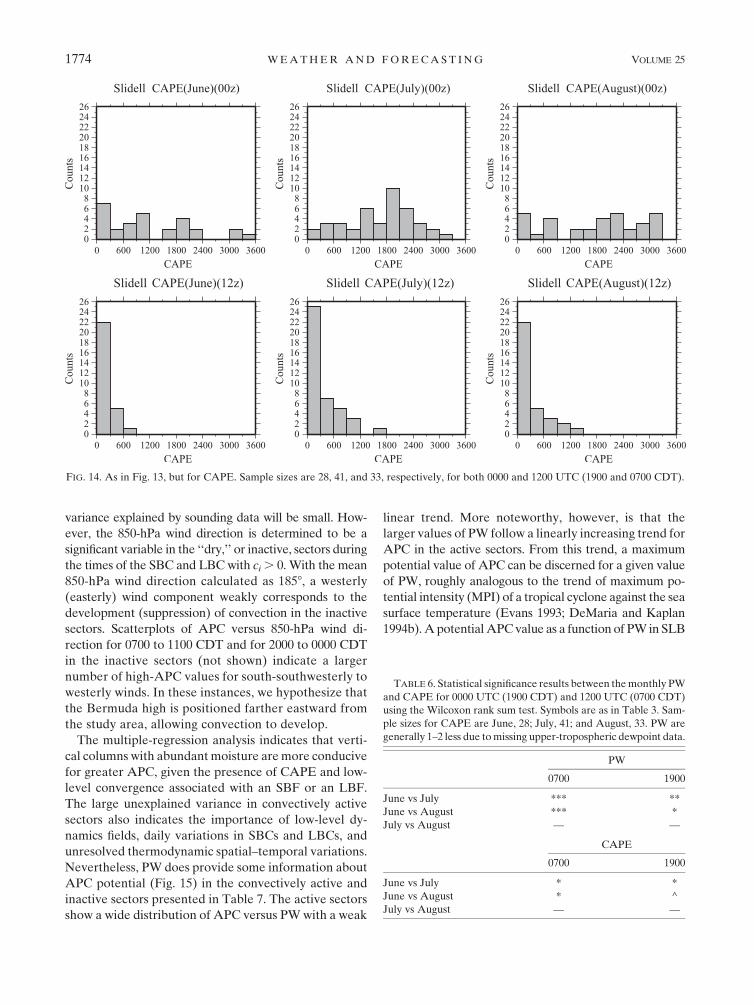
high transports more moisture into the region. If the PW
increases as the summer progresses, naturally the CAPE
will also increase. The mean CAPE values at 1900 CDT
during June, July, and August are 1235, 1667, and
1736 J kg21, respectively, and 194, 318, and 308 J kg21
at 0700 CDT. However, these CAPE differences are
only moderately significant, and the histograms visually
do not show clear variations.
Based on these results, it is reasonable to conclude
that rainfall coverage increases in July andAugust along
the Mississippi coast are due to more moist atmospheric
layers and, to a lesser extent, additional instability. These
thermodynamic variables will be further examined by
a multiple-regression analysis in the next subsection.
However, the increase in APC offshore of Mississippi
in July and August results from additional factors. PW
variability certainly contributes to offshore rain coverage,
since June overall has less APC. The increase of APC in
July and August is also related to the setup of the LBCs
discussed in section 3a. As had been previously suggested
by Smith et al. (2005), converging land breezes from
Mississippi and eastern Louisiana provide convergence
and additional lift for convection, which explains the in-
crease in theAPCvalues in thosemonths. TheLBCalong
the Mississippi coast tends to be stronger in August, and
may explain the increase in APC during August com-
pared to July.
d. Statistical associations with APC
Generally, only weak multiple-regression relation-
ships were found in this study. This accentuates the im-
portance of local dynamics and $T daily variations for
SBC- and LBC-related convection. The regression is also
limited by sounding data availability from solely one lo-
cation (KLIX) at just two times (1900 and 0700 CDT).
Nevertheless, some information was gleaned from the
analysis.
The 1900 CDT sounding data were correlated to
1900–2300, 2300–0300, and 0300–0700 CDTAPC data in
sectors 1–4; likewise, 0700 CDT sounding data were
correlated to the next three 4-h APC data periods. The
analyses allowed for 24 multiple-regression runs. PW
and CAPE exhibited the overall best relationships to
convective activity along the Louisiana–Mississippi coast,
while other variables hadweaker associations or were not
significant. Additionally, within some 4-h periods, little to
no convection occurred, and therefore no meaningful
variable correlation was produced.
Because the data sample was small for multiple-
regression usage, the significance level was set at 70% so
TABLE 5. Statistical significance testing for differences in distributions results between monthly APC for sectors 2 and 4 using the
Wilcoxon rank sum test at each 4-h bin (CDT). Symbols are as in Table 3. Sample size ranges are sector 2, 25–28 (June); sector 2, 40–41
(July); sector 2, 33 (August); sector 4, 25–28 (June); sector 4, 40–41 (July); and sector 4, 33 (August).
June vs July July vs August June vs August
Hour (CDT) Sector 2 Sector 4 Sector 2 Sector 4 Sector 2 Sector 4
2300–0300 ^ * * **
0300–0700 ^ ^ * ^ ** **
0700–1100 ^ * ** ^
1100–1500 * ** ^ **
1500–1900 ** * ** ^
1900–2300 ^ ^
FIG. 12. The 4-hourly APC averaged over the period of 2003–05
for each month in (top) sector 4 representing inland coastal MS
and (bottom) sector 2 representing offshore MS.
1772 WEATHER AND FORECAST ING VOLUME 25
that weakly correlated variables could be noted and to
assist the backward glance component of the stepwise
regression. All chosen variables of at least 90% signifi-
cance were tallied. PWwas selected the most (17 times),
followed by CAPE (11 times), 850-hPa Td (5 times),
850–500-hPa G (4 times), and 850-hPa wind direction (3
times). Often, PW and CAPE were chosen together in
the multiple-regression analysis, while other variables
were intermittently included.
KI was seldom chosen from the multiple-regression
analysis and was rarely greater than the 90% signifi-
cance level when selected, which is somewhat surprising
since KI is widely perceived to be a good indicator of
airmass thunderstorm coverage. The 700-hPa dewpoint
depression was found to be strongly correlated to KI
and, therefore, was excluded from the analysis by the
multicollinearity filtering process. The relationship of
KI to the probability of precipitation (PoP) and APC is
examined in the appendix.
A typical multiple-regression result is provided in
Table 7, which focuses on the eastern sectors of the radar
coverage. Sectors 1 and 3 yielded somewhat similar re-
sults, but those results are less distinctive since much of
this region is over land. Table 7 shows results for off-
shore morning convection associated with the LBC, and
afternoon inland convection associated with the SBC.
These are periods of peak convective activity along the
density currents and are the times of most importance.
In both cases, PW has the largest normalized regression
coefficient, followed by CAPE; both are significant at
the 99% level. The 850-hPa Td appears in each case
with 90% significance and with ci , 0. The correlation
between 850-hPa Td and PW is 0.57 in both cases, and
the negative ci reflects some multicollinearity between
these two variables. The negative coefficient for the 850–
500-hPa G corresponding to the offshore convection
from 0700 to 1100 CDT suggests that the presence of an
inland boundary layer lid from an inversion or slightly
positive Gmay be conducive to offshore convection. It is
unknown if its role is to inhibit onshore convection, or if
a lid is also present offshore that delays convection until
sufficient lift by land-breeze interactions can overcome
the negative buoyancy.
Little convection occurs over inland (offshore)
Mississippi from 0700 to 1100 (1500 to 1900) CDT since
the lifting mechanism is usually missing. Therefore, the
FIG. 13. Histograms of PW (mm) at KLIX for June–August for days with no synoptic influences during 2003–05. (top) The 0000 UTC
(1900 CDT) soundings with sample sizes of 27, 40, and 31, respectively. (bottom) The 1200 UTC (0700 CDT) soundings with sample sizes
of 27, 39, and 33, respectively.
DECEMBER 2010 H I L L ET AL . 1773
variance explained by sounding data will be small. How-
ever, the 850-hPa wind direction is determined to be a
significant variable in the ‘‘dry,’’ or inactive, sectors during
the times of the SBC and LBCwith ci. 0. With the mean
850-hPa wind direction calculated as 1858, a westerly
(easterly) wind component weakly corresponds to the
development (suppression) of convection in the inactive
sectors. Scatterplots of APC versus 850-hPa wind di-
rection for 0700 to 1100 CDT and for 2000 to 0000 CDT
in the inactive sectors (not shown) indicate a larger
number of high-APC values for south-southwesterly to
westerly winds. In these instances, we hypothesize that
the Bermuda high is positioned farther eastward from
the study area, allowing convection to develop.
The multiple-regression analysis indicates that verti-
cal columns with abundantmoisture aremore conducive
for greater APC, given the presence of CAPE and low-
level convergence associated with an SBF or an LBF.
The large unexplained variance in convectively active
sectors also indicates the importance of low-level dy-
namics fields, daily variations in SBCs and LBCs, and
unresolved thermodynamic spatial–temporal variations.
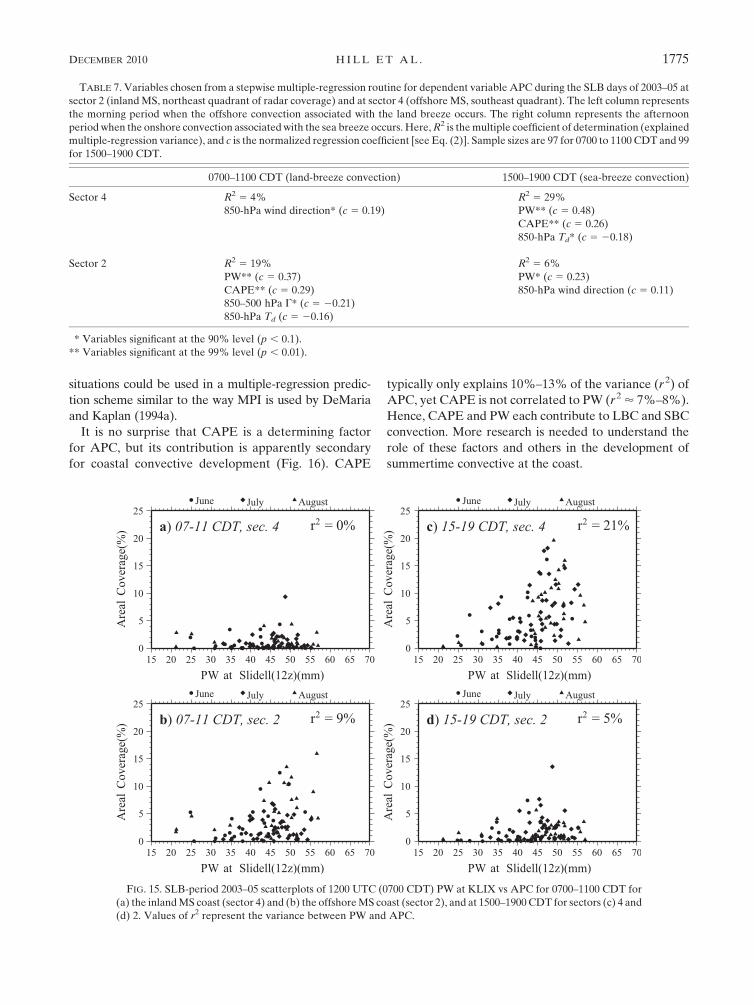
Nevertheless, PW does provide some information about
APC potential (Fig. 15) in the convectively active and
inactive sectors presented in Table 7. The active sectors
show a wide distribution of APC versus PWwith a weak
linear trend. More noteworthy, however, is that the
larger values of PW follow a linearly increasing trend for
APC in the active sectors. From this trend, a maximum
potential value of APC can be discerned for a given value
of PW, roughly analogous to the trend of maximum po-
tential intensity (MPI) of a tropical cyclone against the sea
surface temperature (Evans 1993; DeMaria and Kaplan
1994b).ApotentialAPCvalue as a function of PW in SLB
FIG. 14. As in Fig. 13, but for CAPE. Sample sizes are 28, 41, and 33, respectively, for both 0000 and 1200 UTC (1900 and 0700 CDT).
TABLE 6. Statistical significance results between themonthly PW
and CAPE for 0000 UTC (1900 CDT) and 1200 UTC (0700 CDT)
using the Wilcoxon rank sum test. Symbols are as in Table 3. Sam-
ple sizes for CAPE are June, 28; July, 41; and August, 33. PW are
generally 1–2 less due tomissing upper-tropospheric dewpoint data.
PW
0700 1900
June vs July *** **
June vs August *** *
July vs August — —
CAPE
0700 1900
June vs July * *
June vs August * ^
July vs August — —
1774 WEATHER AND FORECAST ING VOLUME 25
situations could be used in a multiple-regression predic-
tion scheme similar to the way MPI is used by DeMaria
and Kaplan (1994a).
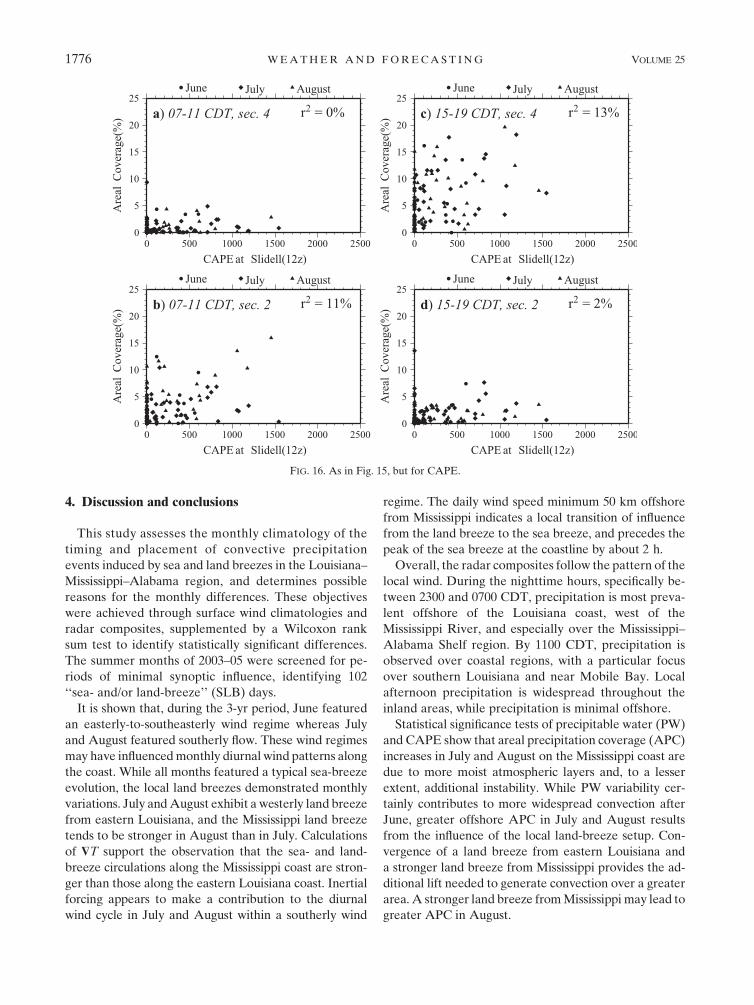
It is no surprise that CAPE is a determining factor
for APC, but its contribution is apparently secondary
for coastal convective development (Fig. 16). CAPE
typically only explains 10%–13% of the variance (r 2) of
APC, yet CAPE is not correlated to PW (r2’ 7%–8%).
Hence, CAPE and PW each contribute to LBC and SBC
convection. More research is needed to understand the
role of these factors and others in the development of
summertime convective at the coast.
TABLE 7. Variables chosen from a stepwise multiple-regression routine for dependent variable APC during the SLB days of 2003–05 at
sector 2 (inlandMS, northeast quadrant of radar coverage) and at sector 4 (offshore MS, southeast quadrant). The left column represents
the morning period when the offshore convection associated with the land breeze occurs. The right column represents the afternoon
periodwhen the onshore convection associatedwith the sea breeze occurs. Here,R2 is themultiple coefficient of determination (explained
multiple-regression variance), and c is the normalized regression coefficient [see Eq. (2)]. Sample sizes are 97 for 0700 to 1100 CDT and 99
for 1500–1900 CDT.
0700–1100 CDT (land-breeze convection) 1500–1900 CDT (sea-breeze convection)
Sector 4 R2 5 4% R2 5 29%
850-hPa wind direction* (c 5 0.19) PW** (c 5 0.48)
CAPE** (c 5 0.26)
850-hPa Td* (c 5 20.18)
Sector 2 R2 5 19% R2 5 6%
PW** (c 5 0.37) PW* (c 5 0.23)
CAPE** (c 5 0.29) 850-hPa wind direction (c 5 0.11)
850–500 hPa G* (c 5 20.21)
850-hPa Td (c 5 20.16)
* Variables significant at the 90% level (p , 0.1).
** Variables significant at the 99% level (p , 0.01).
FIG. 15. SLB-period 2003–05 scatterplots of 1200 UTC (0700 CDT) PW at KLIX vs APC for 0700–1100 CDT for
(a) the inlandMS coast (sector 4) and (b) the offshoreMS coast (sector 2), and at 1500–1900CDT for sectors (c) 4 and
(d) 2. Values of r2 represent the variance between PW and APC.
DECEMBER 2010 H I L L ET AL . 1775
4. Discussion and conclusions
This study assesses the monthly climatology of the
timing and placement of convective precipitation
events induced by sea and land breezes in the Louisiana–
Mississippi–Alabama region, and determines possible
reasons for the monthly differences. These objectives
were achieved through surface wind climatologies and
radar composites, supplemented by a Wilcoxon rank
sum test to identify statistically significant differences.
The summer months of 2003–05 were screened for pe-
riods of minimal synoptic influence, identifying 102
‘‘sea- and/or land-breeze’’ (SLB) days.
It is shown that, during the 3-yr period, June featured
an easterly-to-southeasterly wind regime whereas July
and August featured southerly flow. These wind regimes
may have influencedmonthly diurnal wind patterns along
the coast. While all months featured a typical sea-breeze
evolution, the local land breezes demonstrated monthly
variations. July andAugust exhibit a westerly land breeze
from eastern Louisiana, and the Mississippi land breeze
tends to be stronger in August than in July. Calculations
of $T support the observation that the sea- and land-
breeze circulations along the Mississippi coast are stron-
ger than those along the eastern Louisiana coast. Inertial
forcing appears to make a contribution to the diurnal
wind cycle in July and August within a southerly wind
regime. The daily wind speed minimum 50 km offshore
from Mississippi indicates a local transition of influence
from the land breeze to the sea breeze, and precedes the
peak of the sea breeze at the coastline by about 2 h.
Overall, the radar composites follow the pattern of the
local wind. During the nighttime hours, specifically be-
tween 2300 and 0700 CDT, precipitation is most preva-
lent offshore of the Louisiana coast, west of the
Mississippi River, and especially over the Mississippi–
Alabama Shelf region. By 1100 CDT, precipitation is
observed over coastal regions, with a particular focus
over southern Louisiana and near Mobile Bay. Local
afternoon precipitation is widespread throughout the
inland areas, while precipitation is minimal offshore.
Statistical significance tests of precipitable water (PW)
and CAPE show that areal precipitation coverage (APC)
increases in July and August on the Mississippi coast are
due to more moist atmospheric layers and, to a lesser
extent, additional instability. While PW variability cer-
tainly contributes to more widespread convection after
June, greater offshore APC in July and August results
from the influence of the local land-breeze setup. Con-
vergence of a land breeze from eastern Louisiana and
a stronger land breeze from Mississippi provides the ad-
ditional lift needed to generate convection over a greater
area. A stronger land breeze fromMississippi may lead to
greater APC in August.
FIG. 16. As in Fig. 15, but for CAPE.
1776 WEATHER AND FORECAST ING VOLUME 25
Multiple-regression analysis indicates that PW and
CAPE each contribute to rainfall coverage variations—
especially in the convectively active branches of the
coastal density current—but much of the associated vari-
ance remains unexplained. The 850-hPa Td, 850–500-hPa
G, and 850-hPa wind direction are intermittently chosen in
the stepwise regression, but often at lower significance
levels. KI was seldom chosen and was rarely greater than
the 90% significance level when selected, which is some-
what surprising since KI is widely perceived to be a good
indicator of airmass thunderstorm coverage. Scatterplots
indicate the upper percentile of the PW follows a linearly
increasing trend for APC in the active radar sectors.
Therefore, PW may be used to determine APC potential.
This study documents a climatological pattern of
summertime convective precipitation, which may facil-
itate its prediction in the NCGC region. The unique
combination of an irregular, west–east-oriented coast-
line, variant regional topography, relatively low latitude,
daily conditional instability, and abundant moisture pro-
motes the cycle of the SLB and associated convection in
the NCGC region, with some monthly pattern variations.
Acknowledgments. This research is sponsored by the
National Oceanographic and Atmospheric Adminis-
tration (NOAA), with Grants NA060AR4600181 and
NA050AR4601145, and through the Northern Gulf In-
stitute, funded by Grant NA060AR4320264. The au-
thors thank Dr. Haldun Karan for his careful review of
the paper. Dr. Grady Dixon also provided feedback of
the analysis work, and Kelsey Scheitlin contributed to the
preparation of the manuscript. The National Weather
Service of NOAA is the primary provider of surface
observing data. RAWS hourly data were obtained from
the USDA Joint Agricultural Weather Facility in
Stoneville, Mississippi; these data are used specifically to
assist with forecasting weather in fire-prone areas. Buoy
data were obtained from the National Data buoy Cen-
ter, the National Ocean Service, Louisiana State Uni-
versity, and the University of Southern Mississippi.
David Walters of the U.S. Geological Survey provided
meteorological data from Louisiana tide gauge stations.
Multiple-regression calculations were performed using
the International Mathematical and Statistical Library
(IMSL). The Wilcoxon rank sum significance tests uti-
lized the R software package.
APPENDIX
Is the K Index a Useful PoP Predictor?
The National Weather Service Operations Manual
(NOAA2005) defines probability of precipitation (PoP)
as the likelihood—expressed as a percent—of a mea-
surable precipitation event at any given point within
a forecast area and within a clearly stated time period.
Schaefer and Livingston (1990) show that this definition
of PoP can be interpreted as the expected areal cover-
age of precipitation (orAPC) if a forecaster has complete
certainty that a measureable precipitation event will oc-
cur somewhere within the forecast area. In the Louisiana
and Mississippi Gulf coast area, airmass thunderstorms
typically occur on most days in the summer; hence, the
PoP could be interpreted to be the expectedAPC in the
region, since forecasters will have high confidence of a
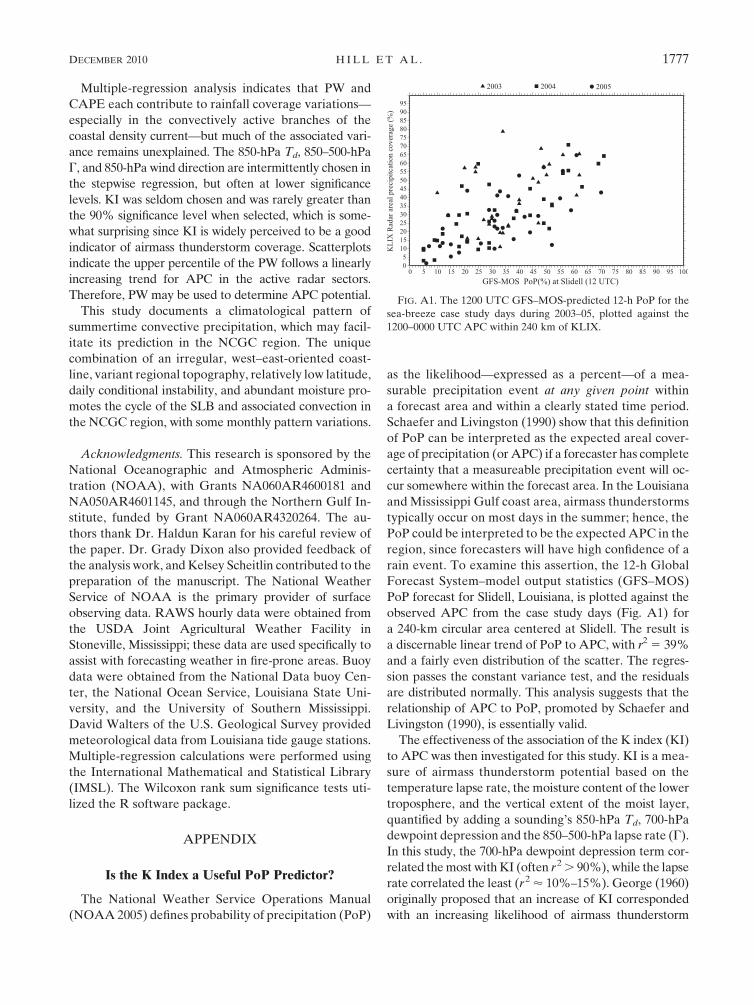
rain event. To examine this assertion, the 12-h Global
Forecast System–model output statistics (GFS–MOS)
PoP forecast for Slidell, Louisiana, is plotted against the
observed APC from the case study days (Fig. A1) for
a 240-km circular area centered at Slidell. The result is
a discernable linear trend of PoP to APC, with r2 5 39%
and a fairly even distribution of the scatter. The regres-
sion passes the constant variance test, and the residuals
are distributed normally. This analysis suggests that the
relationship of APC to PoP, promoted by Schaefer and
Livingston (1990), is essentially valid.
The effectiveness of the association of the K index (KI)
to APC was then investigated for this study. KI is a mea-
sure of airmass thunderstorm potential based on the
temperature lapse rate, the moisture content of the lower
troposphere, and the vertical extent of the moist layer,
quantified by adding a sounding’s 850-hPa Td, 700-hPa
dewpoint depression and the 850–500-hPa lapse rate (G).
In this study, the 700-hPa dewpoint depression term cor-
related themost withKI (often r2. 90%), while the lapse
rate correlated the least (r2’ 10%–15%). George (1960)
originally proposed that an increase of KI corresponded
with an increasing likelihood of airmass thunderstorm
FIG. A1. The 1200 UTC GFS–MOS-predicted 12-h PoP for the
sea-breeze case study days during 2003–05, plotted against the
1200–0000 UTC APC within 240 km of KLIX.
DECEMBER 2010 H I L L ET AL . 1777
development due to the dominance of the moisture terms
in quasi-tropical environments. Theoretically, KI 5 15
corresponds to PoP 5 20%, linearly increasing to 100%
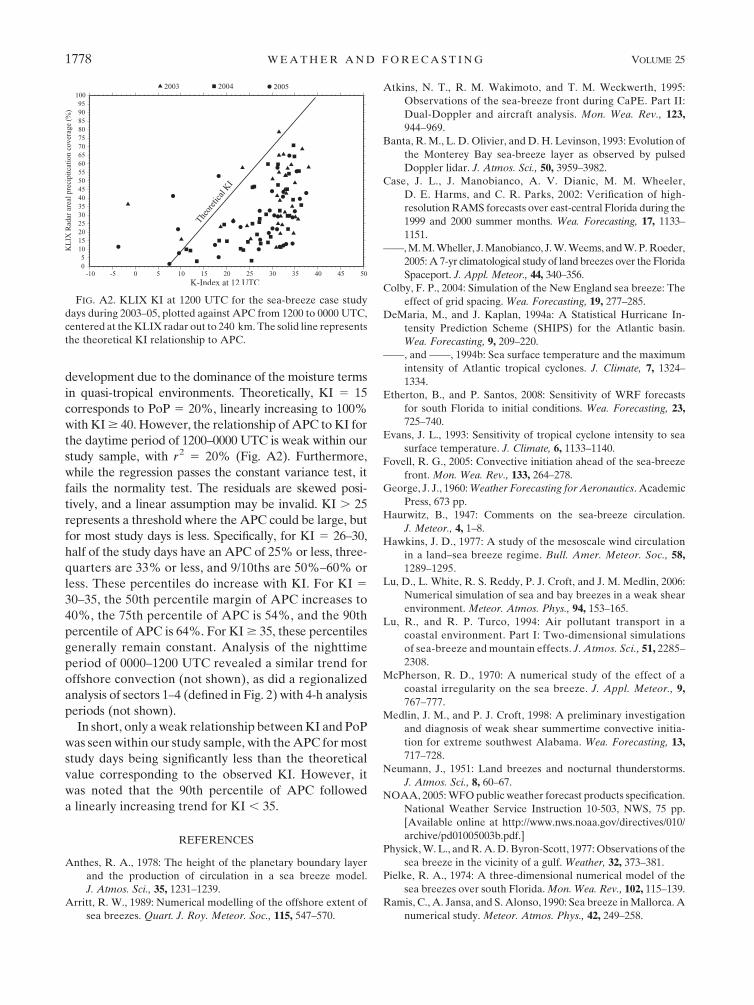
with KI$ 40. However, the relationship of APC to KI for
the daytime period of 1200–0000 UTC is weak within our
study sample, with r2 5 20% (Fig. A2). Furthermore,
while the regression passes the constant variance test, it
fails the normality test. The residuals are skewed posi-
tively, and a linear assumption may be invalid. KI . 25
represents a threshold where the APC could be large, but
for most study days is less. Specifically, for KI 5 26–30,
half of the study days have an APC of 25% or less, three-
quarters are 33% or less, and 9/10ths are 50%–60% or
less. These percentiles do increase with KI. For KI 5
30–35, the 50th percentile margin of APC increases to
40%, the 75th percentile of APC is 54%, and the 90th
percentile of APC is 64%. For KI$ 35, these percentiles
generally remain constant. Analysis of the nighttime
period of 0000–1200 UTC revealed a similar trend for
offshore convection (not shown), as did a regionalized
analysis of sectors 1–4 (defined in Fig. 2) with 4-h analysis
periods (not shown).
In short, only a weak relationship betweenKI and PoP
was seenwithin our study sample, with theAPC formost
study days being significantly less than the theoretical
value corresponding to the observed KI. However, it
was noted that the 90th percentile of APC followed
a linearly increasing trend for KI , 35.
REFERENCES
Anthes, R. A., 1978: The height of the planetary boundary layer
and the production of circulation in a sea breeze model.
J. Atmos. Sci., 35, 1231–1239.
Arritt, R. W., 1989: Numerical modelling of the offshore extent of
sea breezes. Quart. J. Roy. Meteor. Soc., 115, 547–570.
Atkins, N. T., R. M. Wakimoto, and T. M. Weckwerth, 1995:
Observations of the sea-breeze front during CaPE. Part II:
Dual-Doppler and aircraft analysis. Mon. Wea. Rev., 123,
944–969.
Banta, R.M., L. D. Olivier, and D. H. Levinson, 1993: Evolution of
the Monterey Bay sea-breeze layer as observed by pulsed
Doppler lidar. J. Atmos. Sci., 50, 3959–3982.Case, J. L., J. Manobianco, A. V. Dianic, M. M. Wheeler,
D. E. Harms, and C. R. Parks, 2002: Verification of high-
resolutionRAMS forecasts over east-central Florida during the
1999 and 2000 summer months. Wea. Forecasting, 17, 1133–
1151.
——,M.M.Wheller, J.Manobianco, J.W.Weems, andW.P.Roeder,
2005:A 7-yr climatological study of land breezes over the Florida
Spaceport. J. Appl. Meteor., 44, 340–356.
Colby, F. P., 2004: Simulation of the New England sea breeze: The
effect of grid spacing. Wea. Forecasting, 19, 277–285.
DeMaria, M., and J. Kaplan, 1994a: A Statistical Hurricane In-
tensity Prediction Scheme (SHIPS) for the Atlantic basin.
Wea. Forecasting, 9, 209–220.
——, and ——, 1994b: Sea surface temperature and the maximum
intensity of Atlantic tropical cyclones. J. Climate, 7, 1324–
1334.
Etherton, B., and P. Santos, 2008: Sensitivity of WRF forecasts
for south Florida to initial conditions. Wea. Forecasting, 23,
725–740.
Evans, J. L., 1993: Sensitivity of tropical cyclone intensity to sea
surface temperature. J. Climate, 6, 1133–1140.
Fovell, R. G., 2005: Convective initiation ahead of the sea-breeze
front. Mon. Wea. Rev., 133, 264–278.George, J. J., 1960:Weather Forecasting for Aeronautics. Academic
Press, 673 pp.
Haurwitz, B., 1947: Comments on the sea-breeze circulation.
J. Meteor., 4, 1–8.
Hawkins, J. D., 1977: A study of the mesoscale wind circulation
in a land–sea breeze regime. Bull. Amer. Meteor. Soc., 58,
1289–1295.
Lu, D., L. White, R. S. Reddy, P. J. Croft, and J. M. Medlin, 2006:
Numerical simulation of sea and bay breezes in a weak shear
environment. Meteor. Atmos. Phys., 94, 153–165.
Lu, R., and R. P. Turco, 1994: Air pollutant transport in a
coastal environment. Part I: Two-dimensional simulations
of sea-breeze andmountain effects. J. Atmos. Sci., 51, 2285–
2308.
McPherson, R. D., 1970: A numerical study of the effect of a
coastal irregularity on the sea breeze. J. Appl. Meteor., 9,
767–777.
Medlin, J. M., and P. J. Croft, 1998: A preliminary investigation
and diagnosis of weak shear summertime convective initia-
tion for extreme southwest Alabama. Wea. Forecasting, 13,
717–728.
Neumann, J., 1951: Land breezes and nocturnal thunderstorms.
J. Atmos. Sci., 8, 60–67.NOAA, 2005:WFOpublic weather forecast products specification.
National Weather Service Instruction 10-503, NWS, 75 pp.
[Available online at http://www.nws.noaa.gov/directives/010/
archive/pd01005003b.pdf.]
Physick,W. L., andR.A.D. Byron-Scott, 1977:Observations of the
sea breeze in the vicinity of a gulf. Weather, 32, 373–381.Pielke, R. A., 1974: A three-dimensional numerical model of the
sea breezes over south Florida.Mon. Wea. Rev., 102, 115–139.
Ramis, C., A. Jansa, and S. Alonso, 1990: Sea breeze inMallorca. A
numerical study. Meteor. Atmos. Phys., 42, 249–258.
FIG. A2. KLIX KI at 1200 UTC for the sea-breeze case study
days during 2003–05, plotted against APC from 1200 to 0000 UTC,
centered at theKLIX radar out to 240 km. The solid line represents
the theoretical KI relationship to APC.
1778 WEATHER AND FORECAST ING VOLUME 25
Reap, R. M., 1994: Analysis and prediction of lightning strike
distributions associated with synoptic map types over Florida.
Mon. Wea. Rev., 122, 1698–1715.
Reimann, C., P. Filzmoser, R. Garrett, and R. Dutter, 2008: Sta-
tistical Data Analysis Explained: Applied Environmental Sta-
tistics with R. John Wiley and Sons, 362 pp.
Rotunno, R., 1983: On the linear theory of the land and sea breeze.
J. Atmos. Sci., 40, 1999–2009.Schaefer, J. T., andR.L. Livingston, 1990:Operational implications of
the ‘‘probability of precipitation.’’ Wea. Forecasting, 5, 354–356.
Sheng, C.,M.Xue, and S.Gao, 2009: The structure and evolution of
sea breezes during the Qingdao Olympics sailing test event in
2006. Adv. Atmos. Sci., 26, 132–142.
Simpson, J. E., 1994: Sea Breeze and Local Winds. Cambridge
University Press, 234 pp.
Smith, J. R., H. E. Fuelberg, and A. I. Watson, 2005: Warm season
lightning distributions over the northern Gulf of Mexico coast
and their relation to synoptic-scale and mesoscale environ-
ments. Wea. Forecasting, 20, 415–438.
Steiger, S. M., and R. E. Orville, 2003: Cloud-to-ground lightning
enhancement over southern Louisiana. Geophys. Res. Lett.,
30, 1975, doi:10.1029/2003GL017923.
Steyn, D. G., and I. G. McKendry, 1988: Quantitative and quali-
tative evaluation of a three-dimensional mesoscale numerical
model simulation of a sea breeze in complex terrain. Mon.
Wea. Rev., 116, 1914–1926.
Wakimoto, R. M., and N. T. Atkins, 1994: Observations of the sea-
breeze front during CaPE. Part I: Single-Doppler, satellite and
cloudphotogrammetry analysis.Mon.Wea.Rev., 122, 1092–1114.Wilcoxon, F., 1945: Individual comparisons by ranking methods.
Biometrics, 1, 80–83.
Wilson, J.W., andD. L. Megenhardt, 1997: Thunderstorm initiation,
organization, and lifetime associated with Florida boundary
layer convergence lines. Mon. Wea. Rev., 125, 1507–1525.
DECEMBER 2010 H I L L ET AL . 1779