sun country airlines
TRANSCRIPT

Sun Country AirlinesSeptember 2021

DisclaimerConfidentiality and Market Data
This presentation constitutes confidential information and is provided to you on the condition that you will hold it in strict confidence and not reproduce, disclose, forward or distribute it in whole or in part without the prior written consent of the Company. This presentation has been prepared by the Company for informational purposes only and not for any other purpose. Nothing contained in this presentation is, or should be construed as, a recommendation, promise or representation by the presenter or the Company or any director, employee, agent, or adviser of or the Company. This presentation does not purport to be all-inclusive or to contain all of the information you may desire.
We include statements and information in this presentation concerning our industry ranking and the markets in which we operate, including our general expectations and market opportunity, which are based on information from independent industry organizations and other third-party sources (including a third-party market study, industry publications, surveys and forecasts). While we believe these third-party sources to be reliable as of the date of this presentation, we have not independently verified any third-party information and such information is inherently imprecise. In addition, projections, assumptions and estimates of the future performance of the industry in which we operate and our future performance are necessarily subject to a high degree of uncertainty and risk due to a variety of risks. These and other factors could cause results to differ materially from those expressed in the estimates made by the independent parties and by us.
Cautionary Note Regarding Forward-Looking Statements
This presentation contains forward-looking statements, which involve risks and uncertainties. These forward-looking statements are generally identified by the use of forward-looking terminology, including the terms “anticipate,” “believe,” “continue,” “could,” “estimate,” “expect,” “intend,” “likely,” “may,” “plan,” “possible,” “potential,” “predict,” “project,” “should,” “target,” “will,” “would” and, in each case, their negative or other various or comparable terminology. All statements other than statements of historical facts contained in this presentation, including statements regarding our strategy, future operations, future financial position, future revenue, projected costs, prospects, plans, objectives of management and general economic trends and trends in the industry and markets are forward-looking statements. These statements involve known and unknown risks, uncertainties and other important factors that may cause our actual results, performance or achievements to be materially different from any future results, performance or achievements expressed or implied by the forward-looking statements. Certain of these risks are identified and discussed in our filings with the Securities and Exchange Commission. These forward-looking statements reflect our views with respect to future events as of the date of this presentation and are based on assumptions and subject to risks and uncertainties. Given these uncertainties, you should not place undue reliance on these forward-looking statements. We undertake no obligation to update any forward-looking statements, whether as a result of new information, future events or otherwise after the date of this presentation.
2

Third quarter update
3
Guidance for Third Quarter 2021New guidance Previous guidance
Total revenue - millions $170 to $175 $170 to $175
Fuel cost per gallon – excluding derivatives $2.14 $2.30
Operating income margin – percentage 7.0% - 9.5% 5.5% - 9.5%
Effective tax rate 25% 25%
Total system ASMs - millions 1,500 to 1,560 1,500 to 1,560
Resiliency of business model demonstrated as strength in cargo and charter businesses largely offsetting some softness in scheduled passenger business

Business Overview

A New Breed of Hybrid LCC
High growth low cost airline with a unique and resilient business model
Serves the VFR and leisure passenger, charter and cargo sectors
Differentiated low fixed cost, asset light business model
Dynamically allocate capacity to match demand patterns, maximize unit revenue
Leading financial performance during one of the worst periods in industry history
5
Sun Country Overview Adjusted EBITDAR Margin (1)
1 - See Appendix for more information on how we define Adjusted EBITDAR and reconciliations of Adjusted EBITDAR to the most comparable GAAP metric
Resiliency demonstrated in the most difficult times
18.4%
24.4%
9.7%
17.4%
2018 2019 2020 1H 2021
Rebound in performance well underway

Unique, Diversified Business Model
Sun Country’s symbiotic business lines share assets to maximize operating leverage
6
Sun Country Business Line Synergies
Shared Foundational AssetsAircraft Pilots Shared Services
Charter(~20% of Revenue(1))
Passenger Leisure(~63% of Revenue(1))
Cargo(~16% of Revenue(1))
Long-term asset-light contract with high margins and cash flows, leveraging shared pilot pool
Leading provider of narrowbody charter; providing turnkey charter service to stable
customer base
Unique low cost airline with focus on leisure travel
Standard fleet of 34Boeing 737s that are
used across scheduled service and charter
433(2) Pilots that serveacross the entire set
of assets
An already lean operation supporting
the entire set of assets
1 2
3
1. Percentage of revenue for the first half of 20212. As of June 30, 2021

Agile Passenger Capacity Built to Capture Peak Demand
7
0.0%
5.0%
10.0%
15.0%
Jan Feb Mar Apr May Jun Jul Aug Sep Oct Nov Dec
Seasonal Demand Dictates Monthly Schedule(1) Day-of-Week Capacity Determined by Demand Patterns(1)
Winter MSP to warm leisure Midwest origination
Summer MSP to VFR(2)
MSP to leisure Hawaii Southern big city to
Mexico/Caribbean
Fall MSP to VFR(2)
Big cities to LAS Holiday scheduling
(% of Block Hours)
Unlike other passenger airlines, we quickly shift our capacity to focus flying when demand is high which results in higher yields
Charter and Cargo operations peak in the Fall when Passenger
Leisure is the weakest
• Based on FY2019 data.• Visiting Friends and Relatives.
7.50¢
8.50¢
9.50¢
10.50¢
25%
50%
75%
100%
Mon Tue Wed Thu Fri Sat Sun
Capacity Index (% of peak day) TRASM
(% of Peak Day ASMs) (TRASM)

Superior Passenger Product Offering
Weighted Average Seat Pitch: 31" Seat Recline
In-Flight Entertainment In-Seat Power
8
$144.22$155.49
$132.04
$110.91
$98.14$108.65
2019 2020 LTM Q22021
1 - Sun Country revenue/passenger = average base fare + ancillary revenue per passenger, Allegiant is average fare – total, Spirit is total revenue per passenger flight segment, Frontier is total revenue per passenger
Average Revenue per Passenger(1)
2020

Sun Country Route Network
9
Current Passenger Leisure Operations
~97% of our markets are seasonal which reflects demand trends of our customer

Leading Charter Business
• High growth and high margin market leader
in narrow body charter market
• Only U.S. passenger airline with a
meaningful charter business
• Scheduled seamlessly with passenger
business
• Contract based business – provides
recurring revenues
• Pass-through fuel and other costs
• Largely insulated from economic cycles
10
Overview Charter Revenue per Block Hour
$8,767 $8,793
$8,101 $8,126
2018 2019 2020 LTM Q2 2021
Return of track charter flying that had stopped during COVID is underway
NCAA and professional sports, casino/VIP, US military, among other customers
This is reflective of our views with respect to future events as of the date of this presentation and are based on assumptions and subject to risks and uncertainties. Given these uncertainties, you should not place undue reliance on these forward-looking statements.

Cargo Business - Source of Significant, Stable Cash Flow
• 12 Boeing 737-800 converted freighter aircraft operated on behalf of Amazon
• Increased from original plan of 10 aircraft
• 10 year contract, initial term six years and two additional, two-year extension options
• Partnership with one of the fastest growing companies globally
• Only ULCC with a meaningful cargo business
• Complements passenger leisure and charter operations; pilots scheduled seamlessly
between passenger, charter, cargo business
11

Continue to Reduce CASM Even in Lower Utilization Environment
12
Still in demand recovery phase, expect CASM to improve as we grow
7.80
7.05
6.31
7.57
6.25
9.8 9.7 9.6
5.1
6.8
2017 2018 2019 2020 1H 2021
Adjusted CASM - cents Total Utilization - hours
Adjusted CASM vs Historical Utilization
During COVID
See appendix for Adjusted CASM reconciliationThis is reflective of our views with respect to future events as of the date of this presentation and are based on assumptions and subject to risks and uncertainties. Given these uncertainties, you should not place undue reliance on these forward-looking statements.

Strongly Profitable Even at Lower Utilization
13
Adjusted Operating Margin Versus Utilization
Built to be different, difficult to replicate
Sun Country, Allegiant, Frontier, SpiritSource SEC filings, 2019 is full year 2019, 1H 21 is first six months of 2021
-40%
-30%
-20%
-10%
0%
10%
20%
30%
6.0 7.0 8.0 9.0 10.0 11.0 12.0 13.0
Adju
sted
ope
ratin
g m
argi
n
Daily utilization – hours per day
1H21
2019
2019
20192019
1H21
1H21
1H21

Decline in Fleet Costs Over Time
14
P&L Total Expense per AC(1) per Month$266
$246 $246
$207
2018 2019 2020 2021
Cash Payments(2) per AC(1) per Month
$339$354
$295
$246
2018 2019 2020 2021
USD in 000s USD in 000s
Better fleet deals and transition from leased to owned aircraft has significantly lowered average monthly costs
1 – AC are passenger aircraft only2 – Includes rent, debt service, and reserves

Capital Light Model
15
Current Order Book (1)
Source: Company filings, CAPA, Form 41 Financial Data.1. As of most recent available data (July 2021 for Allegiant, Q2 2021 for Southwest, Spirit, JetBlue, Frontier and Sun Country).2. Sun Country revenue defined as 2019 revenue ($701mm) plus Amazon December 2020 Revenue Annualized ($85mm). Other carriers based on reported 2019 revenue per DOT Form 41.3. Peers based on 2019 revenue and capital expenditures. Peer Average includes Spirit, Allegiant, Southwest, Frontier and JetBlue. Sun Country revenue defined as 2019 revenue ($701mm) plus Amazon December
2020 Revenue Annualized ($85mm), totaling ~$787mm; Sun Country capital expenditures based on reported 2019 figures.
392
148132 129
0 00
50
100
150
200
250
300
350
400
450 # of Aircraft Orders
Not making large CAPEX bets on uncertain future% of Revenue with Less Fuel Risk(2)
33%
4%
0% 0% 0% 0%0%
5%
10%
15%
20%
25%
30%
35%
40%
Cargo and Charter customer able to take fuel price2019 CAPEX / Total Rev(3)
11.5%
8.9%
0%
2%
4%
6%
8%
10%
12%
14%
16%
18%
20%
Low Capital Intensity
% of Revenue % of Revenue
Lower exposure to fuel price fluctuations and lower ongoing capital requirements

Resilient and Positioned for Growth

Best Performance During COVID in 2020
17
Cargo only fully ramped up in November 2020
Source: Company filings using results adjusted to remove identified one-time itemsSee appendix for reconciliation to operating margin
2020 Adjusted Operating Margin
4.9%
-14.2%
-39.9%-44.7%
-48.0%-51.3%
-55.6%-58.5%
-65.7% -67.5%
2017 Rank
Allegiant
Alaska
Southwest
Spirit
JetBlue
Delta
American
United
Sun Country
Since 2017, Sun Country has gone from the lowest operating margin airline to the best, even through one of the worst periods in aviation history in 2020

Financial Momentum Continuing During Recovery
18
Multi-segment business strategy offsets some of leisure demand weakness
Source: Company filingsSee appendix for reconciliation to operating margin
1st Half 2021 Adjusted Operating Margin
4.6% 4.6%
-21.4%-23.6%
-25.5%
-33.2%-35.1% -35.9% -37.0%
-45.7%

Deleveraged Through the Crisis
19
Leverage has remained nearly unchanged through COVID
1. Represents change in adjusted debt (financial debt + operating leases) since February 2020, including reductions for amortization and repayment, through Q2 2021Source Company filings
Adjusted Gross Debt Change Post-COVID
196%
105%96%
66%
46% 44%35%
17%
~2%
$8.8 $18.1 $19.6 $2.1 $1.5 $14.9 $1.2 $0.3 ~$0
Change in Adjusted Gross Debt Since Beginning of Crisis (1)
$ added in bil

Crises Historically Create Opportunity for ULCC Growth
20
Set up to succeed in difficult times
9/11 and 2001 Recession
1.7%
60.5%
Legacy Carriers ULCCs
2000 - 2005
-11.7%
22.7%
Legacy Carriers ULCCs
2007 - 2012
Great Recession
Source: T-100Legacy includes American, Delta and United. American historical market share pro forma for US Airways and America West. Delta historical market share pro forma for Northwest Airlines. United Airlines historical market share pro forma for Continental Airlines.ULCC includes Spirit, Frontier, Allegiant and Sun Country.Past performance is not indicative of future performance.
• ULCC ASM share 5x larger in 2019 than 2000
• Shallower decline and more rapid recovery in leisure demand benefits ULCCs
• Lower costs facilitate profitability in reduced demand environments
• Higher variable nature of costs provides flexibility to deal with unpredictable changes in demand
(Change in Domestic US ASMs between two periods)
ULCCs Post Crisis

Fleet Plan: Responsible Growth
21
Aircraft in Service Strategy in Place to Support Fleet Growth
With no aircraft order book and experience purchasing mid-life aircraft, Sun Country can opportunistically acquire aircraft at best prices
• Restructured fleet with a focus on ownership of Boeing 737-800s and no planned lease redeliveries prior to 2024
• Allows focus on growth with low capital commitments
• Focus on the 737-800 – the LCC stalwart for airlines such as Southwest and Ryanair
• COVID creates unique opportunities to acquire mid-life aircraft at even cheaper rates
• Sun Country maintains no order book and acquires aircraft based on demand needs
(# of aircraft)50 aircraft target by YE 2023
No MAX Exposure
34
50
46
62
25
30
35
40
45
50
55
60
65
Dec-
19
Jun-
20
Dec-
20
Jun-
21
Dec-
21
Jun-
22
Dec-
22
Jun-
23
Dec-
23
Passenger Passenger + Cargo
No order book is an advantage vs. our competitors that are locked into expensive pre-COVID aircraft prices
Expect to acquire 16 aircraft by end of
2023

Balance Sheet Positions Sun Country for Growth
22
• $336m(1) in total liquidity, 73% of LTM total revenue(2)
• Free cash flow(3) positive in 1H 2021
• De minimis non aircraft debt
• Mid-life, low CAPEX passenger fleet; cargo segment asset-lite
1 – Cash and equivalents + $25m in undrawn revolver as of June 30, 20212 – LTM is last twelve months as of June 30, 20213 – Free cash flow defined as Cash From Operations less CAPEX
This is reflective of our views with respect to future events as of the date of this presentation and are based on assumptions and subject to risks and uncertainties. Given these uncertainties, you should not place undue reliance on these forward-looking statements.

In Summary…
23
Resilient and Diverse Business Model
Low Cost Capital Light Operations
Outperformance in Difficult Environments
Well Positioned for High Growth in Rebound
Poised for Long-Term Growth Beyond the Rebound

Appendix

Description of Special Items
Special Items, Net – in millions USD
FY 2018 FY 2019 FY 2020LTM 2Q
2021 1H 2020 1H 2021
CARES Act grant recognition $0.0 $0.0 ($62.3) ($102.4) ($31.5) ($71.6)
CARES Act employee retention credit - - (2.3) (3.1) - (0.8)
Contractual obligations for retired technology - 7.6 - - - -
Sale of airport slot rights - (1.2) - - - -
Sun Country Rewards program modifications (8.5) - - - - -
Early-out payments and other outsourcing expenses 2.0 - - - - -
Aircraft purchases impacts - - - 7.0 - 7.0
Other - 0.7 0.1 0.1 - -
Total Special Items, net ($6.4) $7.1 ($64.6) ($98.4) ($31.5) (65.4)

Non-GAAP Reconciliation – Adj EBITDARAdjusted Earnings Before Interest, Taxes, Depreciation & Amortization and Aircraft Rent (“EBITDAR”) is included as a supplemental disclosure because we believe it is a useful indicator of our operating performance. Adjusted EBITDAR is a well recognized performance measurement in the airline industry that is frequently used by our management, as well as by investors, securities analysts and other interested parties in comparing the operating performance of companies in our industry.
1. See Description of Special Items table in this Appendix.2. Other adjustments for FY 2020 include expenses related to a voluntary employee leave program in response to the COVID-19 pandemic, a portion of which is offset by the CARES Act Payroll Support
Program as the benefit of this program is also adjusted as a component of special items. Other adjustments for FY 2019 include expenses incurred in terminating work on a planned new crew base. Other adjustment for Q1 2021 and Q1 LTM 2020 represents the one-time costs to establish the Tax Receivable Agreement with our pre-IPO stockholders
3. This represents the one-time costs to establish the Tax Receivable Agreement (“TRA”) with our pre-IPO stockholders4. This represents the adjustment to the TRA for the period, which is recorded in Non-operating (Income) / Expense
Adjusted EBITDAR Reconciliation – in millions USD
FY 2018 FY 2019 FY 2020 LTM Q2 2021 1H 2020 1H 2021
Net income (loss) $25.5 $46.1 ($3.9) $59.1 $1.2 $64.2
Provision for income taxes 0.2 14.1 (0.8) 13.6 0.5 14.9
Interest expense 6.4 17.2 22.1 24.2 11.1 13.2
Interest income (0.4) (0.9) (0.4) (0.1) (0.3) -
Special items, net (1) (6.4) 7.1 (64.6) (98.5) (31.5) (65.4)
Tax receivable agreement expense (3) - - - 0.3 - 0.3
Tax receivable agreement adjustment (4) - - - (18.7) - (18.7)
Stock compensation expense 0.4 1.9 2.1 4.9 0.8 3.6
Loss (gain) on asset transactions, net (0.8) 0.7 0.4 - 0.4 -
Other adjustments (2) - 0.2 4.9 3.0 2.5 0.6
Depreciation and amortization 16.9 34.9 48.1 51.5 22.7 26.1
Aircraft rent 65.2 49.9 31.0 23.4 17.0 9.4
Adjusted EBITDAR 107.0 171.1 38.9 62.7 24.4 48.2
Adjusted EBITDAR margin 18.4% 24.4% 9.7% 13.6% 11.3% 17.4%
Adjusted EBITDA 41.8 121.2 7.9 39.3 7.4 38.8
Adjusted EBITDA margin 7.2% 17.3% 2.0% 8.5% 3.4% 14.0%
Total revenue $582.4 $701.4 $401.5 $462.6 $215.7 $276.8

Non-GAAP Reconciliation – Adj Operating IncomeAdjusted Operating Income is included as a supplemental disclosure because we believe it is a useful indicator of our operating performance. Adjusted Operating Income is a well recognized performance measurement in the airline industry that is frequently used by our management, as well as by investors, securities analysts and other interested parties in comparing the operating performance of companies in our industry.
Adjusted Operating Income Reconciliation – in millions USD
FY 2019 FY 2020LTM Q2
2021 1H 2020 1H 2021
Operating Income $78.1 $17.4 $78.6 $13.0 $74.2
Special items, net(1) - - (33.9) (31.5) (65.4)
Stock compensation expense 1.9 2.1 4.9 0.8 3.6
Employee relocation and costs to exit Sun Country’s prior headquarters building and base closures
0.7 0.1 0.1 - -
Contractual obligations for retired technology 7.6 - - - -
Sale of airport slot rights (1.2) - - - -
Tax receivable agreement expense (2) 0.3 - 0.3
Voluntary leave expense (3) (2.5) 2.5 -
Other adjustments 0.2 - - - -
Adjusted operating income 87.3 19.6 47.5 (15.2) 12.7
Total revenue $701.4 $401.5 $462.6 $215.7 $276.8
Adjusted operating income margin 12.5% 4.9% 10.3% (7.0%) 4.6%
1. See Description of Special Items table in this Appendix2. This represents the one-time costs to establish the Tax Receivable Agreement (“TRA”) with our pre-IPO stockholders3. This includes expenses related to a voluntary employee leave program in response to the COVID-19 pandemic, a portion of which is offset by the CARES Act Payroll Support Program as the benefit of this
program is also adjusted as a component of special items

Non-GAAP Reconciliation – Adj Pre-tax IncomeAdjusted Pre-tax Income is included as a supplemental disclosure because we believe it is a useful indicator of our operating performance. Adjusted Pre-tax Income is a well recognized performance measurement in the airline industry that is frequently used by our management, as well as by investors, securities analysts and other interested parties in comparing the operating performance of companies in our industry.
Adjusted Pre-tax Income Reconciliation – in millions USD
FY 2018 FY 2019 FY 2020 LTM Q2 2021 1H 2020 1H 2021
Pre-tax income (loss) $25.7 $60.2 ($4.7) $72.5 $1.8 $79.0
Special items, net (1) (6.4) 7.1 (64.6) (98.5) (31.5) (65.4)
Stock compensation expense 0.4 1.9 2.1 4.9 0.8 3.6
Loss (gain) on asset transactions, net (0.8) 0.7 0.4 - 0.4 -
Early pay-off of US Treasury loan - - - 0.8 - 0.8
Loss on refinancing credit facility - - - 0.4 - 0.4
Tax receivable agreement expense (2) 0.3 - 0.3
Tax receivable agreement adjustment (3) (18.7) - (18.7)
Voluntary leave expense (4) (2.5) 2.5 -
Other adjustments - 0.2 4.9 5.5 - 0.6
Adjusted Pre-tax income (loss) $18.9 $70.1 ($61.9) ($35.2) ($26.0) $0.7
1. See Description of Special Items table in this Appendix2. This represents the one-time costs to establish the Tax Receivable Agreement (“TRA”) with our pre-IPO stockholders3. This represents the adjustment to the TRA for the period, which is recorded in Non-operating (Income) / Expense4. This includes expenses related to a voluntary employee leave program in response to the COVID-19 pandemic, a portion of which is offset by the CARES
Act Payroll Support Program as the benefit of this program is also adjusted as a component of special items
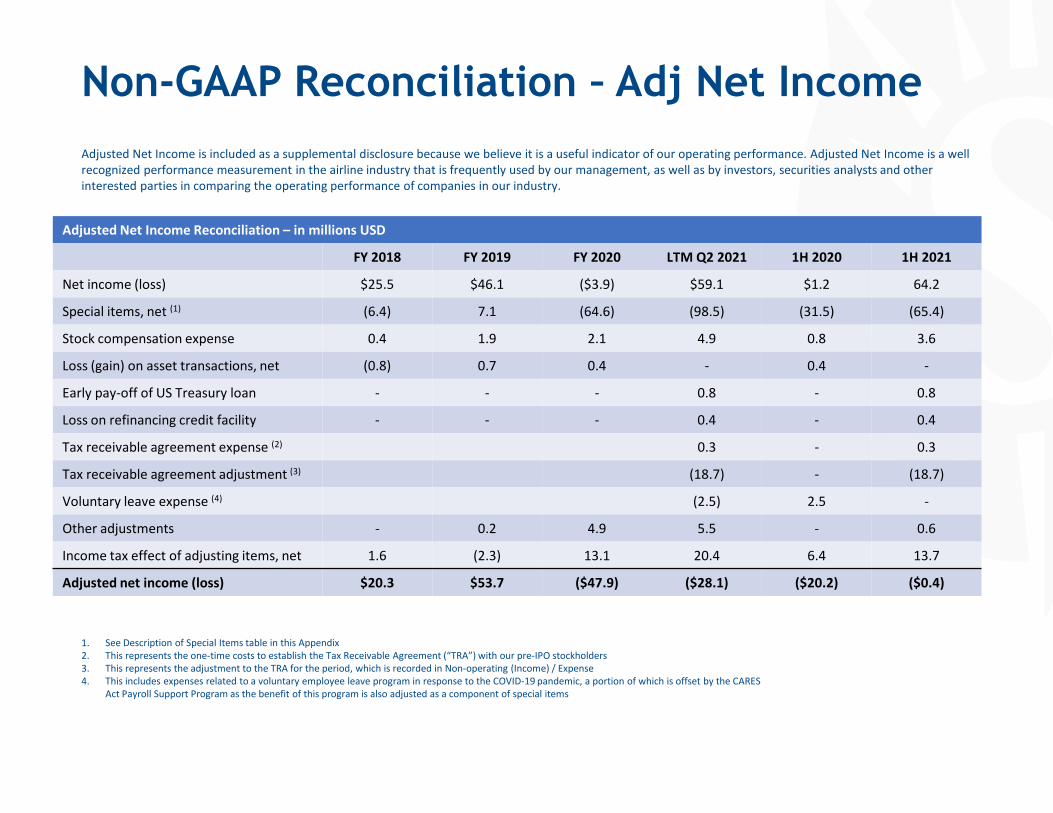
Non-GAAP Reconciliation – Adj Net IncomeAdjusted Net Income is included as a supplemental disclosure because we believe it is a useful indicator of our operating performance. Adjusted Net Income is a well recognized performance measurement in the airline industry that is frequently used by our management, as well as by investors, securities analysts and other interested parties in comparing the operating performance of companies in our industry.
Adjusted Net Income Reconciliation – in millions USD
FY 2018 FY 2019 FY 2020 LTM Q2 2021 1H 2020 1H 2021
Net income (loss) $25.5 $46.1 ($3.9) $59.1 $1.2 64.2
Special items, net (1) (6.4) 7.1 (64.6) (98.5) (31.5) (65.4)
Stock compensation expense 0.4 1.9 2.1 4.9 0.8 3.6
Loss (gain) on asset transactions, net (0.8) 0.7 0.4 - 0.4 -
Early pay-off of US Treasury loan - - - 0.8 - 0.8
Loss on refinancing credit facility - - - 0.4 - 0.4
Tax receivable agreement expense (2) 0.3 - 0.3
Tax receivable agreement adjustment (3) (18.7) - (18.7)
Voluntary leave expense (4) (2.5) 2.5 -
Other adjustments - 0.2 4.9 5.5 - 0.6
Income tax effect of adjusting items, net 1.6 (2.3) 13.1 20.4 6.4 13.7
Adjusted net income (loss) $20.3 $53.7 ($47.9) ($28.1) ($20.2) ($0.4)
1. See Description of Special Items table in this Appendix2. This represents the one-time costs to establish the Tax Receivable Agreement (“TRA”) with our pre-IPO stockholders3. This represents the adjustment to the TRA for the period, which is recorded in Non-operating (Income) / Expense4. This includes expenses related to a voluntary employee leave program in response to the COVID-19 pandemic, a portion of which is offset by the CARES
Act Payroll Support Program as the benefit of this program is also adjusted as a component of special items

Non-GAAP Reconciliation – Adj CASMAdjusted CASM, which is a non-GAAP financial measure, is also a key airline cost metric and excludes fuel costs, costs related to our freighter operations (starting in 2020 when we launched our freighter operation), certain commissions and other costs of selling our vacations product from this measure as these costs are unrelated to our airline operations and improve comparability to our peers. Adjusted CASM is one of the most important measures used by management and by our board of directors in assessing quarterly and annual cost performance. Adjusted CASM is also a measure commonly used by industry analysts and we believe it is an important metric by which they compare our airline to others in the industry, although other airlines may exclude certain other costs in their calculation of Adjusted CASM.
Adjusted CASM Reconciliation – in millions USD, except for ASMs and Adjusted CASM
FY 2017 FY 2018 FY 2019 FY 2020LTM Q2
2021 1H 2020 1H 2021
Operating expense – as reported $530.0 $549.0 $623.3 $384.1 $384.0 $202.7 $202.6
Aircraft fuel (118.4) (165.3) (165.7) (83.4) (81.2) (56.2) (54.0)
Cargo expenses, not already adjusted - - - (31.4) (60.3) (4.5) (33.4)
Sun Country Vacations (2.1) (4.5) (2.4) (0.6) (0.7) (0.3) (0.4)
Special items, net (1) - 6.4 (7.1) 64.6 98.5 31.5 65.4
Stock compensation expense - (0.4) (1.9) (2.1) (4.9) (4.9) (3.6)
Tax receivable agreement expense (2) - - - - (0.3) (0.3) (0.3)
Voluntary leave expense (3) - - - - 2.5 (2.5) -
Other adjustments - - (0.2) (4.9) (4.9) - -
Adjusted operating expense $409.5 $385.2 $445.9 $326.3 $332.7 $169.8 $176.3
Available seat miles (ASMs) – millions 5,250.5 5,463.2 7,064.6 4,311.1 4,956.0 2,174.6 2,819.5
Adjusted CASM - cents 7.80 7.05 6.31 7.57 6.71 7.81 6.25
1. See Description of Special Items table in this Appendix2. This represents the one-time costs to establish the Tax Receivable Agreement (“TRA”) with our pre-IPO stockholders3. This includes expenses related to a voluntary employee leave program in response to the COVID-19 pandemic, a portion of which is offset by the CARES
Act Payroll Support Program as the benefit of this program is also adjusted as a component of special items