sunnyvale climate action plan biennial report 2018
TRANSCRIPT
CLIMATE ACTION PLAN 2018 Biennial Progress Report
July 2018
ATTACHMENT 2

Climate Action Plan 2018 Biennial Progress Report
City Reaches 2020 Target Ahead of Schedule
1
2016 Emissions 12% Below 1990 Levels
The Climate Action Plan (CAP 1.0), adopted in 2014, is the City’s path toward creating a
more sustainable, healthy, and livable community. The economic, social, and
environmental impacts of climate change are a significant threat, and mitigating climate
impacts by reducing greenhouse gas (GHG) emissions is critical. This 2018 Biennial
Progress Report outlines how our community's greenhouse gas emissions have declined
through successful climate action as well as local, state, and federal policies. We present
accomplishments of our actions as of 2016 (2016 Highlights) and summarize efforts that
will pave the way for further emissions in coming years (Active Initiatives).
Sunnyvale's community-wide GHG emissions were first estimated in 2008. To meet the state's 2020 emissions target, the †City has aimed to reduce emissions to 1990 levels by 2020 (equivalent to 15 percent below the 2008 baseline). The
City's community-wide emissions inventory provides an update on our progress towards this target. It is updated every
two years and follows nationally and internationally accepted protocols for developing community GHG inventories.
Community-wide emissions in 2016 were approximately 12% below 1990 levels. Silicon Valley Clean Energy – the action
with the greatest GHG reduction potential in the CAP – was launched in 2016 and started providing service in 2017. To
recognize the large impact of this single action, 2016 emissions are shown with 2017 SVCE data (grey column) to
demonstrate that an estimated 28% reduction below 1990 levels is possible. Our community's achievements are notable
and integral to creating a systemic change to achieve more ambitious, longer term emissions targets.
Sunnyvale has achieved the State's target greenhouse gas reductions
ahead of the 2020 schedule through the combined efforts of our
community, partners and City staff! We remain committed to sustainability
as a way of life in Sunnyvale, and look forward to continuing our work
together to reduce our climate impact and improve our community's
livability for future generations.
– Mayor Glenn Hendricks
1,200
1,000
800
600
400
200
0Em
issi
ons
(tho
usan
ds
of
MTC
O2e
)
†The 2008 baseline is referenced in lieu of 1990 throughout this report, as 1990 data are not readily available.*25% below 2008. **39% below 2008. + Estimated impact of SVCE by applying 2017 SVCE enrollment data to the City's 2016 emissions.
2008 2014
1990levels
2016
12%below1990*
2016 with SVCE+
28%below1990**
CAP 1.0 At-A-Glance• 129 actions in 10
goal areas
• Targets reductions by 2020 and 2035
• Baseline emissions inventory for 2008
• Focuses on energy, transportation, and waste emissions
• Community Choice Energy is the single action with the largest GHG impact
1990 emissions
“”
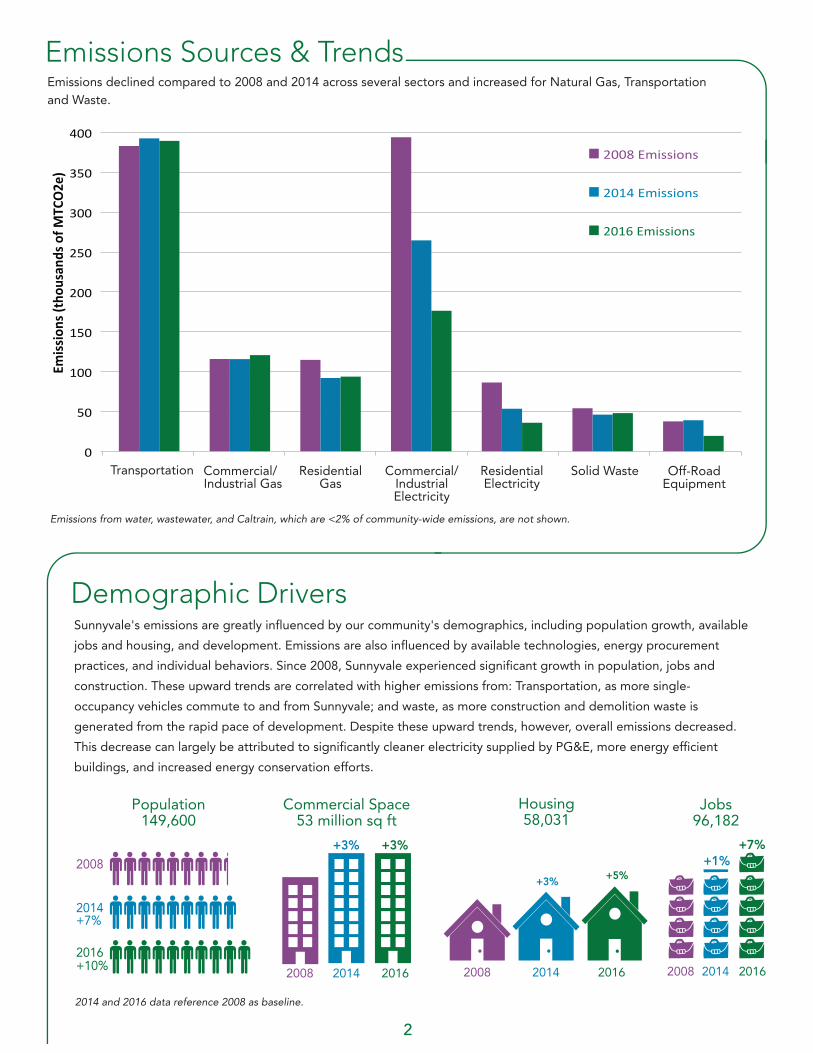
Emissions Sources & Trends
Demographic Drivers
Emissions declined compared to 2008 and 2014 across several sectors and increased for Natural Gas, Transportation and Waste.
Sunnyvale's emissions are greatly influenced by our community's demographics, including population growth, available
jobs and housing, and development. Emissions are also influenced by available technologies, energy procurement
practices, and individual behaviors. Since 2008, Sunnyvale experienced significant growth in population, jobs and
construction. These upward trends are correlated with higher emissions from: Transportation, as more single-
occupancy vehicles commute to and from Sunnyvale; and waste, as more construction and demolition waste is
generated from the rapid pace of development. Despite these upward trends, however, overall emissions decreased.
This decrease can largely be attributed to significantly cleaner electricity supplied by PG&E, more energy efficient
buildings, and increased energy conservation efforts.
Commercial Space53 million sq ft
Housing58,031
20142008 2016
+5%+3%
Transportation
Emissions from water, wastewater, and Caltrain, which are <2% of community-wide emissions, are not shown.
2014 and 2016 data reference 2008 as baseline.
Commercial/Industrial Electricity
ResidentialGas
ResidentialElectricity
Solid Waste Off-RoadEquipment
Population149,600
20142008 2016
+7%+1%
Jobs96,182
Commercial/ Industrial Gas
2008
2014+7%
2016+10%
20142008 2016
+3%+3%
2

2016: 15.9 daily vehicle miles traveled per person 2014: 15.7 miles2008: 15.7 miles
2016: 1,860 electric vehicles in use 2014: 8102008: n/a
2016: 2,034 public & workplace EV chargers 2014: 4672008: n/a
Mobility
20142014 201620162016
2014
201620142008\\\
2016: 909,000 Caltrain rides per year 2014: 746,000 rides2008: 496,000 rides
2016201499
2016: 1.6% commuters ride bikes to work 2014: 1.4% 2008: <1%
2016: 38% students walk or ride bicycles to school 2014: 41%2008: 14%
2016: 132 miles of exclusive bicycle paths and separated lanes 2014: 121 miles2008: n/a
2016 Highlights
Safer Bicycle LanesNearly 11 miles of new designated on-road lanes for bicycles were added. Safer bicycle lanes may encourage more riding and less driving.
Integrated Bicycle and Pedestrian Safety PlanThe new integrated Bicycle and Pedestrian Safety Plan (expected 2019) aims to improve roadway safety and mobility for all road users. Safer streets will encourage walking or bicycling and help reduce transportation emissions.
Driving vehicles powered by gasoline and diesel is the single largest source of emissions in Sunnyvale. Driving an electric vehicle reduces emissions. Choosing to walk, ride a bicycle, or take public transit offsets emissions and helps alleviate traffic congestion. The indicators below represent Sunnyvale's progress in using and promoting alternative modes of transportation.
3

2016: 900 residential units exceeding green building standards2014: 630 units2008: n/a
2014
2016
2016: 1,910 street lights converted to LED2014: 1,8602008: 0
2016h2014
h
2016: 3.8 million square feet of commercial space exceeding green building standards 2014: 2.6 million sq. ft.2008: n/a 2014 2016
$
$2014
2016: 18 energy efficiency rebates through PACE 2014: 9 rebates 2008: PACE not operational
$
$2016
Energy Efficiency and Clean Energy
2016 Highlights
2016:13,230 kW of rooftop solar on homes & offices 2014: 9,790 kW2008: n/a
20142016
Green BuildingsGreen building square footage increased by 45% since 2014 with the City's award-winning incentive-based Green Building Program.
Clean EnergyAs of 2017, 98% of residential and commercial accounts receive carbon-free electricity from Silicon Valley Clean Energy. All City facilities are powered by 100% renewable electricity.
Low-energy LightingThe City is converting 9,500 streetlights across residential and downtown neighborhoods. The new “smart” streetlights use 75% less energy.
4
Energy use is the second largest contributor to Sunnyvale's community-wide emissions. Electricity used in our homes and offices, if generated from conventional sources, such as natural gas, produces carbon emissions. Further, combustion of natural gas for space and water heating in our buildings directly generates carbon emissions. Improving building energy efficiency, reducing natural gas use, and sourcing electricity from renewable sources reduce emissions from energy use.

2016:64% of waste diverted from landfill 2014: 64% 2008: 60%
2016:3.6 lbs. of waste disposed daily per person 2014: 3.6 lbs.2008: 4.1 lbs.
2008 2014 20162008 2014 2016
2016:273 net new trees planted 2014: 160 net removed2008: n/a
2016:101 gallons of daily water use per person 2014: 114 gal 2008: 156 gal
2008 2014 20162014
2016
Natural Resources
2016 Highlights
Less Landfilled Waste55% of residential food scraps were collected in fall 2017 through the new FoodCycle program. Converting food scraps into animal feed will continue to reduce landfilled waste.
Expansion of Recycled Water SystemWith large-scale capital improvements underway at the Water Pollution Control Plant, the City is continuing to improve its recycled water infrastructure and distribution network.
5
Producing, manufacturing and transporting natural resources, like water or everyday goods and services, generates GHG emissions. Reducing the resources we use and responsibly disposing of waste lowers our community's emissions.

Climate Action Plan Update (CAP 2.0)Sunnyvale’s updated CAP 2.0 will contain strategies for reducing emissions by 40% by 2030 and by 80% by 2050 or sooner (relative to 1990 emissions). CAP 2.0 is expected to be adopted December 2018, with implementation planned in the coming years.
New Green Civic CenterThe new City Hall will be a LEED-Platinum building with sustainable features including living roofs, natural lighting and ventilation, and on-site solar generation.
Green Building Program UpdateThe City is revamping its Green Building Program to meet or exceed the state's CalGreen Tier 1 standards.
Active Initiatives
Heat Pump Water Heater StudyThe City Council has approved a study for 2018 to assess the benefits and feasibility of implementing a program to encourage fuel switching from natural gas to electric heat pump water heaters.
6
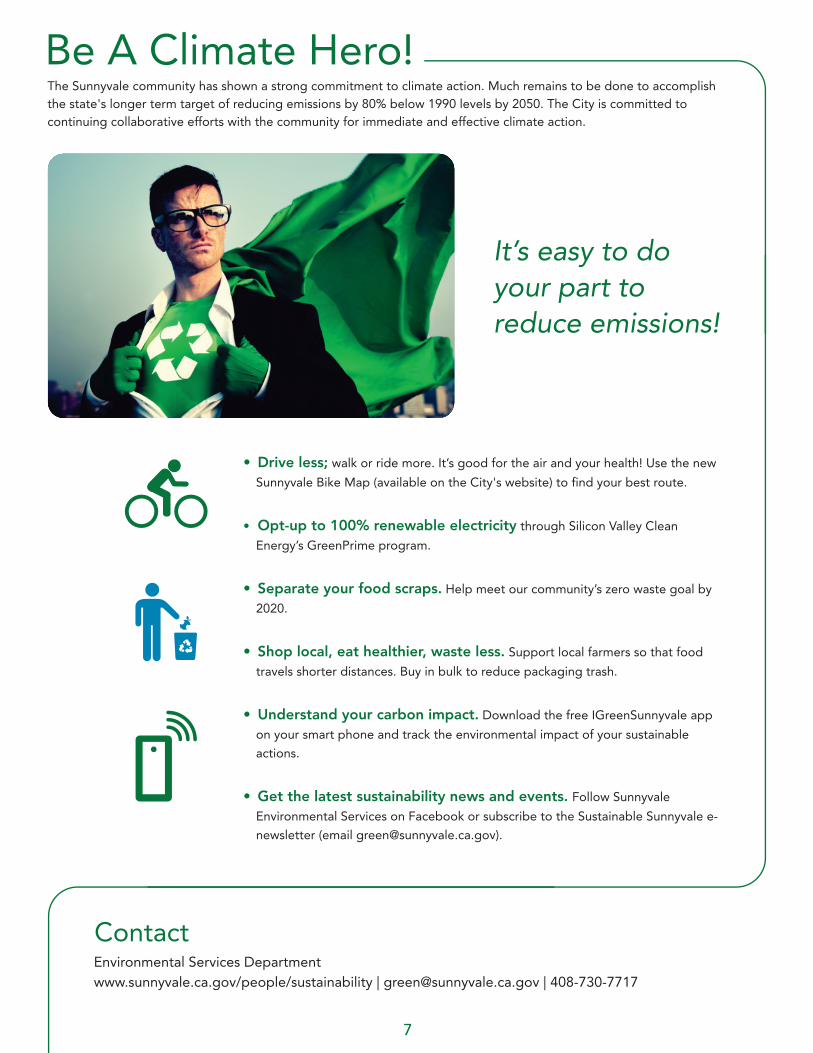
ContactEnvironmental Services Department www.sunnyvale.ca.gov/people/sustainability | [email protected] | 408-730-7717
Be A Climate Hero!
• Drive less; walk or ride more. It’s good for the air and your health! Use the new
Sunnyvale Bike Map (available on the City's website) to find your best route.
• Opt-up to 100% renewable electricity through Silicon Valley Clean
Energy’s GreenPrime program.
• Separate your food scraps. Help meet our community’s zero waste goal by
2020.
• Shop local, eat healthier, waste less. Support local farmers so that food
travels shorter distances. Buy in bulk to reduce packaging trash.
• Understand your carbon impact. Download the free IGreenSunnyvale app
on your smart phone and track the environmental impact of your sustainable
actions.
• Get the latest sustainability news and events. Follow Sunnyvale
Environmental Services on Facebook or subscribe to the Sustainable Sunnyvale e-
newsletter (email [email protected]).
It’s easy to do your part to reduce emissions!
7
The Sunnyvale community has shown a strong commitment to climate action. Much remains to be done to accomplish the state's longer term target of reducing emissions by 80% below 1990 levels by 2050. The City is committed to continuing collaborative efforts with the community for immediate and effective climate action.