sunshot vision study - united states department of energy
TRANSCRIPT

SunShot Vision StudyFebruary 2012

SunShot Vision Study – February 2012 1
1. Introduction 1.1 THE SUNSHOT VISION: DEEP PRICE REDUCTIONS
SPUR RAPID, LARGE-SCALE SOLAR DEPLOYMENT Solar energy offers a number of strategic benefits to the United States. Replacing fossil-fuel combustion with solar energy reduces emissions of human-induced greenhouse gases (GHGs) and air pollutants. Sunlight is a free resource. Thus, once solar technologies are installed, they have very low operating costs and require minimal non-solar inputs—this provides insurance against conventional fuel supply disruptions and price volatility. In addition, growing the domestic solar energy industry could establish the United States as a global leader in solar technology innovation, and support a growing number of solar-related jobs. Despite these benefits, solar energy currently supplies only a small fraction of U.S. energy needs, largely because it historically has cost more than conventional energy sources. However, solar manufacturing costs and sales prices have dropped dramatically over the past few decades, and solar technologies are approaching energy-price parity with conventional generating sources in some regions of the United States and abroad. Further, experience accumulated by solar manufacturers and developers, utilities, and regulatory bodies has shortened the time and expense required to install a fully operating solar system. These gains have come partly through research and development (R&D) and partly through U.S. and global solar market stimulation. An additional strong, coordinated effort could enable solar energy technologies to become increasingly cost competitive with conventional electricity-generation technologies in the United States. over the next decade. The U.S. Department of Energy (DOE) is providing this type of strong, coordinated effort through its SunShot Initiative. Launched in 2011, the SunShot Initiative aims to reduce the price of solar energy systems by about 75% between 2010 and 2020. Achieving this target is expected to make the unsubsidized cost of solar energy competitive with the cost of other currently operating energy sources, paving the way for rapid, large-scale adoption of solar electricity across the United States. To assess the potential benefits and impacts of achieving the SunShot Initiative targets, DOE’s Solar Energy Technologies Program (SETP) produced this SunShot Vision Study. This study assumes that the SunShot price targets are achieved by
Achieving the level of price reductions envisioned in the SunShot Initiative could result in solar meeting 14% of U.S. electricity needs by 2030 and 27% by 2050. However, realizing these price and installation targets will require a combination of evolutionary and revolutionary technological changes.
INTRODUCTION
1
2 SunShot Vision Study – February 2012
2020 and models the resulting penetration of solar technologies in the United States. Solar growth based on non-cost factors (e.g., GHG-reduction and energy security benefits) is not considered in this analysis, but could result in additional solar market penetration. The results suggest that solar energy could satisfy roughly 14% of U.S. electricity demand by 2030 and 27% by 2050.5 These levels of solar penetration represent a dramatic transformation of the U.S. electricity system. Based on the scenario assumptions discussed in Section 1.4, the projected benefits of achieving the SunShot targets versus a reference case projection could include the following:
Displacing the use of about 2.6 quadrillion British thermal units (Quads) of natural gas and 0.4 Quads of coal per year by 2030, and about 1.5 Quads of natural gas and 7.3 Quads of coal per year by 2050. This corresponds to a fuel savings of about $34 billion per year by 2030 and $41 billion per year by 2050.
Reducing annual electric-sector carbon-dioxide (CO2) emissions 8% below projected reference case levels in 2030 and 28% below projected reference case levels in 2050, equivalent to taking 30 and 130 million cars off the road.
Reducing emissions of other pollutants including mercury, nitrogen oxides, sulfur oxides, and particulate matter.
Supporting roughly 290,000 new solar-related jobs by 2030 and 390,000 new solar-related jobs by 2050.
Reducing retail electricity rates by 0.6 cents/kilowatt-hour (kWh) in 2030 and 0.9 cents/kWh in 2050 compared to the reference scenario.
Saving electricity consumers across all market sectors about $30 billion per year by 2030 and $50 billion per year by 2050.
This chapter begins by providing basic information about solar energy technologies and the status and potential of solar energy in the United States. Next, the SunShot scenario and analysis methodology are summarized, and several electric-sector impacts of achieving the SunShot targets are discussed. Finally, potential barriers to realizing the level of solar market penetration envisioned in the SunShot scenario—and strategies for overcoming them—are discussed. The body of the report contains all supporting details and references.
1.2 SOLAR ENERGY BASICS There are two major categories of solar energy technologies included in this study, which are distinguished by the way they convert sunlight into electricity: photovoltaics (PV) and concentrating solar power (CSP). PV employs a semiconductor material—traditionally silicon but, increasingly, other materials as well—to convert sunlight directly into electricity. Sunlight enters a PV
5 All results in this report refer to the contiguous United States (excluding Alaska and Hawaii) unless otherwise noted, e.g., solar technologies are projected to satisfy roughly 14% of contiguous U.S. electricity demand by 2030 and 27% by 2050.

INTRODUCTION
1
SunShot Vision Study – February 2012 3
module and is converted into direct-current (DC) electricity. For applications that are connected to the electrical grid, an inverter transforms this DC electricity into the alternating-current (AC) electricity that the grid carries. In this report, relatively small PV systems installed on structures such as rooftops, parking garages, and awnings, are called distributed or rooftop PV systems. Rooftop PV systems range in size from a few kilowatts (kW) for residential systems to hundreds of kilowatts or a few megawatts (MW) on large commercial roofs. Larger systems installed on the ground are called utility-scale PV. These systems can range from a few megawatts to hundreds of megawatts. Large utility-scale systems greater than 20 MW are typically connected to the electricity-transmission system which transmits electricity from generating plants to electrical substations. Smaller utility-scale systems can be located near areas of high-electricity demand and be connected to the electricity-distribution system which distributes electricity from electrical substations to end users. CSP uses mirrors or lenses to concentrate sunlight and produce intense heat, which is used to produce electricity via a thermal energy conversion process similar to those used in conventional power plants. Several CSP technologies accomplish this by using concentrated sunlight to heat a fluid, boil water with the heated fluid, and channel the resulting steam through a steam turbine to produce electricity. An alternate approach uses gases heated with concentrated sunlight to drive a closed cycle heat engine that produces electricity. Most CSP systems can incorporate thermal energy storage or natural gas back-up, which can be used to smooth out short-term transients (e.g., collector shading from passing clouds) and enable CSP systems to continue producing electricity during the late afternoon and evening hours. Adding multiple hours of storage to CSP systems is critical because it is an enabler for the integration of substantial solar and wind generation in the SunShot scenario. Although some CSP technologies are capable of being deployed at the distributed level, most are designed for utility-scale operation and connected to the electricity-transmission system.
1.3 SOLAR ENERGY HISTORY, STATUS, AND POTENTIAL In 2010, solar energy provided less than 0.1% of U.S. electricity demand. This is comparable to the amount supplied by nuclear energy in 1960, which subsequently grew to 11% by 1980 and to 19% by 1990 (EIA 2010a). Over the past decade, U.S. solar deployment has lagged behind deployment in European and Asian countries, primarily because these countries instituted strong solar-promoting policies, while solar policies in the United States were limited and inconsistent. In considering the potential for future growth, it is useful to examine historical growth rates in global markets. Figure 1-1 shows the regional PV cell and module shipments from the United States, Japan, Europe, China/Taiwan, and the rest of the world (ROW) over the past decade. Between 2000 and 2010, PV module shipments achieved a compound annual growth rate of 53%, reaching 17 gigawatts (GW) of annual module shipments in 2010, and
The global PV market has achieved a 53% annual growth rate, on average, over the past decade.

INTRODUCTION
1
4 SunShot Vision Study – February 2012
bringing the cumulative global PV shipments to about 40 GW. Although the United States accounted for 30% of global shipments in 2000, the U.S. market share declined significantly during the past decade. In 2010, the United States accounted for only 6% (about 1,000 MW) of PV module supply and only 8% (or about 1,400 MW) of demand (Mints 2011a, Mints 2011b). As of mid-2011, continued R&D and market forces have helped reduce PV prices sharply and, together with a mix of state and federal policies, have positioned the U.S. PV market for rapid future growth. Historically, CSP market growth has been sporadic. After a number of CSP plants were built in California in the late 1980s, almost 15 years passed before the next commercial CSP plant was built, followed by a number of new plants in the United States and Spain during 2007–2010. By the end of 2010, global CSP capacity was about 1,300 MW, with 512 MW in the United States and most of the rest in Spain. In the United States, almost 10 GW of CSP projects were under various stages of development at the end of 2010. Even if only a small fraction of these projects are built, the industry will experience very rapid growth in the near future. Although solar energy’s contribution to U.S. energy supply has been small to date, its technical potential is enormous. For example, one estimate suggested that the area required to supply an amount of electricity equivalent to all end-use electricity in the United States using PV is only about 0.6% of the country’s total land area (Denholm and Margolis 2008).6 PV can also be installed on rooftops with essentially 6 This calculation is based on deployment/land in the entire United States (including Alaska and Hawaii).
Figure 1-1. Regional PV Cell and Module Shipments, 2000–2010
Source: Mints (2011a)
Almost 10 GW of CSP projects were under development in the United States at the end of 2010.

INTRODUCTION
1
SunShot Vision Study – February 2012 5
no land-use impacts. About 17,500 terawatt-hours (TWh) of annual CSP electricity generation—more than four times the current U.S. annual demand—could be sited in seven southwestern states on land that was screened for use restrictions and technical requirements such as solar insolation and land slope.
1.4 MODELING THE SUNSHOT SCENARIO The SunShot Vision Study models the potential impact of achieving the SunShot price reduction targets by 2020 in the U.S. electric sector through 2050. To understand how this scenario evolves, the effects in 2030 (10 years after the price targets are achieved) and 2050 (30 years after the price targets are achieved) are highlighted here. 1.4.1 DEFINING THE SUNSHOT AND REFERENCE SCENARIOS For the SunShot scenario, solar technology installed system prices were assumed to reach the SunShot Initiative’s targets by 2020: $1/watt (W) for utility-scale PV systems, $1.25/W for commercial rooftop PV, $1.50/W for residential rooftop PV, and $3.60/W for CSP systems with 14 hours of thermal storage capacity.7 These installed system prices represent a set of very aggressive, but technically possible targets that would translate into solar technology having a similar levelized cost of energy (LCOE) as competing electricity sources in each market segment. In other words, $1/W for PV and $3.60/W for CSP is expected to enable these solar technologies to be competitive in the wholesale electricity market, while $1.25/W is expected to enable PV to be competitive in the commercial retail market, and $1.50/W is expected to enable PV to be competitive in the residential retail market. For the purposes of modeling the SunShot scenario, these installed system prices are assumed to remain constant through the 2020–2050 time frame, i.e., no further price reductions are modeled for solar technologies beyond 2020. Installed system price estimates for the development of all conventional and other renewable (including wind) electricity-generating technologies are based on Black & Veatch (forthcoming). Fuel prices and price elasticities are based on the Energy Information Administration’s (EIA’s) Annual Energy Outlook 2010 (AEO 2010) (EIA 2010b) and are extrapolated through 2050 based on modeled fuel demand. Unless otherwise noted, all prices and values in the SunShot Vision Study are given in 2010 U.S. dollars. Future costs are discounted using a 7% real discount rate, per guidance from the U.S. Office of Management and Budget (OMB 2003). A reference scenario with moderate solar energy price reductions was also modeled to enable comparison of the costs, benefits, and challenges of achieving the SunShot price targets. Future installed system price estimates for all technologies, including solar, are based on Black & Veatch (forthcoming) in the reference scenario. In both the SunShot and reference scenarios, electricity demand is assumed to increase by about 1% per year through 2050. This assumption is consistent with projections through 2035 provided by EIA (2010b), and an extension of EIA’s projected trend through 2050. At this rate, demand reaches about 4,400 TWh by 2030 and 5,100 7 Note that throughout this report, all “$/W” units refer to 2010 U.S. dollars per peak watt-direct current (DC) for PV and 2010 U.S. dollars per watt-alternating current (AC) for CSP, unless specified otherwise.

INTRODUCTION
1
6 SunShot Vision Study – February 2012
TWh by 2050. Table 1-1provides a breakdown of PV and CSP prices including benchmarked prices in 2010 and projected prices in 2020 for both the SunShot and reference scenarios.
Several modeling tools were used to develop and evaluate the SunShot and reference scenarios. The Regional Energy Deployment System (ReEDS) capacity-expansion model, developed at the National Renewable Energy Laboratory (NREL), simulated the least-cost deployment and operation of utility-scale electricity-generating resources in the reference and SunShot scenarios. The Solar Deployment System (SolarDS) model, also developed at NREL, simulated the evolution of the residential and commercial rooftop PV markets. These models evaluated the trade-offs between solar resource quality, cost of electricity, transmission requirements, and other factors to determine a least-cost geographical deployment of the various solar technologies and configurations. Similarly, the remaining mix of electricity-generating technologies (conventional and other renewable) were determined on a least-cost basis, with considerations including the impacts of variability, reserve requirements, and projected fuel prices. The scenarios assume the federal investment tax credit (ITC) and production tax credit (PTC) run through their currently established expiration dates—end of 2016 and 2012, respectively—but that existing supports for conventional technologies that are embedded in the tax code or through other provisions continue indefinitely. Further, the scenarios do not incorporate any additional costs for mercury and air toxins, carbon emissions, or other environmental externalities associated most strongly with conventional generation technologies. In addition, GridView—a production-cost model frequently used by electric service providers to schedule and dispatch generation resources—was used to verify the real-world operability of the SunShot scenario. 1.4.2 SOLAR GROWTH RESULTS Achieving the SunShot targets is projected to result in the cumulative installation of approximately 302 GW of PV and 28 GW of CSP by 2030. By 2050, the cumulative installed capacities are projected to increase to 632 GW of PV and 83 GW of CSP. To achieve this level of cumulative installed capacity, annual installations would need to reach about 25–30 GW for PV and about 3–4 GW for CSP. Solar grows much more slowly in the reference scenario (Figure 1-2).
Table 1-1. Benchmarked 2010 Solar Prices and Projected 2020 Solar Prices (2010$/W)
Technology/Market Benchmark 2010 Price
Reference 2020 Price
SunShot 2020 Price
Utility-Scale PV ($/WDC) 4.00 2.51 1.00 Commercial Rooftop PV ($/WDC) 5.00 3.36 1.25 Residential Rooftop PV ($/WDC) 6.00 3.78 1.50 CSP ($/WAC) 7.20a 6.64a 3.60b
a CSP system with 6 hours of thermal storage b CSP system with 14 hours of thermal storage

INTRODUCTION
1
SunShot Vision Study – February 2012 7
By 2030, the SunShot scenario levels of installations translate into PV generating 505 TWh of electricity, or 11% of total electricity demand, and CSP generating 137 TWh, or 3% of total demand. By 2050, PV is projected to generate 1,036 TWh, or 19% of total demand, and CSP is projected to generate 412 TWh, or 8% of total demand. Table 1-2 summarizes the electricity generation and installed capacity of PV and CSP in 2030 and 2050.
Figure 1-3 shows the geographical deployment of PV and CSP under the SunShot scenario in 2030 and 2050. Strong PV markets develop in all U.S. states, while CSP is primarily deployed in the arid Southwest, where direct-normal irradiance (DNI)—the intense sunlight needed for CSP—is highest. The SunShot scenario results shown in Figure 1-2 and Figure 1-3 present a case in which solar plays an increasingly important role in the U.S. electricity-generation system. Some sensitivity analyses are also discussed in the accompanying text box and Appendix C. Additional sensitivity analysis will be published in supplementary technical reports.
Figure 1-2. Total Solar Capacity under the SunShot and Reference Scenarios
Table 1-2. Overview of SunShot Scenario Results
Year Technology Electricity Generation (TWh)
Installed Capacity (GW)
2030 PV 505 302
CSP 137 28
2050 PV 1,036 632
CSP 412 83

INTRODUCTION
1
8 SunShot Vision Study – February 2012
1.4.3 DIFFERENCES BETWEEN PV AND CSP DEPLOYMENT AND ELECTRICITY PRODUCTION
In the SunShot scenario, approximately 11 times more PV capacity than CSP capacity would be installed by 2030, and 8 times more by 2050. However, the amount of electricity produced by PV is only 4 times greater than the amount of electricity produced by CSP in 2030 and only 3 times greater in 2050. CSP produces more electrical energy per unit of capacity because, on average, CSP is deployed where solar resources are higher, CSP systems always use solar tracking, and CSP resources are deployed with several hours of thermal storage capacity which significantly increases the capacity factor of a CSP plant. The collector area for a CSP system can be expanded significantly to collect solar energy in excess of the peak load requirements of the power generator (also called the power block) and storing it as thermal energy, which can be used to generate electricity during non-sunny times of the day or into the evening and nighttime. In contrast, the peak power for PV is determined by the size, efficiency, and location of the collector area, and the capacity factor is determined by the local solar resource and the ability to track the sun. The higher deployment of PV compared with CSP occurs for several reasons that are related to the cost and value of electricity produced by each of the technologies. First, the price per unit of capacity is lower for PV ($1.00–$1.50/W) than for CSP ($3.60/W); thus, much more PV capacity than CSP capacity can be installed for a given amount of investment. This factor is particularly important through 2030,
Figure 1-3. Cumulative Installed PV and CSP Capacity in the SunShot Scenario in 2030 and 2050
2050 PV Capacity: 632 GW 2030 PV Capacity: 302 GW
> 50 30 - 50 10 - 30 5 - 10 1 - 5
0.5 - 1 < 0.5
PV Capacity (GW)
> 20 15 - 20 10 - 15 5 - 10 1 - 5
0.5 - 1 < 0.5
CSP Capacity (GW)
2030 CSP Capacity: 28 GW 2050 CSP Capacity: 83 GW

INTRODUCTION
1
SunShot Vision Study – February 2012 9
when solar is at relatively low levels of market penetration. Under these conditions, peak PV electricity generation coincides with the hours of peak electricity demand, and peak electricity prices, corresponding to a relatively high PV capacity value. However, after 2030, PV generation begins to saturate the peak electricity-demand window, CSP with energy storage becomes increasingly more valuable to the system, and CSP markets begin to grow more rapidly. Second, residential and commercial rooftop PV systems generate electricity at the customer’s facility, and thus PV competes largely against retail rather than wholesale electricity prices. This enables PV to compete in a broader set of markets with higher electricity prices than CSP. Third, because CSP must be built in areas with good DNI, CSP deployment is constrained primarily to the Southwest. This constraint also means that new transmission lines may need to be built to carry CSP-generated electricity to demand centers, which slows deployment and adds cost. In contrast, PV can be deployed economically in a wider geographic area, including in close proximity to demand centers, which reduces the expense and time required to develop new transmission infrastructure.
Sensitivity of SunShot Scenario Results to Renewable Target and Price Assumptions
Sensitivity analyses indicate that there is a solar price threshold at which solar deployment increases non-linearly as price decreases. As shown in Figure A, in order to explore the sensitivity of solar deployment to solar technology prices, solar deployment was modeled using two price scenarios, in addition to the SunShot and reference scenarios. These two scenarios included cost reductions that were less aggressive than the SunShot targets: 1) Photovoltaic (PV) prices decline by 50% between 2010 and 2020, and 2) PV prices decline 62.5% between 2010 and 2020. Both sensitivity cases included comparable price declines for CSP. Additional sensitivity analyses indicate that assuming larger price reductions for non-solar renewable technologies in the SunShot scenario would result in higher penetration of those technologies, particularly wind. For details see Appendix C.
Figure A. Solar Capacity under a Range of SunShot Solar Price-Reduction Scenarios
INTRODUCTION
1
10 SunShot Vision Study – February 2012
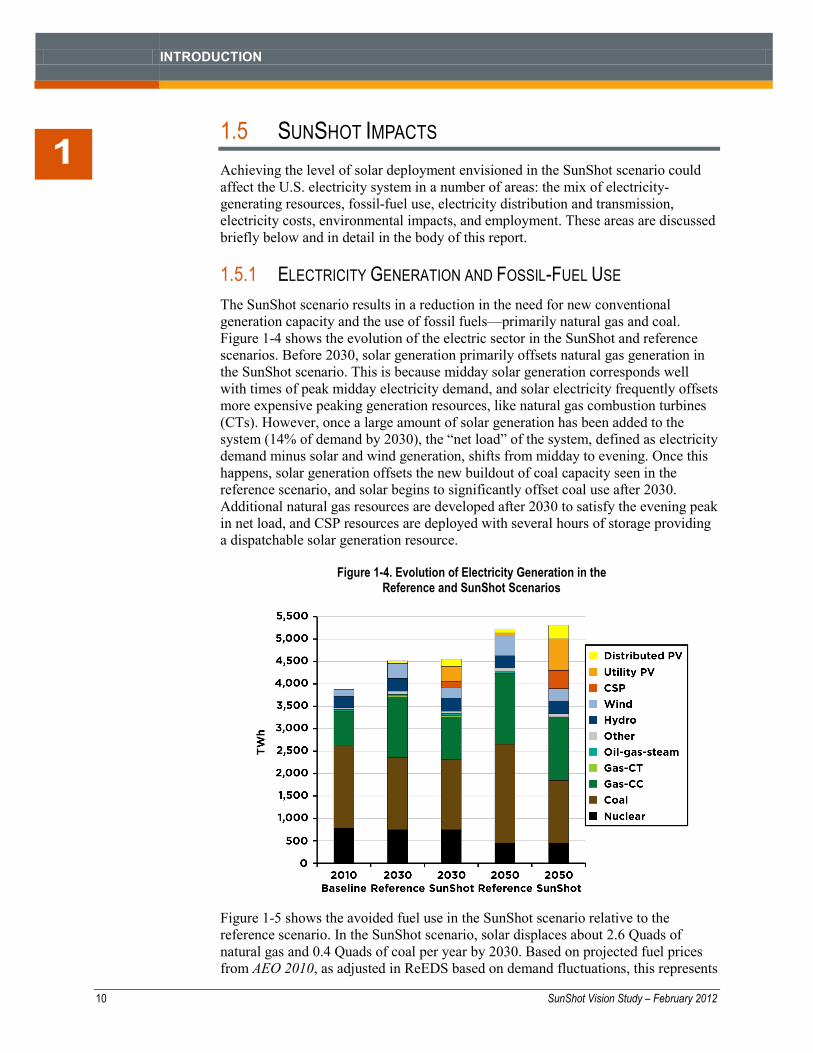
1.5 SUNSHOT IMPACTS Achieving the level of solar deployment envisioned in the SunShot scenario could affect the U.S. electricity system in a number of areas: the mix of electricity-generating resources, fossil-fuel use, electricity distribution and transmission, electricity costs, environmental impacts, and employment. These areas are discussed briefly below and in detail in the body of this report. 1.5.1 ELECTRICITY GENERATION AND FOSSIL-FUEL USE The SunShot scenario results in a reduction in the need for new conventional generation capacity and the use of fossil fuels—primarily natural gas and coal. Figure 1-4 shows the evolution of the electric sector in the SunShot and reference scenarios. Before 2030, solar generation primarily offsets natural gas generation in the SunShot scenario. This is because midday solar generation corresponds well with times of peak midday electricity demand, and solar electricity frequently offsets more expensive peaking generation resources, like natural gas combustion turbines (CTs). However, once a large amount of solar generation has been added to the system (14% of demand by 2030), the “net load” of the system, defined as electricity demand minus solar and wind generation, shifts from midday to evening. Once this happens, solar generation offsets the new buildout of coal capacity seen in the reference scenario, and solar begins to significantly offset coal use after 2030. Additional natural gas resources are developed after 2030 to satisfy the evening peak in net load, and CSP resources are deployed with several hours of storage providing a dispatchable solar generation resource.
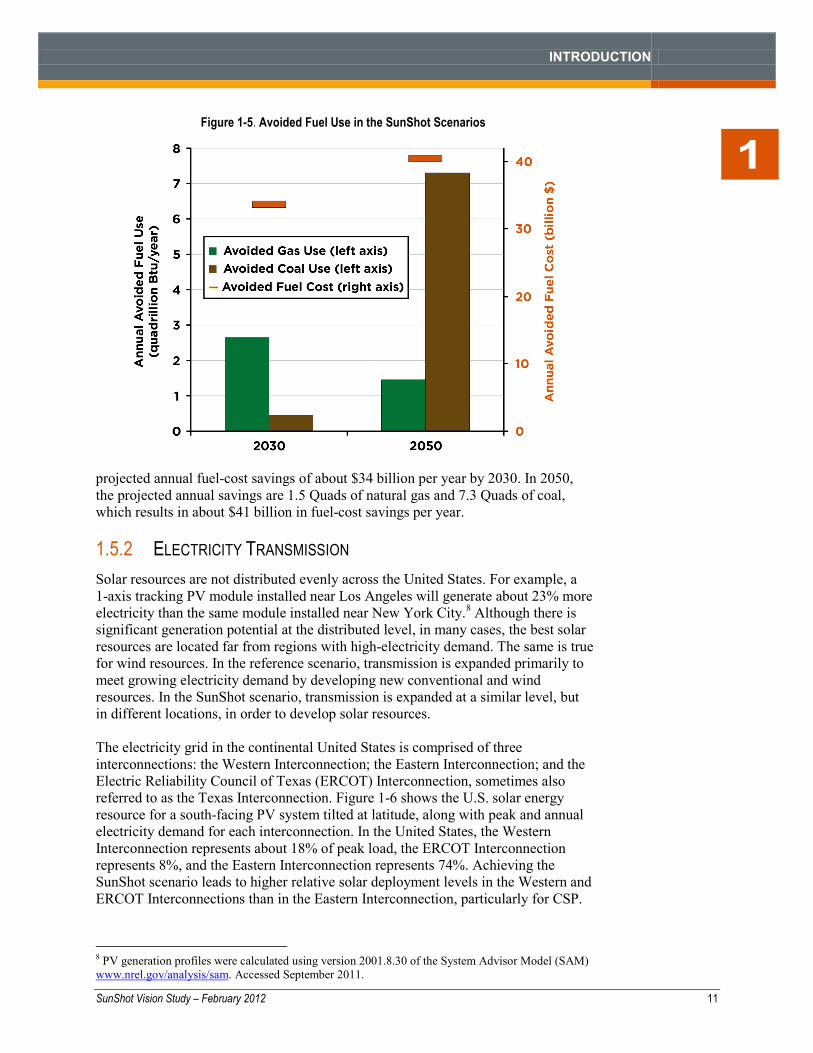
Figure 1-5 shows the avoided fuel use in the SunShot scenario relative to the reference scenario. In the SunShot scenario, solar displaces about 2.6 Quads of natural gas and 0.4 Quads of coal per year by 2030. Based on projected fuel prices from AEO 2010, as adjusted in ReEDS based on demand fluctuations, this represents
Figure 1-4. Evolution of Electricity Generation in the Reference and SunShot Scenarios
INTRODUCTION
1
SunShot Vision Study – February 2012 11
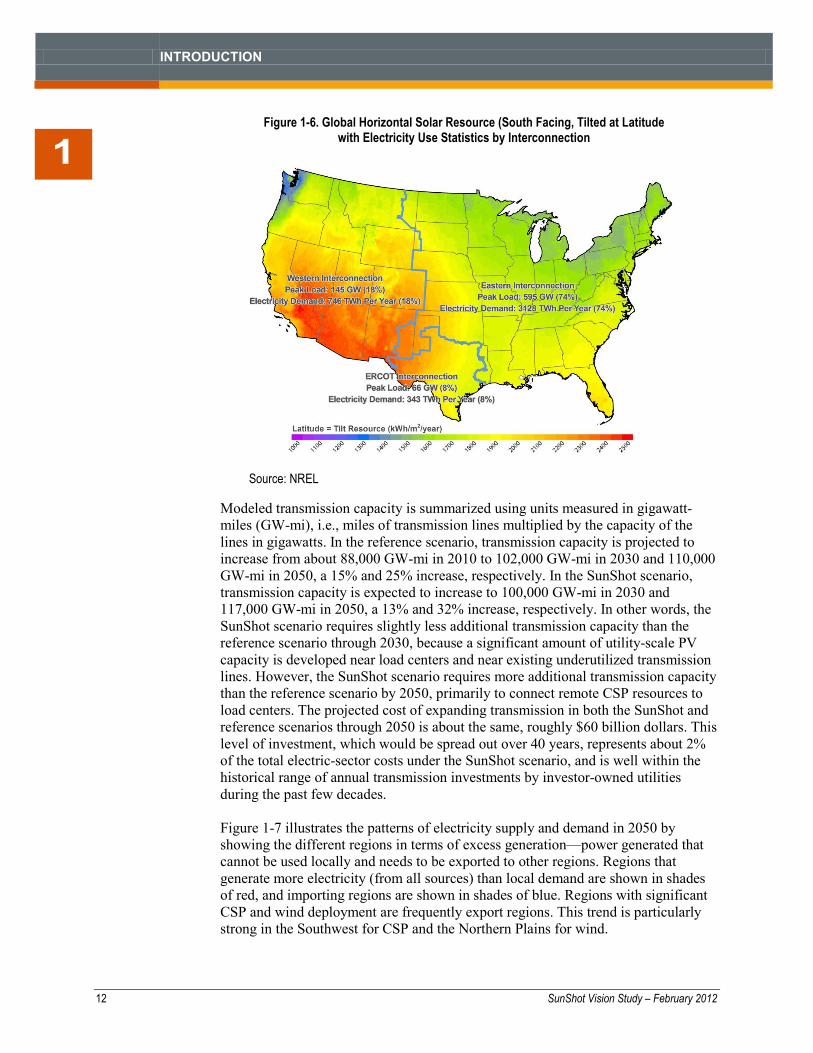
projected annual fuel-cost savings of about $34 billion per year by 2030. In 2050, the projected annual savings are 1.5 Quads of natural gas and 7.3 Quads of coal, which results in about $41 billion in fuel-cost savings per year. 1.5.2 ELECTRICITY TRANSMISSION Solar resources are not distributed evenly across the United States. For example, a 1-axis tracking PV module installed near Los Angeles will generate about 23% more electricity than the same module installed near New York City.8 Although there is significant generation potential at the distributed level, in many cases, the best solar resources are located far from regions with high-electricity demand. The same is true for wind resources. In the reference scenario, transmission is expanded primarily to meet growing electricity demand by developing new conventional and wind resources. In the SunShot scenario, transmission is expanded at a similar level, but in different locations, in order to develop solar resources. The electricity grid in the continental United States is comprised of three interconnections: the Western Interconnection; the Eastern Interconnection; and the Electric Reliability Council of Texas (ERCOT) Interconnection, sometimes also referred to as the Texas Interconnection. Figure 1-6 shows the U.S. solar energy resource for a south-facing PV system tilted at latitude, along with peak and annual electricity demand for each interconnection. In the United States, the Western Interconnection represents about 18% of peak load, the ERCOT Interconnection represents 8%, and the Eastern Interconnection represents 74%. Achieving the SunShot scenario leads to higher relative solar deployment levels in the Western and ERCOT Interconnections than in the Eastern Interconnection, particularly for CSP.
8 PV generation profiles were calculated using version 2001.8.30 of the System Advisor Model (SAM) www.nrel.gov/analysis/sam. Accessed September 2011.
Figure 1-5. Avoided Fuel Use in the SunShot Scenarios
INTRODUCTION
1
12 SunShot Vision Study – February 2012
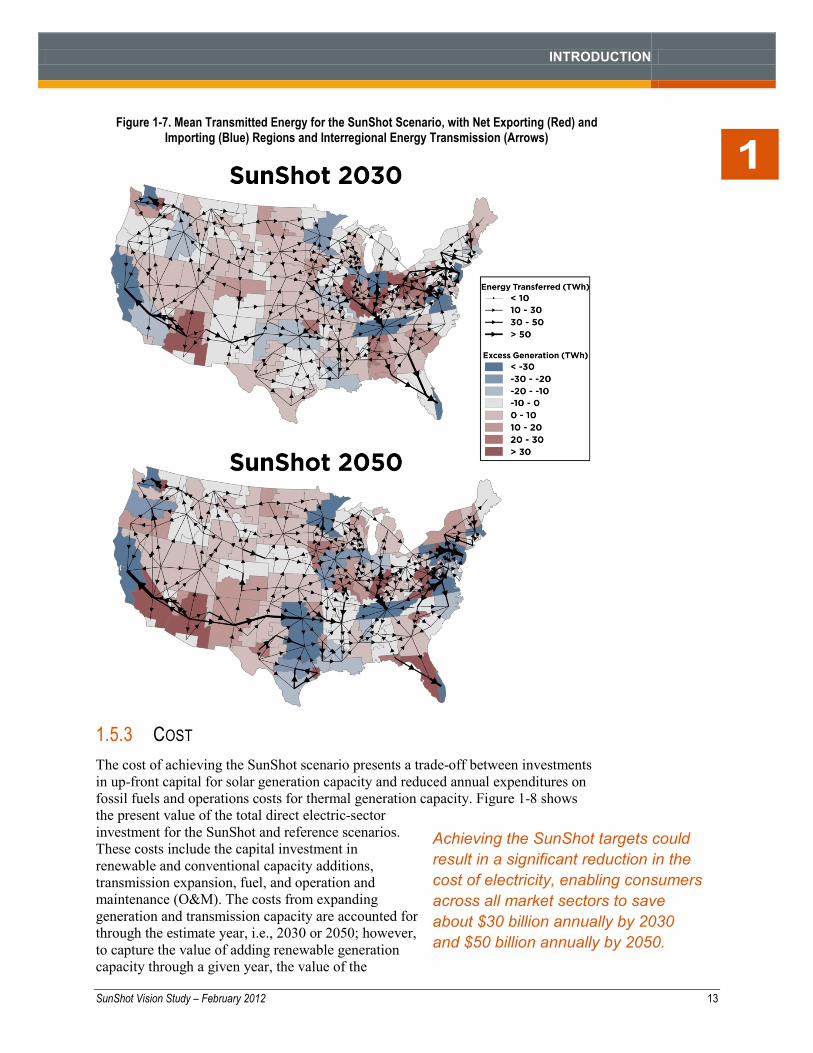
Modeled transmission capacity is summarized using units measured in gigawatt-miles (GW-mi), i.e., miles of transmission lines multiplied by the capacity of the lines in gigawatts. In the reference scenario, transmission capacity is projected to increase from about 88,000 GW-mi in 2010 to 102,000 GW-mi in 2030 and 110,000 GW-mi in 2050, a 15% and 25% increase, respectively. In the SunShot scenario, transmission capacity is expected to increase to 100,000 GW-mi in 2030 and 117,000 GW-mi in 2050, a 13% and 32% increase, respectively. In other words, the SunShot scenario requires slightly less additional transmission capacity than the reference scenario through 2030, because a significant amount of utility-scale PV capacity is developed near load centers and near existing underutilized transmission lines. However, the SunShot scenario requires more additional transmission capacity than the reference scenario by 2050, primarily to connect remote CSP resources to load centers. The projected cost of expanding transmission in both the SunShot and reference scenarios through 2050 is about the same, roughly $60 billion dollars. This level of investment, which would be spread out over 40 years, represents about 2% of the total electric-sector costs under the SunShot scenario, and is well within the historical range of annual transmission investments by investor-owned utilities during the past few decades. Figure 1-7 illustrates the patterns of electricity supply and demand in 2050 by showing the different regions in terms of excess generation—power generated that cannot be used locally and needs to be exported to other regions. Regions that generate more electricity (from all sources) than local demand are shown in shades of red, and importing regions are shown in shades of blue. Regions with significant CSP and wind deployment are frequently export regions. This trend is particularly strong in the Southwest for CSP and the Northern Plains for wind.
Figure 1-6. Global Horizontal Solar Resource (South Facing, Tilted at Latitude with Electricity Use Statistics by Interconnection
Source: NREL
INTRODUCTION
1
SunShot Vision Study – February 2012 13
Achieving the SunShot targets could result in a significant reduction in the cost of electricity, enabling consumers across all market sectors to save about $30 billion annually by 2030 and $50 billion annually by 2050.
1.5.3 COST The cost of achieving the SunShot scenario presents a trade-off between investments in up-front capital for solar generation capacity and reduced annual expenditures on fossil fuels and operations costs for thermal generation capacity. Figure 1-8 shows the present value of the total direct electric-sector investment for the SunShot and reference scenarios. These costs include the capital investment in renewable and conventional capacity additions, transmission expansion, fuel, and operation and maintenance (O&M). The costs from expanding generation and transmission capacity are accounted for through the estimate year, i.e., 2030 or 2050; however, to capture the value of adding renewable generation capacity through a given year, the value of the
Figure 1-7. Mean Transmitted Energy for the SunShot Scenario, with Net Exporting (Red) and Importing (Blue) Regions and Interregional Energy Transmission (Arrows)

INTRODUCTION
1
14 SunShot Vision Study – February 2012
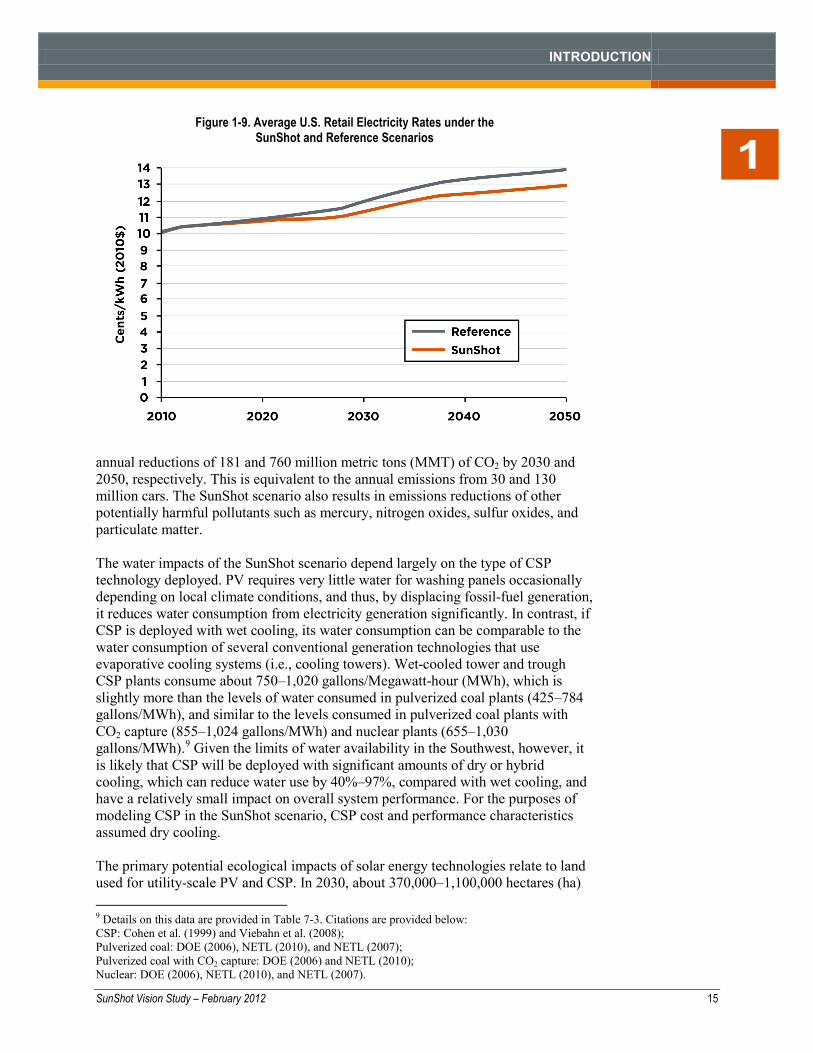
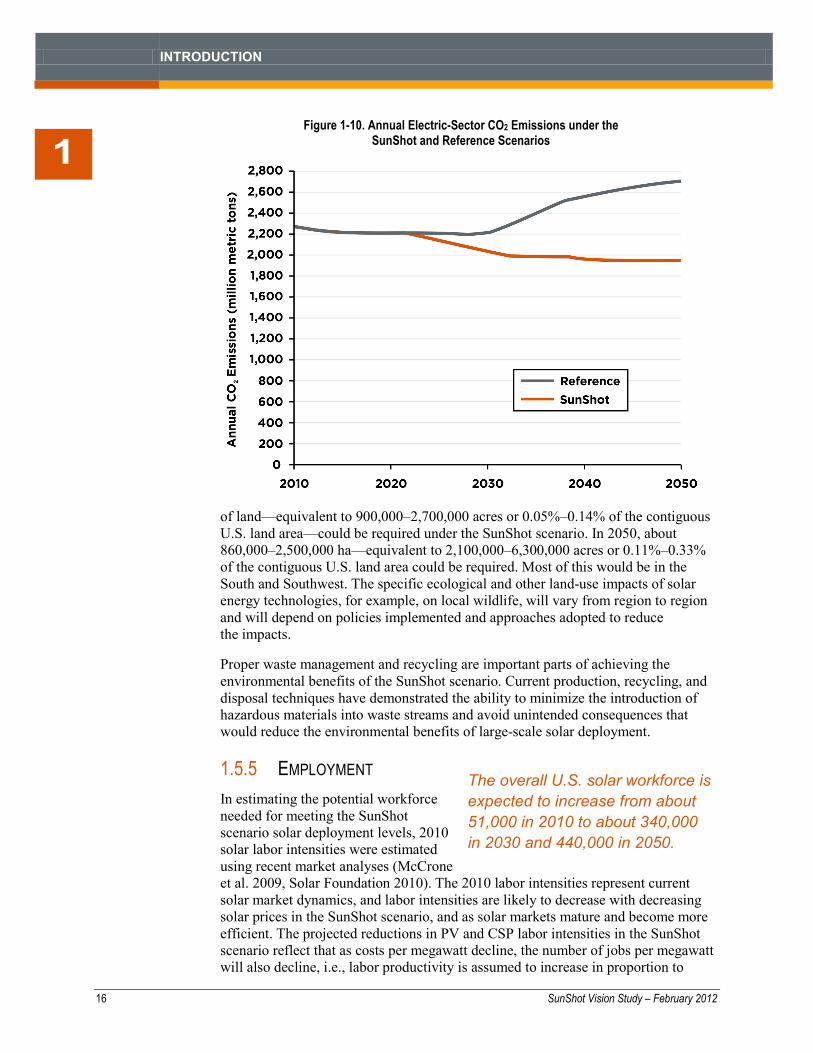
installed capacity’s output, plus fuel and O&M costs for running the system for an additional 20 years, are also included in the cost calculation. The capacity-addition costs include the cost of distributed rooftop PV installations, but do not include potential impacts on electricity-distribution costs. Figure 1-8 shows that the discounted cost of the SunShot scenario is projected to be about 4% below the cost of the reference scenario in 2030 and about 5% below the cost of the reference scenario in 2050. Transmission costs are similar in the SunShot and reference scenarios and are significantly less than generation capacity investments. The impact of achieving the SunShot scenario on the cost of retail electricity is projected to be significant (Figure 1-9). By 2030, the average retail electricity price is about 0.6 cents/kWh less than the price in the reference scenario, saving an average household about $6 per month. By 2050, the electricity price is about 0.9 cents/kWh less than in the reference scenario, or about $9 lower per month, per household. Across all market sectors, the lower electricity prices in the SunShot scenario translate into about $30 billion in annual cost savings by 2030 and $50 billion in annual savings by 2050. 1.5.4 ENVIRONMENT All energy-generating technologies, including solar technologies, affect the environment in many ways. However, the potential for solar technologies to reduce the environmental impacts of energy generation compared with other generating technologies is among the most important reasons for widespread solar use. Significant reductions in U.S. GHG emissions are calculated under the SunShot scenario. As shown in Figure 1-10, total annual electric-sector CO2 emissions in 2030 are 8% lower in the SunShot scenario than in the reference scenario. Annual electric-sector emissions in 2050 are 28% lower in the SunShot scenario than in the reference scenario. Relative to the reference scenario, the SunShot scenario results in
Figure 1-8. Direct Electric-Sector Costs for the Reference and SunShot Scenarios
INTRODUCTION
1
SunShot Vision Study – February 2012 15
annual reductions of 181 and 760 million metric tons (MMT) of CO2 by 2030 and 2050, respectively. This is equivalent to the annual emissions from 30 and 130 million cars. The SunShot scenario also results in emissions reductions of other potentially harmful pollutants such as mercury, nitrogen oxides, sulfur oxides, and particulate matter. The water impacts of the SunShot scenario depend largely on the type of CSP technology deployed. PV requires very little water for washing panels occasionally depending on local climate conditions, and thus, by displacing fossil-fuel generation, it reduces water consumption from electricity generation significantly. In contrast, if CSP is deployed with wet cooling, its water consumption can be comparable to the water consumption of several conventional generation technologies that use evaporative cooling systems (i.e., cooling towers). Wet-cooled tower and trough CSP plants consume about 750–1,020 gallons/Megawatt-hour (MWh), which is slightly more than the levels of water consumed in pulverized coal plants (425–784 gallons/MWh), and similar to the levels consumed in pulverized coal plants with CO2 capture (855–1,024 gallons/MWh) and nuclear plants (655–1,030 gallons/MWh).9 Given the limits of water availability in the Southwest, however, it is likely that CSP will be deployed with significant amounts of dry or hybrid cooling, which can reduce water use by 40%–97%, compared with wet cooling, and have a relatively small impact on overall system performance. For the purposes of modeling CSP in the SunShot scenario, CSP cost and performance characteristics assumed dry cooling. The primary potential ecological impacts of solar energy technologies relate to land used for utility-scale PV and CSP. In 2030, about 370,000–1,100,000 hectares (ha) 9 Details on this data are provided in Table 7-3. Citations are provided below: CSP: Cohen et al. (1999) and Viebahn et al. (2008); Pulverized coal: DOE (2006), NETL (2010), and NETL (2007); Pulverized coal with CO2 capture: DOE (2006) and NETL (2010); Nuclear: DOE (2006), NETL (2010), and NETL (2007).
Figure 1-9. Average U.S. Retail Electricity Rates under the SunShot and Reference Scenarios
INTRODUCTION
1
16 SunShot Vision Study – February 2012
The overall U.S. solar workforce is expected to increase from about 51,000 in 2010 to about 340,000 in 2030 and 440,000 in 2050.
of land—equivalent to 900,000–2,700,000 acres or 0.05%–0.14% of the contiguous U.S. land area—could be required under the SunShot scenario. In 2050, about 860,000–2,500,000 ha—equivalent to 2,100,000–6,300,000 acres or 0.11%–0.33% of the contiguous U.S. land area could be required. Most of this would be in the South and Southwest. The specific ecological and other land-use impacts of solar energy technologies, for example, on local wildlife, will vary from region to region and will depend on policies implemented and approaches adopted to reduce the impacts.
Proper waste management and recycling are important parts of achieving the environmental benefits of the SunShot scenario. Current production, recycling, and disposal techniques have demonstrated the ability to minimize the introduction of hazardous materials into waste streams and avoid unintended consequences that would reduce the environmental benefits of large-scale solar deployment. 1.5.5 EMPLOYMENT In estimating the potential workforce needed for meeting the SunShot scenario solar deployment levels, 2010 solar labor intensities were estimated using recent market analyses (McCrone et al. 2009, Solar Foundation 2010). The 2010 labor intensities represent current solar market dynamics, and labor intensities are likely to decrease with decreasing solar prices in the SunShot scenario, and as solar markets mature and become more efficient. The projected reductions in PV and CSP labor intensities in the SunShot scenario reflect that as costs per megawatt decline, the number of jobs per megawatt will also decline, i.e., labor productivity is assumed to increase in proportion to
Figure 1-10. Annual Electric-Sector CO2 Emissions under the SunShot and Reference Scenarios

INTRODUCTION
1
SunShot Vision Study – February 2012 17
overall system-cost reductions. However, total solar jobs at any point in time are a product of labor intensity and installations. Using this approach, the overall U.S. solar (PV and CSP) workforce is expected to increase from about 51,000 in 2010 to about 340,000 in 2030 and to about 440,000 in 2050. This could support about 290,000 new solar jobs by 2030, and 390,000 new solar jobs by 2050. In the PV-manufacturing environment, labor is readily transferable from other manufacturing industries. Similarly, PV power plant and utility-scale distributed development is likely to draw from the same skilled engineering and construction labor pool as traditional fossil-fuel power plant development. Distributed PV for rooftop projects can use much of the same labor pool as the residential and commercial construction industries, although additional training and certification is required. Additional jobs supported in the PV industry will include accountants, salespeople, engineers, computer analysts, factory workers, truck drivers, mechanics, and so forth. The U.S. PV workforce is expected to grow, in terms of gross jobs, from about 46,000 in 2010 to 280,000 in 2030 and to 363,000 in 2050. These estimates include direct and indirect jobs throughout the PV supply chain, with about 89% and 83% designated under manufacturing and installation in 2030 and 2050, and the remainder in O&M. CSP power plant development is also likely to draw from the same skilled engineering and construction labor pool as traditional fossil-fuel power plant development. The workforce will include laborers, craftsmen, supervisory personnel, support personnel, and construction management personnel. The U.S. CSP workforce is expected to grow, in gross jobs, from about 4,500 in 2010 to 63,000 in 2030 and to 81,000 in 2050. These estimates include direct and indirect jobs throughout the CSP supply chain, with about 85% and 66% designated under manufacturing and installation in 2030 and 2050, and the remainder in O&M.
1.6 REALIZING THE SUNSHOT VISION Several conditions would need to be met to achieve the SunShot Initiative’s price reduction targets and to enable the projected large-scale deployment of solar technologies envisioned in the SunShot scenario. The performance of solar technologies would need to be improved significantly, with a corresponding decrease in the cost of solar energy. An adequate supply of raw materials and manufacturing capabilities would need to be available. Numerous solar installations would need to be sited and integrated with the electricity grid. New financing vehicles that encourage solar growth would need to be implemented, especially in the 2010–2020 time frame before solar prices reach the SunShot targets. Meeting these conditions poses many challenges. However, vast new raw materials supplies, unprecedented manufacturing scale-up, or radical financing and policy approaches will not be required. The challenges to meeting the SunShot Initiative’s price reduction targets and the level of solar deployment envisioned in the SunShot scenario, and potential strategies for addressing these challenges, are discussed briefly below and in detail throughout the body of this report.
INTRODUCTION
1
18 SunShot Vision Study – February 2012
1.6.1 TECHNOLOGY IMPROVEMENTS AND COST REDUCTIONS To realize the SunShot targets, continued solar cost reductions and performance improvements are required. Many solar technologies have been demonstrated commercially since the 1970s or 1980s and have a strong record of cost reductions and performance improvements resulting from R&D investments, manufacturing scale-up, and accumulated experience. The technological progress envisioned in this study is significant, requiring a combination of evolutionary and revolutionary technology improvements. Chapter 4 provides a detailed bottom-up engineering analysis of the opportunities for continued PV cost reductions and compares these cost reductions with historical trends. Key challenges to achieving the levels of PV penetration in the SunShot scenario are evaluated, including manufacturing scale-up and the supply of feedstock materials. To meet the SunShot targets, the total price of PV (and the corresponding LCOE) would need to be reduced by roughly 75% by 2020. This would make residential PV broadly competitive with retail electricity rates, commercial PV broadly competitive with commercial retail electricity rates, and utility-scale PV broadly competitive with utility wholesale electricity rates by 2020. These price reductions would result from a combination of R&D advances, more efficient manufacturing methods, reduced supply chain inefficiencies, and benefits from economies of scale as markets continue to grow and mature.
Chapter 5 provides a similar analysis for CSP technologies, including parabolic trough, linear Fresnel, power tower, and dish/engine technologies. Costs are discussed for all of these technologies; however, the analysis focuses primarily on trough and tower technologies. The potential role of integrating thermal energy storage and/or fossil-fuel hybridization into CSP plant designs as well as a range of component-specific advances are also examined. To meet the SunShot targets, continued R&D and learning-associated improvements would need to reduce the total price of CSP (and the corresponding LCOE) by roughly 70% by 2020. This would make utility-scale CSP broadly competitive with utility wholesale electricity rates by 2020. In particular, adding thermal energy storage or hybridization to CSP plants enables them to serve as dispatchable resources and thus to be more easily integrated into the electricity grid. The dispatchability of CSP also enables it to play a key role in helping to integrate other variable renewable energy technologies—e.g., PV and wind—as discussed in Chapter 6. 1.6.2 RAW MATERIALS PV technologies use a number of materials that could be subject to shortages at the increased production levels required by the SunShot scenario, including tellurium, indium, selenium, gallium, germanium, ruthenium, copper, silver, and molybdenum. The biggest concerns are tellurium and indium for use in PV. As discussed in Chapter 4, to avoid potential material shortages for any of the PV technologies, one or more of the following strategies could be pursued:
Increase efficiency (less material per delivered watt)
Reduce material use through thinner layers
Improve process utilization and in-process recycling

INTRODUCTION
1
SunShot Vision Study – February 2012 19
Increase ore extraction and refining
Shift to using materials that are more abundant. The most important raw materials for CSP, as discussed in Chapter 5, are aluminum, steel, glass, heat-transfer fluid, and molten salt. In general, these materials are not subject to rigid supply limits, but they are affected by changes in commodity prices. 1.6.3 MANUFACTURING SCALE-UP Substantial increases in the manufacturing capacity of PV and CSP components and systems will be required to achieve the SunShot scenario, especially because the rest of the world will likely be scaling up its solar capacity at the same time. However, domestically and globally, these solar industries have demonstrated an ability to scale-up production volumes rapidly and realize associated cost reductions, particularly over the past decade. The PV industry is expanding its manufacturing capacity, helped by new market entrants bringing capital as well as technology, manufacturing, and supply chain management experience, often from other successful industries—e.g., computer semiconductor, liquid crystal display, and specialized material industries. Manufacturing scale-up should not limit the PV deployment envisioned in the SunShot scenario. Manufacturing of many CSP components can draw on the existing capabilities of other industries, such as fossil-fuel boiler manufacturers to produce steam or molten salt receivers and the automotive industry to produce CSP engines. Components unique to CSP systems are made of common materials and are relatively simple in design. Manufacturing scale-up should not present a barrier to achieving the SunShot scenario. 1.6.4 GRID INTEGRATION The variability and uncertainty associated with PV and, to a lesser extent CSP, adds challenges to the operation of the U.S. electricity transmission and distribution systems. To verify that the electricity system can be operated under the SunShot scenario, GridView, a production cost/power flow model made by engineering company ABB, was used to evaluate the ReEDS model’s projected capacity mix and identify operational challenges. In particular, ReEDS and GridView were compared with regard to how they dispatch generation resources, transmit and curtail electricity, and analyze electric-sector fuel use and emissions. A number of conclusions can be drawn from this analysis and from previous wind and solar integration studies. Although the GridView modeling confirmed the basic operational feasibility of the SunShot scenario, meeting both load and reserve requirements during all hours of the year, it also demonstrated the same challenges shown in previous studies of large-scale wind deployment. These include greatly increased rates and ranges over which the generation fleet must ramp, uncertainty in net load, and potential curtailment of variable generation during low-load periods in the spring. As discussed in Chapter 6, a number of strategies can be pursued to increase the ability to integrate variable and uncertain energy resources:
INTRODUCTION
1
20 SunShot Vision Study – February 2012
Increasing the flexibility from conventional generation
Sharing of energy supply, demand, and reserves over larger areas
Incorporating thermal storage or hybridization into CSP systems
Increasing operating reserves
Incorporating forecasting into operations (including operation of distributed PV) and scheduling conventional units over short periods
Employing load/demand-side management or storage technologies to increase system flexibility.
Many of these strategies may guide energy market development to integrate solar in the most cost-effective manner. In general, lower cost and easier integration will result from markets that are more flexible, larger, and more diverse. Increased reliance on load-sited and distributed resources can present both additional challenges and potential benefits to managing the electricity-distribution system. New standards are needed to maintain system reliability and safety, and modifications to PV inverter and distribution equipment may be needed. In addressing many of these challenges, there may also be ways to leverage emerging “smart grid” technologies to enable market participation of customer-sited generation and loads to maximize grid efficiency. 1.6.5 SITING As discussed in Chapter 7, there would be challenges to siting the SunShot scenario’s large and numerous solar installations. One set of challenges applies to utility-scale solar technologies and another to distributed solar technologies. More than enough suitable land is available to enable the SunShot scenario’s utility-scale solar deployment and required transmission expansion. However, it will be important to make careful selection of sites to minimize conflicts with environmental, cultural, and aesthetic interests—particularly with respect to public lands. Even with the most careful land selection, the utility-scale solar development and related transmission expansion will have environmental impacts, especially on portions of the southern United States. These potential impacts—and ways to reduce them—are being studied by various stakeholders. Approaches include identifying solar energy study areas and renewable energy zones that can accommodate solar development with minimal environmental conflicts as well as promoting the use of land already damaged by contamination, mining, and other uses. The regulatory framework for siting utility-scale solar projects and associated transmission infrastructure is complex, costly, and time consuming. Streamlining this process, such as, with clear and consistent criteria that leverage the cooperation of federal, state, and regional authorities, would help to enable the rapid levels of development envisioned in the SunShot scenario. Distributed rooftop solar technologies do not require the use of undeveloped land, but have a unique set of siting challenges. More than enough potential distributed sites are available to achieve the SunShot scenario deployment. Even after accounting for limiting factors such as shading, and orientation, U.S. rooftops alone
INTRODUCTION
1
SunShot Vision Study – February 2012 21
could accommodate more than 600 GW of PV capacity, and additional opportunities exist on sites such as parking structures, awnings, and airports (Denholm and Margolis 2008). Most of the siting challenges distributed PV faces relate to its installation on structures, including complex and variable codes and permits, zoning ordinances, and restrictive covenants. Again, to enable rapid levels of deployment in the SunShot scenario, it would help to streamline and unify distributed solar siting requirements and processes and establish strong solar access and rights laws to protect the rights of consumers to install solar energy systems. 1.6.6 FINANCING Financing the scale of expansion in the SunShot scenario would require significant new investments in the solar manufacturing supply chain and in solar energy projects. Attracting adequate investment to the solar supply chain—such as manufacturing facilities for PV modules and CSP mirrors—should be relatively straightforward because many of the mechanisms for doing so are already well developed and liquid. Financing SunShot scenario-scale solar project deployment—the widespread construction of distributed and central solar electricity-generating plants—is a greater challenge, with different considerations in the pre-2020 and post-2020 periods. As discussed in Chapter 8, building out U.S. PV and CSP manufacturing capacity to meet the level of installations envisioned in the SunShot scenario would require cumulative investments of roughly $25 billion through 2030 and $44 billion through 2050. Although these levels of cumulative investments are not trivial, on an annual basis the required investments would be on the order of $1–$3 billion, well below private sector investments in solar in the United States during the past couple of years. Moreover, the necessary financing instruments and structures are well developed and well understood in the capital markets. Financing solar project deployment under the SunShot scenario, however, will cost much more than financing the supply chain—on the order of $40–$50 billion per year between 2030 and 2050. On a cumulative basis, this translates into roughly $250 billion through 2030 and $375 billion through 2050. To put these numbers into context, it is important to compare them to the total capital required to build all types of electric-generating equipment—conventional and renewable. The difference in total capital required between the SunShot and reference scenarios through 2050 is less than 1%. Thus, it is not so much the total level of investment in electricity generation that needs to change in the SunShot scenario, but the pattern of investment. Securing adequate financing for solar project deployment will be particularly challenging during the pre-2020 period, before solar electricity is cost competitive with other electricity sources. In 2020 and beyond, the availability of cost-competitive solar energy should stimulate private solar investment and facilitate use of mainstream financial instruments.

INTRODUCTION
1
22 SunShot Vision Study – February 2012
1.7 CONCLUSION Achieving the SunShot Initiative’s price reduction targets could enable solar energy to become competitive with other electricity-generation technologies by 2020 and could result in large-scale solar energy deployment through 2030–2050. Private capital would need to be invested to scale up the manufacturing and installation of solar energy technologies. Public investment in R&D and market transformation would be required to enable low-cost, rapid solar growth. The U.S. electrical transmission and distribution systems would need to be optimized to enable rapid solar growth. With these challenges addressed, the potential benefits of the SunShot Initiative—reduced fossil fuel use, lower GHG and other pollutant emissions, and solar job growth—could be realized along with a significant reduction in the projected average retail price of electricity. In short, realizing the price reduction targets of the SunShot Initiative would enable the nation to accelerate its evolution towards a cleaner, more cost-effective, and more secure energy system.
1.8 REFERENCES Black & Veatch Corporation. (forthcoming). Cost and Performance Data for Power
Generation Technologies. In process.
Cohen, G.; Kearney, D.; Drive, C.; Mar, D.; Kolb, G. (1999). Final Report on the Operation and Maintenance Improvement Program for Concentrating Solar Plants. SAND99-1290. Albuquerque, NM: Sandia National Laboratories.
Denholm, P.; Margolis, R. (2008). “Land-Use Requirements and the Per-Capita Solar Footprint for Photovoltaic Generation in the United States.” Energy Policy; 36:3531–3543.
U.S. Energy Information Administration, EIA. (2010a). Annual Energy Review 2009. Report No. DOE/EIA-0384 (2010). Washington, DC: U.S. EIA.
EIA (2010b). Annual Energy Outlook 2010. Report No. DOE/EIA-0383(2010). Washington, DC: U.S. EIA.
McCrone, A.; Peyvan, M.; Zindler, E. (2009). Net Job Creation to 2025: Spectacular in Solar, but Modest in Wind, Research Note. London: New Energy Finance.
Mints, P. (2011a). Photovoltaic Manufacturer Shipments, Capacity & Competitive Analysis 2010/2011. Palo Alto, CA: Navigant Consulting Photovoltaic Service Program. Report NPS-Supply6 (April 2011).
Mints, P. (2011b). Analysis of Worldwide Markets For Solar Products & Five-Year Application Forecast 2010/2011. Palo Alto, CA: Navigant Consulting Photovoltaic Service Program. Report NPS-Global6 (August 2011).
National Energy Technology Laboratory, NETL. (2007). Power Plant Water Usage and Loss Study. 2007 Update. Pittsburgh, PA: National Energy Technology Laboratory.
NETL. (2010). Cost and Performance Baseline for Fossil Energy Plants-Volume 1: Bituminous Coal and Natural Gas to Electricity-Revision 2. DOE/NETL-2010/1397. Pittsburgh, PA: National Energy Technology Laboratory.
INTRODUCTION
1
SunShot Vision Study – February 2012 23
Office of Management and Budget, OMB. (2003). “Circular No. A-4: Memorandum for Heads of Executive Departments and Establishments.” The White House. Washington, DC. September 17, 2003. www.whitehouse.gov/omb/circulars_a004_a-4/. Accessed November 2010.
Solar Foundation. (2010). National Solar Jobs Census 2010. Washington, DC: The Solar Foundation.
U.S. Department of Energy, DOE. (2006). “Energy Demands on Water Resources – Report to Congress on the Interdependency of Energy and Water.” Washington, DC: U.S. Department of Energy. December 2006.
Viebahn, P.; Kronshage, S.; Trieb, F.; Lechon, Y. (2008). Final Report on Technical Data, Costs, and Life Cycle Inventories of Solar Thermal Power Plants. Project no: 502687. European Commission Sixth Framework Programme: NEEDS (New Energy Externalities Developments for Sustainability).
