superior energy serviceslibrary.corporate-ir.net/library/97/975/97570/items/329510/970650d... ·...
TRANSCRIPT

Superior Energy ServicesHoward Weil Energy Conference
March 23, 2009

1
This presentation contains forward-looking statements, including, in particular, statements about Superior Energy’s plans, strategies and prospects. These statements are based on the Company’s current assumptions, expectations and projections about future events, which are subject to a wide range of business risks.
Although the Company believes that the assumptions reflected in these forward-looking statements are reasonable, the Company can give no assurance that these assumptions will prove to be correct or that financial or market forecasts, savings or other benefits anticipated in the forward-looking statements will be achieved.
Forward-looking statements are not guarantees of future performance and actual results may differ materially from those projected. The information contained in this presentation is only current as of a March 23, 2009, and the Company undertakes no obligation to update this presentation.
Forward-Looking Statements
22
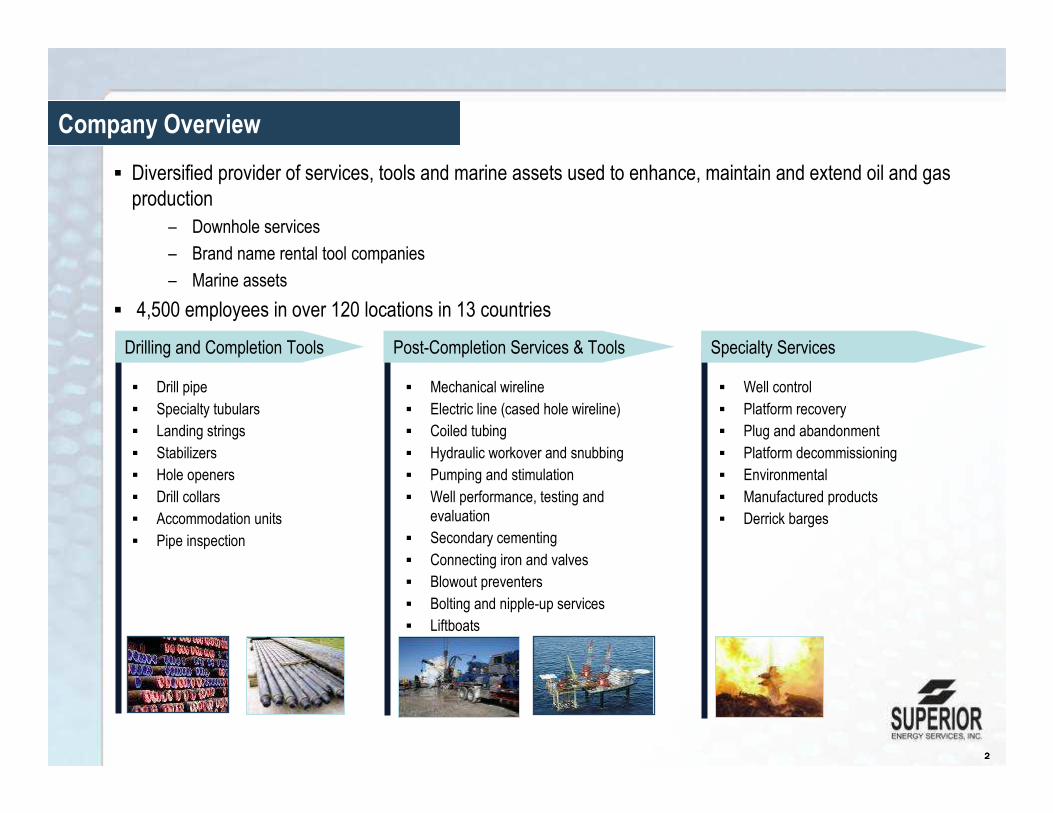
▪ Diversified provider of services, tools and marine assets used to enhance, maintain and extend oil and gas production
– Downhole services
– Brand name rental tool companies
– Marine assets
▪ 4,500 employees in over 120 locations in 13 countries
Company Overview
▪ Drill pipe
▪ Specialty tubulars
▪ Landing strings
▪ Stabilizers
▪ Hole openers
▪ Drill collars
▪ Accommodation units
▪ Pipe inspection
▪ Mechanical wireline
▪ Electric line (cased hole wireline)
▪ Coiled tubing
▪ Hydraulic workover and snubbing
▪ Pumping and stimulation
▪ Well performance, testing and evaluation
▪ Secondary cementing
▪ Connecting iron and valves
▪ Blowout preventers
▪ Bolting and nipple-up services
▪ Liftboats
▪ Well control
▪ Platform recovery
▪ Plug and abandonment
▪ Platform decommissioning
▪ Environmental
▪ Manufactured products
▪ Derrick barges
Drilling and Completion Tools Post-Completion Services & Tools Specialty Services

3
Superior Energy Services 1
Revenue: $1,881.1
EBITDA: $724.6
EBITDA Margin: 38.5%
Year Ending December 31, 2008 ($ in millions)Year Ending December 31, 2008 ($ in millions)
Marine Segment
Revenue: $121.1
EBITDA: $33.7
EBITDA Margin: 27.8%
Labor Intensity: High
Capital Intensity: Low
Segment ProfileWell Intervention Segment
Revenue: $1,155.2
EBITDA: $358.5
EBITDA Margin: 31.0%
Labor Intensity: High
Capital Intensity: Low
Rental Tools Segment
Revenue: $550.9
EBITDA: $274.8
EBITDA Margin: 49.9%
Labor Intensity: Low
Capital Intensity: High
1 Includes revenue of $53.9 million and EBITDA of $57.7 million from the Company’s Oil and Gas Segment (includes SPN Resources and earnings from equity-method investments). On March 14, 2008, Superior sold 75% of its interest in SPN Resources. The remaining 25% interest is accounted for under the equity method.

4
Leading Market Positions
Source: Spears and Associates; Company estimates.
~ 75% of revenue comes from leading market positions in product/service lines integral
to extending, maintaining and enhancing oil and gas production
Product / Service LineMarketPosition
Stabilizers / non-mag drill collar rentals #1
Drill pipe / specialty tubular rentals #2
Hydraulic workover #1
Cased hole wireline #5
Coiled tubing #5
Slickline (Gulf of Mexico / Gulf Coast) #1
Large liftboats (200-ft. of leg and greater) #1
Well control #1
Platform recovery #1
Plug and abandonment (Gulf of Mexico) #1
Drilling andCompletion
Post-CompletionServices
SpecialtyServices

55
Domestic Footprint in Key Producing Basins

6
Emerging Global Footprint
7
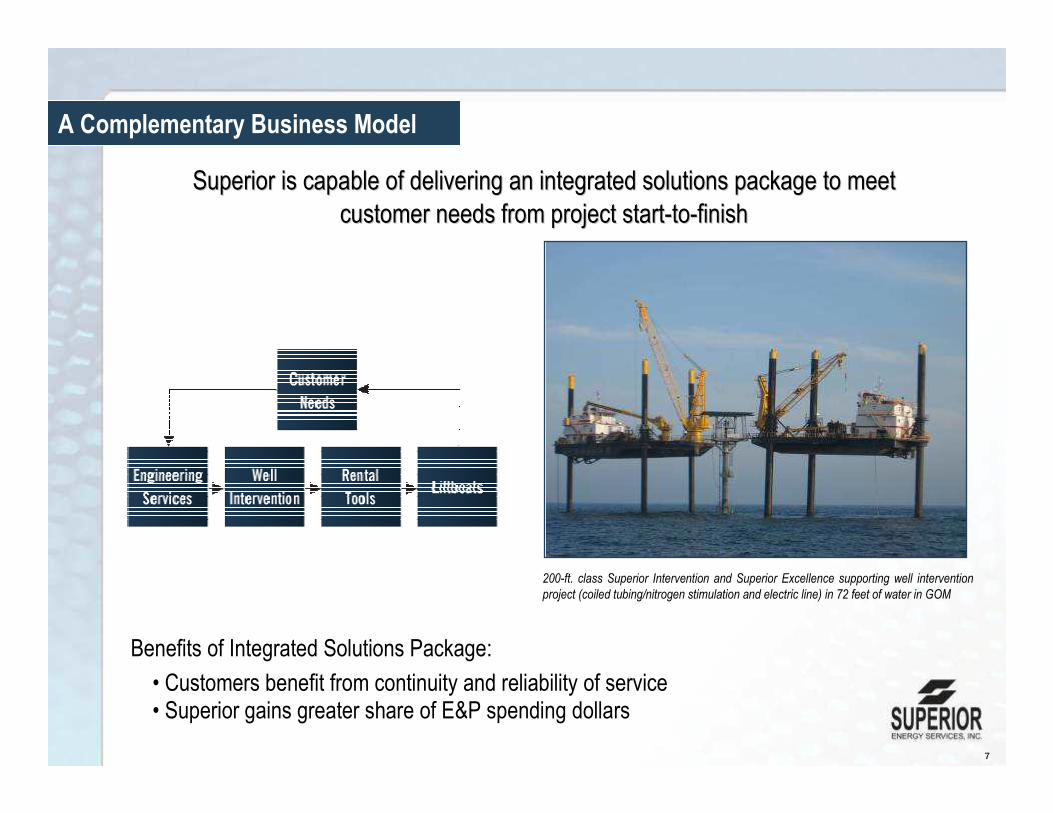
Benefits of Integrated Solutions Package:
• Customers benefit from continuity and reliability of service• Superior gains greater share of E&P spending dollars
200-ft. class Superior Intervention and Superior Excellence supporting well intervention project (coiled tubing/nitrogen stimulation and electric line) in 72 feet of water in GOM
Superior is capable of delivering an integrated solutions packagSuperior is capable of delivering an integrated solutions package to meet e to meet
customer needs from project startcustomer needs from project start--toto--finishfinish
A Complementary Business Model

8
Leader in Safety
0.61
1.42
1.84
0.00
0.40
0.80
1.20
1.60
2.00
Superior Closest peer Peer Avg
2008 Total Recordable Incident Rate (per 200,000 manhours)SPN Ranked #1 for 5 Consecutive Years

9
Revenue Exposure by Geographic Market
N/AN/A$121 (7%)Marine
$970 (53%)
$197 (11%)
$652 (36%)
Gulf of Mexico
$151 (8%)$352 (19%)Well Intervention
$317 (17%)$540 (29%)Total
$166 (9%)$188 (10%)Rental Tools
InternationalDomestic Land
2008 segment revenue by major geographic locationas a percentage of total recurring revenue 1
1 Recurring revenue = $1,827 million and is calculated by subtracting $54 million of revenue from the previous Oil and Gas Segment from total 2008 revenue of $1,881 million. On March 14, 2008, Superior sold 75% of its interest in SPN Resources, which comprised the Oil and Gas Segment. During the first quarter of 2008, the Oil and Gas Segment generated $54 million of revenue, all of which came from the Gulf of Mexico.
$ in millions

10

11
Subsea “Body of Work”
▪ Wreck Removal Project
– Requires many of the same heavy marine assets, services and technologies used in subsea work, including multi-purpose vessels, marine engineering, ROVs and saturation diving
– Project has included 30 ROV dives, 2,800 ROV hours, 5,100 total dives and 8,700 saturation diving hours
▪ Lubricator System
– Since 2002, Superior has developed and operated multiple lubricator systems integral to accessing subsea wells

12
Extend “Life Cycle of the Well” Model to Subsea Market
Subsea Well Intervention by Water Depth, 2002-2011
Subsea Well Abandonment by Water Depth, 2002-2011
▪ Subsea installation, well intervention and abandonment markets are rapidly expanding
▪ Superior has extensive engineering experience in well intervention, platform recovery, decommissioning and well control and will continue to invest in assets and technologies to address subsea market
Global Subsea Market by Component, $ in billions
Source: Douglas-Westwood/Energyfiles

13
Intervention Vessel can Accelerate Entry into Subsea Intervention Market
▪ Subsea infrastructure support– Subsea flowbase, tree and manifold installation
– Flowline and umbilical installation and connection
– Well flow start-up
– Step out of existing infrastructure
– Seabed excavation
– Drilling support
– ROV and diving support
▪ Subsea production maintenance– Wireline well intervention
– Inspection, repair and maintenance
– Future applications: Coiled tubing intervention via riser system
▪ Subsea decommissioning– Wellbore plug and abandonment
– Facilities abandonment and removal
– Seabed clearing and removal
14
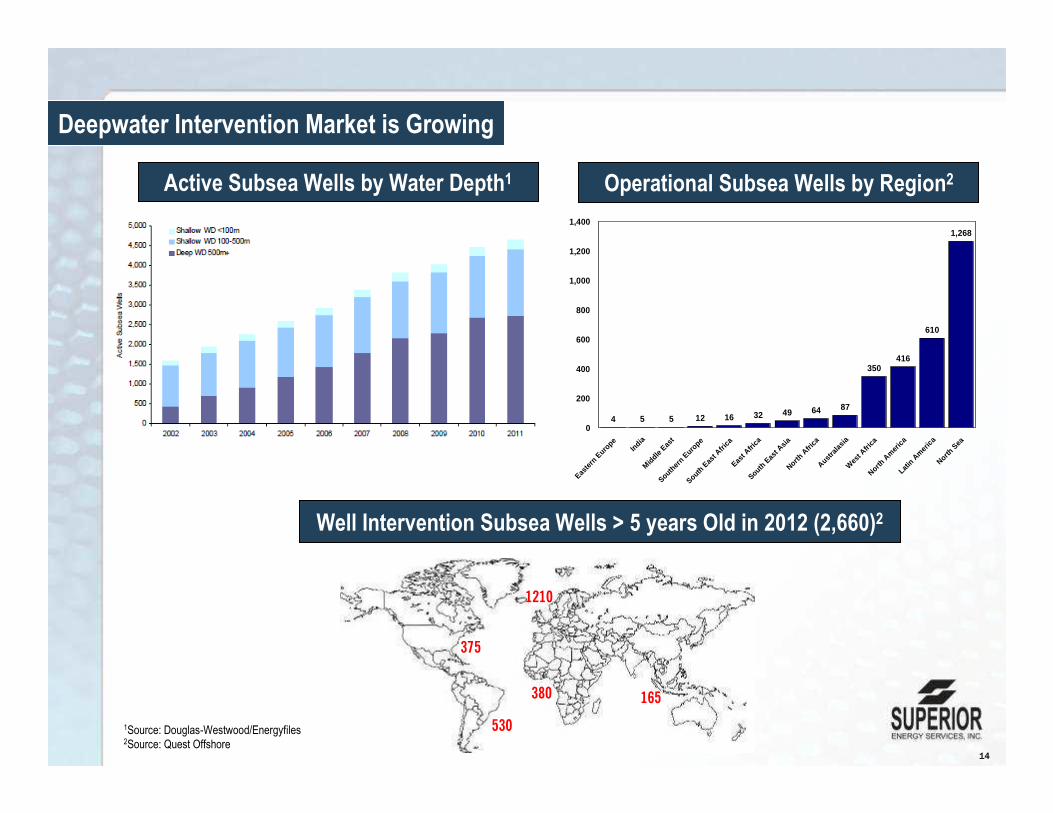
Deepwater Intervention Market is Growing
1210
165380
530
375
4 5 5 12 16 32 49 64 87
350416
610
1,268
Easte
rn E
urope
India
Middle
East
Souther
n Euro
pe
South E
ast A
frica
East A
frica
South E
ast A
sia
North A
frica
Australa
sia
Wes
t Afri
ca
North A
mer
ica
Latin A
meric
a
North S
ea
0
200
400
600
800
1,000
1,200
1,400
1Source: Douglas-Westwood/Energyfiles2Source: Quest Offshore
Active Subsea Wells by Water Depth1 Operational Subsea Wells by Region2
Well Intervention Subsea Wells > 5 years Old in 2012 (2,660)2

15
$449 $443$501
$564
$735
$1,094
$1,572
$1,881
$0
$200
$400
$600
$800
$1,000
$1,200
$1,400
$1,600
$1,800
$2,000
2001 2002 2003 2004 2005 2006 2007 2008
Strong Revenue and EBITDA Growth
$434
$138$99 $117
$145
$220
$643
$725
$0
$100
$200
$300
$400
$500
$600
$700
$800
2001 2002 2003 2004 2005 2006 2007 2008
$ in millions
We have historically achieved strong revenue and EBITDA growth throughout all industry cycles
REVENUE EBITDA

16
Strong Balance Sheet
1 Total available liquidity = Cash at December 31, 2008 + $250 million under Revolving Credit Facility.
$ in millions.
31-Dec-08
Cash and Equivalents $45
Revolving Credit Facility due 2011 $0
6.875% Senior Notes due 2014 300 1.5% Senior Exchangeable Notes due 2026 400
6.45% MARAD (U.S. government financing) due 2027 15
Total Debt 715 Common Equity 1,220
Total Capitalization $1,935
Total Debt/Total Capitalization 37%
Net Debt/Net Capitalization 35%
Total Debt/TTM EBITDA 0.99x
Total Available Liquidity $295 1
Standard & Poor’s Rating BB+
Moody’s Rating Ba3

17
Investment Highlights
▪ Successful track record of integrating acquisitions
▪ Current management team has grown EBITDA 26% and equity book value 24% on a CAGR basis since 2001
▪ Proven track record of growing the business throughout all cycles
Conservative expansion strategy executed by experienced management team
▪ Fully integrated provider of production enhancement solutions
▪ Strong market leadership position in all phases of oil and gas production
▪ Sustainable competitive advantages in safety and innovation havecreated strong revenue and EBITDA growth and margins
Diversified product/service offering and leading market positions provide sustainable competitive advantages
▪ Growing international and domestic onshore presence
▪ Book of business in Gulf of Mexico from recent active hurricane seasonsStrong and stable free cash flow generation
▪ Total Debt/LTM EBITDA of 0.99 at December 31, 2008
▪ Operating cash flow funds capital expenditures
Strong balance sheet and conservative financial policies provide flexibility to grow through industry cycles

18
Earnings before interest, taxes depreciation, amortization and loss on early extinguishment of debt (EBITDA) is a non-GAAP financial measurement. We use EBITDA because we believe that such a measurement is a widely accepted financial indictor used by investors and analysts to analyze and compare companies on the basis of operating performance and that this measurement may be used by some investors and others to make informed investment decisions. In addition, EBITDA is used in the financial ratios included in our credit agreement and senior note indenture. You should not consider it in isolation from or as a substitute for net income or cash flow measures prepared in accordance with GAAP or as a measure of profitability or liquidity. EBITDA calculations by one company may not be comparable to EBITDA calculations made by another company. The following table provides a reconciliation of net income (loss) (a GAAP financial measure) and EBITDA (a non-GAAP financial measure):
EBITDA Reconciliation
Reconciliation of Net Income to EBITDA
(in thousands)
2001 2002 2003 2004 2005 2006 2007 2008
Income before extraordinary loss and
cumulative effect of change in accounting principle $51,187 $21,886 $30,514 $35,852 $67,859 $188,241 $281,120 $361,722
Add:
Interest, net 18,195 21,354 22,268 20,710 19,661 18,338 30,406 27,444
Income taxes 35,571 13,701 18,308 21,056 38,172 103,605 151,372 196,922
Depreciation, Depletion, Amortization & Accretion 33,446 41,595 48,853 67,337 89,288 111,011 187,841 175,500
Merger termination, net of gain on sale of sub
Other expense 3,977
Special charges
Reduction in value of assets and investments 8,244
Loss on early extinguishment of debt 12,596
Less:
Other income (2,762)
Gain on sale of liftboats (3,544)
Gain on sale of business (7,483) (40,946)
EBITDA $138,399 $98,536 $117,181 $144,955 $219,680 $433,791 $643,256 $724,619
For the year ending December 31,

19
Earnings before interest, taxes depreciation, amortization and loss on early extinguishment of debt (EBITDA) is a non-GAAP financial measurement. We use EBITDA because we believe that such a measurement is a widely accepted financial indictor used by investors and analysts to analyze and compare companies on the basis of operating performance and that this measurement may be used by some investors and others to make informed investment decisions. In addition, EBITDA is used in the financial ratios included in our credit agreement and senior note indenture. You should not consider it in isolation from or as a substitute for net income or cash flow measures prepared in accordance with GAAP or as a measure of profitability or liquidity. EBITDA calculations by one company may not be comparable to EBITDA calculations made by another company. The following table provides a reconciliation of net income (loss) (a GAAP financial measure) and EBITDA (a non-GAAP financial measure):
EBITDA Reconciliation
Reconciliation of Net Income to EBITDA
For the twelve months trailing December 31, 2008
(in thousands)Well
Intervention Rental Tools Marine Oil and Gas Unallocated
Consolidated
total
Net income 286,803$ 187,625$ 23,643$ 91,994$ (228,343)$ 361,722$
Add:
Interest expense, net - 27,444 27,444
Other (income)/expense 3,977 3,977
Income taxes 196,922 196,922 Depreciation, depletion,
amortization and accretion 72,169 90,459 10,073 2,799 - 175,500
-
Less:
Gain on sale of subsidiary (500) (3,332) - (37,114) - (40,946)
EBITDA 358,472$ 274,752$ 33,716$ 57,679$ -$ 724,619$