superiority of electropolishing over chemical
TRANSCRIPT

Particle ~ueleratars, Vol. 60, pp. 193-217 L 1998 OPA (Overseas Publishers Association) N.V.
Reprints available directly from the publisher Published by license under Photocopying permitted by license only the Gordon and Breach Science
Publishers imprint.
Printed in India.
SUPERIORITY OF ELECTROPOLISHING OVER CHEMICAL POLISHING ON
HIGH GRADIENTS
KENJI SAITO*, HITOSHI INOUE, EIJI KAKO,
TAKEO FUJINO, SHUICHI NOGUCHI, MASAAKI ONO
and TOSHIO SHISHIDO
High Energy Accelerator Research Organization (KEK) , 1-1, Oho,
Tsukuba-shi, Ibaraki-ken, 305-0801 Japan
(Received in final form 15 January 1998) Electropolishing (EP) offers a smoother surface, and that makes us expect high gradients in superconducting niobium cavities. EP has a little bit complicated procedure and needs annealing to avoid the hydrogen Q-disease. On the other hand, chemical polishing (CP) is easier and cheaper, so widely used in many laboratories. For the conventional field gradients (,z~ 5 MV/m) in storage rings (TRISTAN-MR, HERA), no difference was seen on the cavity performance between EP and CP. In the high gradients research for TESLA, we have to establish the surface treatment method which has a high reliability on the high gradients over than 25 MV/m and is cheaper in the preparation cost. So far, CP has offered a nice cavity performance, but a concern on "European Headache" was developed recently on the high gradients at Saclay. KEK has intensively investigated the difference between the effect of CP and EP on high gradient performance since the last SRF workshop at Saclay. In this investigation "European Headache" was also seen in chemically polished cavities at KEK; in addition these cavities often showed a new Q-degradation without X-ray signals which seriously limited the high gradients. EP offers reliably high gradients over 30MV/m. At the moment, EP seems to have a superiority over CP for high gradients over 25 MV/m.
* Corresponding author. Tel.: 81-298-645235. Fax: 81-298-643182.
194 K. SAITO a al.
1. INTRODUCTION
KEK has adopted electropolishing (EP) for the preparation of niobium superconducting rf cavities, while chemical polishing (CP) is widely used in other laboratories because it is easier than EP. EP can offer a smoother surface than CP, which makes us to expect a better cavity performance. Really, KEK established the 10 MV/m level in the accelerating field (E,,,,) at 500 MHz se cavities first in the world. However, we had no answer that it was surely due to EP. This expectation on EP has also been discussed for a long time among laboratories," Z however, nobody has a clear answer yet. Recently, niobium material has been well improved and has become very reliable. It is now time to come back to this question.
During the last SRF workshop at Saclay and the following TESLA meeting at DESY, "European Headache" was developed: it was a mystery that KEK's cavities made out of the niobium material with RRR ~zt200 and treated with EP can achieve high gradients of E,,, > 30 MV/m,3 but the Saclay ones with RRR ~ 300 and treated with CP cannot get such a field, and a 1400°C heat treatment makes possible the high gradients. 4 What is the difference: material, fabrication process or chemistry? For these two years, we made a systematic study intensively using many L-band virgin single-cell cavities to get the answer. As a result, we identified "European Headache" is owing to CP, and found out the clear superiority of EP over CP for high gradients over 25 MV/m. The results of the experiments are presented in this paper. 2. EXPERIMENT We use many single-cell cavities in this experiment. In later sections, we discuss the result with cavity name. First, we summarize the cavity information in Table 1. Geometrical and RF parameters of cavities are listed in Table Il.
2.1. KEK In-house Fabrication
Here, we present a fabrication procedure of the KEK in-house cavities because most of the cavities used in this experiment were

HIGH GRADIENTS ELECTROPOLISHING 197
6
~I of
L-4- Average removal
0 50 100 150 200
J Removal thickness (gym)
FIGURE I Distribution of material removal with CP, EP and BP. The distribution is for the average material removal of 801xm calculated from weight difference in each method.
very effective to remove irregularities like scratches, or sputter balls by EBW failure.`' The typical material removal speed is 7 ~tm/day. It has the largest removal rate at equator section as seen in Figure 1, and it is 250% of the average removal. This is convenient to grind the EBW seam at equator where the surface should be defect free as the high surface current crosses here. In the TRISTAN-SC project, we polished up the inner surface of every half-cell with buffing to initialize the state of surface, then had EBW to complete a cavity. Welding defects were worried about, so every EBW seam was ground mechanically after EBW. BP can finish both processes at once, so reduces the preparation cost. The problem of embedding abrasives in the polished surface is same as buffing. A light CP (lOltm) or EP (10 qm) is necessary to remove this contamination layer. The finished roughness by BP is 1--2 [tm in Rz.
(3) Electropolishing (EP)
This is the main interest of this paper. The method is the same as TRISTAN-SCC, namely the horizontal rotating method under a
198 K. SAITO et al.
continuous current.' ° Its typical material removal speed is 0.4 gm/min. It has a maximum removal at beam tubes. This is owing to the geometry of electrodes in EP. The equator section is removed by 60% of the average removal. The finished roughness depends strongly on the initial roughness and the amount of the material removal. Its typical number is 1 gm for a heavy material removal (;zz~ 100 qm). EP has less boundary etching as long as EP condition is proper. A problem is the Q-disease owing to hydrogen picked up during EP. We take a medium temperature (800-700°C) annealing to prevent it. By a recent study, it was shown that the annealing temperature could be decreased to 600°C or possibly even to 500°C. If annealing and the material of RRR <_ 200 are used, the Q-disease does not appear even by an additional heavy EP (130 pm). Rinsing procedure is the same as in the case of CP. The hydrogen peroxide (Hz02) rinsing used in the TRISTAN SC project was not used in this experiment. (4) High-Pressure Rinsing (HPR)
HPR was done for 1.5 h in every chemistry as a main rinsing process. The amount of used water is about 8001. Pressure was initially 85 kgf/cmz but decreased to 60 kgf/cmz during the frequent uses. This pressure decrease is mainly due to exhaustion of the pump system. One should notice the chipping of nozzle holes. Actually we found many marks of the chipping on the hole edge by inspection with microscope. This might cause field emission or quench.
In some cases of field emission, we are suspecting the quality of pure water. In these experiments we used demineralized water (ionexchanged water) mainly in HPR. At the initial stage in this experiment, there were several cases in which resistivity of water suddenly became worse during HPR. Now the maintenance method for the pure water making system has been well established and such a problem is eliminated. In the following discussion, the experimental results which show heavy field emission at low field (< 10 MV/m) are excluded. These are thought to be due to some accidental causes such as: nozzle chipping in HPR, water quality, or a cold leak in the cold measurement mentioned later. In such a case, the cavity was just re-rinsed with HPR and re-measured.
1
HIGH GRADIENTS ELECTROPOLISHING 199
2.3. Cold Measurement
After the surface treatment at the company (Nomura Plating), the cavity is immediately brought to KEK and assembled in the class 10 clean room. Indium is used for vacuum sealing of flanges. For vacuum evacuation we have three stands. Each stand consists of a rotary pump (2001/s) and a turbo-molecular pump (501/s) as preevacuation, and an ion pump (601/s). Cavities are baked around 90°C for 1-2 days during the pre-evacuation. The typical vacuum pressure prior to the cold test is 1 x 10⁻⁹ torr.
For cold tests, we have two cryostats; one has been used since 199112 and the other was newly built for quick measurements. J3 Vacuum evacuation is continued during cold measurement for the old one, but cavities are sealed with a metal valve for the new one. The pre-cooling has been carried out with liquid nitrogen for one night for the old cryostat, but it is not needed for the new one because the heat capacity is so small. Cooling down time is about 45 min, from 300 to 4.2 K, with the new cryostat. The old cryostat can cool down cavities to 1.7 K at best, but the new one can reach down to 1.2 K. The old one is a little bit poor with magnetic shielding so that a surface residual resistance of about 3 nS2 adds to the intrinsic one of cavities. The old one needs much time to make it ready for measurement but is reliable. Comparing measurement results with K-14, no difference was seen in both systems. In addition, considering that an E,,c,= 39 MV/m has been achieved with the new system, the blind vacuum sealing during cold measurement is not a problem for cavity performance. In the case of heavy field emission, vacuum leaking was occasionally found in the new cryostat. Since such a trouble could be a cause of field emission, careful handling is required for the new cryostat. Cavities were cold tested around 1.8 K but some cases were measured at the lower temperature. 3. EXPERIMENTAL RESULTS Hereafter, we shall often refer to the amount of the material removed in various chemistries. We define it first. As long as we do not
200 K. SAITO el sf.
mention specifically, an average value for the whole inner surface including beam pipes is used, which is calculated from the surface area and a weight difference before and after the chemistry.
3.1. "European Headache"
So far we have not made systematic investigation on CP with cavity performance. Adding the material removed in CP, we measured the cavity performance to see the "European Headache". We used three virgin cavities (K-7, -10, -11) in order to make sure the reproducibility of the experimental result. BP was not performed before CP for an effect of mechanical grinding not to mix into the result. The chemical material removal was started from 100 pm, then added 30, 50 and 70 pm, up to 250-pm in total where cavity performance is considered to be saturated. 14 Cavities were. heat treated (750°C x 5h) after the first CP (100 pm) to make it sure that the results are free from the problem of the hydrogen Q-disease. The results are summarized in Figure 2, where the difference of Q0 value between the measurements is mainly owing to the measuring temperature and the cryostat used. The maximum gradients scatter between 18 and 26.5 MV/m. What is interesting is that not only in the electron loading cases but also in others a steep or exponential Q-degradation is observed at high gradients. This new type of Q-degradation is also observed in other laboratories with CP cavities.' s°16 Sometimes we observed this Q-degradation with EP cavities but at higher gradients > 25 MV/m. Anyway with CP, the gradient is limited below 30 MV/m either by electron loading or the new Q-degradation. "European Headache" has been observed at KEK too. 3.2. Effect of Light EP on the CP Surface
What is the cause of the "European Headache"? An influence of the hydrogen doped during heavy chemical etching was suspected first. We degassed K- I l at 750°C again, then chemically polished by 30 pm, however, E;,cc„,;,x was not changed: E„,, „„, = 22.7 MV/m. That means the contribution of hydrogen is less on the "European Headache".
As the next step, we performed a light EP on these cavities (K-7, -10, -11). The results are shown in Figure 3. K-7 was removed directly

HIGH GRADIENTS ELECTROPOLISHING 201
Qo
1 01 0
QO
1 01
0,
1 01 Qo
1 01 0 5 10 15 20 25 30 35 40
Eacc [MV/M]
FIGURE 2 Cavity performance on chemically polished cavities.
30 pm, then Eace,nax was upgraded to 35 MV/m without any Q-degra dation. To see the effect of the adding material removal with EP,
K-10 and K-11 were additionally removed every 10 pm, up to 30 pm. At the first 10 1tm EP, the gradient was limited at 23.4 (K-10) and
CP100um
OU(-)VVUCJ(J~)OO(y~ X-ray
U K-7 I
~:<XXXX?;XX XXXw XX n ,~ • K-1 i
x•••••1•••••1• X X-ray , _I
X-ray CP130pm (jQUOUUUC>~)C.)~ U UCJC)CJ
U K-7
no X-ray r v ._
• K-10
l`~r1,`j, X K-11 1 • ~X no X-ray
X-ray • ?~ CP180gm )npl`~CnC) CjC~Oi~,.JyC1 X-ray
U K-7
XXXXXXXXXXXXX.<Xo•oX"X X-ray (.,~,',, X K-i1
~X _no X-ray CP250pm XXXX L<~X no X-ray
~-~ K-10
X K-11 no X-ray no X-ray
0 - 0 K• 0 -

202 K. SAITO et al.
CP(250-280wm)+EP Q0~,:,,,c~O~P!3~ 000000000 00
ip10~kt~fi,~$,J~TatV~n1~T[~,~ 0 K-7 CP250+EP30
4 K-10 CP250+EP10
K-11 CP280+EP10 X K-10 CP250+EP20
_1 K-11 CP280+EP20
K-10 CP250+EP30 1 p V K-11 CP280+EP30
0 5 10 15 20 25 30 35 40 Eacc [MV/m]
FIGURE 3 Effect of the light final EP on chemically polished cavities.
24.4 MV/m (K-11) respectively but the Q-degradation seen in CP was not observed. The additional removals improved Eacc„,a,,: then 30.9 (K-10) and 28.7 MV/m (K-I 1) were achieved after the 30 lim removal. This excellent effect of EP seems to be owing to not the removal of material defects but the polishing mechanism of EP. This discussion is based on the hypothesis of defect free material'? but if not so, such a consistent result could not be obtained in many cavities. From these experimental results, it is pointed out that the "European Headache" has the cause in chemical polishing itself. This will be discussed more in Section 4. Here, we can see a superiority of EP over CP. 3.3. Chemistries and Cavity Performance
As mentioned initially, now we have three kinds of polishing techniques: CP, EP and BP. CP has a very fast material removal speed but seems to be unacceptable for the high gradients (E~,,, > 30 MV/m) as seen in the "European Headache". If we use high temperature annealing, it is provably possible but other problems will occur: softening in material, cost increase so on. EP has a rather slow removal speed but offers excellent cavity performance. BP is a very reliable grinding method for irregularities but has a contamination problem of abrasives. To understand the mechanism of the field limitation, let's see the correlation between the chemistry and E;,«„nax for various chemistries. And such an investigation will show more clearly the superiority of EP.
HIGH GRADIENTS ELECTROPOLISHING 203
(1) EP +HPR
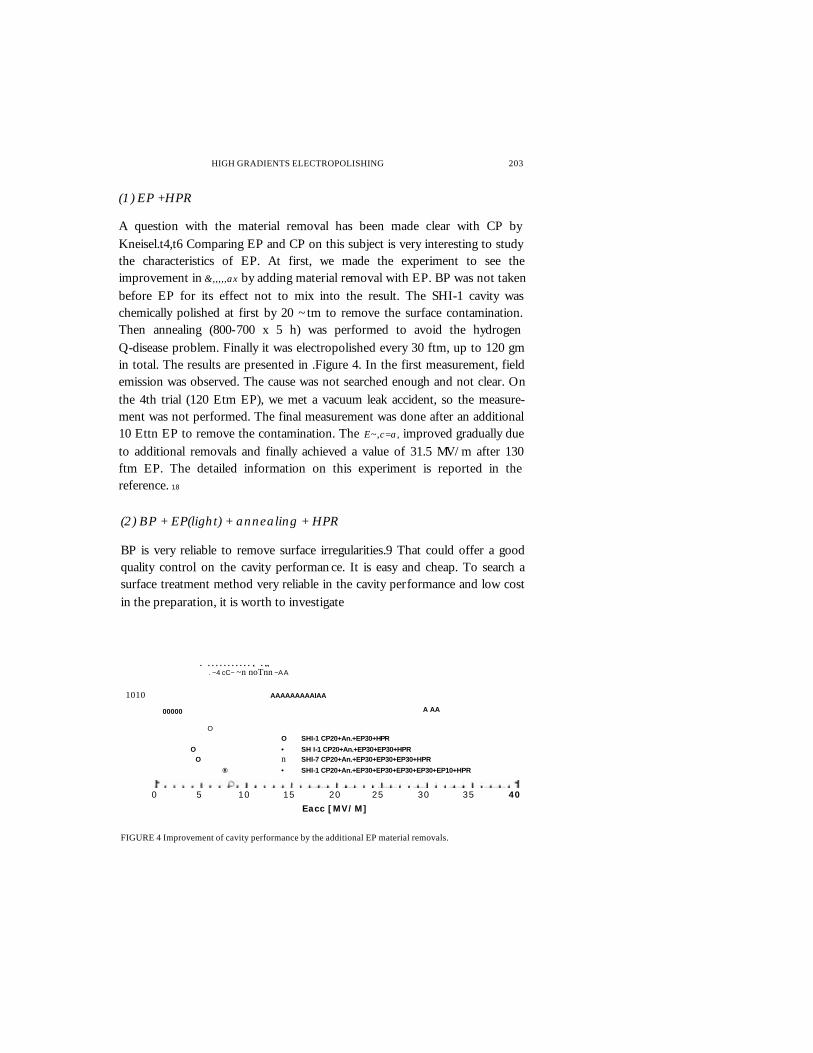
A question with the material removal has been made clear with CP by Kneisel.t4,t6 Comparing EP and CP on this subject is very interesting to study the characteristics of EP. At first, we made the experiment to see the improvement in &,,,,,ax by adding material removal with EP. BP was not taken before EP for its effect not to mix into the result. The SHI-1 cavity was chemically polished at first by 20 ~tm to remove the surface contamination. Then annealing (800-700 x 5 h) was performed to avoid the hydrogen Q-disease problem. Finally it was electropolished every 30 ftm, up to 120 gm in total. The results are presented in .Figure 4. In the first measurement, field emission was observed. The cause was not searched enough and not clear. On the 4th trial (120 Etm EP), we met a vacuum leak accident, so the measure-ment was not performed. The final measurement was done after an additional 10 Ettn EP to remove the contamination. The E~,c=a, improved gradually due to additional removals and finally achieved a value of 31.5 MV/m after 130 ftm EP. The detailed information on this experiment is reported in the reference. 18
(2) BP + EP(light) + annealing + HPR
BP is very reliable to remove surface irregularities.9 That could offer a good quality control on the cavity performan ce. It is easy and cheap. To search a surface treatment method very reliable in the cavity performance and low cost in the preparation, it is worth to investigate
. ........... , .„ . ~4 cC~ ~n noTnn ~A A
1010 AAAAAAAAAIAA
A AA 00000
O O SHI-1 CP20+An.+EP30+HPR
O • SH I-1 CP20+An.+EP30+EP30+HPR O n SHI-7 CP20+An.+EP30+EP30+EP30+HPR
® • SHI-1 CP20+An.+EP30+EP30+EP30+EP30+EP10+HPR
0 5 10 15 20 25 30 35 40
Eacc [MV/M]
FIGURE 4 Improvement of cavity performance by the additional EP material removals.

204 K. SAITO et cal.
BP+EP(light)+An.+HPR
• K-4 BP(46.0 g)+EP10+An+MSR(54°C)+HPR
O K-8 BP(69.5 g)+CP5+EP10+An+HPR x K-9 BP(40.9 g)+CP7+EP30+An+HPR
• K-12 BP(108.3 g)+CP5+EP10+An+HPR
n N-2 Swing-BP(121.Og)+EP10+An+MBR(65°C)+HPR
15 20 25
Eacc [MV/M] 30 35 40
FIGURE 5 Cavity performance with the procedure: BP +EP(light)+annealing (750°C) + HPR.
the procedure which consists of mainly barrel polishing, and light EP to remove the contaminated layer by BP. We performed the experiment using five virgin cavities (K-4, -8, -9, -12, N-2). Even lightly, the EP after BP makes the hydrogen Q-disease. In this experiment, a medium temperature annealing is needed to prevent this problem. After the annealing, cavities were just rinsed by HPR with demineralized water (lOMS2cm). The results are shown in Figure 5. We used a light EP (10 gm) or a combination of CP (5-7 gym) and EP (10-30 gm) to remove the contaminated layer by BP, which was considered to be enough to eliminate the abrasive contamination. K-4 achieved E~maX of 33.1 MV/m but the others were limited to around 25 MV/m.
We tried megasonic rinsing (MSR) for K-4 and N-2 prior to HPR in order to strengthen rinsing process, however, the excellent result in K-4 we are still not sure if it is due to this effect or not. The barrier at 25 MV/m might have a mechanism behind it. It will be discussed later. K-12 had many sputter balls around EBW seam on the equator due to the failure of EBW, and N-2 also had an EBW failure at the iris section, but the same results were obtained by this procedure with more removal by BP.
(3) Effect of the Final Light EP after Annealing
In order to try and improve the maximum gradients and to see the effect of additional EP, three cavities (K-8, -9, -12) were electropolished with a 10 pm step up to 30 pm. The results were presented in Figure 6.

HIGH GRADIENTS ELECTROPOLISHING 205
•1 *1 .: P+E P(light)+An.+EP+tiPR
+t I-+00"'o 0 00 0 0* 0 1RM*Sg 000 ++#-14.A - $a++- -i++Xa4~Vp~
101° K-8 BP(46.0 g)+EP+An+EP10+HPR O K-9 BP(40.9 g)+EP+An+EP10+HPR
p K-12 BP(108.3g)+EP+An+EP10+HPR
I- K-12 BP(108.3g)+EP+An+EP10+EP10+HPR • K-9 BP(40.9 g)+EP+An+EP10+JAERI HPR
K-12 BP(108.3g)+EP+An+EP10+EP10+EP10+HPR 109
0 5 10 15 20 25 30 35 -
Eacc [MV/Ml
FIGURE 6 Cavity performance with the procedure: BP +EP(light)+annealing 750°C)+EP (10-301tm)+HPR.
For K-8 and K-9, the gradients upgraded without any Q-degradation to 31.4 (K-8) and 33.4 MV/m (K-9) by the first 10 Van finishing. With K-12, Eaeetn„X
improved to 29.3 MV/m by the first 10 Etm EP and up to 30.7 MV/m finally by 30 qm EP. The final, light EP, is very effective for eliminating the barrier at 25 MV/m in procedure (2).
After this experiment, K-9 was just rinsed again with HPR at JAERI which was newly built. E<«c„,X reached to 39 MV/m at 1.5 K (e) but is 31.5 MV/m at 1.8 K. Eacemax strongly depends on the liquid helium temperature. This cavity was left in the class 100 clean room for several months, just covered with aluminum foils, since the latest cold test. We are not sure whether this phenomenon depends on the rinsing or not, but this is a very interesting phenomenon for future investigation.
(4) Heany EP after Barrel Polishing
We confirmed the final, light EP, can eliminate the barrier at 25 MV/m in procedure (2); however, a question still remains regarding the cause: an influence of BP or the contamination during annealing. To get the answer, we took a heavy EP instead of alight EP in procedure (2). Two virgin cavities (K-3, T-1) were used in this experiment. The result is shown in Figure 7. A Q-degradation with X-ray (field emission) was observed clearly at high gradient with K-3, but the Eacc„nax achieved was over 30 MV/m in both cases. Combining this result and one of (3) it is suggested that the barrier at 25 MV/m is

206 K. SAITO et al.
BP+EP(much)+An.+HPR 40 cc~a~RR~PQRQi~saQQ`~52~?RR~r?Ra~c xooo~cX
1 Ot 0c>
O K-3 BP(46.1 g)+EP250+An+HPR
X T-1 BP(25.6 g)+EP100+An+HPR
1 09 0 5 10 15 20 25 30 35 40
Eacc IMV/mI FIGURE 7 Cavity performance with the procedure: BP+ EP(heavy)+annealing (750°C)+HPR. ,
not owing to the contamination by annealing but the influence of BP, and it might still remain in the final, light EP of about 301tm. The abrasive contamination by BP is removed by 10 Etm material removal with EP or CP. Therefore, the following picture is imagined for the barrier, that BP makes damages on the surface, its influence is exten ded underneath to about 30Itm, and it is not recovered enough by the medium temperature annealing (700-800°C x 5 h). The Q-degradation, which is due to field emission mainly or partly, might be owing to the contamination by annealing or the limitation in our rinsing technique.
(5) Superiority of EP over CP
Here, we change EP with CP in the treatments (2) and (3) to see the polishing effect of CP. Results are shown in Figures 8 and 9. Figure 8 is corresponding to the case that EP was changed with CP in proce dure (2). This experiment was done with the N-2 cavity and repeated twice to confirm the reproducibility. As shown in Figure 5, this cavity had achieved 26 MV/m by the treatment (2) before these tests. In these tests, the amount of BP is not much because its purpose is to just reset the surface to the mechanically ground state. Here, we tried megasonic rinsing (MSR) prior to HPR in the rinsing procedure but it would not bring any confusion to the explanation. The result on the N-2 cavity in the treatment (2) was obtained by the material removal of 10 Etm by EP after BP. In this experiment, 10 or 15 ltm was
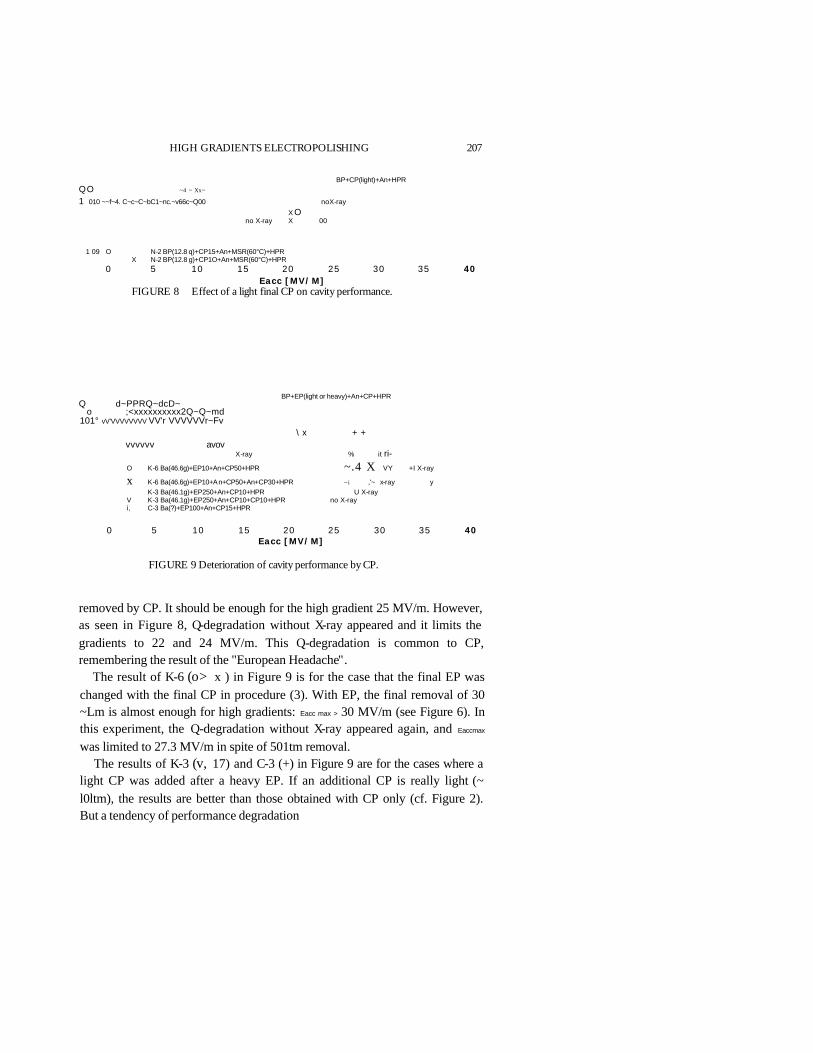
HIGH GRADIENTS ELECTROPOLISHING 207 BP+CP(light)+An+HPR QO ~4 ~ Xx~
1 010 ~~f~4. C~c~C~bC1~nc.~v66c~Q00 noX-ray
X O no X-ray X 00
1 09 O N-2 BP(12.8 q)+CP15+An+MSR(60°C)+HPR X N-2 BP(12.8 g)+CP1O+An+MSR(60°C)+HPR 0 5 10 15 20 25 30 35 40 Eacc [MV/M] FIGURE 8 Effect of a light final CP on cavity performance.
BP+EP(light or heavy)+An+CP+HPR Q d~PPRQ~dcD~ o ;<xxxxxxxxxx2Q~Q~md 101° vV'VVVVVVVV VV'r VVVVVVr~Fv
\ x + + vvvvvv avov
X-ray % it ri-
O K-6 Ba(46.6g)+EP10+An+CP50+HPR ~.4 X VY +I X-ray
x K-6 Ba(46.6g)+EP10+An+CP50+An+CP30+HPR ~i ,'~ x-ray y K-3 Ba(46.1g)+EP250+An+CP10+HPR U X-ray V K-3 Ba(46.1g)+EP250+An+CP10+CP10+HPR no X-ray i, C-3 Ba(?)+EP100+An+CP15+HPR
0 5 10 15 20 25 30 35 40
Eacc [MV/M]
FIGURE 9 Deterioration of cavity performance by CP.
removed by CP. It should be enough for the high gradient 25 MV/m. However, as seen in Figure 8, Q-degradation without X-ray appeared and it limits the gradients to 22 and 24 MV/m. This Q-degradation is common to CP, remembering the result of the "European Headache".
The result of K-6 (o> x ) in Figure 9 is for the case that the final EP was changed with the final CP in procedure (3). With EP, the final removal of 30 ~Lm is almost enough for high gradients: Eacc max > 30 MV/m (see Figure 6). In this experiment, the Q-degradation without X-ray appeared again, and Eaccmax
was limited to 27.3 MV/m in spite of 501tm removal. The results of K-3 (v, 17) and C-3 (+) in Figure 9 are for the cases where a
light CP was added after a heavy EP. If an additional CP is really light (~ l0ltm), the results are better than those obtained with CP only (cf. Figure 2). But a tendency of performance degradation
208 K. SAITO et al.
with an additional CP is seen in the results of the K-3 cavity. Probably CP makes the electropolished good surface worse.
As is shown with many experimental data, the superiority of EP is clear. High gradients (> 30 MV/m) can be achieved by the final material removal of > 30 pm by EP with any heavy pre-polishing. On the other hand, if CP is used as a final finishing, the Q-degradation appears and limits the high gradient. Now it can be said that the "European Headache" is a Q-degradation starting around 1520 MV/m with or without X-ray detection. High temperature heat treatment: HTT(> 1300°C) or a new rinsing technique is necessary to achieve 30 MV/m with CP.
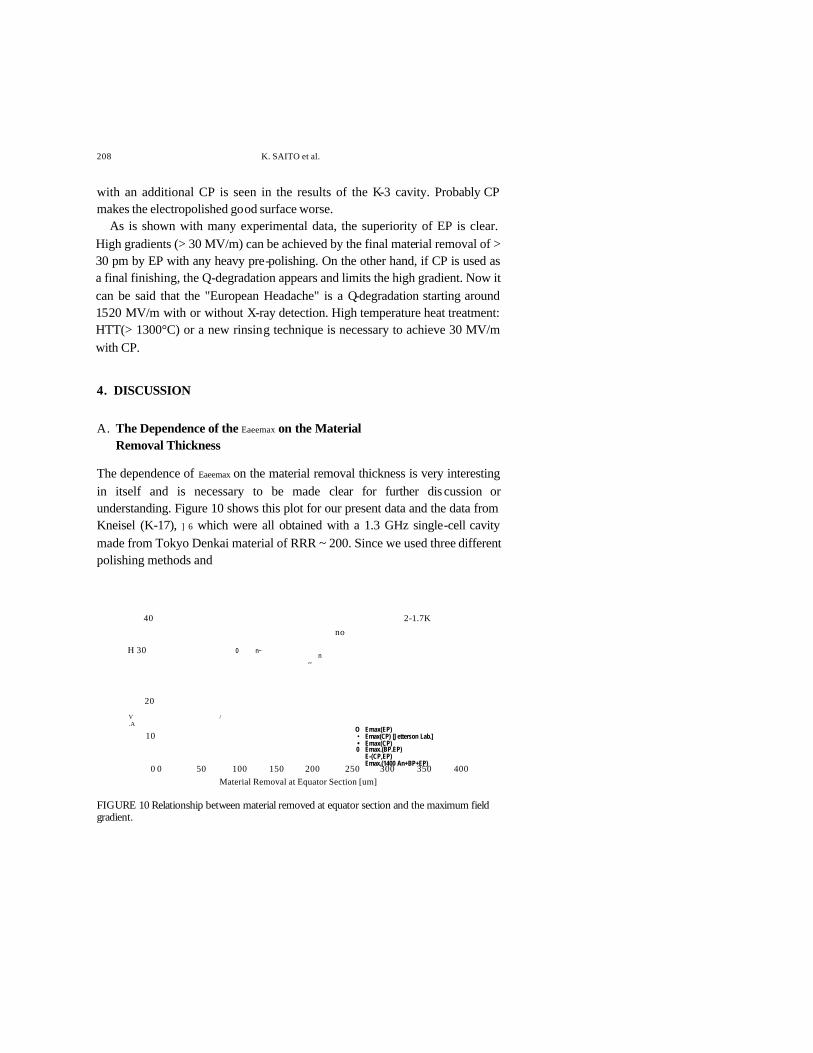
4. DISCUSSION A. The Dependence of the Eaeemax on the Material Removal Thickness
The dependence of Eaeemax on the material removal thickness is very interesting in itself and is necessary to be made clear for further dis cussion or understanding. Figure 10 shows this plot for our present data and the data from Kneisel (K-17), ] 6 which were all obtained with a 1.3 GHz single-cell cavity made from Tokyo Denkai material of RRR ~ 200. Since we used three different polishing methods and
40 2-1.7K
no
H 30 0 n~ n ,,
20
V / .A O Emax(EP) 10 • Emax(CP) [Jetterson Lab.] • Emax(CP) 0 Emax.(BP.EP) E-(CP,EP) Emax.(1400 An+BP+EP) 0 0 50 100 150 200 250 300 350 400
Material Removal at Equator Section [um] FIGURE 10 Relationship between material removed at equator section and the maximum field gradient.
HIGH GRADIENTS ELECTROPOLISHING 209
they have different removal distribution, the amount of material removal is evaluated at an equator region where the surface current has the maximum. At a glance, we can point out three characteristics. Firstly, below.:; 100 gm the maximum gradient increases with the removal thickness. Secondly, above 100 ftm, the maximum gradient scattered in wide range and looks to be saturated. But thirdly, the averaged maximum gradient for cavities finished by EP is higher than that for cavities finished by CP. Necessity of the heavy material removal has been already shown by Kneisel, and it suggests the existence of the damage layer of ~ 100 gm thick, which is probably introduced by forming or EBW. In these cases where cavities are polished heavily (> 100 Etm) by CP only, the maximum gradient seems to be limited by the surface condition peculiar to CP. On the other hand, in the EP finished case, it is not clear whether the finishing by EP of about 30pm is enough or the surface condition made by CP or BP still remains, or our rinsing and assembling technique limits the maximum gradient.
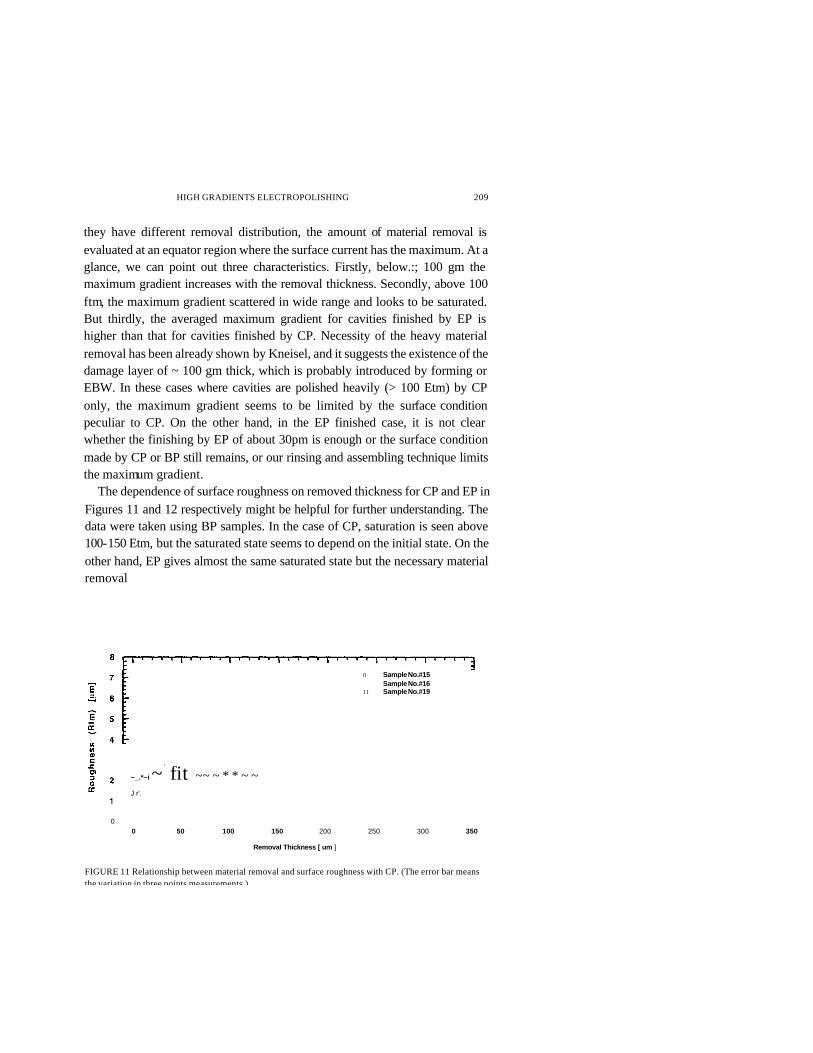
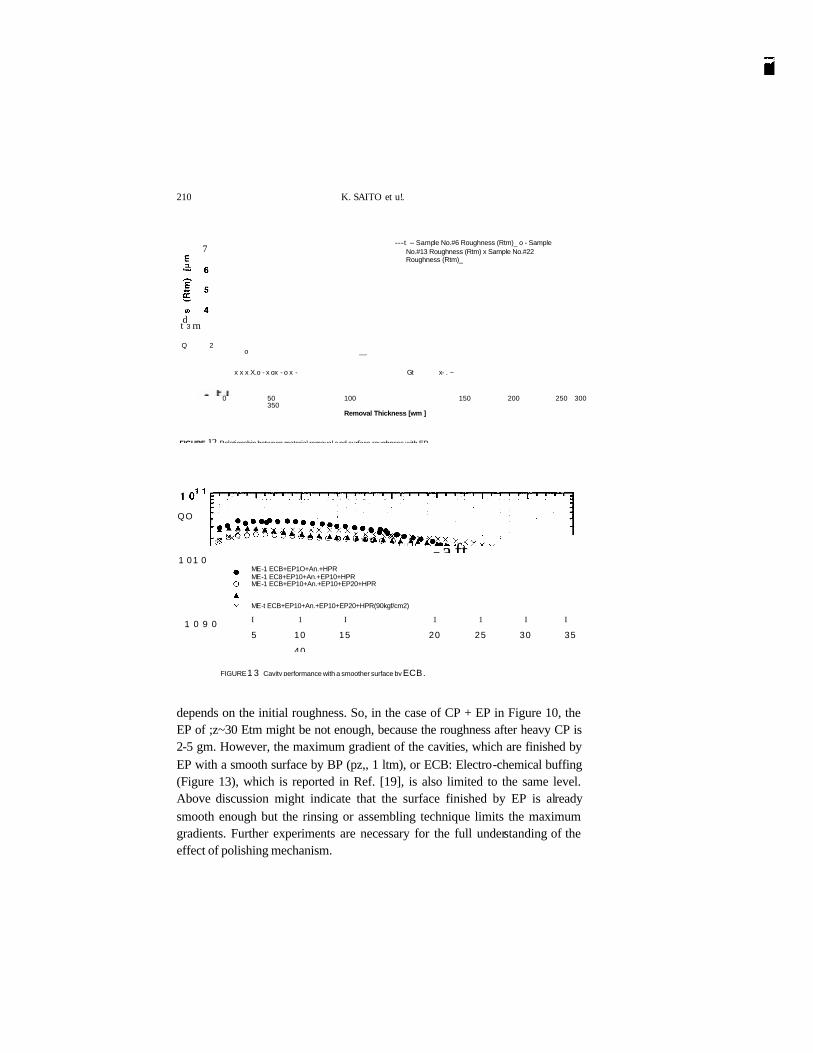
The dependence of surface roughness on removed thickness for CP and EP in Figures 11 and 12 respectively might be helpful for further understanding. The data were taken using BP samples. In the case of CP, saturation is seen above 100-150 Etm, but the saturated state seems to depend on the initial state. On the other hand, EP gives almost the same saturated state but the necessary material removal
0 Sample No.#15 Sample No.#16 11 Sample No.#19
i~ , x ~_.*~i ~ fit ~~ ~ * * ~ ~ J r'.
0 0 50 100 150 200 250 300 350
Removal Thickness [ um ]
FIGURE 11 Relationship between material removal and surface roughness with CP. (The error bar means the variation in three points measurements.)
210
7
d t 3 rn
Q 2
K. SAITO et u!.
---t -- Sample No.#6 Roughness (Rtm)_ o - Sample No.#13 Roughness (Rtm) x Sample No.#22 Roughness (Rtm)_
o __
x x x X.o - x ox - o x - Gt x- . ~
0 50 100 150 200 250 300 350 Removal Thickness [wm ]
FIGURE 12 Relationship between material removal and surface roughness with EP.
QO
1 01 0
1 0 9 0
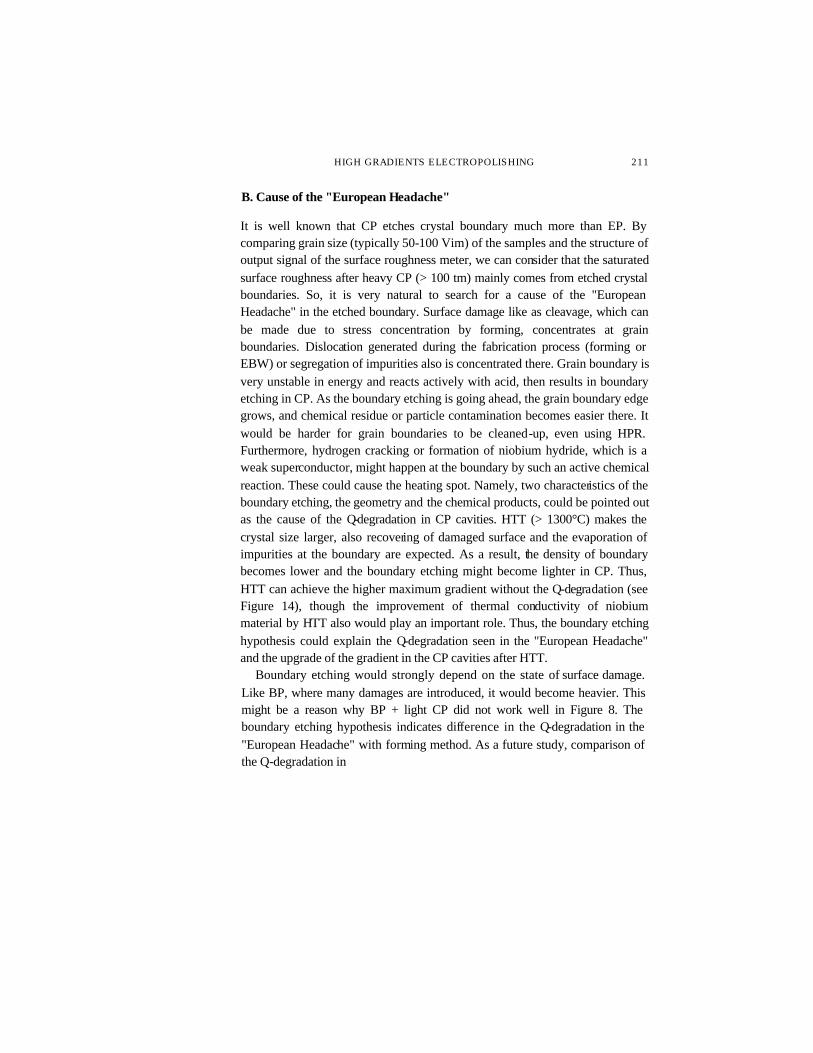
ME-1 ECB+EP1O+An.+HPR ME-1 EC8+EP10+An.+EP10+HPR ME-1 ECB+EP10+An.+EP10+EP20+HPR
-aft x X 00 x :o<
ME-t ECB+EP10+An.+EP10+EP20+HPR(90kgf/cm2)
I 1 I 1 1 I I
5 10 15 20 25 30 35
40
FIGURE 13 Cavity performance with a smoother surface by ECB.
depends on the initial roughness. So, in the case of CP + EP in Figure 10, the EP of ;z~30 Etm might be not enough, because the roughness after heavy CP is 2-5 gm. However, the maximum gradient of the cavities, which are finished by EP with a smooth surface by BP (pz,, 1 ltm), or ECB: Electro-chemical buffing (Figure 13), which is reported in Ref. [19], is also limited to the same level. Above discussion might indicate that the surface finished by EP is already smooth enough but the rinsing or assembling technique limits the maximum gradients. Further experiments are necessary for the full understanding of the effect of polishing mechanism.
HIGH GRADIENTS ELECTROPOLISHING 211
B. Cause of the "European Headache"
It is well known that CP etches crystal boundary much more than EP. By comparing grain size (typically 50-100 Vim) of the samples and the structure of output signal of the surface roughness meter, we can consider that the saturated surface roughness after heavy CP (> 100 tm) mainly comes from etched crystal boundaries. So, it is very natural to search for a cause of the "European Headache" in the etched boundary. Surface damage like as cleavage, which can be made due to stress concentration by forming, concentrates at grain boundaries. Dislocation generated during the fabrication process (forming or EBW) or segregation of impurities also is concentrated there. Grain boundary is very unstable in energy and reacts actively with acid, then results in boundary etching in CP. As the boundary etching is going ahead, the grain boundary edge grows, and chemical residue or particle contamination becomes easier there. It would be harder for grain boundaries to be cleaned-up, even using HPR. Furthermore, hydrogen cracking or formation of niobium hydride, which is a weak superconductor, might happen at the boundary by such an active chemical reaction. These could cause the heating spot. Namely, two characteristics of the boundary etching, the geometry and the chemical products, could be pointed out as the cause of the Q-degradation in CP cavities. HTT (> 1300°C) makes the crystal size larger, also recovering of damaged surface and the evaporation of impurities at the boundary are expected. As a result, the density of boundary becomes lower and the boundary etching might become lighter in CP. Thus, HTT can achieve the higher maximum gradient without the Q-degradation (see Figure 14), though the improvement of thermal conductivity of niobium material by HTT also would play an important role. Thus, the boundary etching hypothesis could explain the Q-degradation seen in the "European Headache" and the upgrade of the gradient in the CP cavities after HTT.
Boundary etching would strongly depend on the state of surface damage. Like BP, where many damages are introduced, it would become heavier. This might be a reason why BP + light CP did not work well in Figure 8. The boundary etching hypothesis indicates difference in the Q-degradation in the "European Headache" with forming method. As a future study, comparison of the Q-degradation in
212 K. SAITO et al.
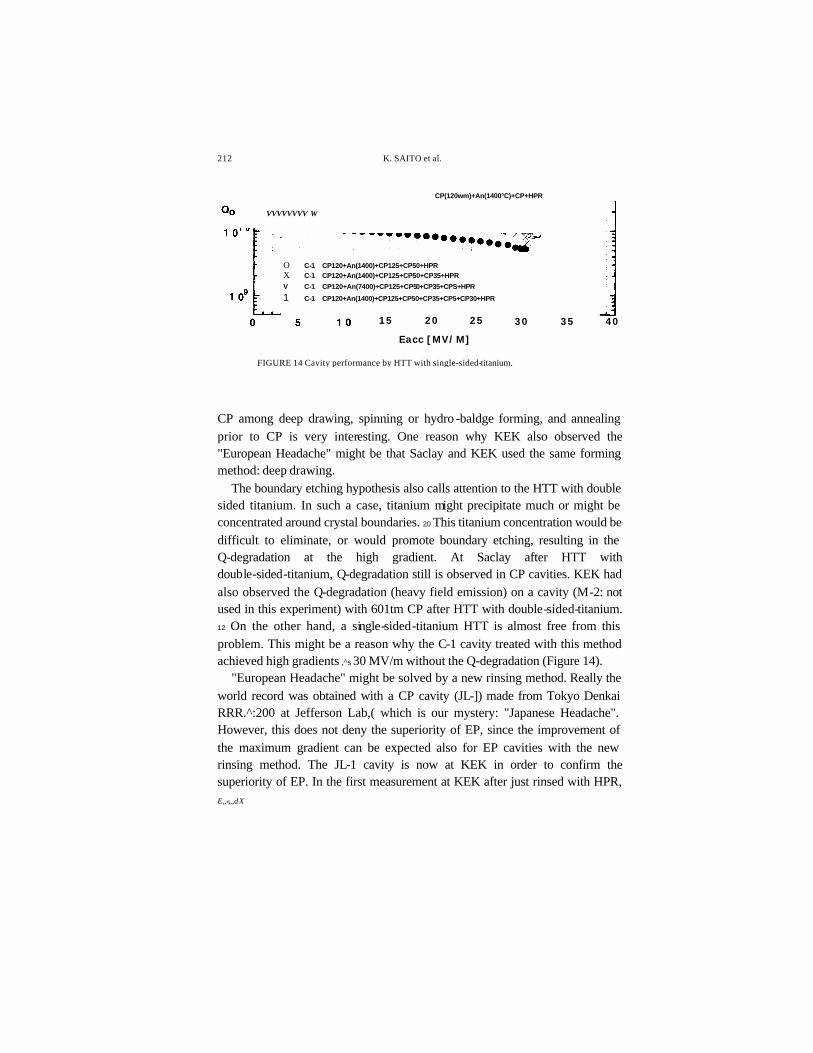
CP(120wm)+An(1400°C)+CP+HPR
VVVVVVVV W
O C-1 CP120+An(1400)+CP125+CP50+HPR X C-1 CP120+An(1400)+CP125+CP50+CP35+HPR
V C-1 CP120+An(7400)+CP125+CP50+CP35+CPS+HPR
1 C-1 CP120+An(1400)+CP125+CP50+CP35+CP5+CP30+HPR
15 20 25
Eacc [MV/M]
30 35 40
FIGURE 14 Cavity performance by HTT with single-sided-titanium.
CP among deep drawing, spinning or hydro -baldge forming, and annealing prior to CP is very interesting. One reason why KEK also observed the "European Headache" might be that Saclay and KEK used the same forming method: deep drawing.
The boundary etching hypothesis also calls attention to the HTT with double sided titanium. In such a case, titanium might precipitate much or might be concentrated around crystal boundaries. 20 This titanium concentration would be difficult to eliminate, or would promote boundary etching, resulting in the Q-degradation at the high gradient. At Saclay after HTT with double-sided-titanium, Q-degradation still is observed in CP cavities. KEK had also observed the Q-degradation (heavy field emission) on a cavity (M-2: not used in this experiment) with 601tm CP after HTT with double-sided-titanium. 12 On the other hand, a single-sided-titanium HTT is almost free from this problem. This might be a reason why the C-1 cavity treated with this method achieved high gradients ,^s 30 MV/m without the Q-degradation (Figure 14).
"European Headache" might be solved by a new rinsing method. Really the world record was obtained with a CP cavity (JL-]) made from Tokyo Denkai RRR.^:200 at Jefferson Lab,( which is our mystery: "Japanese Headache". However, this does not deny the superiority of EP, since the improvement of the maximum gradient can be expected also for EP cavities with the new rinsing method. The JL-1 cavity is now at KEK in order to confirm the superiority of EP. In the first measurement at KEK after just rinsed with HPR, E„«„,dX
HIGH GRADIENTS ELECTROPOLISHING 213
was limited at 13 MV/m. This cavity is waiting a cold test after EP. Further experiments are undergoing.
C. Processing Levels at KEK
We have a problem to overcome with our cavities. We observe often that processing levels accompanied X-ray at Ea,c = 15-20 MV/m and around 25 MV/m. In many cases these levels are easily processed out, but sometimes partially processed out or cannot be overcome. And in some cases there is nothing at all. It has no correlation with chemistry, EP or CP. Changing the demineralized water in the rinsing to ultrapure water, the situation does not change. Oil-free evacuation was tried with a scroll pump for rough pumping instead of the rotary pump, but there was no change. Alcohol rinsing was also tried but the result was the same. Similar but much light processing level was observed at Saclay.'`1 It is rare at Jefferson Lab 16 and there is no report from DESY.
We were suspecting multipacting for this phenomenon 22,23 Multipacting was reported for the cavities with spherical shape. 24,25 To make it clear, recently we did an experiment in collaboration with Jefferson Lab, where the secondary electron yield of the niobium surface was intentionally increased by oil contamination. Processing levels were observed at 14, 17 and 25 MV/m in this experiment. Recently computer calculations have been carried out by Dr. R. Parodi at INFN Genoa for this result and has predicted one point MP at 14 MV/m and two point MP at 25 MV/m.16 For the level of Ed,, = 17 MV/m, the trajectory simulation has not yet succeeded and further calculations are needed. The barrier at 25 MV/m seen in Figure 5 might be related to the multipacting, however, a further investigation with temperature mapping and X-ray mapping is needed.
5. POSSIBLE CHEMISTRIES FOR Ea,, = 40 MV/m For the future superconducting linear colliders like TESLA -1000, upgrading the gradient is very important. From our experiments we can propose several procedures based on the finishing by EP as candidates to achieve 40 MV/m. In any case more powerful rinsing method
214 K. SAITO et al.
is desirable or might be indispensable to improve the reliability. If the annealing furnace is clean enough, the final EP can be done before 750°C annealing.
(1) Heavy Removal (> 100 Nm) by BP or CP or EP + annealing (750°C) + EP (> 30 Nm) + HPR
With these procedures, we have already achieved 35 MV/m without a Q-degradation. The necessary removal thickness is not yet known, and an improvement might be expected by the optimization of the amount of the final EP.
(2) HTT (> 1300°C with Ti) + EP (> 100 Nm) + annealing (750° C) + HPR
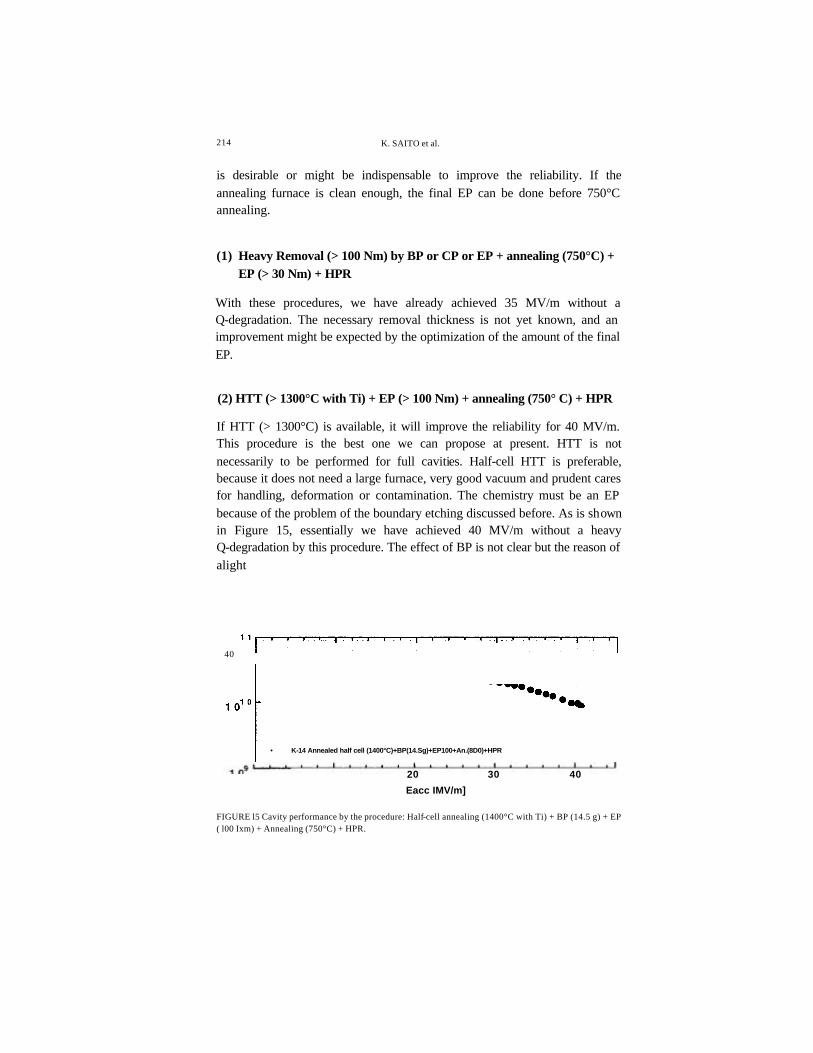
If HTT (> 1300°C) is available, it will improve the reliability for 40 MV/m. This procedure is the best one we can propose at present. HTT is not necessarily to be performed for full cavities. Half-cell HTT is preferable, because it does not need a large furnace, very good vacuum and prudent cares for handling, deformation or contamination. The chemistry must be an EP because of the problem of the boundary etching discussed before. As is shown in Figure 15, essentially we have achieved 40 MV/m without a heavy Q-degradation by this procedure. The effect of BP is not clear but the reason of alight
40
• K-14 Annealed half cell (1400°C)+BP(14.Sg)+EP100+An.(8D0)+HPR
20 30 40
Eacc IMV/m]
FIGURE l5 Cavity performance by the procedure: Half-cell annealing (1400°C with Ti) + BP (14.5 g) + EP ( l00 Ixm) + Annealing (750°C) + HPR.
HIGH GRADIENTS ELECTROPOLISHING 215
BP added is that we had not enough reliability on EBW at that time. The details of this experiment is reported in the Ref. [26].
6. SUMMARY By a series of our experiments in the last two years on the 1.3 GHz single-cell niobium cavities, the following were made clear:
(1) The "European Headache" seen at Saclay is observed also at KEK. This is characterized by a steep Q-degradation with or without X-ray detection, starting at the gradient below 25 MV/m. This phenomenon is common to the chemically polished cavities, so it should be called as "CP Headache".
(2) It is very hard to achieve higher gradients > 25 MV/m by the conventional CP. On the other hand, the high gradients over 30 MV/m can be achieved by the finishing with EP irrespectively of the method of pre-polishing. The superiority of EP over CP is clear.
(3) The reason why KEK have attained the gradient > 30 MV/m so often is owing to the EP, and not to the material.
Acknowledgment
This work has been done with much cooperations from companies conducting R&D of superconducting cavities together with us. The authors would like to thank the following people for their useful discussions and many contributions: Mrs. T. Suzuki, M. Shiratake and Miss. T. Higuchi from Nomura Plating Co. Ltd., Mrs. K. Takeuchi and H. Umezawa from Tokyo Denkai Co. Ltd., Mr. M. Matsuoka from Mitsubishi Heavy Industries, Miss. T. Ohta from TOSHIBA Co. Ltd., Mr. H. Kitamura and Dr. Y. Kojima from Mitsubishi Electric Corporation, Mr. Y. Matsubara from Sumitomo Heavy Industry.
The authors would like to express thanks to several people of the cryogenic center at KEK: Mrs. K. Mimori, S. Sugawara, M. lida, H. Ohhata for supplying liquid helium. The authors would like to appreciate Professors of the accelerator division: M. Kihara, K. Takada, Y. Yamazaki and S. Kurokawa for their continuous encouragement and supports to our activity. This work is supported widely by the machining center and the cryogenic center at KEK.
216 K. SAITO et al.
The authors would like to express thanks to former Prof. S. Koizumi and Profs. N. Hitomi and T. Shintomi. Finally, the authors would like to thank Prof. H. Sugawara, Director General of KEK for his continuous support to our activity.
References
[1] P. Kneisel, Surface Preparation of Niobium, Proc. of the Ist Workshop on RF Superconductivity, Karlsruhe, Federal Republic of Germany, July 2 -4, 1980, p. 27.
[21 D. Bloess, Chemistry and Surface Treatment, 2nd Workshop on RF Superconductivity, CERN, July, 1984, p. 409.
[3] E. Kako et al., Characteristics of the Results of Measurement on 1.3 GHz High Gradient Superconducting Cavities, Proc. of the 7th Workshop on Superconductivity, October 17-20, 1995, Saclay, Gif sur Yvette, France, p. 425.
[4] H. Safa et al., Nb Purification by Ti Gettering, Proc. of the 7th Workshop on Superconductivity, October 7 7 -20, 1995, Saclay, Gif sur Yvette, France, p. 649.
H. Inoue et al., In-house L-band Niobium Single Cell Cavities AT KEK, Proc. of the 18th Linear Accelerator Meeting in Japan, Tsukuba, 21-23 July, 1993, p. 304, (in Japanese).
[61 H. Umezawa et al., Development of High Purity Niobium Material for Super conducting Cavities, Proc. of the 18th Linear Accelerator Meeting in Japan, Tsukuba, 21-23 July, 1993, p. 318 (in Japanese).
[7] D. Proch, private communication. [8] T. Higuchi et al., Investigation on Barrel Polishing for Superconducting Ni obium Cavities, Proc. of
the 7th Workshop on Superconductivity, October 17-20, 1995, Saclay, Gif sur Yvette, France, p. 723. [9] T. Higuchi et al., Finished Niobium Cavity Surface with Barrel Polishing, Proc. of the 21st Linear
Accelerator Meeting in Japan, AERINU, Tokyo, September 30-October 2, 1996, p. 228 (in Japanese). [10] K. Saito et al., R&D of Superconducting Cavities at KEK, Proc. of the 4th Workshop on
Superconductivity, August 14-18,1989, KEK, Tsukuba, Japan, p. 635. [11] T. Ohta et al., Activities on Superconducting Cavities at TOSHIBA, in this workshop.
E. Kako et al., Test Results on High Gradient L-band Superconducting Cavities, Proc. of the 6th Workshop on Superconductivity, October 4 -8, 1993, CEBAF, Newport News, Virginia, USA, p. 918. K. Saito et al., Quick Vertical Test System for L-band Superconducting RF Cavities, Proc. of the 21st Linear Accelerator Meeting in Japan, AERINU, Tokyo, September 30-October 2, 1996, p. 222 (in Japanese).
[14] E. Mahner and P. Kneisel et al., Effect of Chemical Polishing on the Electron Field Emission of Niobium Samples and Cavities, Proc. of the 6th Workshop on Superconductivity, October 4-8, 1993, CEBAF, Newport News, Virginia, USA, p. 1085.
[151 E. Kako et al., Cavity Performances in the 1.3 GHz Saclay/KEK Nb Cavities, in this workshop. [16] P. Kneisel, K. Saito and R. Parodi, Performance of 1300 MHz KEK-Type Single Cell Niobium
Cavities, in this workshop. [17] P. Kneisel, R.W. Rdth and H.-G. Kurschner, Results from a nearly Defect-free Niobium Cavity, Proc.
of the 7th workshop on .superconductivity, October 17 --20, 1995, Saclay, Gif sur Yvette, France, p. 449.
[18] Y. Matsubara et al., Development on Superconducting Cavities at SHI, in this workshop.
HIGH GRADIENTS ELECTROPOLISHING 217
[19] H. Kitamura et al., Application of Electro-Chemical Buffing to L -band Superconducting RF Cavities, in
this workshop. [20] C. Antoine et al., Evidence of Preferential Diffusion and Segregation of Impurities at Grain Boundaries
in Very Pure Niobium Used for Radiofrequency Cavities, Proc. qf'the 7th Workshop on Superconductivity, October 17-20, 1995, Saclay, Gif sur Yvette, France, p. 647.
[21] E. Kako, private communication. [22] K. Saito, The Future of Surface Treatment Technologies for High Field Niobium Superconducting
Cavities, Proc. of Workshop on AC Superconductivity (ICFA), KEK December 1992, p. (38. [23] K. Saito et al., Water Rinsing of The Contaminated Superconducting RF Cavities, Proc. of the 7th
Workshop on Superconductivity, October 17-20, 1995, Saclay, Gif s ur Yvette, France, p. 379. [24] W. Weingarten, Electron Loading, Proc. of the 2nd Workshop on RF Superconductivity, CERN, 1984,
p. 409. [25] P. Fabbricatore et al., Experimental Evidence of MP. Discharges in Spherical Cavities at 3 GHz, Proc.
of the 7th W orkshop on Superconductivity, October 17-20, 1995, Saclay, Gif sur Yvette, France, p. 385. [26] M. Ono et al., Achievement of 40 MV/m Accelerating Field in L -band SCC at KEK, in this workshop.