supervised classifiers based on emerging patterns for ... · emerging patterns for class imbalance...
TRANSCRIPT

Supervised Classifiers based onEmerging Patterns for Class
Imbalance Problems
by
MSc. Octavio Loyola Gonzalez
Dissertation submitted in partialfulfillment of the requirements for the
degree of
PhD. in Computer Science
at the
Instituto Nacional de Astrofısica, Optica y Electronica (INAOE)Tonantzintla, Puebla, Mexico
October, 2017
Advisors:
PhD. Jose Francisco Martınez TrinidadCoordination of Computer Science
INAOE, Mexico
PhD. Milton Garcıa BorrotoDepartment of Artificial Intelligence
Universidad Tecnologica de La Habana (CUJAE), Cuba
c⃝INAOE 2017.All rights reserved.
The author hereby grants to INAOE permission toreproduce and to distribute copies of this thesis
document in whole or in part.

For my parents,my children, and
my wife.

Abstract
In the last years, emerging pattern-based classifiers have become an important family
of supervised classifiers. However, in those problems where the objects are not equally
distributed into the classes (class imbalance problems), emerging pattern mining al-
gorithms, not designed for this kind of problems, extract several emerging patterns
with high support for the majority class and only a few (or none) emerging patterns
with low support for the minority class. As a consequence, emerging pattern-based
classifiers tend to bias their classification results toward the majority class; obtaining
poor classification results for the minority class. Hence, in this PhD research, we first
present a study about the effect of class imbalance on quality measures for patterns;
from this study, we select the best measure for ranking emerging patterns in class imbal-
ance problems. Additionally, we propose three new algorithms for extracting emerging
patterns from imbalanced databases. Our emerging pattern mining algorithms extract
a collection of emerging patterns which allows attaining higher accuracies for supervised
classification in class imbalance problems than those emerging patterns extracted by
other emerging pattern miners developed for this kind of problems. Finally, we pro-
pose a new emerging pattern-based classifier specifically designed for class imbalance
problems, which obtains significantly better classification results than other classifiers
for class imbalance problems reported in the literature.
i


Resumen
Los clasificadores basados en patrones emergentes son una familia importante de clasi-
ficadores dentro de la clasificacion supervisada. Sin embargo, en aquellos problemas
donde los objetos no estan distribuidos equitativamente entre las clases (problemas con
desbalance de clases), los algoritmos para la extraccion de patrones emergentes, que
no toman en cuenta este tipo de problemas, extraen muchos patrones emergentes con
alto soporte para la clase mayoritaria y solo unos pocos (a veces ninguno) patrones
emergentes con bajo soporte para la clase minoritaria. Como consecuencia, los clasific-
adores basados en patrones emergentes tienden a sesgar sus resultados de clasificacion
hacia la clase mayoritaria; obteniendo ası, bajos resultados de clasificacion para la clase
minoritaria. Por ello, en esta investigacion doctoral, primero presentamos un estudio
acerca del efecto del desbalance de clases en las medidas de calidad para patrones.
Adicionalmente, propusimos tres nuevos algoritmos para extraer patrones emergentes
en bases de datos con desbalance de clases. Estos algoritmos extraen una coleccion de
patrones emergentes que permiten obtener mayor eficacia, en problemas con desbalance
de clases, que la que puede obtenerse al utilizar la coleccion de patrones emergentes
extraıdos mediante otros extractores de patrones emergentes reportados en la liter-
atura. Finalmente, propusimos un nuevo clasificador basado en patrones emergentes,
especıficamente disenado para problemas con desbalance de clases, que obtiene signi-
ficativamente mejores resultados de clasificacion que aquellos clasificadores reportados
en la literatura para problemas con desbalance de clases.
iii


Acknowledgment
First and foremost, I would like to express sincere gratitude to my advisors PhD. Jose
Francisco Martınez Trinidad and PhD. Milton Garcıa Borroto for their guidance and
knowledge during the years of this PhD research, and the development of this thesis.
Also, a special thanks goes to PhD. Jesus Ariel Carrasco Ochoa because his insights
and reviews helped me at various stages of this PhD research. Their know-how and
logical way of thinking have been of great value for my studies in computer science.
Besides my advisors, I wish to thanks the members of my revision committee for
their excellent recommendations during the preparation of this PhD research. Thanks
to PhD. Marıa del Pilar Gomez Gil, PhD. Jose Martınez Carranza, PhD. Manuel Montes
y Gomez, PhD. Carlos Alberto Reyes Garcıa, and PhD. Guozhu Dong.
Special thanks to my parents (Rebeca Lucrecia Gonzalez Alfonso and Octavio De
Jesus Loyola Delgado), words cannot express how grateful I am for all the sacrifices
that they have made on my behalf. Thank for all their love, advice, and encouragement
during all my educational formation.
I would like to special thanks to my beloved wife (Leya) by her support and love in
each step of my life because her hints have been a guide for my personal and professional
life. Her love for me during all these years of PhD research was what sustained me so
far. Also, I thank my baby Owen and my son Fabio because they are the engine into
my heart. I hope this achievement will inspire your lives as students.
During my stays in Mexico, my stepfather (Raul Mora Bauta) and my in-laws
(Mirian Lopez Gonzalez and Lazaro Elio Dıaz Perez) provided support and love for my
wife and my children in Cuba, for which I am very grateful.
My sincere thanks also go to my friends Mil, Migue, and Andrew by all these years
together in this long way of researches about data mining and knowledge discovery.
Thank you for the stimulating discussions, for the sleepless nights we were working
together before deadlines, and for all the achievements we have had in the last four
v

Acknowledgments vi
years. I also want to thank my childhood friends Yuniel, Raul, and Yoan because they
always provide me their constant unconditional help. Thank to these friends for their
support and encouragement during this PhD research.
I thank my former coworkers (Alberto, Cosme, Dayton, Evelio, Jorge, Julito, Liuben,
and Sacha) for their collaborations in the Laboratory of Computer Science, Centro de
Bioplantas , University of Ciego de Avila, Cuba. I also want to acknowledge the help
provided by all the members of the Centro de Bioplantas and the Crime Laboratory of
Ciego de Avila, Cuba, during these years of PhD research.
In the course of this PhD research I have collaborated with many colleagues and
friends (Adrian, Airel, Arquımides, Bustio, Chang, Lazo, Mike, Niusvel, Oves, Raudel,
Raul, and Vladimir) for whom I have great regard, and I wish to extend my warmest
thanks to all those who have helped me during my research stay in the Instituto Nacional
de Astrofısica, Optica y Electronica (INAOE).
I also wish to thank Migue and Raul for their suggestions, which significantly im-
proved the linguistic quality of this thesis. Also, I thank Annette and Rebekah for their
valuable contributions improving the grammar and style of the publications derived
from this PhD research.
Last but not the least, I thank the INAOE and to the National Council of Science
and Technology of Mexico (CONACyT), under the doctoral scholarship grant 370272,
for their support during this PhD research.
Thanks to all of you,Octavio Loyola Gonzalez.
Tonantzintla, Puebla, Mexico.October, 2017.
Contents
List of Figures ix
List of Tables xii
Acronyms xiii
1 Introduction 1
1.1 Motivation and justification of the problem . . . . . . . . . . . . . . . . 5
1.2 Objectives . . . . . . . . . . . . . . . . . . . . . . . . . . . . . . . . . . 6
1.3 Contributions . . . . . . . . . . . . . . . . . . . . . . . . . . . . . . . . 7
1.4 Thesis organization . . . . . . . . . . . . . . . . . . . . . . . . . . . . . 8
2 Related work 9
2.1 Emerging pattern mining in class imbalance problems . . . . . . . . . . 9
2.2 Supervised classifiers based on emerging patterns for class imbalance
problems . . . . . . . . . . . . . . . . . . . . . . . . . . . . . . . . . . . 12
2.3 Supervised classifiers not based on emerging patterns for class imbalance
problems . . . . . . . . . . . . . . . . . . . . . . . . . . . . . . . . . . . 13
2.4 Discussion . . . . . . . . . . . . . . . . . . . . . . . . . . . . . . . . . . 17
3 Quality measures for patterns in class imbalance problems 21
3.1 Quality measures for patterns . . . . . . . . . . . . . . . . . . . . . . . 21
3.2 A study of quality measures for patterns in class imbalance problems . 24
3.2.1 Experimental setup . . . . . . . . . . . . . . . . . . . . . . . . . 25
3.2.2 Experimental results . . . . . . . . . . . . . . . . . . . . . . . . 30
3.3 Concluding remarks . . . . . . . . . . . . . . . . . . . . . . . . . . . . . 33
vii

Contents viii
4 Emerging pattern miners for class imbalance problems 35
4.1 Data level . . . . . . . . . . . . . . . . . . . . . . . . . . . . . . . . . . 35
4.1.1 Experimental results . . . . . . . . . . . . . . . . . . . . . . . . 38
4.2 Algorithm level . . . . . . . . . . . . . . . . . . . . . . . . . . . . . . . 43
4.2.1 Experimental results . . . . . . . . . . . . . . . . . . . . . . . . 49
4.3 Cost-sensitive . . . . . . . . . . . . . . . . . . . . . . . . . . . . . . . . 54
4.3.1 Experimental results . . . . . . . . . . . . . . . . . . . . . . . . 59
4.4 Concluding remarks . . . . . . . . . . . . . . . . . . . . . . . . . . . . . 63
5 Emerging pattern-based classifier for class imbalance problems 65
5.1 PBC4cip: A novel emerging pattern-based classifier for class imbalance
problems . . . . . . . . . . . . . . . . . . . . . . . . . . . . . . . . . . . 65
5.2 Experimental results . . . . . . . . . . . . . . . . . . . . . . . . . . . . 67
5.2.1 Comparison between PBC4cip and iCAEP . . . . . . . . . . . . 69
5.2.2 Comparing against supervised classifiers not based on emerging
patterns for class imbalance problems . . . . . . . . . . . . . . . 71
5.3 Concluding remarks . . . . . . . . . . . . . . . . . . . . . . . . . . . . . 73
6 Conclusions 75
6.1 Conclusions . . . . . . . . . . . . . . . . . . . . . . . . . . . . . . . . . 76
6.2 Contributions . . . . . . . . . . . . . . . . . . . . . . . . . . . . . . . . 77
6.3 Future work . . . . . . . . . . . . . . . . . . . . . . . . . . . . . . . . . 78
6.4 Publications . . . . . . . . . . . . . . . . . . . . . . . . . . . . . . . . . 79
Bibliography 80
A Statistical tests 99

List of Figures
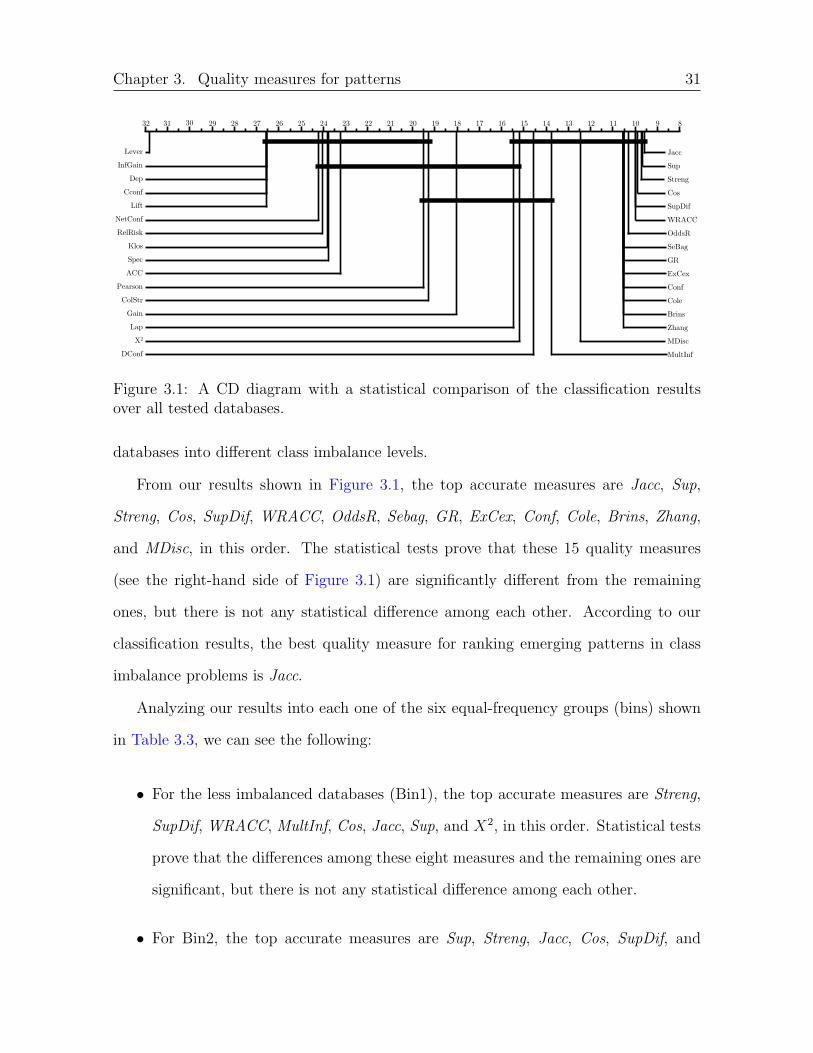
3.1 A CD diagram with a statistical comparison of the classification results
over all tested databases. . . . . . . . . . . . . . . . . . . . . . . . . . . 31
4.1 CD diagram with a statistical comparison of the results for the Baseline
classifier (LCMine+CAEP) with and without applying resampling meth-
ods over all the tested databases. . . . . . . . . . . . . . . . . . . . . . 40
4.2 Example of a decision tree with four features and two classes: Good
Player and Bad Player. . . . . . . . . . . . . . . . . . . . . . . . . . . . 48
ix

List of Tables
3.1 Contingency table . . . . . . . . . . . . . . . . . . . . . . . . . . . . . . 23
3.2 Summary of the quality measures used in our study . . . . . . . . . . . 27
3.3 Summary of the imbalanced databases used in our study . . . . . . . . 29
3.4 Results of the best quality measures for each Bin . . . . . . . . . . . . 33
4.1 The best resampling method for each bin created by discretizing the IR
on the tested databases . . . . . . . . . . . . . . . . . . . . . . . . . . . 41
4.2 Wilcoxon signed-rank test comparing SMOTE-TL+LCMine against DEP,
using all the tested databases. . . . . . . . . . . . . . . . . . . . . . . . 43
4.3 Average AUC, standard deviation (SD), average rankings (based on the
Friedman’s test), and p-values (based on the Finner’s procedure) for each
classification results of CAEP by using the patterns extracted by each
tested emerging pattern miner (Miner). . . . . . . . . . . . . . . . . . . 52
4.4 Wilcoxon signed-rank test comparing the results of SMOTE-TL+LCMine
against the results of HRFm, using all the tested databases. . . . . . . 53
4.5 The best emerging pattern miner for each bin created by discretizing the
IR on the tested databases . . . . . . . . . . . . . . . . . . . . . . . . . 53
4.6 Example of a cost matrix for a two-class problem. . . . . . . . . . . . . 54
4.7 Statistical results for the CAEP classifier by using the evaluated emerging
pattern miners, considering all the tested databases and a cost of 2 for
each misclassified object of the minority class. . . . . . . . . . . . . . . 61
4.8 Statistical results for the CAEP classifier by using the evaluated emerging
pattern miners, considering all the tested databases and a cost of 5 for
each misclassified object of the minority class. . . . . . . . . . . . . . . 61
xi
List of Tables xii
4.9 Statistical results for the CAEP classifier by using the evaluated emerging
pattern miners, considering all the tested databases and a cost of 10 for
each misclassified object of the minority class. . . . . . . . . . . . . . . 61
4.10 Statistical results for the CAEP classifier by using the evaluated emerging
pattern miners, considering all the tested databases and a cost of 20 for
each misclassified object of the minority class. . . . . . . . . . . . . . . 62
4.11 Statistical results for the CAEP classifier by using the evaluated emerging
pattern miners, considering all the tested databases and a cost equal to
the IR of the tested database for each misclassified objects of the minority
class. . . . . . . . . . . . . . . . . . . . . . . . . . . . . . . . . . . . . . 62
5.1 Wilcoxon signed-rank test comparing the AUC results of PBC4cip against
the AUC results of iCAEP but using LCMine as emerging patterns miner
and considering all the tested databases. . . . . . . . . . . . . . . . . . 70
5.2 Average AUC, standard deviation (SD), average rankings (based on the
Friedman’s test), and p-values (based on the Finner’s procedure) for all
the tested emerging pattern-based classifiers using all the tested databases. 71
5.3 Wilcoxon signed-rank test comparing the AUC results of HRFm+PBC4cip
against the AUC results of (SMOTE-TL+LCMine)+PBC4cip, using all
the tested databases. . . . . . . . . . . . . . . . . . . . . . . . . . . . . 71
5.4 Average AUC, standard deviation (SD), average rankings (based on the
Friedman’s test), and p-values (based on the Finner’s procedure) for
HRFm+PBC4cip and all tested classifiers for class imbalance problems
not based on emerging patterns using all the tested databases. . . . . . 72
5.5 Wilcoxon signed-rank test comparing the AUC results of PBC4cip against
the AUC results of the RUSBoost classifier, using all the tested databases. 72

Acronyms
ANOVA ANalysis Of VAriance
APV Adjusted p-value
AUC Area Under the Curve
CAEP Classification by Aggregating Emerging Patterns
CARs Class Association Rules
CCR Class Correlation Ratio
CD Critical Distance
CPU Central Processing Unit
CT Contingency Table
CTC Consolidate Tree Construction
DBF Delete Best Feature
DBP Delete Best Property
DBPL Delete Best Property by Level
DEP Dividing Emerging Patterns
DOB-SCV Distribution Optimally Balanced Stratified Cross Validation
eJEPs Essential Jumping Emerging Patterns
EP Emerging Pattern
FN False Negative
FNR False Negative Rate
FP False Positive
FPR False Positive Rate
FWER Family-Wise Error Rate
GB Gigabyte
GHz Gigaherzio
GM Geometric Mean
HexDex Hellinger Distance Extra Decision Tree
xiii

Acronyms xiv
iCAEP Information-based Classification by Aggregating Emerging
Patterns
IR Imbalance Ratio
kENN k Exemplar-based Nearest Neighbor
KLPART Kullback-Leibler Partial Decision Trees
kNN k Nearest Neighbor
KRNN k Rare-class Nearest Neighbour
LCMine Logical Complex Miner
OCC One-Class Classifier
OCSVM One-class Support Vector Machine
PBC4cip Pattern-based Classifier for Class Imbalance Problems
PC Personal Computer
QM Quality Measure
RAM Random Access Memory
RB-Boost Random Balance Boost
RFm Random Forest Miner
RUS Random Undersampling
RUSBoost Random Undersampling Boost
SD Standard Deviation
SJEP Strong Jumping Emerging Pattern
SPARCCC Significant Positively Associated and Relatively Class Correl-
ated Classification
SVM Support Vector Machine
TN True Negative
TNR True Negative Rate
TP True Positive
TPR True Positive Rate
WBEPM Window for Balanced Emerging Pattern Mining

Chapter 1Introduction
Supervised classification is one of the most popular pattern recognition techniques
[Chen, 2016], which has been widely studied and applied in many areas, such as bioin-
formatics [Hassanien et al., 2013; Zhao et al., 2014], human activity recognition [Onofri
et al., 2016; Khemchandani and Sharma, 2016; Wu et al., 2016], rare event forecasting
[Chen and Lee, 2015; GhasemiGol et al., 2016], information retrieval [Wu, 2015; Bouad-
jenek et al., 2016; Song et al., 2014], masquerader detection [Medina-Perez et al., 2017;
Camia et al., 2016; Rodrıguez et al., 2016], and personal risk detection [Barrera-Animas
et al., 2017; Rodrguez et al., 2016]; among others.
Several classifiers have been proposed for supervised classification. In this thesis, we
focused on the emerging pattern-based classifiers [Garcıa-Borroto et al., 2010b, 2014,
2015]. A supervised classifier based on emerging patterns uses a collection of emerging
patterns to create a classifier that predicts the class of a query object [Zhang and Dong,
2012].
A pattern is an expression defined in a certain language that describes a collec-
tion of objects [Michalski and Stepp, 1982; Garcıa-Borroto et al., 2014]. Usually, it
is represented by a conjunction of relational statements, each of the form: [fi # vj],
where vj is a value in the domain of feature fi and # is a relational operator from
the set {=, =,≤, >}. For example, [body temperature > 37] ∧ [body temperature ≤
38] ∧ [Rash = “Y es”] ∧ [muscle pain = “Severe”] ∧ [Conjunctivitis = “No”] is a
pattern that describes a collection of patients suffering from Zika virus [Hamel et al.,
2016]. An emerging pattern (EP) is a pattern whose fraction of objects covered by the
pattern in the training set (support) is higher in a class with respect to its support in
1

Chapter 1. Introduction 2
the other classes [Dong and Li, 1999; Garcıa-Borroto et al., 2010b; Dong, 2012b].
Emerging pattern-based classifiers can explain their results in a language close to a
human expert through the patterns. On the other hand, in some domains, emerging
pattern-based classifiers have shown more accurate predictions than other popular clas-
sification models like decision trees, naive bayes, nearest neighbor, bagging, boosting,
and support vector machine (SVM) [Garcıa-Borroto et al., 2010b,a; Zhang and Dong,
2012].
Emerging pattern-based classifiers are used in several real-world applications, such
as gene expression profiles [Dong et al., 2004], structural alerts for computational tox-
icology [Bertrand Cuissart Guillaume Poezevara and Bureau, 2012], gene transfer and
microarray concordance analysis [Mao and Dong, 2012], characterization for subtypes
of leukemia [Li and Wong, 2012], classification of spatial and image data [Kobylinski
and Walczak, 2012], and prediction of heart diseases [Keun Ho Ryu Dong Gyu Lee and
Piao, 2012].
Mining emerging patterns is a challenging problem (proven to be NP-hard by Wang
et al. [2004]) because of the high computational cost due to the exponential number
of candidate patterns [Han et al., 2007; Szathmary et al., 2007; Feng and Dong, 2012;
Hong Cheng Jiawei Han and Yu, 2012; Yu et al., 2012]. Also, some algorithms for
mining emerging patterns need an a priori global discretization of the features in the
training dataset, which might cause information loss [Garcıa-Borroto et al., 2014, 2015].
For this reason, those emerging pattern miners based on decision trees deserve special
attention because this paradigm does not include a global discretization step, has a low
computational cost, and allows obtaining a small collection of high-quality patterns
[Novak et al., 2009; Garcıa-Borroto et al., 2014, 2015].
On the other hand, there are many real-world applications where the objects are
not equally distributed into the classes, such as detection of microcalcifications in mam-

Chapter 1. Introduction 3
mogram images [M.N and Sheshadri, 2012], online banking fraud detection [Wei et al.,
2013], liver and pancreas disorders [Li et al., 2010], forecasting of ozone levels [Tsai
et al., 2009], surveillance of nosocomial infection [Cohen et al., 2006], prediction of
protein sequences [Al-shahib et al., 2005], and face recognition [Yang et al., 2004]. In
these applications, there exist significantly fewer objects belonging to a class (commonly
labeled as minority class) regarding the remaining classes. This problem is known as
class imbalance problem [Weiss, 2004, 2010a; Chen and Dong, 2012; Zhang and Dong,
2012; Lopez et al., 2013; Wei et al., 2013; Lopez et al., 2014a].
Some classifiers, showing good classification results in problems with balanced classes,
do not achieve good performance in class imbalance problems. The main reason is that
they produce a bias of classification results toward the majority class (the class with
more objects). Accordingly, the accuracy of these classifiers for the minority class could
be poor, sometimes close to zero [He, 2013; Lopez et al., 2013; Loyola-Gonzalez et al.,
2013, 2016b].
In the literature, three approaches have been proposed to deal with the class imbal-
ance problem:
Data level: The goal in this approach is to create a balanced dataset from the im-
balanced training dataset by generating objects into the minority class (Over-
sampling), removing objects from the majority class (Undersampling), or both
(hybrid sampling) [Weiss et al., 2007; Chawla, 2010; Luengo et al., 2011; Soda,
2011; Albisua et al., 2013; Charte et al., 2013; Lopez et al., 2014a,b; Menardi and
Torelli, 2014; Charte et al., 2015].
Algorithm level: Here, the aim is to modify the classifiers to be more accurate on
class imbalance problems. Some proposals include classifier ensembles or the
combination of resampling methods jointly with boosting or bagging algorithms.

Chapter 1. Introduction 4
This approach is not as versatile as the data level approach because it heavily
relies on a specific classifier and thereby the modifications are intended to solve
the class imbalance problem for a specific classifier [Lenca et al., 2008; Liu et al.,
2010; Liu and Chawla, 2011a; Li and Zhang, 2011a; Rodda, 2011; Yijing et al.,
2016].
Cost-sensitive: The idea behind this approach is to assign different misclassification
costs through a cost matrix. Usually, misclassifying objects belonging to the
minority class have higher misclassification cost than misclassifying objects be-
longing to the majority class. In this way, the aim is to minimize the total cost
[Domingos, 1999; Sun et al., 2007; Freitas, 2011; Jackowski et al., 2012; Min and
Zhu, 2012; Lomax and Vadera, 2013; Palacios et al., 2014; Konijn et al., 2014;
Krawczyk et al., 2014; Fan et al., 2015; Gomes et al., 2015].
Based on these approaches, in the literature, there are only three emerging pattern
miners for class imbalance problems that follow the data level approach [Alhammady
and Ramamohanarao, 2004a; Alhammady, 2007; Chen and Liu, 2016]. On the other
hand, following the algorithm level approach, there is an emerging pattern-based classi-
fier (iCAEP) [Zhang et al., 2000b], which was not designed for class imbalance problems,
but has shown good results in this kind of problems [Zhang and Dong, 2012]. How-
ever, these emerging pattern miners do not allow obtaining a set of emerging patterns
which produce better classification results in class imbalance problems than other solu-
tions reported in the literature for class imbalance problems, which are not based on
patterns. Also, iCAEP does not outperform other classifiers designed for class imbal-
ance problems, which are not based on emerging patterns [Loyola-Gonzalez et al., 2017].
Therefore, introducing both emerging pattern miners as well as emerging pattern-based
classifiers to obtain accurate classification results for class imbalance problem is needed.

Chapter 1. Introduction 5
1.1 Motivation and justification of the problem
In data mining, there are some problems where the most important class has fewer
objects than the other classes, i.e., these problems are class imbalance problems [Weiss,
2004; Weiss and Tian, 2008; Weiss, 2010a; Fernandez et al., 2011; Loyola-Gonzalez
et al., 2016b]. The main reasons to obtain imbalanced databases are:
i) Data acquisition for some kind of objects is highly expensive.
ii) Some objects are associated to rare cases, which are very difficult to collect.
These reasons lead to obtain imbalanced databases, and consequently, the classifiers
tend to bias their classification results toward the majority class. Therefore, a classifier
that provides good classification results for class imbalance problems is needed [He,
2013; Lopez et al., 2013; Loyola-Gonzalez et al., 2013; Lopez et al., 2014b; Loyola-
Gonzalez et al., 2016b].
Despite the fact that several pattern-based classifiers have been proposed, most of
them do not achieve good classification results in class imbalance problems. Several
reasons about these results have been discussed [Weiss, 2004, 2010a,b; Lopez et al.,
2013; Loyola-Gonzalez et al., 2016b], but the main ones are the following:
a) Several pattern mining algorithms based on a divide-and-conquer approach tend to
fragment the training dataset into small partitions, commonly producing, even more,
imbalance among the classes. Hence, the extraction of patterns from the minority
class is more difficult.
b) Commonly, patterns from the minority class have low support regarding those pat-
terns from the majority class. Then, some classification strategies, based only on
the support of the patterns, tend to be biased toward the majority class.

Chapter 1. Introduction 6
c) Some objects belonging to the minority class could be identified as noise, and then,
the classifier would discard them. Conversely, some true noisy objects from the
minority class can lead to degrade the classification results.
d) The use of global performance measures for guiding the learning process, such as
the standard accuracy rate, may bias the classification results towards the majority
class.
We can observe that some emerging pattern-based classifiers, like LCMine [Garcıa-
Borroto et al., 2010b], when applied on class imbalance problems, attain high accuracy
for the majority class but low accuracy for the minority class [Loyola-Gonzalez et al.,
2016b]. Moreover, the emerging pattern-based classifier iCAEP [Zhang et al., 2000b],
which is not designed for imbalance problems but has shown good results in this kind
of problems, does not obtain significantly better classification results than other ap-
proaches not based on emerging patterns [Loyola-Gonzalez et al., 2017]. Therefore,
better emerging pattern-based classifiers for class imbalance problems are needed.
1.2 Objectives
The general objective of this research is to develop an algorithm for mining emerging
patterns from imbalanced databases, such that the extracted emerging patterns allow
building a classifier more accurate than the best emerging pattern-based classifiers re-
ported in the literature for class imbalance problems.
Our specific objectives are:
1. Propose an algorithm for mining emerging patterns from imbalanced databases.
Chapter 1. Introduction 7
2. Propose a quality measure to evaluate the quality of the emerging patterns extracted
from imbalanced databases.
3. Propose a strategy for filtering emerging patterns extracted from imbalanced data-
bases.
4. Propose a classifier based on emerging patterns extracted from imbalanced data-
bases, which outperforms other emerging pattern-based classifiers reported in the
literature for class imbalance problems.
1.3 Contributions
In this PhD dissertation, we first present a study of several quality measures for pat-
terns, with the aim of determining the effect of class imbalance on quality measures
for patterns. Based on this study, we provide a guide for determining which quality
measures would have better behavior for filtering emerging patterns regarding the class
imbalance level of a dataset.
Additionally, we introduce three algorithms for mining emerging patterns in class
imbalance problems. The first one is an emerging pattern miner based on a hybrid
resampling method. The second one is a modification of the random forest miner (RFm)
[Garcıa-Borroto et al., 2015] but using a skew-insensitive measure as node splitting
criterion. The last one is a cost-sensitive algorithm for mining emerging patterns based
on a cost matrix. Each introduced algorithm extracts a set of emerging patterns,
which allows attaining better classification results than other solutions reported in the
literature for class imbalance problems.
Finally, we introduce a new emerging pattern-based classifier for class imbalance
problems in which, to solve the class imbalance problem, the support of the patterns
is combined with the class imbalance level of the training sample for weighting the
Chapter 1. Introduction 8
patterns at the classification stage. This classifier significantly outperforms other state-
of-the-art classifiers designed for class imbalance problems.
1.4 Thesis organization
The content of this thesis is organized as follows. Chapter 2 presents a review of
state-of-the-art about emerging pattern mining on class imbalance problems, as well
as, emerging pattern-based classifiers for class imbalance problems. Also, this chapter
includes a review of some classifiers for class imbalance problems, which are not based
on emerging patterns. Chapter 3 provides a review of the state-of-the-art of quality
measures for patterns and a study of these quality measure in class imbalance problems.
As part of this study, two filtering algorithms for emerging patterns are introduced.
Chapter 4 introduces three algorithms for mining emerging patterns in class imbalance
problems. Chapter 5 introduces a new classifier based on emerging patterns for class
imbalance problems. Finally, Chapter 6 shows the conclusions of this thesis and presents
our contributions, future work, as well as the publications derived from this thesis.
Chapter 2Related work
This chapter presents a review of the state-of-the-art on emerging pattern miners and
supervised classifiers based on emerging patterns for class imbalance problems, as well
as other related classifiers not based on emerging patterns, which also are designed
for class imbalance problems. For a better understanding, we split the content of this
chapter as follows: Section 2.1 presents the works reported in the literature for mining
emerging patterns in class imbalance problems. Section 2.2 describes the only emerging
pattern-based classifier reported in the literature that, although it was not designed for
class imbalance problems, has reported good results in this kind of problems. Since
this PhD research is related to the problem of supervised classification with imbalanced
classes, in Section 2.3 we also review some of the most successful supervised classifiers,
not based on emerging patterns, for class imbalance problems. Finally, in Section 2.4,
we present a brief discussion about the related work.
2.1 Emerging pattern mining in class imbalance prob-
lems
A key requirement for emerging pattern-based classifiers is to have a good collection
of patterns. Therefore, several pattern mining algorithms have been proposed with the
aim of extracting a collection of quality patterns. Nevertheless, most of the emerging
pattern mining algorithms were introduced assuming balanced classes, and hence they
do not attain good classification results in class imbalance problems [Alhammady and
Ramamohanarao, 2004a,b; Alhammady, 2007; Chen and Liu, 2016]. To the best of our
knowledge, there only exist three algorithms designed for mining emerging patterns in
9
Chapter 2. Related work 10
class imbalance problems.
In 2004, Alhammady and Ramamohanarao proposed the EPRC miner, which cre-
ates new emerging patterns for the minority class with the aim that they do not become
overwhelmed by the emerging patterns from the majority class. This is achieved as fol-
lows. First, from the training dataset, all the emerging patterns are extracted. The
authors do not comment which algorithm is used for mining these patterns. After that,
from each pattern of the minority class, new emerging patterns for the minority class
are built as follows. For each item in the pattern, a new emerging pattern is built by
replacing the item value by the feature value, of the corresponding feature, having the
highest ratio between its support in the majority class and its support in the minority
class (Growth Rate [Dong and Li, 1999]); keeping all other items as they are in the
original pattern. After, duplicate emerging patterns are removed. In a second stage, all
the emerging patterns whose Growth Rate is less than a given threshold are eliminated.
Finally, at the last stage, the support value for all the emerging patterns of the minority
class is multiplied by a weight greater than one. In this way, the support value for all
the emerging patterns from the minority class is artificially increased. Consequently,
the support value for these emerging patterns will not be overwhelmed by the support
value of the emerging patterns from the majority class at the classification stage.
The authors comment that the thresholds for removing emerging patterns and the
weight for multiplying the support of the emerging patterns in the minority class were
tuned using 30% of the training dataset. In order to evaluate the quality of the emerging
patterns extracted using EPRC, the authors used the emerging pattern-based classifier
CEP [Bailey et al., 2003], which was proposed for problems with balanced classes. The
strategy provided by EPRC tries to overcome the class imbalance problem by creating
new emerging patterns for the minority class. It is important to highlight that these new
emerging patterns do not necessarily cover objects of the minority class in the training

Chapter 2. Related work 11
dataset, because their combination of item values may not appear in the objects of the
minority class.
In 2007, Alhammady proposed the DEP miner, which creates balanced subsamples
(based on a resampling approach) for mining emerging patterns in class imbalance
problems. To do this, first, DEP extracts the emerging patterns for the majority class
from the original training dataset. The authors do not mention which algorithm is used
for mining these emerging patterns. Then, DEP creates balanced subsamples containing
all the objects from the minority class and a subset of objects from the majority class.
DEP creates as many subsamples as it can by using the objects from the majority
class without replacement. Then, from each subsample, the emerging patterns for the
minority class are extracted. In this way, several emerging patterns for the minority
class are extracted, and consequently, they are not overwhelmed by the number of
emerging patterns from the majority class. Later, all the emerging patterns from the
minority class are ranked taking into account the value obtained by multiplying the
Support and the Growth Rate of each pattern (Strength [Tan et al., 2004]).
These ranked emerging patterns are divided into two subsets: the first one contains
the first patterns in the ranking, as many as the number of emerging patterns previously
computed for the majority class. The second subset contains the remaining emerging
patterns of the minority class. Finally, the emerging patterns of the majority class are
compared with the emerging patterns in the first subset. If an emerging pattern from
the majority class appears in the first subset, then it is removed from the first subset
and the best emerging pattern from the second subset, according to the ranking, is
added to the first subset. This procedure is repeated as many times as necessary to
ensure all duplicates are eliminated. For evaluating the quality of the emerging patterns
extracted by DEP, the authors in their experiments used the emerging pattern-based
classifier BCEP [Fan and Ramamohanarao, 2003], which was not specifically designed

Chapter 2. Related work 12
for class imbalance problems. The experimental results show that the emerging pat-
terns extracted by DEP attain better classification results than the emerging patterns
extracted by EPRC.
In 2016, Chen and Liu proposed the WBEPM miner, an algorithm for mining
emerging patterns from imbalanced data streams. Similar to DEP, WBEMP creates
several balanced subsamples but using a sliding window mechanism. Each subsample
contains all the objects from the minority class and a subset of objects, without re-
placement, from the majority class. After that, emerging patterns are extracted from
each subsample by using a variant of the algorithm for mining emerging patterns, in
balanced datasets, proposed by Fan and Kotagiri [2002] (eJEPs). For evaluating the
quality of all the emerging patterns extracted by WBEPM, the authors in their ex-
periments used the emerging pattern-based classifier CAEP [Dong et al., 1999]. The
experimental results show that the emerging patterns extracted by WBEPM attain
better classification results than the emerging patterns extracted by eJEPs from the
original imbalanced dataset.
2.2 Supervised classifiers based on emerging pat-
terns for class imbalance problems
Emerging pattern-based classifiers have not been thoroughly studied for class imbalance
problems [Zhang and Dong, 2012]. Actually, to the best of our knowledge, there are
not emerging pattern-based classifiers specifically designed for class imbalance prob-
lems. Nevertheless, in a study conducted by Zhang and Dong [2012], authors showed
that the iCAEP (Information-Based Classification by Aggregating Emerging Patterns)
classifier obtains good classification results in class imbalance problems. Nevertheless,
this finding/result has not been completely validated, requiring further experimenta-
Chapter 2. Related work 13
tion, since the authors use only three imbalanced databases, and the results were not
validated using any statistical test.
Originally, iCAEP was introduced in [Zhang et al., 2000b] to deal with large-volume
high-dimensional datasets, but it was neither tested nor designed to deal with class im-
balance problems. iCAEP relies on two quality measures for emerging patterns with the
aim to classify a query object using a collection of high-quality patterns. To do this, first,
the authors propose to extract a set of emerging patterns using ConsEPMiner [Zhang
et al., 2000a], which is designed for mining emerging patterns on high-dimensional data-
sets. After, the emerging patterns are ranked in descending order according to their
number of items (Length [Bailey, 2012a]). For patterns with the same number of items,
the Growth Rate [Dong and Li, 1999] is used as second ordering criterion. Then, for
each class, iCAEP iteratively selects (according to the ranking) patterns, until all the
features of the dataset appear in at least one item of the selected patterns. Finally,
according to each subset of emerging patterns, the query object is classified into the
class with the highest sum of supports.
2.3 Supervised classifiers not based on emerging pat-
terns for class imbalance problems
This section reviews the most successful supervised classifiers for class imbalance prob-
lems, which are not based on emerging patterns. As shall be shown, most of these
classifiers are based on decision trees or association rules.
In 2001, Scholkopf et al. proposed OCSVM, which is a variation of the SVM [Cor-
tes and Vapnik, 1995] for one-class classification. OCSVM creates two groups of objects
from the training dataset, one group contains the target objects and the second group
contains the remaining objects. Then, both groups are mapped into a high-dimensional

Chapter 2. Related work 14
feature space applying a Gaussian kernel function. After, OCSVM prioritizes those ob-
jects belonging to the minority class, in the boundary between both classes, because
these are more susceptible to be considered as noisy objects and consequently be misclas-
sified. In 2014, Wu et al. [2014] applied this approach on imbalanced text categorization
obtaining good classification results.
In 2007, Verhein and Chawla developed SPARCCC (Significant, Positively Asso-
ciated and Relatively Class Correlated Classification), a rule-based classifier, which is
based on statistical techniques. SPARCCC uses a variation of GLIMIT [Verhein and
Chawla, 2006] to extract the rules. After that, these rules are tested using the Fisher’s
exact test [Upton, 1992] and the quality measure CCR (Class Correlation Ratio) with
the aim of selecting those rules whose antecedent is more correlated with the class that
it predicts than with the other classes. Finally, SPARCCC creates a class association
rule model to deal with class imbalance problems.
In 2007, Perez et al. developed CTC (Consolidate Tree Construction), a decision
tree-based algorithm. CTC creates 100 subsamples from the training dataset to build
a decision tree from each one. Based on the most used split criteria in all the decision
trees, a new decision tree is created, which according to the authors can address class
imbalance problems. The authors show that CTC outperforms the bagged C4.5 decision
trees [Quinlan, 1993].
In 2008, Hempstalk et al. introduced OCC, a one-class classifier based on density
and class probability to deal with class imbalance problems. OCC uses a density estim-
ator based on the Bayes rule [Bayes and Price, 1763] to generate artificial data as close
as possible to the minority class; this enables the construction of a class probability
model able to classify new objects in a two-class problem. The authors showed how
this approach obtains similar classification results than SVM [Cortes and Vapnik, 1995]
when OCC uses bagged unpruned C4.5 decision trees jointly with Laplace smoothing

Chapter 2. Related work 15
[Manning et al., 2008], as the probability estimator.
In 2010, Liu et al. developed CCPDT, a classifier that builds decision trees using
a new skew-insensitive measure for evaluating splitting criteria, Class Confidence Pro-
portion (CCP). After, those branches in the decision tree are pruned using the Fisher’s
exact test [Upton, 1992]. The authors show that CCPDT outperforms SPARCCC and
how CCP complements the Hellinger distance [Cieslak and Chawla, 2008] in some de-
cision tree splitting criteria.
In 2010, Seiffert et al. proposed RUSBoost, a classifier that builds decision tree
ensembles based on a resampling method and a boosting algorithm. RUSBoost cre-
ates balanced datasets through the use of the Random Undersampling method (RUS)
[Batista et al., 2004] and after, by using the AdaBoost.M2 algorithm [Freund et al.,
1996], it creates several decision trees to be used through a classifier ensemble to deal
with class imbalance problems.
In 2011, Li and Zhang introduced kENN, a modification of the well-known k Nearest
Neighbor (kNN) classifier [Aha et al., 1991]. kENN identifies groups of objects from
the minority and majority classes. The aim is to mitigate the errors in the decision
boundaries through the generalization of the objects of the minority class. Finally,
query objects are classified taking into account their distance with the groups of objects
belonging to the minority class, and the objects belonging to the majority class. The
authors show that kENN outperforms SMOTE [Chawla et al., 2002] and MetaCost
[Domingos, 1999].
In 2012, Cieslak et al. developed HDDT, which builds a decision tree ensemble us-
ing the Hellinger distance [Cieslak and Chawla, 2008] as measure for evaluating splitting
criteria. HDDT uses Bagging [Breiman, 1996] jointly with the decision tree classifier
proposed by Cieslak and Chawla [2008] with the aim of creating a classification model
able to deal with class imbalance problems. The authors show that HDDT outperforms

Chapter 2. Related work 16
C4.5 [Quinlan, 1993] in class imbalance problems and it is not significantly worse than
C4.5 for balanced datasets.
In 2014, Kang and Ramamohanarao proposedHeDex, which builds several decision
trees using the Hellinger distance [Cieslak and Chawla, 2008] as measure for evaluating
splitting criteria. HeDex is based on randomized decision tree ensembles using the
randomization on both feature selection and split-point selection. This random strategy
yields a high level of diversity among decision trees, which helps to find a collection of
diverse classifiers to be used into a classifier ensemble. The authors show that HeDex
outperforms HDDT.
In 2015, Dıez-Pastor et al. developed RB-Boost (Random Balance Boost), a com-
bination of the Random Balance algorithm and AdaBoost.M2 [Freund et al., 1996].
RB-Boost uses (like RUSBoost [Seiffert et al., 2010] and SMOTEBoost [Chawla et al.,
2003]) a resampling approach, to create several balanced datasets from the training
dataset, and the boosting approach for creating a classifier ensemble for class imbal-
ance problems.
In 2015, Ibarguren et al. proposed Coverage, which creates several subsamples
from the training dataset without oversampling the minority class. The goal is to build
subsamples which have all the objects belonging to the minority class and a certain
percentage of the objects belonging to the majority class. The percentage value depends
on the number of subsamples to be created and the number of objects belonging to the
minority class. Finally, these generated subsamples are used to train the CTC classifier.
The authors show that Coverage outperforms others 22 classifiers, over 96 imbalanced
databases
In 2015, Su et al. introduced KLPART, which improves the PART classifier [Frank
and Witten, 1998]. PART extracts a set of rules from several C4.5 decision trees with
the aim of building an accurate classifier based on class association rules (CARs).

Chapter 2. Related work 17
KLPART uses PART jointly with the K-L divergence function [S. Kullback, 1951], as a
skew-insensitive split criterion to build decision trees from imbalanced databases. Also,
KLPART uses Laplace smoothing [Manning et al., 2008] in the split criterion, with
the goal of avoiding errors with zero probability. KLPART uses the same classification
strategy proposed for the PART classifier, but it can deal with class imbalance problems.
In 2017, Zhang et al. proposed KRNN (k Rare-class Nearest Neighbour) [Zhang
et al., 2017], which is a modification of the k Nearest Neighbor (kNN) classifier [Aha
et al., 1991]. KRNN, similar to kENN, dynamically creates groups of objects belonging
to the minority class. The goal is to directly adjust the induction bias of kNN according
to the size and distribution of these groups. KRNN, unlike to kENN, directly adjusts
the posterior probability estimation for query objects by using the Laplace estimate and
after that, it uses a classification strategy similar to the kNN classifier. The authors
show that KRNN outperforms CCW-KNN [Liu and Chawla, 2011b], a modification of
kNN for class imbalance problems.
2.4 Discussion
From the algorithms for mining emerging patterns reviewed in this chapter, we can
note that most of them use a resampling approach with the aim to create balanced
subsamples, or a balanced training dataset, from which the emerging patterns are ex-
tracted. This approach has shown good classification results in class imbalance problems
[Alhammady and Ramamohanarao, 2004a,b; Alhammady, 2007]. Nevertheless, as far
as we know, there is not a comparative study among resampling methods with the aim
of selecting the best one for mining emerging patterns in class imbalance problems.
To the best of our knowledge, the modification of algorithms for mining emerging
patterns in class imbalance problems using the original training dataset (without res-
Chapter 2. Related work 18
ampling) has not been explored enough. There is only one algorithm for mining emer-
ging patterns (EPRC [Alhammady and Ramamohanarao, 2004a]), which creates new
emerging patterns for the minority class by using the most frequent feature values from
the majority class. However, these patterns are not suitable for describing the minority
class, since they have item values which may not appear in the feature values of the
objects of the minority class. In addition, from the related work, emerging patterns
extracted from balanced datasets allowed obtaining better classification results than
emerging patterns extracted using this approach of modification of algorithms. Also,
it is important to highlight that most of the reviewed papers about emerging pattern
mining are unclear and their authors did not provide a free implementation of their
proposals.
On the other hand, as far as we know, in the literature, there are not cost-sensitive
algorithms for mining emerging patterns in class imbalance problems. These two ap-
proaches (modification of algorithms and cost-sensitive) have reported good classifica-
tion results for classifiers not based on emerging patterns [Domingos, 1999; Su et al.,
2015a]. Therefore, developing emerging pattern miners for class imbalance problems
based on these two approaches could attain good classification results.
From the related work, we can note that although iCAEP has shown good classific-
ation results in class imbalance problems, it was not created for this type of problems.
Moreover, to the best of our knowledge, there are not emerging pattern-based classifiers
specifically designed to deal with class imbalance problems. Therefore, developing new
emerging pattern-based classifiers for class imbalance problems is an open problem.
Finally, it is important to highlight that the emerging pattern miners and the emer-
ging pattern-based classifiers for class imbalance problems reported in the literature are
scarce and they have not been studied enough. Therefore, more and better algorithms
for mining emerging patterns in class imbalance problems, as well as new emerging

Chapter 2. Related work 19
pattern-based classifiers, are still required.


Chapter 3Quality measures for patterns inclass imbalance problems
In this chapter, we present a study about the effect of class imbalance on quality
measures for patterns. We split the content of this chapter as follows: Section 3.1
provides a brief introduction to quality measures for patterns and some basic concepts
which are used throughout this chapter. Section 3.2 introduces our study about the
effect of class imbalance on quality measures for patterns. Finally, Section 3.3 presents
our concluding remarks about this study.
3.1 Quality measures for patterns
Commonly, algorithms for mining emerging patterns extract a large set of patterns from
a training dataset. Therefore, an important task is to distinguish among patterns with
low and high discriminative ability for supervised classification. To carry out this task,
several quality measures for patterns have been proposed on in the literature.
In supervised classification, a quality measure (QM) assigns a higher value to a pat-
tern when it better discriminates objects of a class from objects of other classes [Bailey,
2012a; Garcıa-Borroto et al., 2013; Loyola-Gonzalez et al., 2014, 2016a]. Consequently,
a quality measure allows generating a pattern ranking based on the discriminative power
of the patterns, which can be used for selecting the best patterns for a pattern-based
classifier [Huynh et al., 2007; Novak et al., 2009; Garcıa-Borroto et al., 2013; Loyola-
Gonzalez et al., 2014, 2016a]. Thus, in this PhD research, we will say that a quality
measure Q1 has better behavior than another quality measure Q2 if, at the classification
21
Chapter 3. Quality measures for patterns 22
stage, the patterns selected from the ranking induced by Q1 provide better classification
result than those coming from the ranking induced by Q2.
Based on previous studies [Geng and Hamilton, 2006, 2007; McGarry, 2005], quality
measures for patterns can be categorized into two groups:
• Objective, which are based on probabilities or statistics. The aim is to evaluate
the ability of a pattern for discriminating objects in a class from objects in other
classes [McGarry and Malone, 2004; McGarry, 2005].
• Subjective, which are based on a subjective criterion issued by an expert in the
application domain [Padmanabhan and Tuzhilin, 2002; Liu et al., 2003].
Objective measures are the most used for experimental studies because they do
not take into account neither the context of the application domain nor the goals and
background knowledge of experts [Geng and Hamilton, 2006]. Then, since subjective
measures are based on a specific criterion issued by an expert in the application domain,
which is not available in any repository, we do not include these measures in our study.
An objective quality measure can be defined as a function q(I,Dp, Dn)→ R, which
assigns a higher value to a pattern I when it better discriminates objects in a class
Dp from objects in the remaining problem classes Dn (The classes form a partition of
the universe D = Dp ∪Dn, Dp ∩Dn = ∅) [Garcıa-Borroto et al., 2013; Loyola-Gonzalez
et al., 2014, 2016a].
In the literature, quality measures are usually defined using different notations.
Therefore, in this chapter, we will use the notation proposed by Bailey [2012a] for
representing all quality measures. Then, the number of objects covered by a pattern I
is denoted as count(I,D). While the support of a pattern I, denoted as Sup(I,D), is
computed as the ratio between count(I,D) and the number of objects in the dataset
D.
Chapter 3. Quality measures for patterns 23
A contingency table (CT) is a useful structure to show the distribution of the objects
covered by a pattern [Bailey, 2012a]. Then, given I, Dp, and Dn, one may construct a
CT for representing the distribution of objects covered by the pattern I in Dp and Dn
as shown in Table 3.1.
Table 3.1: Contingency table
Dp Dn Sums
I n11 n12 a1
¬I n21 n22 a2
Sums |Dp| = b1 |Dn| = b2∑
ij nij = N
Note that n11 = count(I,Dp), n12 = count(I,Dn), n21 = b1 - n11 and n22 = b2
- n12. Consequently, Sup(I,Dp) = count(I,Dp)/b1, Sup(I,Dn) = count(I,Dn)/b2,
Sup(I,Dp ∪Dn) = Sup(I,D) = count(I,D)/N , and N represents the total number of
objects.
There are many studies on quality measures for patterns reported in the literature
[Piatetsky-Shapiro, 1991; Bay and Pazzani, 1999; An and Cercone, 2001; Tan et al.,
2002; Lavrac et al., 2004; Lenca et al., 2004; McGarry, 2005; Geng and Hamilton, 2006,
2007; Huynh et al., 2007; Lenca et al., 2007; Novak et al., 2009; Bailey, 2012b; Garcıa-
Borroto et al., 2013; Loyola-Gonzalez et al., 2014]. Nevertheless, all these studies do not
take into account the impact of the class imbalance problem over the quality measure
results, when the measures are used to select patterns for supervised classification.
Therefore, in the next section, we present a study of quality measures for emerging
patterns taking into account the effect of the class imbalance over the quality measure
results.
Chapter 3. Quality measures for patterns 24
3.2 A study of quality measures for patterns in class
imbalance problems
The aim of this study is to investigate the effect of class imbalance on quality measures
for patterns. For our study, first, we propose extracting emerging patterns from several
imbalanced databases. Then, we will create a ranking of emerging patterns based on
a quality measure. Finally, the best patterns from this ranking will be selected, and
they will be used in an emerging pattern-based classifier. By doing this, we can detect
which quality measures attain good or bad classification results. As the classification
algorithm is the same and the only change is the quality measure used for producing the
ranking, then a good or bad performance in the classification results can be attributed
to the quality measure.
In our study, we propose to evaluate two methods for selecting emerging patterns
extracted from imbalanced databases. The main reason to select these methods is that
they showed good classification results on databases with balanced classes [Loyola-
Gonzalez et al., 2014]. Consequently, they do not take into account the class imbalance
problem. Therefore, we will modify them to address the class imbalance problem in the
selection of emerging patterns.
The first method selects the k best emerging patterns by class from the ranking
produced by applying a given quality measure. The second one selects a subset of the
best patterns that covers all the objects of the training sample. In this second method,
for each object of the training sample, the best emerging pattern covering the object
is selected (only if this emerging pattern is associated with the same class that the
object has, and this pattern has not been previously selected). The pseudocodes for
both emerging pattern selection methods are shown in Algorithm 1 and Algorithm 2
respectively.

Chapter 3. Quality measures for patterns 25
Algorithm 1: Method for selecting the k best emerging patternsinput : EP- Set of emerging patterns, q- Quality measure, s- Selection by class, k- Number of emerging patternsoutput: R- Selected emerging patterns
R ← ∅if s == true then
foreach c ∈ Classes doEPS ← Emerging patterns of c sorted using qR ← Selecting the k best emerging patterns from EPS
end
endelse
EPS ← EP sorted using qR ← Selecting the k best emerging patterns from EPS
endreturn R
Algorithm 2: Method for selecting patterns considering their coveringinput : EP- Set of emerging patterns, q- Quality measure, T - Training sampleoutput: R- Selected emerging patterns
EPS ← EP sorted using qR ← ∅foreach o ∈ T do
Search S = the first pattern in EPS that covers o and it is associated to the same class as oif S /∈ R then
R ← R ∪ {S}end
endreturn R
3.2.1 Experimental setup
In order to test the first alternative for selecting emerging patterns, in our study, we
selected different amounts of emerging patterns for supervised classification. First, we
selected 10% of the patterns as suggested by Garcıa-Borroto et al. [2013]. However,
selecting only 10% of the emerging patterns could lead to low accuracy at the clas-
sification stage, specially in class imbalance problems. The main reasons are: (i) all
emerging patterns with high-quality could be from a single class (commonly from the
majority class), and (ii) 10% of emerging patterns could be very few patterns. Thus,
with the goal of testing the selection of different amounts of patterns, we also selected
10%, 50%, and 80% of emerging patterns by class.
For our study, we used 32 quality measures, which are detailed in Table 3.2. This
Chapter 3. Quality measures for patterns 26
table shows, for each quality measure, the abbreviation used in the rest of this chapter,
its name and reference, as well as its expression using probabilistic notation.
For mining emerging patterns, we selected LCMine (Logical Complex Miner) [Garcıa-
Borroto et al., 2010b], because it has shown mining emerging patterns which allow ob-
taining higher accuracies than the patterns extracted by other emerging pattern miners
(like SJEP [Fan and Ramamohanarao, 2006]) [Garcıa-Borroto et al., 2010b].
As emerging pattern-based classifier, we selected CAEP (Classification by Aggregat-
ing Emerging Patterns) [Dong et al., 1999], since, it uses a simple classification strategy
whereby the accuracy results will depend more on the quality of the emerging patterns
used for classification than on the classification strategy. Also, CAEP has been used
in several real-world problems such as music melody classification [Tang, 2001], failure
detection [Lo et al., 2009], DNA sequence classification [Chen and Chen, 2011], and
classification of polyadenylation sites [Tzanis et al., 2008, 2011]; where it has obtained
good accuracy results [Dong, 2012a].
It is important to highlight that the emerging pattern-based classifier (CAEP) used
in this study is not available in any free Data-Mining Tool. Therefore, we implemented
it based on the paper where CAEP was introduced [Dong and Li, 1999]. Additionally,
we used an implementation of the emerging pattern miner (LCMine) which was provided
by their authors [Garcıa-Borroto et al., 2010b]. Both algorithms (CAEP and LCMine)
were executed using the parameter values recommended by their authors.
For our study, we also selected 95 imbalanced databases (see Table 3.3) from the
KEEL dataset repository [Alcala-Fdez et al., 2011]. These databases contain two-class
problems with a class imbalance ratio higher than 1.5, as suggested by Lopez et al.
[2014a]. The class imbalance ratio (IR) is computed as the ratio between the number
of objects belonging to the majority class and the number of objects belonging to the
minority class (IR = |majority class| / |minority class|) [Orriols-Puig and Bernado-

Chapter 3. Quality measures for patterns 27
Table 3.2: Summary of the quality measures used in our study
Abbrev. Name and Reference Equation
Acc Accuracy [Kodratoff, 2001] Sup(I,Dp) + Sup(¬I,Dn)
Brins Brins [Brin et al., 1997]Sup(I,D)×(b1/N)
Sup(I,Dn)
Conf Confidence [Agrawal et al., 1993]Sup(I,Dp)
Sup(I,D)
CConf Centered Confidence [Lenca et al., 2007] Conf(I,Dp)− b1N
Cole Coleman [Bruha and Kockova, 1993]CConf(I,Dp)
1−b1/N
ColStr Colective Strength [Tan et al., 2004]Sup(I,Dp)+Sup(¬I,Dn)
Sup(I,D)(b1/N)+Sup(¬I,D)(b2/N)×
1−Sup(I,D)(b1/N)−Sup(¬I,D)(b2/N)1−Sup(I,Dp)−Sup(¬I,Dn)
Cos Consine [Tan et al., 2004]√
Conf(I,Dp)× Sup(I,Dp)
DConf Descriptive confirm [Kodratoff, 2001] Sup(I,D)− 2Sup(I,Dn)
Dep Dependency [Kodratoff, 2001] |Sup(¬I,D)− Conf(I,Dn|
ExCex Example and Counterexample Rate [Gras, 1996] 1− Sup(I,Dn)Sup(I,Dp)
Gain Gain [Yin and Han, 2003] Sup(I,Dp)× (logSup(I,Dp)
Sup(I,D)− log b1
N)
GR Growth rate [Dong and Li, 1999] Sup(I,Dp)/Sup(I,Dn)
InfGain Information Gain [Church and Hanks, 1990] − log (b1/N) + log (Conf(I,Dp))
Jacc Jaccard Index [Tan et al., 2004]Sup(I,Dp)
Sup(I,D)+(b1/N)−Sup(I,Dp)
Klos Klosgen [Klosgen, 1996]√
Sup(I,Dp)× (Conf(I,Dp)− Sup(I,D)))
Lap Lapplace [Good, 1965]Sup(I,Dp)+1/N
Sup(I,D)+2/N
Lever Leverage [Webb and Zhang, 2005] Conf(I,Dp)− Sup(I,D)× b1N
Lift Lift [Piatetsky-Shapiro and Steingold, 2000]Sup(I,Dp)
Sup(I,D)×(b1/N)
MDisc Measure Discrimination [An and Cercone, 1998] log (Sup(I,Dp)Sup(¬I,Dn)
Sup(I,Dn)Sup(¬I,Dp))
MultInf Mutual Information [Bailey, 2012b]∑i=2
i=1
∑j=2j=1
nij
N× log
nij/N
aibj/N
NetConf NetConf [Ahn and Kim, 2004]Conf(I,Dp)−(b1/N)
1−Sup(I,D)
OddsR Odds Ratio [Tan et al., 2004]Sup(I,Dp)/(1−Sup(I,Dp))
Sup(I,Dn)/(1−Sup(I,Dn))
Pearson Pearson Correlation Coefficient [Pearson, 1896]Sup(I,Dp)−Sup(I,D)×(b1/N)√
Sup(I,D)(b1/N)+Sup(¬I,D)(b2/N)
RelRisk Relative Risk [Ali et al., 1997] Conf(I,Dp)/Conf(¬I,Dp)
Sebag Sebag-Shoenauer [Sebag and Schoenauer, 1988]Sup(I,Dp)
Sup(I,Dn)
Spec Specificity [Lavrac et al., 1999] Conf(¬I,Dn)
Streng Strength [Ramamohanarao and Fan, 2007]GR(Dp)
GR(Dp)+1× Sup(I,Dp)
SupSupport [Agrawal et al., 1993] or Coverage [An andCercone, 2001]
Sup(I,Dp)
SupDif Support Difference [Bay and Pazzani, 1999] Sup(I,Dp)− Sup(I,Dn)
WRACC Weighted Relative Accuracy [Lavrac et al., 2004] Sup(I,D)(Conf(I,Dp)− (b1/N))
X2 X2 [Bay and Pazzani, 1999]∑i=2
i=1
∑j=2j=1
(nij−Eij)2
Eij, Eij =
(∑k=2
k=1 nik)×(∑k=2
k=1 njk)
N
Zhang Zhang [Zhang, 2000]Sup(I,Dp)−Sup(I,D)×(b1/N)
max{Sup(I,Dp)×(b2/N),Sup(I,Dn)×(b1/N)}
Chapter 3. Quality measures for patterns 28
Mansilla, 2009]. In this way, the larger the IR value, the larger the imbalance of the
database. The IR is the most used index to measure the imbalance level in a database
[Batista et al., 2004; Lopez et al., 2014b; Dıez-Pastor et al., 2015].
All databases were partitioned using 5-fold Distribution Optimally Balanced Strat-
ified Cross-Validation (DOB-SCV) procedure, as suggested by Moreno-Torres et al.
[2012], for class imbalance problems. DOB-SCV selects a random object from the
training dataset, and then finds its k − 1 nearest neighbors of the same class (com-
monly k = 5). After that, it includes each of k objects to a different fold. This process
is repeated until all objects from the training dataset belong to a fold. All dataset par-
titions used in this experimentation are available for downloading at the KEEL dataset
repository1 [Alcala-Fdez et al., 2011].
In Table 3.3, different characteristics for each database used in our experiments
such as the name used in the KEEL dataset repository (Name), the number of objects
(#Objects), the number of features (#Feat.), and the IR are shown. This table is sorted
in ascending order according to the IR.
For assessing the classification performance, we used the AUC (Area Under the
ROC Curve) measure [Huang and Ling, 2005] because it is the most used for class
imbalance problems [Bradley, 1997; Lopez et al., 2013, 2014a,b; Saez et al., 2015].
AUC is computed as:
AUC =1 + TPrate − FPrate
2(3.1)
where TPrate is the ratio of objects belonging to the minority class that are well-classified
and FPrate is the ratio of misclassified objects belonging to the majority class.
In order to know if the classification results produced by different classifiers are
statistically different in our study, we applied the Friedman’s test (a nonparametric test)
1http://sci2s.ugr.es/keel/imbalanced.php

Chapter 3. Quality measures for patterns 29
Table 3.3: Summary of the imbalanced databases used in our studyName #Objects #Feat. IR Name #Objects #Feat. IR
glass1 214 9 1.82 ecoli0146vs5 280 6 13.00ecoli0vs1 220 7 1.86 shuttlec0vsc4 1829 9 13.87wisconsin 683 9 1.86 yeast1vs7 459 7 14.30pima 768 8 1.87 glass4 214 9 15.46iris0 150 4 2.00 ecoli4 336 7 15.80glass0 214 9 2.06 pageblocks13vs4 472 10 15.86yeast1 1484 8 2.46 abalone9vs18 731 8 16.40haberman 306 3 2.78 dermatology6 358 34 16.90vehicle2 846 18 2.88 zoo3 101 16 19.20vehicle1 846 18 2.90 glass016vs5 184 9 19.44vehicle3 846 18 2.99 shuttlec2vsc4 129 9 20.50glass0123vs456 214 9 3.20 shuttle6vs23 230 9 22.00vehicle0 846 18 3.25 yeast1458vs7 693 8 22.10ecoli1 336 7 3.36 glass5 214 9 22.78newthyroid1 215 5 5.14 yeast2vs8 482 8 23.10newthyroid2 215 5 5.14 lymphography normalfibrosis 148 18 23.67ecoli2 336 7 5.46 flareF 1066 11 23.79segment0 2308 19 6.02 cargood 1728 6 24.04glass6 214 9 6.38 carvgood 1728 6 25.58yeast3 1484 8 8.10 krvskzeroonevsdraw 2901 6 26.63ecoli3 336 7 8.60 krvskonevsfifteen 2244 6 27.77pageblocks0 5472 10 8.79 yeast4 1484 8 28.10ecoli034vs5 200 7 9.00 winequalityred4 1599 11 29.17yeast2vs4 514 8 9.08 poker9vs7 244 10 29.50ecoli067vs35 222 7 9.09 yeast1289vs7 947 8 30.57ecoli0234vs5 202 7 9.10 abalone3vs11 502 8 32.47glass015vs2 172 9 9.12 winequalitywhite9vs4 168 11 32.60yeast0359vs78 506 8 9.12 yeast5 1484 8 32.73yeast0256vs3789 1004 8 9.14 krvskthreevseleven 2935 6 35.23yeast02579vs368 1004 8 9.14 winequalityred8vs6 656 11 35.44ecoli046vs5 203 6 9.15 ecoli0137vs26 281 7 39.14ecoli01vs235 244 7 9.17 abalone17vs78910 2338 8 39.31ecoli0267vs35 224 7 9.18 abalone21vs8 581 8 40.50glass04vs5 92 9 9.22 yeast6 1484 8 41.40ecoli0346vs5 205 7 9.25 winequalitywhite3vs7 900 11 44.00ecoli0347vs56 257 7 9.28 winequalityred8vs67 855 11 46.50yeast05679vs4 528 8 9.35 abalone19vs10111213 1622 8 49.69vowel0 988 13 9.98 krvskzerovseight 1460 6 53.07ecoli067vs5 220 6 10.00 winequalitywhite39vs5 1482 11 58.28glass016vs2 192 9 10.29 poker89vs6 1485 10 58.40ecoli0147vs2356 336 7 10.59 shuttle2vs5 3316 9 66.67led7digit02456789vs1 443 7 10.97 winequalityred3vs5 691 11 68.10ecoli01vs5 240 6 11.00 abalone20vs8910 1916 8 72.69glass06vs5 108 9 11.00 krvskzerovsfifteen 2193 6 80.22glass0146vs2 205 9 11.06 poker89vs5 2075 10 82.00glass2 214 9 11.59 poker8vs6 1477 10 85.88ecoli0147vs56 332 6 12.28 abalone19 4174 8 129.44cleveland0vs4 177 13 12.62
and after, we performed the Bergmann-Hommel’s procedure (a post-hoc procedure), as
suggested in [Demsar, 2006; Garcıa and Herrera, 2008; Garcıa et al., 2010; Derrac et al.,
2011]. A detailed explanation of these statistical tests is given in Appendix A.
A common way to show statistical results is through CD (critical difference)) dia-

Chapter 3. Quality measures for patterns 30
grams. These diagrams present the order of the classifiers based on the Friedman’s
ranking, the magnitude of the differences among them, and the significance of the ob-
served differences, all in a compact form. In a CD diagram, the rightmost classifier
is the best classifier, the position of a classifier within the segment represents its rank
value, and if two or more classifiers share a thick line, it means that they have statist-
ically similar behavior [Demsar, 2006]. CD diagrams are used to show the statistical
results of this study.
For studying the effect of class imbalance on quality measures regarding different
imbalance levels, we also divided the databases into equal-frequency groups depending
on the IR of the databases by using the Discretize2 method. This is an unsupervised
discretization method for numeric attributes, taken from the WEKA3 Data Mining
Software [Hall et al., 2009], which has been widely used to obtain equal-frequency
groups [Jacques et al., 2013; Feng et al., 2014; Guo et al., 2014; Hogo, 2014; Mulay and
Puri, 2016]. Using this division, we will identify those quality measures with the best
behavior for each specific class imbalance level. After applying the Discretize method,
six equal-frequency groups depending on the IR of the databases were output. Table 3.3
shows these groups, divided by thin lines, which have the following IR ranges: Bin1
(1.820, 5.300], Bin2 (5.300, 9.175], Bin3 (9.175, 12.810], Bin4 (12.810, 23.730], Bin5
(23.730, 39.905], and Bin6 (39.905, 129.440].
3.2.2 Experimental results
This section shows our experimental results that aim to identify the effect of class
imbalance on quality measures for patterns. First, we show the results considering all
the imbalanced databases used in our study and after, we show the results dividing the
2Path in WEKA 3.7: weka.filters.unsupervised.attribute.Discretize3http://www.cs.waikato.ac.nz/ml/weka/
Chapter 3. Quality measures for patterns 31
Figure 3.1: A CD diagram with a statistical comparison of the classification resultsover all tested databases.
databases into different class imbalance levels.
From our results shown in Figure 3.1, the top accurate measures are Jacc, Sup,
Streng, Cos, SupDif, WRACC, OddsR, Sebag, GR, ExCex, Conf, Cole, Brins, Zhang,
and MDisc, in this order. The statistical tests prove that these 15 quality measures
(see the right-hand side of Figure 3.1) are significantly different from the remaining
ones, but there is not any statistical difference among each other. According to our
classification results, the best quality measure for ranking emerging patterns in class
imbalance problems is Jacc.
Analyzing our results into each one of the six equal-frequency groups (bins) shown
in Table 3.3, we can see the following:
• For the less imbalanced databases (Bin1), the top accurate measures are Streng,
SupDif, WRACC, MultInf, Cos, Jacc, Sup, and X2, in this order. Statistical tests
prove that the differences among these eight measures and the remaining ones are
significant, but there is not any statistical difference among each other.
• For Bin2, the top accurate measures are Sup, Streng, Jacc, Cos, SupDif, and
Chapter 3. Quality measures for patterns 32
WRACC, in this order, having statistically significant differences regarding the
remaining ones but not among these six measures. For this bin, a subset of the top
accurate quality measures for Bin1 is obtained; only MultInf and X2 are among
the best quality measures for Bin1 but not for Bin2.
• For Bin3, the top accurate measures are Jacc, Sup, Cos, Streng, SupDif, WRACC,
Sebag, GR, ExCex, OddsR, Conf, Cole, Brins, and Zhang, in this order. These 14
quality measures have statistical similar results but they have statistical significant
differences with the remaining ones. Notice that Jacc, Sup, Cos, Streng, SupDif,
and WRACC are among the top accurate quality measures for Bin1, Bin2, and
Bin3.
• The top accurate measures for Bin4 are OddsR, Sebag, GR, ExCex, Conf, Cole,
Brins, and Zhang, in this order; having statistical differences against the remaining
ones, but not among these eight measures. Notice that the top accurate quality
measures for Bin4 are a subset of the top accurate quality measures for Bin3.
• For Bin5, the top accurate measures are Sup, Streng, Jacc, SupDif, and WRACC,
in this order. Statistical tests prove that the differences among these five measures
are not significant, but the differences against all other measures are significant.
In this bin, the top accurate quality measures are a subset of the top accurate
quality measures for Bin2; only Cos is excluded.
• For the last bin (Bin6), which contains the most imbalanced databases, the top
accurate measures are OddsR, Sebag, GR, ExCex, Conf, Cole, Brins and Zhang,
in this order; which were the same top accurate measures for Bin4. These eight
measures are not statistically different among each other, but they have statistical
significant differences with the remaining ones.

Chapter 3. Quality measures for patterns 33
Based on the results regarding different imbalance levels, we can observe that the
quality measures Jacc, SupDif, and WRACC are among the top accurate quality meas-
ures for most of the bins (Bin1, Bin2, Bin3, and Bin5).
Summarizing, Table 3.4 shows the bins (Name), the range of IR for each bin (Bin
interval), the amount of databases used to assess the quality measures into each bin
(#Databases), and the best quality measure, according to the Friedman’s ranking, for
each bin (Best quality measure).
Table 3.4: Results of the best quality measures for each Bin
Name Bin interval #Databases Best quality measure
Bin1 ( 1.820, 5.300] 16 StrengBin2 ( 5.300, 9.175] 16 SupBin3 ( 9.175, 12.810] 16 JaccBin4 (12.810, 23.730] 16 OddsRBin5 (23.730, 39.905] 16 SupBin6 (39.905, 129.440] 15 OddsR
It is important to highlight that the results obtained by each quality measure re-
garding different imbalance levels could be influenced by other intrinsic characteristics
of the tested databases. However, in this PhD research, we focused only on the class
imbalance level because the analysis of the influence of intrinsic characteristics of im-
balanced databases is another open research line [Lopez et al., 2013].
3.3 Concluding remarks
In this chapter, we presented a study of the effect of class imbalance on several quality
measures for patterns when used for ranking emerging patterns for classification.
From our study, considering all the imbalanced databases, we can conclude that Jacc
is the best quality measure for ranking emerging patterns for supervised classification in
class imbalance problems. On the other hand, regarding different class imbalance levels,

Chapter 3. Quality measures for patterns 34
we show which quality measures would have the best results, in each class imbalance
level, for ranking emerging patterns for supervised classification (see Table 3.4). These
results would help us to simplify future researches since we could consider one quality
measure among those with similar behavior depending on the class imbalance level of
a database.
Chapter 4Emerging pattern miners for classimbalance problems
In the literature, there are three main approaches (data level, algorithm level, and
cost-sensitive) to deal with the class imbalance problem [Lopez et al., 2013, 2014a].
As far as we know, only the data level approach has been little studied for emerging
pattern mining [Alhammady and Ramamohanarao, 2004a; Alhammady, 2007]. Hence,
following these approaches, this chapter introduces three novel solutions for mining
emerging patterns in class imbalance problems. First, Section 4.1 researches the use of
resampling methods for balancing the classes before mining emerging patterns. After,
Section 4.2 introduces a decision tree-based algorithm for mining emerging patterns
in class imbalance problems. Next, Section 4.3 introduces an emerging pattern mining
algorithm based on cost matrices. Finally, Section 4.4 presents some concluding remarks
about the emerging pattern mining algorithms introduced in this chapter.
4.1 Data level
This section introduces a new emerging pattern mining algorithm, at the data level, for
class imbalance problems.
Solutions, at the data level, for class imbalance problems apply a resampling method
in order to balance a database in a supervised classification context. By doing this, the
resampled database will contain a more balanced distribution of the objects into the
classes and consequently, classifiers can deal with class imbalance problems [Lopez et al.,
2013, 2014a,b; Loyola-Gonzalez et al., 2016b].
35

Chapter 4. Emerging pattern miners for class imbalance problems 36
Emerging pattern-based classifiers use a set of emerging patterns extracted from a
database by applying an emerging pattern miner. In class imbalance problems, con-
ventional algorithms for mining emerging patterns (i.e., those do not designed for class
imbalance problems) extract several emerging patterns with high support for the major-
ity class, and only a few (or none) emerging patterns with low support for the minority
class. Then, conventional emerging pattern-based classifiers are biased toward the ma-
jority class and, consequently, they obtain poor classification results for the minority
class [Lopez et al., 2013, 2014a,b; Loyola-Gonzalez et al., 2016b, 2017]. Therefore,
we first investigate if using resampling methods, on imbalanced databases, allow ex-
tracting better-emerging patterns for classification than directly using the imbalanced
dataset. Our hypothesis is that, in class imbalance problems, conventional emerging
pattern miners can extract more useful emerging patterns for the minority class from
a resampled database than from an imbalanced database.
To corroborate our hypothesis, we will apply a set of resampling methods over several
imbalanced databases. After, we will extract emerging patterns from the resampled and
non-resampled databases using a conventional emerging pattern miner, which does not
take into account the class imbalance. Then, we will compare the classification results
obtained by an emerging pattern-based classifier using emerging patterns extracted
from a non-resampled database against the classification results obtained by the same
classifier but using emerging patterns extracted from a resampled database. This will
allows us corroborating or refuting our hypothesis and, by the way, we will determine
the best resampling method to be applied before mining emerging patterns in class
imbalance problems. Finally, using the best resampling method, we will propose a
solution at the data level for mining emerging patterns in class imbalance problems,
which will consist in applying the best resampling method, found in this research, over
an imbalanced database and extracting a collection of emerging patterns by using a

Chapter 4. Emerging pattern miners for class imbalance problems 37
conventional emerging pattern miner.
Based on several papers [Yoon and Kwek, 2005; Yen and Lee, 2006; He et al.,
2008; Tang and Chen, 2008; Ramentol et al., 2011; He, 2013; Lopez et al., 2014b], the
resampling methods can be grouped in three approaches:
Oversampling. Methods in this approach create new objects in the minority
class to produce a new dataset with a balanced class distribution. There are many
oversampling methods reported in the literature, such as: Synthetic Minority Over-
sampling TEchnique (SMOTE) [Batista et al., 2004], Random oversampling (ROS)
[Batista et al., 2004], Aglomerative Hierarchical Clustering (AHC) [Cohen et al., 2006],
ADAptive SYNthetic Sampling (ADASYN) [He et al., 2008], Adjusting the Direction
Of the synthetic Minority clasS examples (ADOMS) [Tang and Chen, 2008], Selective
Preprocessing of Imbalanced Data (SPIDER) [Napierala et al., 2010], Selective Prepro-
cessing of Imbalanced Data 2 (SPIDER2) [Napierala et al., 2010], Borderline Synthetic
Minority Oversampling TEchnique (Borderline-SMOTE) [Lopez et al., 2014b], and Safe
Level Synthetic Minority Oversampling TEchnique (Safe Level SMOTE) [Lopez et al.,
2014b].
Undersampling. Methods in this approach, contrary to those in the oversampling
approach, remove objects from the majority class with the goal of creating a balanced
dataset. Currently, there are several undersampling methods reported in the literature,
such as: Tomek’s modification of Condensed Nearest Neighbor (TL) [Batista et al.,
2004], Neighborhood Cleaning Rule (NCL) [Batista et al., 2004], One Sided Selection
(OSS) [Batista et al., 2004], Condensed Nearest Neighbor (CNN) [Batista et al., 2004],
CNN + Tomek’s modification of Condensed Nearest Neighbor (CNNTL) [Batista et al.,
2004], Random undersampling (RUS) [Batista et al., 2004], Class Purity Maximization
(CPM) [Yoon and Kwek, 2005], and Undersampling Based on Clustering (SBC) [Yen
and Lee, 2006].
Chapter 4. Emerging pattern miners for class imbalance problems 38
Hybrid-sampling. The main idea of this approach consists in balancing the class
distribution by combining oversampling and undersampling approaches; creating ob-
jects in the minority class and removing objects from the majority. Although this
approach has been less studied than the others previously mentioned, some hybrid-
sampling methods have been proposed, such as: SMOTE + Edited Nearest Neighbor
(SMOTE-ENN) [Batista et al., 2004], SMOTE + Tomek’s modification of Condensed
Nearest Neighbor (SMOTE-TL) [Batista et al., 2004], and Hybrid Preprocessing using
SMOTE and Rough Sets Theory (SMOTE-RSB) [Ramentol et al., 2011].
The resampling methods mentioned above are the most used, at the data level, for
dealing with class imbalance problems [He, 2013; Lopez et al., 2014b; Loyola-Gonzalez
et al., 2016b]. Therefore, we will use them in this research to determine whether or not
they allow improving a conventional emerging pattern miner to extract useful emerging
patterns for class imbalance problems.
4.1.1 Experimental results
As part of our study, we performed two experiments: the first one aims to find out the
best resampling method for preprocessing a training dataset with the goal of extracting
useful emerging patterns for class imbalance problems (Section 4.1.1.1). The second
experiment aims to corroborate previous findings by comparing the results obtained in
the first experiment against the results achieved by the best emerging pattern miner
for class imbalance problems reported in the state-of-the-art (Section 4.1.1.2).
For both experiments, we use the same 95 databases described in Table 3.3 and Dis-
tribution Optimally Balanced Stratified Cross Validation (DOB-SCV) [Moreno-Torres
et al., 2012] as validation procedure. CAEP as emerging pattern-based classifier [Dong
et al., 1999] because it uses a simple classification strategy and it has shown bet-
ter classification results than other emerging pattern-based classifiers [Dong, 2012a].
Chapter 4. Emerging pattern miners for class imbalance problems 39
For assessing the classification results, we use the Area Under the Receiver Operating
Characteristic curve (AUC) measure [Huang and Ling, 2005] because this measure is
the most used for class imbalance problems [Bradley, 1997; Lopez et al., 2013, 2014a,b;
Saez et al., 2015].
4.1.1.1 Selecting the best resampling method
In order to carry out the first experiment, we apply several resampling methods over
many imbalanced databases before mining emerging patterns. After that, we apply an
emerging pattern miner, which does not take into account the class imbalance problem,
for extracting the emerging patterns from the resampled databases. Finally, in order to
find out what resampling method gets the best results, we will assess the classification
result obtained by an emerging pattern-based classifier using the extracted patterns
from the resampled database. As the pattern miner and the classification algorithm
are the same, and the only change is the resampling method applied to the training
database, then a good or bad performance in the classification results can be attrib-
uted to the resampling method. Additionally, we evaluate these results regarding the
imbalance ratio (IR) measure [Orriols-Puig and Bernado-Mansilla, 2009] in order to
find out if some resampling methods have specially good performance when dealing
with different levels of class imbalance. This measure computes the ratio between the
number of objects belonging to the majority class and the number of objects belonging
to the minority class. Then, the larger the IR value is, the more class imbalance the
database has.
For the first experiment, we use LCMine [Garcıa-Borroto et al., 2010b] as emer-
ging pattern miner because, as we have already mentioned, LCMine finds out better-
emerging patterns for classification than other emerging pattern miners. For validating
our results, we applied the Friedman’s test and the Bergmann-Hommel’s procedure, as

Chapter 4. Emerging pattern miners for class imbalance problems 40
suggested by Derrac et al. [2011]. Our results are shown using CD (critical distance)
diagrams [Demsar, 2006]. We evaluate the 20 resampling methods listed in Section 4.1,
which were executed using the KEEL data mining tool [Alcala-Fdez et al., 2009].
It is important to highlight that all algorithms used in this experiment (LCMine,
CAEP, the statistical tests, and the resampling methods) were executed using the
parameter values recommended by their authors.
Figure 4.1: CD diagram with a statistical comparison of the results for the Baselineclassifier (LCMine+CAEP) with and without applying resampling methods over all thetested databases.
Figure 4.1 shows a CD diagram with a statistical comparison of the AUC results
obtained by the emerging pattern-based classifier CAEP, using the patterns mined by
LCMine, after applying the resampling methods, mentioned in Section 4.1, over the
imbalanced databases. Also, we include the AUC results of CAEP using the patterns
extracted by LCMine over the original databases without applying any resampling
method, labeled as Baseline. This figure shows that SMOTE-TL (a hybrid method)
has the best position into the Friedman’s ranking. Statistical tests prove that there are
statistical differences among SMOTE-TL and the remaining tested resampling methods,
excepting SMOTE, TL, NCL, and SMOTE-ENN. Notice that the second and third
resampling methods into the Friedman ranking are SMOTE (oversampling) and TL
(undersampling), respectively, which are just the components of SMOTE-TL.
On the other hand, notice that the results of ADOMS, RUS, SPIDER, AHC, ADA-

Chapter 4. Emerging pattern miners for class imbalance problems 41
SYN, ROS, Safe Level SMOTE, SPIDER2, OSS, Borderline-SMOTE, and CNNTL do
not have statistical differences with the Baseline (without applying resampling meth-
ods). Consequently, these resampling methods are not able to significantly improve this
Baseline in class imbalance problems. From all this, we can conclude that SMOTE-TL
is the best resampling method to apply, before mining the emerging patterns, for im-
proving the accuracy of emerging pattern based-classifiers in class imbalance problems.
In order to analyze the above-stated experiment but using different imbalance levels,
we propose to arrange the databases into six equal-frequency groups depending on the
IR, as in Section 3.2.
Table 4.1: The best resampling method for each bin created by discretizing the IR onthe tested databases
Name Bin intervalNumber ofdatabases
Resampling method (Approach)
Bin1 ( 1.820, 5.300] 16 TL (Undersampling)Bin2 ( 5.300, 9.175] 16 SMOTE-TL (Hybrid Sampling)Bin3 ( 9.175, 12.810] 16 SMOTE-TL (Hybrid Sampling)Bin4 (12.810, 23.730] 16 AHC (Oversampling)Bin5 (23.730, 39.905] 16 TL (Undersampling)Bin6 (39.905, 129.440] 15 SMOTE-TL (Hybrid Sampling)
Table 4.1 shows the bins (Name), the range of IR for each bin (Bin interval), the
amount of databases contained into each bin (#Databases), and the best resampling
method to apply, before mining the emerging patterns, in each bin (Resampling method
(Approach)).
From Table 4.1 we can conclude that the best resampling methods to apply, before
mining the emerging patterns, for improving the classification results are: TL (under-
sampling) for those databases with IR ≤ 5.3 (Bin1) and those with an IR ranging in
(23.73, 39.905] (Bin5). SMOTE-TL (Hybrid sampling) for the databases with an IR
ranging in (5.3, 12.81] (Bin2 and Bin3) and an IR > 39.905 (Bin6). AHC (oversampling)
Chapter 4. Emerging pattern miners for class imbalance problems 42
for those databases with an IR ranging in (12.81, 23.73] (Bin4). These results provide
a guide, in terms of the IR, for choosing the best resampling method to apply over an
imbalanced database in order to obtain a set of emerging patterns, which improve the
classification results of an emerging pattern-based classifier.
4.1.1.2 Comparing the best resampling method
For the second experiment, we apply an emerging pattern miner, which takes into ac-
count the class imbalance problem, for mining the emerging patterns from each original
imbalanced database. After that, we assess the classification results obtained by an
emerging pattern-based classifier by using the extracted emerging patterns. Finally,
these classification results are compared against the classification results obtained by
the same emerging pattern-based classifier but using the emerging patterns extracted
from balanced databases by applying the best resampling method according to the first
experiment (SMOTE-TL).
For this experiment, we use DEP [Alhammady, 2007] because, as we mentioned
in Section 2.1, DEP is the best emerging pattern miner for class imbalance problems
reported in the literature. Also, we use the Wilcoxon signed-rank test as a statistical
test for pairwise comparisons, as suggested in [Demsar, 2006; Derrac et al., 2011].
Table 4.2 shows a comparison of the classification results obtained by the CAEP
classifier by using the emerging patterns extracted by LCMine, from the training data-
bases resampled by applying SMOTE-TL (SMOTE-TL+LCMine), against the classific-
ation results obtained by the CAEP classifier by using the emerging patterns extracted
by DEP. The comparison was made by applying the Wilcoxon signed-rank test over
the AUC results, considering all the tested databases, as suggested by Demsar [2006];
Derrac et al. [2011]. This table shows the compared methods (Comparison), the sum
of ranks for the problems where SMOTE-TL+LCMine outperformed DEP (R+), the
Chapter 4. Emerging pattern miners for class imbalance problems 43
sum of ranks for the opposite (R−), the result of the null hypothesis (Hypothesis), and
the p-value computed by the Wilcoxon signed-rank test.
Table 4.2: Wilcoxon signed-rank test comparing SMOTE-TL+LCMine against DEP,using all the tested databases.
Comparison R+ R− Hypothesis (α = 0.05) p-value
SMOTE-TL+LCMine vs DEP 3323.0 1142.0 Rejected 0.000039
From Table 4.2, we can see that SMOTE-TL+LCMine significantly outperforms
DEP. Thus, from Figure 4.1 and Table 4.2, we can conclude that SMOTE-TL+LCMine
is the best solution, at the data level, for mining emerging patterns in class imbalance
problems.
4.2 Algorithm level
This section introduces a new emerging pattern mining algorithm for class imbalance
problems. This algorithm uses a skew-insensitive quality measure for measuring split-
ting criteria in order to build a set of decision trees, from which a set of useful emerging
patterns for classification in class imbalance problems are extracted.
Mining emerging patterns from several decision trees deserves special attention be-
cause this approach has shown better performance than other traditional emerging
pattern mining algorithms [Garcıa-Borroto et al., 2014, 2015]. The main reasons are
that emerging pattern miners based on decision trees do not include a global discretiz-
ation step, they obtain a small collection of patterns, and they have low computational
cost [Novak et al., 2009; Garcıa-Borroto et al., 2014, 2015]. In this approach, emerging
patterns are extracted from several decision trees by collecting conjunctions of prop-
erties in all the paths from the root node to the leaves [Garcıa-Borroto et al., 2010b,
2014, 2015].
Chapter 4. Emerging pattern miners for class imbalance problems 44
Several emerging pattern miners based on decision trees have been proposed in the
literature but Random Forest Miner (RFm) [Garcıa-Borroto et al., 2015] has shown
significantly better performance than other emerging pattern miners based on decision
trees, such as DBP (Delete Best Property), DBPL (Delete Best Property by Level), DBF
(Delete Best Feature), LCMine, Random Split and Random Subset [Garcıa-Borroto
et al., 2015]. RFm creates diversity by randomly choosing a set of features for determ-
ining, from them, the feature that produces the best split according to the Inform-
ation Gain measure [Quinlan, 1993]. However, Information Gain is a skew-sensitive
measure having a bias toward the majority class [Cieslak and Chawla, 2008; Kang
and Ramamohanarao, 2014]. Hence, as RFm uses the Information Gain measure, like
LCMine [Garcıa-Borroto et al., 2010b], then it extracts more emerging patterns for the
majority class than for the minority class in class imbalance problems.
On the other hand, the Hellinger distance [Cieslak and Chawla, 2008] is a skew-
insensitive measure, which has been widely used for building decision trees in class
imbalance problems [Cieslak et al., 2012; Kang and Ramamohanarao, 2014]. Decision
trees based on Bagging and Random Forest approaches have reported good classification
results when the Hellinger distance is used as a quality criterion for evaluating splitting
criteria [Cieslak et al., 2012; Su et al., 2015b]. Nevertheless, to the best of our knowledge,
this distance has not been used for mining emerging patterns.
Into the algorithm level approach for dealing with class imbalance problems, we
propose to extract emerging patterns by following the same idea of the RFm but using
the Hellinger distance as a quality criterion for building a diverse collection of decision
trees. Our goal is to extract more emerging patterns with high support for the minority
class since, at classification stage, these emerging patterns are overwhelmed by the
emerging patterns of the majority class, which usually are more and with higher support
[Alhammady and Ramamohanarao, 2004b; Alhammady, 2007; Loyola-Gonzalez et al.,

Chapter 4. Emerging pattern miners for class imbalance problems 45
2017]. We follow the idea behind RFm instead of the Bagging miner because this
last miner could generate many highly specific patterns for each subsample, leaving
uncovered some objects of the original dataset [Loyola-Gonzalez et al., 2017]. We also
propose to use the RFm with unpruned decision trees because according to Batista
et al. [2004], pruned decision trees rarely improve the AUC results in class imbalance
problems. Moreover, pruning is focused on the generalization of decision trees rather
than on mining emerging patterns [Rokach and Maimon, 2014]. At the decision tree
induction procedure, we use binary splits as suggested by [Cieslak and Chawla, 2008;
Cieslak et al., 2012; Grabczewski, 2014].
Our proposal (HRFm) for mining emerging patterns, into the algorithm level ap-
proach, consists of three steps: (i) inducing several diverse decision trees by using the
Hellinger distance as a quality measure for evaluating splits; (ii) extracting emerging
patterns, from each induced decision tree; and (iii) merging the patterns extracted
from all induced decision trees and apply a filtering method for removing duplicate
and specific patterns, and removing redundant items. These three steps are explained
below.
For inducing a decision tree, our proposal starts building a root node with all objects
of the training dataset D. Then, it splits the root node into two disjoint subsets (left
child Dl and right child Dr) and repeats this process recursively over the children nodes
until certain stopping criterion is met. In order to split each node, we randomly select
a subset of features F and, by using the selected features, generating as many binary
splitting criteria as possible as follows (depending on the type of the feature):
• For each non-numerical feature fi and each value vj of fi, appearing in the training
objects, generating a binary candidate split using the properties fi = vj and
fi = vj.
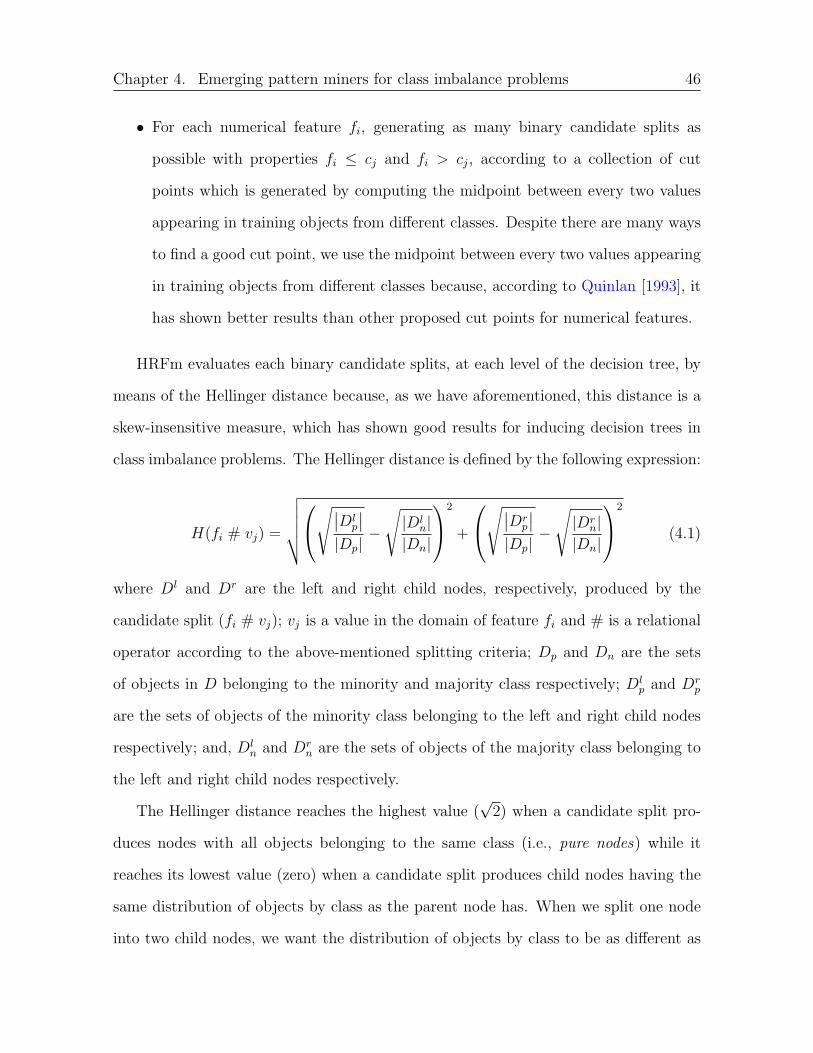
Chapter 4. Emerging pattern miners for class imbalance problems 46
• For each numerical feature fi, generating as many binary candidate splits as
possible with properties fi ≤ cj and fi > cj, according to a collection of cut
points which is generated by computing the midpoint between every two values
appearing in training objects from different classes. Despite there are many ways
to find a good cut point, we use the midpoint between every two values appearing
in training objects from different classes because, according to Quinlan [1993], it
has shown better results than other proposed cut points for numerical features.
HRFm evaluates each binary candidate splits, at each level of the decision tree, by
means of the Hellinger distance because, as we have aforementioned, this distance is a
skew-insensitive measure, which has shown good results for inducing decision trees in
class imbalance problems. The Hellinger distance is defined by the following expression:
H(fi # vj) =
√√√√√√∣∣Dl
p
∣∣|Dp|
−
√|Dl
n||Dn|
2
+
√∣∣Drp
∣∣|Dp|
−
√|Dr
n||Dn|
2
(4.1)
where Dl and Dr are the left and right child nodes, respectively, produced by the
candidate split (fi # vj); vj is a value in the domain of feature fi and # is a relational
operator according to the above-mentioned splitting criteria; Dp and Dn are the sets
of objects in D belonging to the minority and majority class respectively; Dlp and Dr
p
are the sets of objects of the minority class belonging to the left and right child nodes
respectively; and, Dln and Dr
n are the sets of objects of the majority class belonging to
the left and right child nodes respectively.
The Hellinger distance reaches the highest value (√2) when a candidate split pro-
duces nodes with all objects belonging to the same class (i.e., pure nodes) while it
reaches its lowest value (zero) when a candidate split produces child nodes having the
same distribution of objects by class as the parent node has. When we split one node
into two child nodes, we want the distribution of objects by class to be as different as
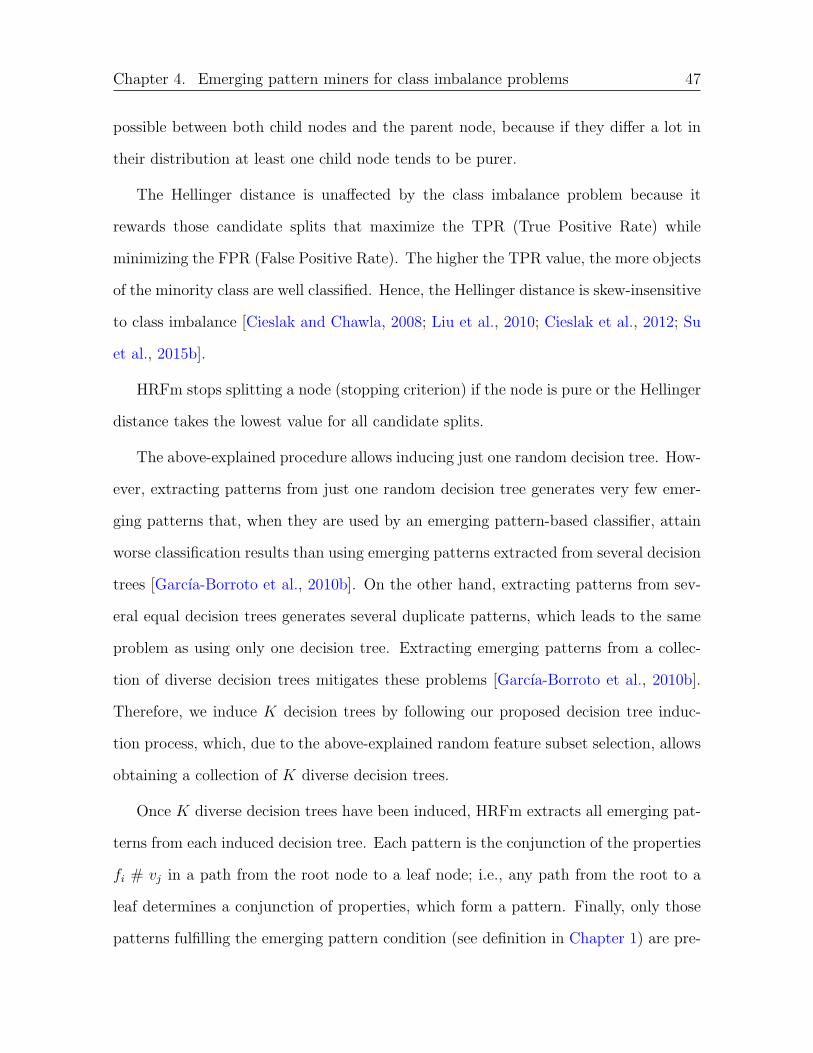
Chapter 4. Emerging pattern miners for class imbalance problems 47
possible between both child nodes and the parent node, because if they differ a lot in
their distribution at least one child node tends to be purer.
The Hellinger distance is unaffected by the class imbalance problem because it
rewards those candidate splits that maximize the TPR (True Positive Rate) while
minimizing the FPR (False Positive Rate). The higher the TPR value, the more objects
of the minority class are well classified. Hence, the Hellinger distance is skew-insensitive
to class imbalance [Cieslak and Chawla, 2008; Liu et al., 2010; Cieslak et al., 2012; Su
et al., 2015b].
HRFm stops splitting a node (stopping criterion) if the node is pure or the Hellinger
distance takes the lowest value for all candidate splits.
The above-explained procedure allows inducing just one random decision tree. How-
ever, extracting patterns from just one random decision tree generates very few emer-
ging patterns that, when they are used by an emerging pattern-based classifier, attain
worse classification results than using emerging patterns extracted from several decision
trees [Garcıa-Borroto et al., 2010b]. On the other hand, extracting patterns from sev-
eral equal decision trees generates several duplicate patterns, which leads to the same
problem as using only one decision tree. Extracting emerging patterns from a collec-
tion of diverse decision trees mitigates these problems [Garcıa-Borroto et al., 2010b].
Therefore, we induce K decision trees by following our proposed decision tree induc-
tion process, which, due to the above-explained random feature subset selection, allows
obtaining a collection of K diverse decision trees.
Once K diverse decision trees have been induced, HRFm extracts all emerging pat-
terns from each induced decision tree. Each pattern is the conjunction of the properties
fi # vj in a path from the root node to a leaf node; i.e., any path from the root to a
leaf determines a conjunction of properties, which form a pattern. Finally, only those
patterns fulfilling the emerging pattern condition (see definition in Chapter 1) are pre-

Chapter 4. Emerging pattern miners for class imbalance problems 48
served. For example, from the decision tree shown in Figure 4.2, HRFm extracts the
following five emerging patterns:
P1 = [Age ≤ 25] ∧ [V elocity = V ery slow]
P2 = [Age ≤ 25] ∧ [V elocity = V ery slow] ∧ [High reaction capacity = False]
P3 = [Age > 25] ∧ [Height ≤ 1.75]
P4 = [Age ≤ 25] ∧ [V elocity = V ery slow] ∧ [High reaction capacity = True]
P5 = [Age > 25] ∧ [Height > 1.75]
from which P1, P2, and P3 correspond to the Bad Player class and the remaining
patterns (P4 and P5) correspond to the Good Player class.
≤
≠ ≤
Figure 4.2: Example of a decision tree with four features and two classes: Good Playerand Bad Player.
As in [Fan and Kotagiri, 2002; Fan and Ramamohanarao, 2003; Wang et al., 2004;
Garcıa-Borroto et al., 2014], the last step in HRFm eliminates duplicate and specific
emerging patterns, and redundant items are also removed from emerging patterns.
a) Removing duplicated emerging patterns. Since emerging patterns are extracted from
several decision trees by using the same training dataset, many emerging patterns

Chapter 4. Emerging pattern miners for class imbalance problems 49
containing the same items and covering the same objects (duplicate patterns) can
be extracted. In order to reduce the size of the outcome, only one emerging pattern
is selected from those containing the same items and covering the same objects.
b) Removing specific emerging patterns. Let P1 and P2 two emerging patterns from the
same class, P1 is more specific than P2 if P1 contains all the items in P2 and at least
one more. For example, let P1 = [Age ≤ 35] ∧ [Color = White] ∧ [Cuban = True]
and P2 = [Age ≤ 35]∧ [Color = White] be two patterns from the same class. Since
all the items belonging to P2 also belong to P1 but P1 has one more item, then P1
is more specific. Therefore, as P1 is more specific than P2 and both are emerging
patterns from the same class then P1 should be removed.
c) Removing redundant items from an emerging pattern. An item I1 is more general
than another item I2 if all objects fulfilling I1 also fulfill I2, but not all objects
fulfilling I2 fulfill I1. We also say that I2 is redundant with I1. If two items in a
pattern are redundant, the most general item is eliminated. An example of a pattern
with redundant items is: [Age ≤ 35]∧ [Age ≤ 40], which is simplified to [Age ≤ 35];
since persons older than 40 are also older than 35.
Algorithms 3-5 show the pseudocodes of our proposal (HRFm) for mining emerging
patterns, at algorithm level, in class imbalance problems.
4.2.1 Experimental results
In order to evaluate the performance of HRFm, we compared it against other state-
of-the-art emerging pattern miners for class imbalance problems. First, we extracted
emerging patterns by using HRFm and the other emerging pattern miners reported in
the literature. After, we computed the AUC obtained by an emerging pattern-based
classifier using these emerging patterns in order to identify the best miner. As the
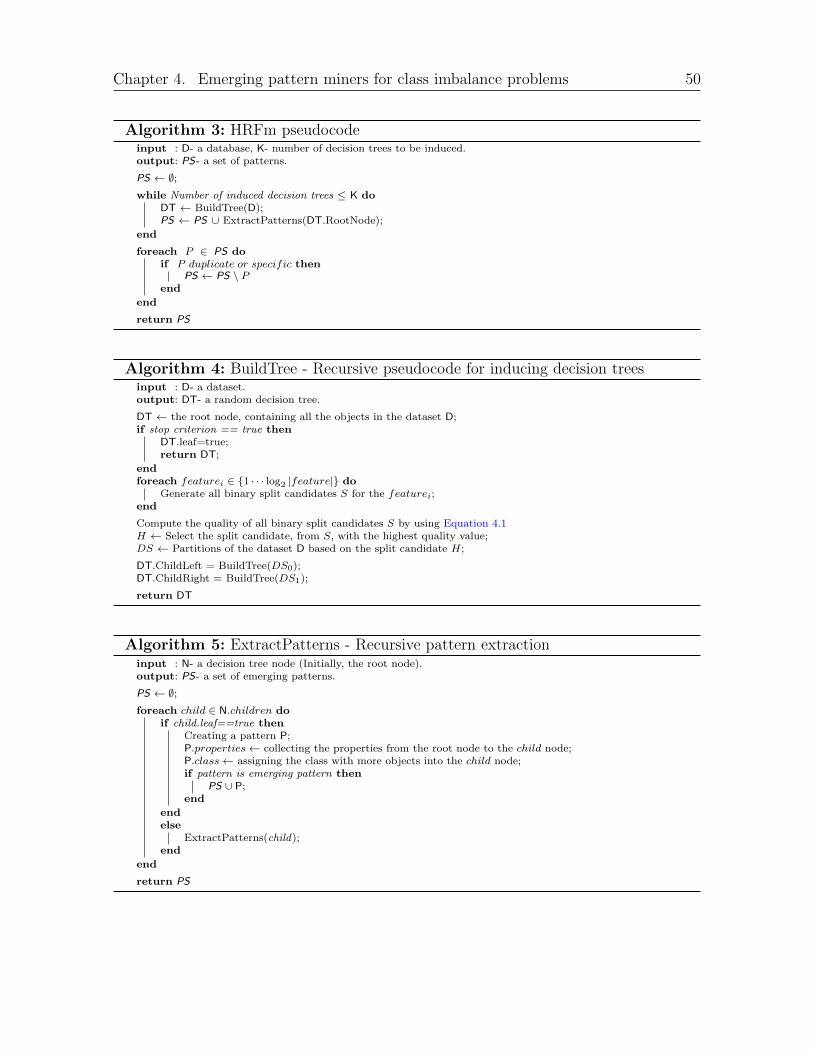
Chapter 4. Emerging pattern miners for class imbalance problems 50
Algorithm 3: HRFm pseudocodeinput : D- a database, K- number of decision trees to be induced.output: PS- a set of patterns.
PS ← ∅;while Number of induced decision trees ≤ K do
DT ← BuildTree(D);PS ← PS ∪ ExtractPatterns(DT.RootNode);
end
foreach P ∈ PS doif P duplicate or specific then
PS ← PS \ Pend
end
return PS
Algorithm 4: BuildTree - Recursive pseudocode for inducing decision treesinput : D- a dataset.output: DT- a random decision tree.
DT ← the root node, containing all the objects in the dataset D;if stop criterion == true then
DT.leaf=true;return DT;
endforeach featurei ∈ {1 · · · log2 |feature|} do
Generate all binary split candidates S for the featurei;end
Compute the quality of all binary split candidates S by using Equation 4.1H ← Select the split candidate, from S, with the highest quality value;DS ← Partitions of the dataset D based on the split candidate H;
DT.ChildLeft = BuildTree(DS0);DT.ChildRight = BuildTree(DS1);
return DT
Algorithm 5: ExtractPatterns - Recursive pattern extractioninput : N- a decision tree node (Initially, the root node).output: PS- a set of emerging patterns.
PS ← ∅;foreach child ∈ N.children do
if child.leaf==true thenCreating a pattern P;P.properties← collecting the properties from the root node to the child node;P.class← assigning the class with more objects into the child node;if pattern is emerging pattern then
PS ∪ P;end
endelse
ExtractPatterns(child);end
end
return PS
Chapter 4. Emerging pattern miners for class imbalance problems 51
emerging pattern-based classifier is the same and the only change is the set of emerging
patterns produced by each miner, then a good or bad performance in the classification
results can be attributed to the emerging pattern miner. Additionally, we evaluated the
performance of the miners regarding the IR in order to find out which of the evaluated
miners has good performance for certain levels of IR, in a similar way as in Section 4.1.1.
To the best of our knowledge, there are not algorithms into the algorithm level for
mining emerging patterns in class imbalance problems then, an alternative for compar-
ing HRFm against other emerging pattern miners designed for class imbalance prob-
lems is to use emerging pattern miners proposed into the data level. Therefore, for
our comparison, we use DEP [Alhammady, 2007], SMOTE-TL+LCMine (proposed in
Section 4.1), and HRFm (proposed in this section) as emerging pattern miners. HRFm
induces 100 unpruned decision trees because after testing other values, 100 provided
the best results for HRFm. Also, in [Garcıa-Borroto et al., 2015] the authors claim that
it is the best setup for RFm. In addition, we selected a subset of features F with size
equal to log2 |features| as suggested by Breiman [1996], for generating candidate splits
at each node because after testing other sizes, log2 |features| provided the best results
for HRFm.
In order to compare the results reported in Section 4.1.1.2 against the results of this
section, we use the 95 imbalanced databases, described in Table 3.3, by applying Dis-
tribution Optimally Balanced Stratified Cross Validation (DOB-SCV) [Moreno-Torres
et al., 2012]; as emerging pattern-based classifier, we use CAEP [Dong et al., 1999],
and the AUC measure [Huang and Ling, 2005] for assessing the classification results as
shown in Section 4.1.1.2. Additionally, we will apply the Friedman’s test, the Finner’s
procedure, and the Wilcoxon signed-rank test in order to statistically validate the clas-
sification results, as suggested in [Demsar, 2006; Derrac et al., 2011] for this kind of
experiments.
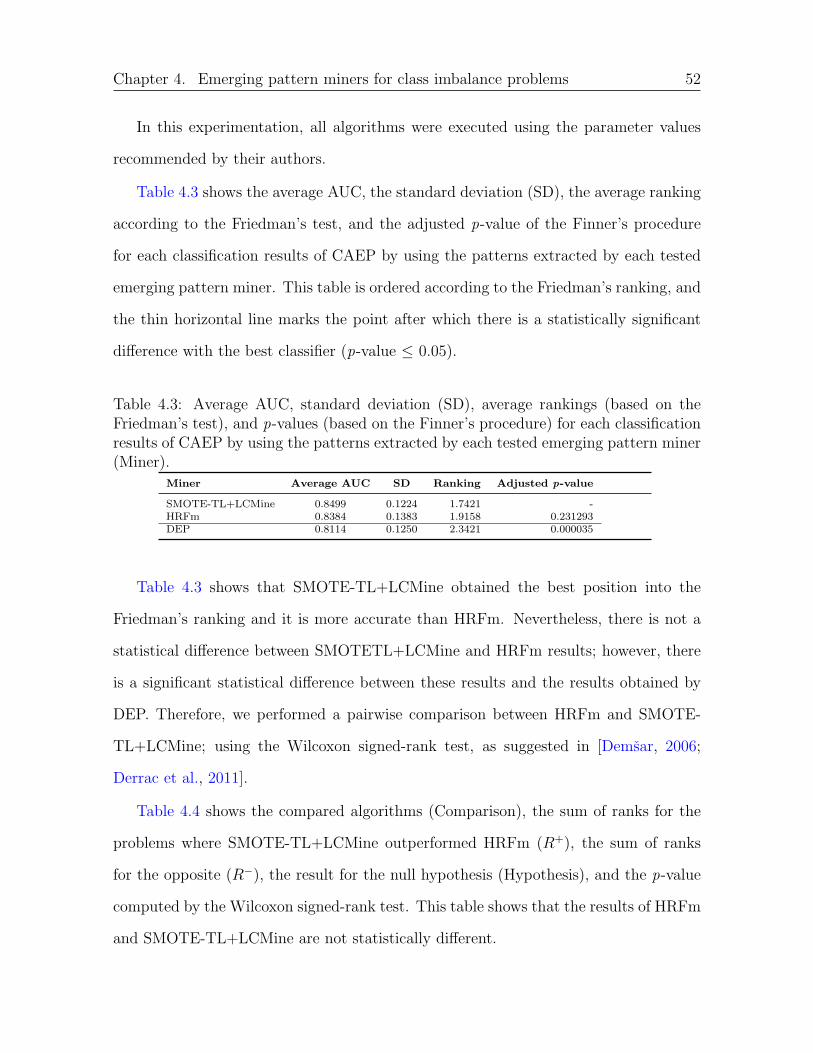
Chapter 4. Emerging pattern miners for class imbalance problems 52
In this experimentation, all algorithms were executed using the parameter values
recommended by their authors.
Table 4.3 shows the average AUC, the standard deviation (SD), the average ranking
according to the Friedman’s test, and the adjusted p-value of the Finner’s procedure
for each classification results of CAEP by using the patterns extracted by each tested
emerging pattern miner. This table is ordered according to the Friedman’s ranking, and
the thin horizontal line marks the point after which there is a statistically significant
difference with the best classifier (p-value ≤ 0.05).
Table 4.3: Average AUC, standard deviation (SD), average rankings (based on theFriedman’s test), and p-values (based on the Finner’s procedure) for each classificationresults of CAEP by using the patterns extracted by each tested emerging pattern miner(Miner).
Miner Average AUC SD Ranking Adjusted p-value
SMOTE-TL+LCMine 0.8499 0.1224 1.7421 -HRFm 0.8384 0.1383 1.9158 0.231293DEP 0.8114 0.1250 2.3421 0.000035
Table 4.3 shows that SMOTE-TL+LCMine obtained the best position into the
Friedman’s ranking and it is more accurate than HRFm. Nevertheless, there is not a
statistical difference between SMOTETL+LCMine and HRFm results; however, there
is a significant statistical difference between these results and the results obtained by
DEP. Therefore, we performed a pairwise comparison between HRFm and SMOTE-
TL+LCMine; using the Wilcoxon signed-rank test, as suggested in [Demsar, 2006;
Derrac et al., 2011].
Table 4.4 shows the compared algorithms (Comparison), the sum of ranks for the
problems where SMOTE-TL+LCMine outperformed HRFm (R+), the sum of ranks
for the opposite (R−), the result for the null hypothesis (Hypothesis), and the p-value
computed by the Wilcoxon signed-rank test. This table shows that the results of HRFm
and SMOTE-TL+LCMine are not statistically different.
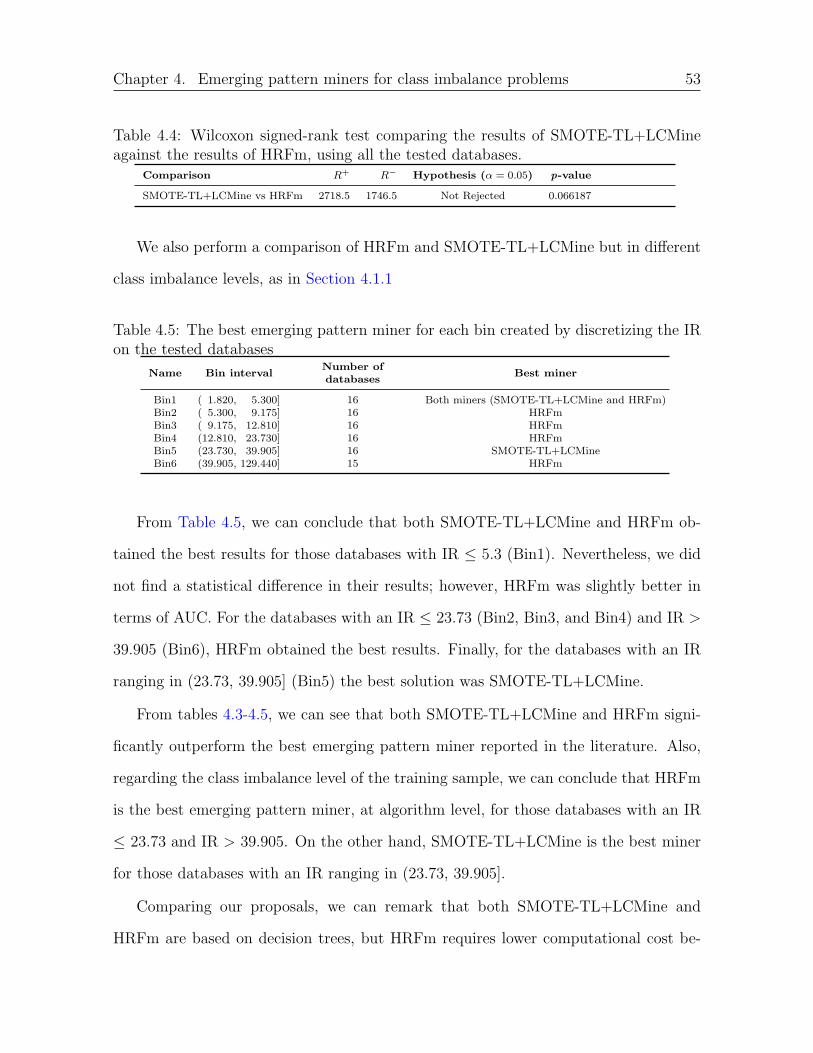
Chapter 4. Emerging pattern miners for class imbalance problems 53
Table 4.4: Wilcoxon signed-rank test comparing the results of SMOTE-TL+LCMineagainst the results of HRFm, using all the tested databases.
Comparison R+ R− Hypothesis (α = 0.05) p-value
SMOTE-TL+LCMine vs HRFm 2718.5 1746.5 Not Rejected 0.066187
We also perform a comparison of HRFm and SMOTE-TL+LCMine but in different
class imbalance levels, as in Section 4.1.1
Table 4.5: The best emerging pattern miner for each bin created by discretizing the IRon the tested databases
Name Bin intervalNumber ofdatabases
Best miner
Bin1 ( 1.820, 5.300] 16 Both miners (SMOTE-TL+LCMine and HRFm)Bin2 ( 5.300, 9.175] 16 HRFmBin3 ( 9.175, 12.810] 16 HRFmBin4 (12.810, 23.730] 16 HRFmBin5 (23.730, 39.905] 16 SMOTE-TL+LCMineBin6 (39.905, 129.440] 15 HRFm
From Table 4.5, we can conclude that both SMOTE-TL+LCMine and HRFm ob-
tained the best results for those databases with IR ≤ 5.3 (Bin1). Nevertheless, we did
not find a statistical difference in their results; however, HRFm was slightly better in
terms of AUC. For the databases with an IR ≤ 23.73 (Bin2, Bin3, and Bin4) and IR >
39.905 (Bin6), HRFm obtained the best results. Finally, for the databases with an IR
ranging in (23.73, 39.905] (Bin5) the best solution was SMOTE-TL+LCMine.
From tables 4.3-4.5, we can see that both SMOTE-TL+LCMine and HRFm signi-
ficantly outperform the best emerging pattern miner reported in the literature. Also,
regarding the class imbalance level of the training sample, we can conclude that HRFm
is the best emerging pattern miner, at algorithm level, for those databases with an IR
≤ 23.73 and IR > 39.905. On the other hand, SMOTE-TL+LCMine is the best miner
for those databases with an IR ranging in (23.73, 39.905].
Comparing our proposals, we can remark that both SMOTE-TL+LCMine and
HRFm are based on decision trees, but HRFm requires lower computational cost be-

Chapter 4. Emerging pattern miners for class imbalance problems 54
cause it does not use a resampling method before mining emerging patterns. On the
other hand, SMOTE-TL+LCMine extracts less emerging patterns than HRFm, which
makes faster the filtering stage. Finally, based on our experimental results, we suggest
using HRFm for class imbalance problems with low or very high imbalance ratio (IR),
while SMOTE-TL+LCMine for those problems with medium IR
4.3 Cost-sensitive
This section introduces a new algorithm for mining cost-sensitive emerging patterns in
class imbalance problems.
Cost-sensitive algorithms compute the misclassification cost for a query object re-
garding the problem classes. This misclassification cost is computed by using a cost
matrix (see Table 4.6), which comes from domain experts or is acquired by other ap-
proaches, like using the distribution of objects into the classes of the training data-
base. Usually, the misclassification cost for objects belonging to the minority class
C(1, 0) is higher than the misclassification cost for those objects belonging to the ma-
jority class C(0, 1); while true classifications have a misclassification cost equal to zero
C(0, 0) = C(1, 1) = 0 [Domingos, 1999; Lopez et al., 2012; Kim et al., 2012; Lopez
et al., 2013; Bahnsen et al., 2015].
Table 4.6: Example of a cost matrix for a two-class problem.
Actual Minority Actual Majority
Predict Minority C(0, 0) = 0 C(0, 1) = 1
Predict Majority C(1, 0) = 9 C(1, 1) = 0
Given a cost matrix, a query object is classified into the class having the lowest ex-
pected cost; this criterion is known as the minimum expected cost principle [Domingos,
1999; Kim et al., 2012; Lopez et al., 2013]. The expected cost R(i|o) of classifying a

Chapter 4. Emerging pattern miners for class imbalance problems 55
query object o into the class i is commonly expressed as:
R(i|o) =∑j
P (j|o) · C(i, j) (4.2)
where P (j|o) is the estimated probability of classifying the query object o into the class
j and C(i, j) is the cost of predicting the class i for the query object o when j is the
correct class [Domingos, 1999; Lopez et al., 2012; Kim et al., 2012; Lopez et al., 2013;
Bahnsen et al., 2015].
One of the first cost-sensitive algorithms using Equation 4.2 is Metacost: a gen-
eral method for making cost-sensitive classifiers [Domingos, 1999]. Metacost changes a
traditional cost-insensitive classifier into a cost-sensitive one. The main idea is to use
Equation 4.2, a cost matrix, and a cost-insensitive classifier for relabeling each object
into the training dataset in order to obtain a classification model for class imbalance
problems [Domingos, 1999].
Other supervised classification algorithms based on cost matrices, which have re-
ported good classification results in class imbalance problems, are the so called cost-
sensitive decision trees [Sheng et al., 2005; Kretowski and Grzes, 2006; Zhang et al.,
2007; Freitas, 2011; Jackowski et al., 2012; Min and Zhu, 2012; Lomax and Vadera,
2013; Krawczyk et al., 2014]. These algorithms can be grouped into two approaches:
those using only misclassification costs and those which also include test costs [Lomax
and Vadera, 2013]. The misclassification cost approach computes the expected cost by
multiplying a confusion matrix and a cost matrix. The test cost approach computes
the expected cost by adding the cost associated to each feature used in the decision
nodes traversed from the root to the leaves for classifying a query object. The main
idea, in both approaches, is to include the expected cost into the splitting criterion at
the decision tree induction process. Then, following the approach for mining emerging
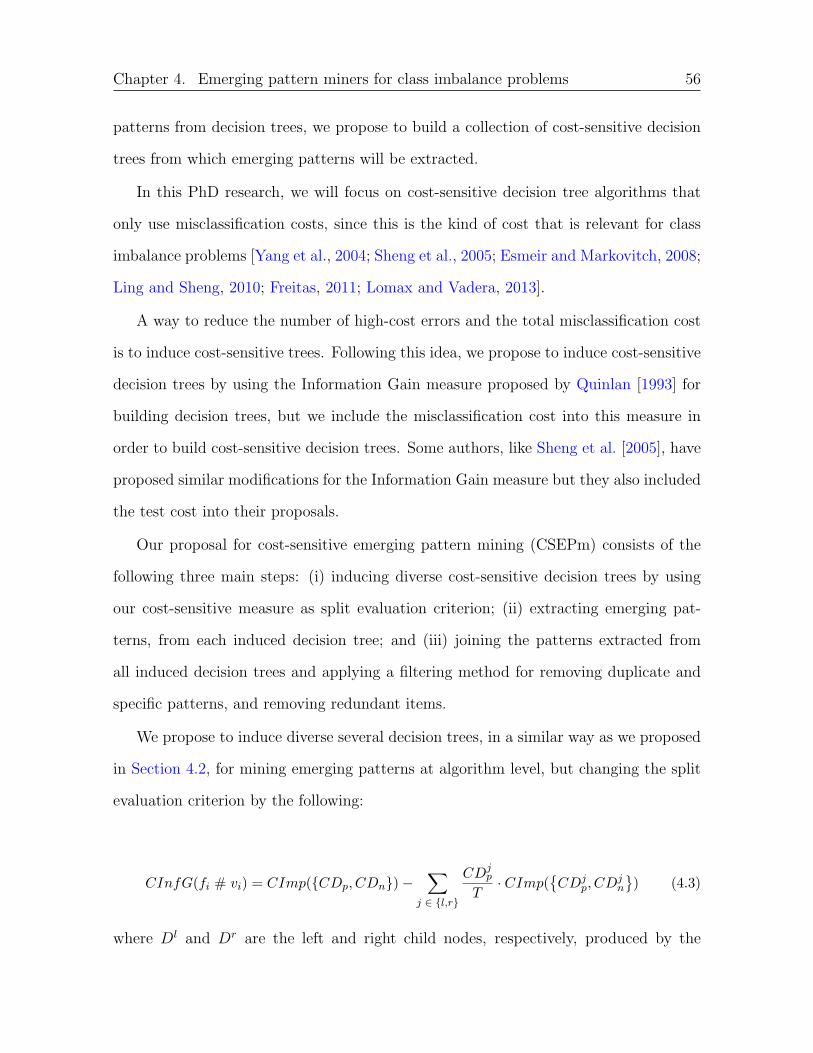
Chapter 4. Emerging pattern miners for class imbalance problems 56
patterns from decision trees, we propose to build a collection of cost-sensitive decision
trees from which emerging patterns will be extracted.
In this PhD research, we will focus on cost-sensitive decision tree algorithms that
only use misclassification costs, since this is the kind of cost that is relevant for class
imbalance problems [Yang et al., 2004; Sheng et al., 2005; Esmeir and Markovitch, 2008;
Ling and Sheng, 2010; Freitas, 2011; Lomax and Vadera, 2013].
A way to reduce the number of high-cost errors and the total misclassification cost
is to induce cost-sensitive trees. Following this idea, we propose to induce cost-sensitive
decision trees by using the Information Gain measure proposed by Quinlan [1993] for
building decision trees, but we include the misclassification cost into this measure in
order to build cost-sensitive decision trees. Some authors, like Sheng et al. [2005], have
proposed similar modifications for the Information Gain measure but they also included
the test cost into their proposals.
Our proposal for cost-sensitive emerging pattern mining (CSEPm) consists of the
following three main steps: (i) inducing diverse cost-sensitive decision trees by using
our cost-sensitive measure as split evaluation criterion; (ii) extracting emerging pat-
terns, from each induced decision tree; and (iii) joining the patterns extracted from
all induced decision trees and applying a filtering method for removing duplicate and
specific patterns, and removing redundant items.
We propose to induce diverse several decision trees, in a similar way as we proposed
in Section 4.2, for mining emerging patterns at algorithm level, but changing the split
evaluation criterion by the following:
CInfG(fi # vi) = CImp({CDp, CDn})−∑
j ∈ {l,r}
CDjp
T· CImp(
{CDj
p, CDjn
}) (4.3)
where Dl and Dr are the left and right child nodes, respectively, produced by the

Chapter 4. Emerging pattern miners for class imbalance problems 57
candidate split fi # vi; Dp and Dn are the sets of objects that belong to the minority
and majority class respectively; Dlp and Dr
p are the sets of objects of the minority class
that belong to the left and right child nodes respectively; Dln and Dr
n are the sets of
objects of the majority class that belong to the left and right child nodes respectively;
and CDjp =
∣∣Djp
∣∣ · C(1, 0) and CDjn = |Dj
n| · C(0, 1) are the maximum misclassification
costs for the sets Djp and Dj
n respectively, j ∈ {l, r}; CDp and CDn are defined in a
similar way. Finally, CImp is defined as:
CImp({CDp, CDn}) = −CDp
T· log2
CDp
T− CDn
T· log2
CDn
T(4.4)
where T = CDp + CDn.
Our proposed split evaluation criterion, Equation 4.3, takes a value equal to 1 (its
highest value) when the candidate split produces pure nodes, while it takes a value
equal to 0 (its lowest value) when the candidate split produces child nodes which have
the same distribution of objects by class as the parent node. Equation 4.3 deals with
class imbalance problems by weighting the objects through a cost matrix, which assigns
higher weights to objects belonging to the minority class than to objects belonging to
the majority class.
After inducing a collection of cost-sensitive decision trees by using Equation 4.3 as
the split evaluation criterion, the emerging patterns are extracted from each tree, in a
similar way as we stated in Section 4.2. Finally, the same filtering strategy for emerging
patterns presented in Section 4.2 is applied over the set of extracted emerging patterns.
It is important to highlight that as far as we know, our proposal is the first one for
extracting emerging patterns from a collection of cost-sensitive decision trees.
Algorithms 6-8 show the pseudocodes of our proposal (CSEPm) for mining cost-
sensitive emerging patterns in class imbalance problems.

Chapter 4. Emerging pattern miners for class imbalance problems 58
Algorithm 6: CSEPm pseudocodeinput : D- a database, C- a cost matrix, K- number of cost-sensitive decision trees to be induced.output: PS- a set of patterns.
PS ← ∅;while Number of cost-sensitive decision trees ≤ K do
DT ← BuildCSTree(D);PS ← PS ∪ ExtractCSPatterns(DT.RootNode);
end
foreach P ∈ PS doif P duplicate or specific then
PS ← PS \ Pend
end
return PS
Algorithm 7: BuildCSTree - Recursive pseudocode for inducing cost-sensitivedecision trees
input : D- a dataset, C- a cost matrix.output: DT- a cost-sensitive decision tree.
DT ← the root node, containing all the objects in the dataset D;if stop criterion == true then
DT.leaf=true;return DT;
endforeach featurei ∈ {1 · · · log2 |feature|} do
Generate all binary split candidates S for the featurei;end
Compute the quality of all binary split candidates S by using Equation 4.3 and the cost matrix C;H ← Select the split candidate, from S, with the highest quality value;DS ← Partitions of the dataset D based on the split candidate H;
DT.ChildLeft = BuildCSTree(DS0);DT.ChildRight = BuildCSTree(DS1);
return DT
Algorithm 8: ExtractCSPatterns - Pattern extraction from cost-senstitive de-cision trees
input : N- a cost-sensitive decision tree node (Initially, the root node).output: PS- a set of cost-sensitive patterns.
PS ← ∅;foreach child ∈ N.children do
if child.leaf==true thenCreating a pattern P;P.properties← collecting the properties from the root node to the child node;P.class← assigning the class that minimize the misclassification cost into the child node;PS ∪ P;
endelse
ExtractPatterns(child);end
end
return PS
Chapter 4. Emerging pattern miners for class imbalance problems 59
4.3.1 Experimental results
To the best of our knowledge, there are not cost-sensitive algorithms for mining emer-
ging patterns; then, an alternative for comparing CSEPm against other cost-insensitive
emerging pattern miners, is to use cost-insensitive emerging pattern miners as base into
the Metacost algorithm. In order to evaluate the performance of CSEPm, in terms of
misclassification cost, first, we will extract emerging patterns by using CSEPm and
after we apply the CAEP classifier [Dong et al., 1999] to compute the total misclas-
sification cost. Additionally, we will select two well-known emerging pattern miners,
DEP [Alhammady, 2007] and LCMine [Garcıa-Borroto et al., 2010b], which jointly with
the CAEP [Dong et al., 1999] classifier are used as the base classifier for the Metacost
algorithm. By doing this, we can compare the misclassification cost of CAEP using
CSEPm against the misclassification cost of CAEP using the other two cost-insensitive
algorithms for mining emerging patterns, combined with Metacost. As the classification
algorithm and the cost matrix are the same, and the only change is the approach for
extracting the patterns from the training database, then a good or bad performance
in the classification results can be attributed to the cost-sensitive approach for mining
emerging patterns.
For our experiments the main diagonal of the cost matrices is fixed as C(0, 0) =
C(1, 1) = 0, the misclassification cost for each object of the majority class is C(0, 1) = 1,
while for the misclassification cost for objects of the minority we use C(0, 1) = 2, 5, 10,
and 20, these costs are the most used in the literature [Kretowski and Grzes, 2006;
Du et al., 2007; Kretowski and Grzes, 2007; Zhang et al., 2007; Min and Zhu, 2012;
Krawczyk et al., 2014]. Additionally, we also propose to use the class imbalance ratio
(IR) of the training database as cost for C(0, 1).
In these experiments, we use the 95 imbalanced databases, detailed in Table 3.3,
by applying Distribution Optimally Balanced Stratified Cross Validation (DOB-SCV)
Chapter 4. Emerging pattern miners for class imbalance problems 60
[Moreno-Torres et al., 2012], and CAEP [Dong et al., 1999] as emerging pattern-based
classifier by the same reasons described in Section 4.1.1 and Section 4.2.1. For assessing
the classification results, we use the normalized expected cost (also known as: normal-
ized misclassification cost, see Equation 4.5) proposed by Drummond and Holte [2006]
because it is the most used measure for cost-sensitive problems [Garcıa et al., 2009; He
and Garcia, 2009; Menardi and Torelli, 2014].
NEC =TP ∗ C(0, 0) + FP ∗ C(0, 1) + FN ∗ C(1, 0) + TN ∗ C(1, 1)
|Dp| ∗ C(0, 0) + |Dp| ∗ C(0, 1) + |Dn| ∗ C(1, 0) + |Dn| ∗ C(1, 1)(4.5)
where TP and FP are the number of objects belonging to the minority class that are
well-classified and misclassified respectively; TN and FN are the number of objects be-
longing to the majority class that are well-classified and misclassified respectively; |Dp|
and |Dn| are the number of objects belonging to the minority class and majority class
respectively; and C(0, 0), C(0, 1), C(1, 0), and C(1, 1) are the different cost according
to the cost matrix (see Table 4.6).
Additionally, we apply the Friedman’s test, the Finner’s procedure and the Wilcoxon
signed-rank test, in a similar way as in Section 4.2.1, in order to statistically validate
the classification results, as suggested in [Demsar, 2006; Derrac et al., 2011] for this
kind of experiments.
Tables 4.7-4.11 show the average of the normalized misclassification cost (Average
Cost), the standard deviation (SD), the average ranking according to the Friedman’s
test, and the adjusted p-value of the Finner’s procedure for the CAEP classifier by
using each evaluated emerging pattern miner, considering all the tested databases.
These tables are ordered according to the average of the Friedman’s ranking value and
the thin horizontal line indicates the point after which there is a statistically significant

Chapter 4. Emerging pattern miners for class imbalance problems 61
difference with the best result in the Friedman ranking (p-value ≤ 0.05).
Table 4.7: Statistical results for the CAEP classifier by using the evaluated emergingpattern miners, considering all the tested databases and a cost of 2 for each misclassifiedobject of the minority class.
Cost-sensitive methods Average Cost SD Ranking Adjusted p-value
MetaCost+(LCMine+CAEP) 0.0140 0.0143 1.4789 -CSEPm+CAEP 0.0152 0.0146 1.6368 0.2765Metacost+(DEPMiner+CAEP) 0.0669 0.0488 2.8842 0
Table 4.8: Statistical results for the CAEP classifier by using the evaluated emergingpattern miners, considering all the tested databases and a cost of 5 for each misclassifiedobject of the minority class.
Cost-sensitive methods Average Cost SD Ranking Adjusted p-value
MetaCost+(LCMine+CAEP) 0.0199 0.0171 1.5632 -CSEPm+CAEP 0.0206 0.0158 1.6316 0.637241Metacost+(DEPMiner+CAEP) 0.0698 0.0515 1.6316 0
Tables 4.7-4.8 show the results of the evaluated emerging pattern miners by us-
ing a cost of 2 and 5, respectively, for each misclassified object of the minority class.
From these tables, we can conclude that the results of MetaCost+(LCMine+CAEP)
against CSEPm+CAEP is not statistically different, but these results are statistically
better than the results obtained by Metacost+(DEPMiner+CAEP). Also, it can be no-
ticed that MetaCost+(LCMine+CAEP) obtained a lower misclassification cost regard-
ing CSEPm+CAEP, however, CSEPm+CAEP obtained the lowest standard deviation
among all the tested emerging pattern miners.
Table 4.9: Statistical results for the CAEP classifier by using the evaluated emergingpattern miners, considering all the tested databases and a cost of 10 for each misclas-sified object of the minority class.
Cost-sensitive methods Average Cost SD Ranking Adjusted p-value
CSEPm+CAEP 0.0231 0.0168 1.4737 -MetaCost+(LCMine+CAEP) 0.0264 0.0211 1.7895 0.029523Metacost+(DEPMiner+CAEP) 0.0651 0.0510 2.7368 0
Tables 4.9-4.11 show the results of the evaluated emerging pattern miners by using
a cost of 10, 20, and the IR value, respectively, for each misclassified object of the

Chapter 4. Emerging pattern miners for class imbalance problems 62
Table 4.10: Statistical results for the CAEP classifier by using the evaluated emergingpattern miners, considering all the tested databases and a cost of 20 for each misclas-sified object of the minority class.
Cost-sensitive methods Average Cost SD Ranking Adjusted p-value
CSEPm+CAEP 0.0233 0.0186 1.4526 -MetaCost+(LCMine+CAEP) 0.0321 0.0255 2.0158 0.000104Metacost+(DEPMiner+CAEP) 0.0543 0.0449 2.5316 0
Table 4.11: Statistical results for the CAEP classifier by using the evaluated emergingpattern miners, considering all the tested databases and a cost equal to the IR of thetested database for each misclassified objects of the minority class.
Cost-sensitive methods Average Cost SD Ranking Adjusted p-value
CSEPm+CAEP 0.0286 0.0236 1.4053 -MetaCost+(LCMine+CAEP) 0.0339 0.0272 1.8474 0.002311Metacost+(DEPMiner+CAEP) 0.0566 0.0348 2.7474 0
minority class. From these tables, we can conclude that CSEPm+CAEP obtained the
best position into the Friedman’s ranking. Also, it can be noticed that for each cost
matrix, CSEPm+CAEP obtained the lowest total misclassification cost with the lowest
standard deviation. Also, the p-values (≤ 0.05) show that the differences of the results
of CSEPm+CAEP against the other options are statistically significant.
Metacost creates several bootstrap subsamples of the training dataset and con-
sequently, many highly specific patterns can be generated for each subsample; leaving
uncovered some objects of the original dataset [Loyola-Gonzalez et al., 2017]. This
procedure affects the results of Metacost impacting in the standard deviation of the
average cost, as it can be seen in tables 4.7-4.11.
On the other hand, CSEPm+CAEP shows significantly lower total misclassification
costs than the other options that use Metacost. It is important to highlight that
CSEPm+CAEP does not change the class of the objects into the training dataset as
Metacost does and consequently, the extracted emerging patterns can be associated to
each class. Furthermore, as far as we know, CSEPm is the first cost-sensitive emerging
pattern miner for class imbalance problems.
Chapter 4. Emerging pattern miners for class imbalance problems 63
4.4 Concluding remarks
In this chapter, three emerging pattern mining algorithms for class imbalance problems
have been proposed. In the data level approach, we explored the use of resampling
methods combined with emerging pattern miners. From our experiments, we propose
to use SMOTE-TL jointly with LCMine miner, which has proven to be the best option
at data level approach. Additionally, we grouped the imbalanced datasets into different
class imbalance ratio (IR) levels and performed the same study into each IR level to
provide a guide for selecting the best resampling method for a specific database.
At the algorithm level approach, we introduced an emerging pattern mining al-
gorithm for class imbalance problems (HRFm), which is based on extracting emerging
patterns from a collection of decision trees. HRFm modifies the Random Forest miner
by applying a skew-insensitive measure for evaluating candidate splits and uses a filter-
ing method for removing duplicate and specific patterns. Based on our experiments, we
can conclude that HRFm is the best one regarding other emerging pattern miners for
class imbalance problems reported in the literature into the data level. Additionally,
we grouped the imbalanced datasets into different IR levels and we performed the same
experiment with HRFm into each IR level, we found out that for databases with an IR
≤ 23.73 and an IR > 39.905, HRFm is the best option; while SMOTE-TL+LCMine is
the best option for the other IR ranges.
Finally, into the cost-sensitive approach, we propose a cost-sensitive emerging pat-
tern mining algorithm for class imbalance problems (CSEPm). CSEPm introduces a
cost-sensitive measure for evaluating candidate splits in order to induce decision trees
from which a set of emerging patterns are extracted. These patterns allow creating an
emerging pattern-based classifier that reduces the total misclassification cost. From our
experiments, we can conclude that CSEPm+CAEP obtains lower misclassification cost

Chapter 4. Emerging pattern miners for class imbalance problems 64
than other well-known emerging pattern miners combined with CAEP and Metacost.
Also, as far as we know, CSEPm is the first cost-sensitive emerging pattern miner for
class imbalance problems.
Chapter 5Emerging pattern-based classifierfor class imbalance problems
In this chapter, we propose an emerging pattern-based classifier for class imbalance
problems. We split the content of this chapter as follows: Section 5.1 introduces the
proposed classifier. Section 5.2 shows our experimental results. Finally, Section 5.3
presents some concluding remarks.
5.1 PBC4cip: A novel emerging pattern-based clas-
sifier for class imbalance problems
As we have discussed in Chapter 1 and Chapter 4, algorithms for mining emerging
patterns in class imbalance problems commonly extract several emerging patterns with
high support for the majority class and only a few emerging patterns, with low support,
for the minority class [Lopez et al., 2013, 2014a,b; Loyola-Gonzalez et al., 2016b, 2017].
This makes that some emerging pattern-based classifiers, which are based only on the
sum of supports, become biased toward the majority class [Loyola-Gonzalez et al., 2017].
For solving this problem, we propose that at classification stage, for all emerging
patterns covering a query object, the classifier weights the sum of supports in each
class taking into account the class imbalance level of the training sample. The main
idea is that, at the classification stage, those emerging patterns with low support for
the minority class do not become overwhelmed by those emerging patterns with high
support for the majority class. For this, we propose weighing the sum of support for
those patterns covering an object to be classified, by a value wc that takes into account
65

Chapter 5. Emerging pattern-based classifier for class imbalance problems 66
the patterns in the class, their support, and the class imbalance, according to the
following expression:
wc =
(1− |c||D|
)/∑p∈Pc
support(p, c) (5.1)
where |c| represents the number of objects belonging to the class c, |D| is the number
of objects in the training dataset, Pc is the set of emerging patterns mined for the class
c, and support(p, c) is the support of the pattern p into the class c.
The term (1 − |c|/|D|), in Equation 5.1, allows rewarding the sum of supports
computed for the minority class, which usually is low, since the smaller the value of
|c|, the higher the value of this term. On the contrary, this term punishes the sum of
supports computed for the majority class, which usually is high, since the higher the
value of |c|, the lower the value of this term. Additionally, the term∑
p∈Pcsupport(p, c)
is used for normalizing the sum of supports in each class regarding the support of all
patterns of the same class. In this way, the weight, defined in Equation 5.1, aims to
overcome the bias of the classifier to the majority class, by assigning a higher weight
for the minority class.
Our proposal, called PBC4cip, in the training phase, computes the emerging pat-
terns for each class c as well as the weight wc (See Equation 5.1). In the classification
phase, given a query object to be classified, PBC4cip computes for each class c the sum
of supports of all patterns covering this query object. After, this sum of supports is
multiplied by the corresponding weight wc, see Equation 5.2.
wSum Supp(o, c) = wc ∗∑p∈P,
p covers o
support(p, c) (5.2)
In Equation 5.2, wc represents the weight of the class c, which was previously com-
puted using Equation 5.1, support(p, c) is the support in the class c of the pattern p
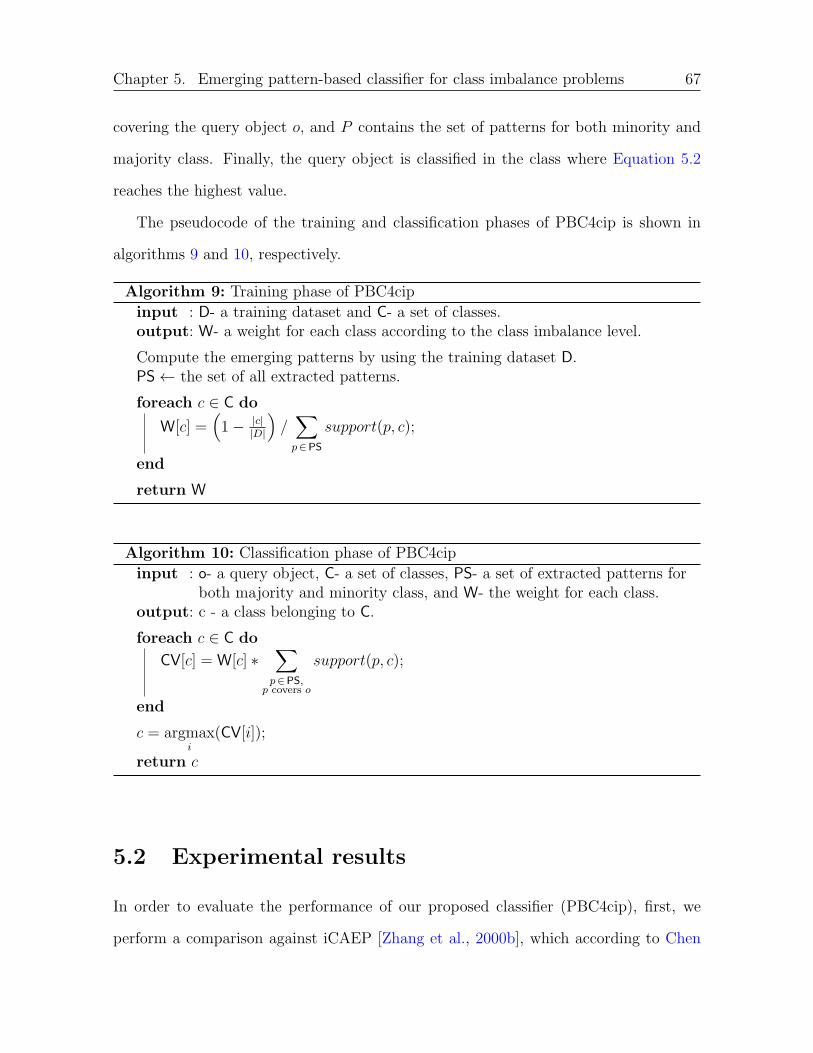
Chapter 5. Emerging pattern-based classifier for class imbalance problems 67
covering the query object o, and P contains the set of patterns for both minority and
majority class. Finally, the query object is classified in the class where Equation 5.2
reaches the highest value.
The pseudocode of the training and classification phases of PBC4cip is shown in
algorithms 9 and 10, respectively.
Algorithm 9: Training phase of PBC4cip
input : D- a training dataset and C- a set of classes.output: W- a weight for each class according to the class imbalance level.
Compute the emerging patterns by using the training dataset D.PS← the set of all extracted patterns.
foreach c ∈ C do
W[c] =(1− |c|
|D|
)/∑p∈PS
support(p, c);
end
return W
Algorithm 10: Classification phase of PBC4cip
input : o- a query object, C- a set of classes, PS- a set of extracted patterns forboth majority and minority class, and W- the weight for each class.
output: c - a class belonging to C.
foreach c ∈ C do
CV[c] = W[c] ∗∑p∈PS,
p covers o
support(p, c);
end
c = argmaxi
(CV[i]);
return c
5.2 Experimental results
In order to evaluate the performance of our proposed classifier (PBC4cip), first, we
perform a comparison against iCAEP [Zhang et al., 2000b], which according to Chen
Chapter 5. Emerging pattern-based classifier for class imbalance problems 68
and Dong [2012] reports good classification results on class imbalance problems. For this
comparison, we use LCMine [Garcıa-Borroto et al., 2010b] as emerging pattern miner
for both iCAEP and PBC4cip. The aim is to show the best emerging pattern-based
classifier for dealing with class imbalance problems but using a conventional emerging
pattern miner, which was not designed for class imbalance problems. In this way, we can
determine which of the evaluated classifiers deals better with class imbalance problems.
Additionally, we perform another comparison between PBC4cip and iCAEP but
using our emerging pattern miners designed for class imbalance problems. We used our
miners introduced in Chapter 4 because they have shown to extract better-emerging
patterns for class imbalance problems than the best previously reported emerging pat-
tern miner designed for this kind of problems. The goal of this comparison is to show
if by using emerging pattern miners specifically designed for class imbalance problems
can improve even more the results of these two classifiers.
Finally, we compare PBC4cip against several popular state-of-the-art classifiers for
class imbalance problems which are not based on emerging patterns. The goal of this
comparison is to show if PBC4cip obtains better classification results, in class imbal-
ance problems, than other classifiers not based on emerging patterns, which have been
designed for dealing with class imbalance problems.
For this experimentation, we use the 95 imbalanced databases, described in Table 3.3,
by applying Distribution Optimally Balanced Stratified Cross Validation (DOB-SCV)
[Moreno-Torres et al., 2012], and using the AUC measure [Huang and Ling, 2005] for
assessing the classification results, as shown in Section 4.1.1 and Section 4.2.1. Finally,
we apply the Friedman’s test, the Finner’s procedure, and the Wilcoxon signed-rank
test in order to statistically validate the classification results, as suggested by [Demsar,
2006; Derrac et al., 2011] for this kind of experimental setup.
For our experiments, we use OCC [Hempstalk et al., 2008] and OCSVM [Scholkopf

Chapter 5. Emerging pattern-based classifier for class imbalance problems 69
et al., 2001] taken from the Weka Data Mining software tool [Hall et al., 2009]. Also,
we use RUSBoost [Seiffert et al., 2010] and SMOTE-TL [Batista et al., 2004] from the
KEEL Data-Mining software tool [Alcala-Fdez et al., 2009]. The algorithms CCPDT1
[Liu et al., 2010], Coverage2 [Ibarguren et al., 2015], CTC3 [Perez et al., 2007], HeDex4
[Kang and Ramamohanarao, 2014], kENN5 [Li and Zhang, 2011b], KLPART [Su et al.,
2015a], KRNN6 [Zhang et al., 2017], LCMine [Garcıa-Borroto et al., 2010b], and RB-
Boost [Dıez-Pastor et al., 2015] were provided by their authors. Finally, we used our
own implementation for iCAEP.
It is important to highlight that all the algorithms used in this experimentation
were executed using the parameter values recommended by their authors.
5.2.1 Comparison between PBC4cip and iCAEP
This section, first, shows the experimental results of comparing PBC4cip against iCAEP
using LCMine as emerging patterns miner.
Table 5.1 shows a comparison of the classification results of PBC4cip and iCAEP,
when they use emerging patterns extracted by LCMine. This table includes the average
AUC (AUC) and standard deviation (SD) for both compared classifiers (Comparison),
the sum of ranks for the problems where PBC4cip outperformed iCAEP (R+), the sum
of ranks for the opposite (R−), the result of the null hypothesis (Hypothesis), and the
p-value (p) computed by the Wilcoxon signed-rank test.
From Table 5.1, we can see that PBC4cip significantly outperforms iCAEP when
both use emerging patterns extracted by LCMine which is a conventional emerging
1https://sites.google.com/site/weiliusite/2http://www.aldapa.eus/res/weka-ctc/weka-ctc-v2.html3http://www.aldapa.eus/res/weka-ctc/weka-ctc-v1.html4http://www3.nd.edu/~dial/hddt/5http://goanna.cs.rmit.edu.au/~zhang/ENN/6http://www.xiuzhenzhang.org/downloads/

Chapter 5. Emerging pattern-based classifier for class imbalance problems 70
pattern miner (i.e., not designed for class imbalance problems).
Table 5.1: Wilcoxon signed-rank test (α = 0.05) comparing the AUC results of PBC4cipagainst the AUC results of iCAEP but using LCMine as emerging patterns miner andconsidering all the tested databases.
ComparisonPBC4cip iCAEP
R+ R− Hypothesis pAUC SD AUC SD
LCMine+PBC4cip vs LCMine+iCAEP 0.8559 0.1111 0.8097 0.1410 3961.5 598.5 Rejected 0
In Table 5.2, we show the results obtained by PBC4cip and iCAEP, when they
use patterns mined by an emerging pattern miner designed for class imbalance prob-
lems, specifically we used the miners HRFm and SMOTE-TL+LCMine introduced in
Chapter 4.
Table 5.2 shows the average AUC, standard deviation (SD), the average ranking
according to the Friedman’s test, and adjusted p-value of the Finner’s procedure for
each tested classifiers. This table is ordered according to the Friedman’s ranking and
the thin horizontal line marks the point after which there is a statistically significant
difference with the best classifier (p-value ≤ 0.05).
From Table 5.2 we can see that HRFm+PBC4cip obtained the best position into
the Friedman’s ranking. Also, it can be noticed that HRFm+PBC4cip obtained the
best average AUC (0.8715) with the lowest standard deviation (0.1027). These val-
ues show that our proposal almost always obtains good AUC results. On the other
hand, adjusted p-values show that the difference of the results of HRFm+iCAEP and
(SMOTE-TL+LCMine)+iCAEP are statistically significant. Nevertheless, the differ-
ence of the results of HRFm+PBC4cip against (SMOTE-TL+LCMine)+PBC4cip is
not statistically significant. Therefore, we performed a pairwise comparison between
HRFm+PBC4cip and (SMOTE-TL+LCMine)+PBC4cip; using the Wilcoxon signed-
rank test, as suggested in [Demsar, 2006; Garcıa and Herrera, 2008; Garcıa et al., 2010;
Derrac et al., 2011].

Chapter 5. Emerging pattern-based classifier for class imbalance problems 71
Table 5.2: Average AUC, standard deviation (SD), average rankings (based on theFriedman’s test), and p-values (based on the Finner’s procedure) for all the testedemerging pattern-based classifiers using all the tested databases.
Algorithms Average AUC SD Ranking Adjusted p-value
HRFm+PBC4cip 0.8715 0.1027 1.8158 -(SMOTE-TL+LCMine)+PBC4cip 0.8493 0.1227 2.1421 0.0815(SMOTE-TL+LCMine)+iCAEP 0.8288 0.1316 2.9211 0HRFm+iCAEP 0.8089 0.1437 3.1211 0
The results of applying theWilcoxon signed-rank test for comparing HRFm+PBC4cip
against (SMOTE-TL+LCMine)+PBC4cip are shown in Table 5.3. This table shows the
compared classifiers (Comparison), the sum of ranks for the problems where HRFm+PBC4cip
outperformed (SMOTE-TL+LCMine)+PBC4cip (R+), the sum of ranks for the oppos-
ite (R−), the result of the null hypothesis (Hypothesis), and the p-value computed by
the Wilcoxon signed-rank test.
Table 5.3: Wilcoxon signed-rank test (α = 0.05) comparing the AUC results ofHRFm+PBC4cip against the AUC results of (SMOTE-TL+LCMine)+PBC4cip, us-ing all the tested databases.Comparison R+ R− Hypothesis p-value
HRFm+PBC4cip vs (SMOTE-TL+LCMine)+PBC4cip 3311.0 1249.0 Rejected 0.000123
From Table 5.3, we can assert that HRFm+PBC4cip significantly outperforms
(SMOTE-TL+LCMine)+PBC4cip. Thus, from tables 5.2 and 5.3, we can conclude
that HRFm+PBC4cip is the best solution based on emerging patterns for class imbal-
ance problems regarding the other evaluated solutions.
5.2.2 Comparing against supervised classifiers not based onemerging patterns for class imbalance problems
In this section, we show the results of comparing HRFm+PBC4cip against state-of-the-
art classifiers for class imbalance problems, which are not based on emerging patterns.
Table 5.4 shows the results of comparing HRFm+PBC4cip against classifiers not
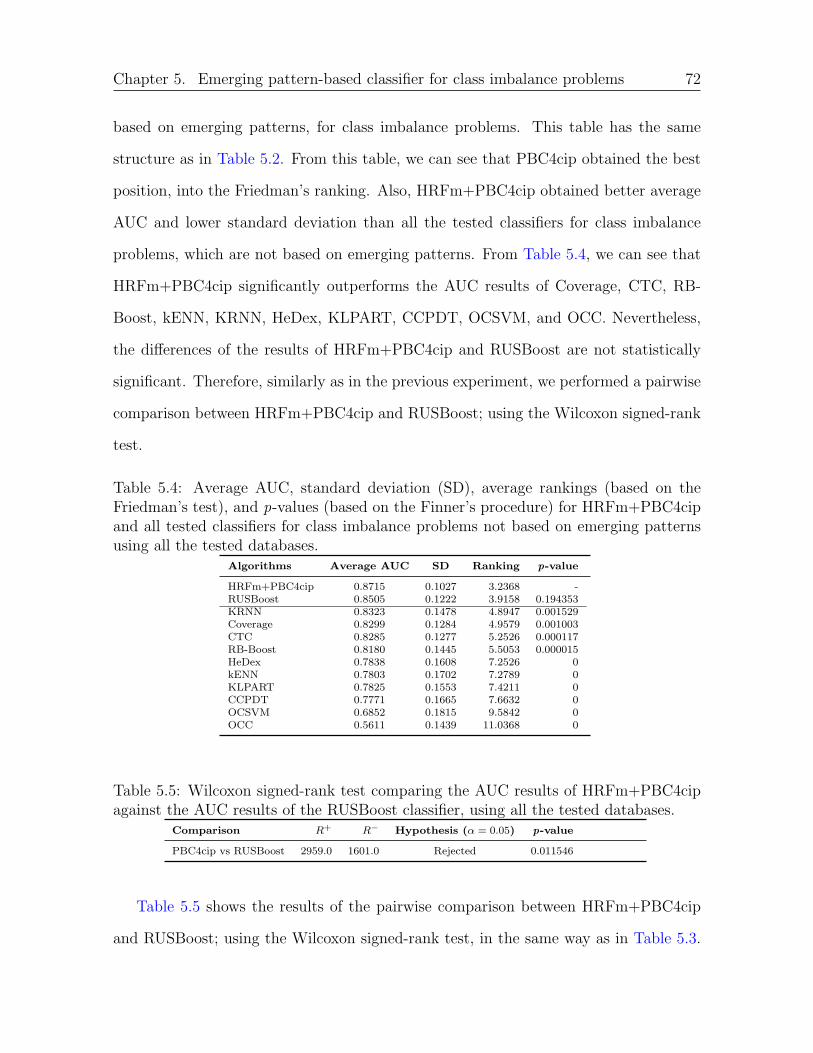
Chapter 5. Emerging pattern-based classifier for class imbalance problems 72
based on emerging patterns, for class imbalance problems. This table has the same
structure as in Table 5.2. From this table, we can see that PBC4cip obtained the best
position, into the Friedman’s ranking. Also, HRFm+PBC4cip obtained better average
AUC and lower standard deviation than all the tested classifiers for class imbalance
problems, which are not based on emerging patterns. From Table 5.4, we can see that
HRFm+PBC4cip significantly outperforms the AUC results of Coverage, CTC, RB-
Boost, kENN, KRNN, HeDex, KLPART, CCPDT, OCSVM, and OCC. Nevertheless,
the differences of the results of HRFm+PBC4cip and RUSBoost are not statistically
significant. Therefore, similarly as in the previous experiment, we performed a pairwise
comparison between HRFm+PBC4cip and RUSBoost; using the Wilcoxon signed-rank
test.
Table 5.4: Average AUC, standard deviation (SD), average rankings (based on theFriedman’s test), and p-values (based on the Finner’s procedure) for HRFm+PBC4cipand all tested classifiers for class imbalance problems not based on emerging patternsusing all the tested databases.
Algorithms Average AUC SD Ranking p-value
HRFm+PBC4cip 0.8715 0.1027 3.2368 -RUSBoost 0.8505 0.1222 3.9158 0.194353KRNN 0.8323 0.1478 4.8947 0.001529Coverage 0.8299 0.1284 4.9579 0.001003CTC 0.8285 0.1277 5.2526 0.000117RB-Boost 0.8180 0.1445 5.5053 0.000015HeDex 0.7838 0.1608 7.2526 0kENN 0.7803 0.1702 7.2789 0KLPART 0.7825 0.1553 7.4211 0CCPDT 0.7771 0.1665 7.6632 0OCSVM 0.6852 0.1815 9.5842 0OCC 0.5611 0.1439 11.0368 0
Table 5.5: Wilcoxon signed-rank test comparing the AUC results of HRFm+PBC4cipagainst the AUC results of the RUSBoost classifier, using all the tested databases.
Comparison R+ R− Hypothesis (α = 0.05) p-value
PBC4cip vs RUSBoost 2959.0 1601.0 Rejected 0.011546
Table 5.5 shows the results of the pairwise comparison between HRFm+PBC4cip
and RUSBoost; using the Wilcoxon signed-rank test, in the same way as in Table 5.3.

Chapter 5. Emerging pattern-based classifier for class imbalance problems 73
From this table, we can see that HRFm+PBC4cip significantly outperforms RUSBoost.
Then, based on tables 5.4 and 5.5, we can conclude that PBC4cip also is better than
other classifiers, not based on emerging patterns, designed for class imbalance problems.
5.3 Concluding remarks
In this chapter, we introduced a new emerging pattern-based classifier for class imbal-
ance problems. Our classifier (PBC4cip) addresses the class imbalance problem through
a strategy that combines the support of the patterns and the class imbalance level of the
dataset. From our experimental results, we can conclude that PBC4cip significantly
outperforms iCAEP, which is the only emerging pattern-based classifier reported in
the literature for class imbalance problems. PBC4cip significantly outperforms iCAEP
using both a conventional emerging pattern miner and emerging pattern miners de-
signed for class imbalance problems. Also, PBC4cip significantly outperforms other
state-of-the-art classifiers designed for class imbalance problems, which are not based
on emerging patterns. Finally, as far as we know, our proposal is the first emerging
pattern-based classifier specifically designed for class imbalance problems.

Chapter 6Conclusions
Emerging pattern-based classifiers have become an important family of supervised clas-
sifiers in the last years. However, in those problems where the objects are not equally
distributed into the classes (class imbalance problems), emerging pattern-based classifi-
ers, like other supervised classifiers, bias their classification results towards the majority
class; obtaining poor classification results for the minority class. In the literature, su-
pervised classification based on emerging patterns for class imbalance problems has not
been enough studied, for this reason in this thesis we addressed this research line.
In this research, we first investigated the effect of class imbalance over quality meas-
ures for patterns; this allowed us to select the best one for class imbalance problems.
One important issue for building an emerging pattern-based classifier is to extract
emerging patterns from a database. Currently, most algorithms for mining emerging
patterns have not been designed for class imbalance problems, and those designed for
this kind of problems obtain a set of emerging patterns which produce poor classific-
ation results. Hence, we proposed three emerging pattern mining algorithms for class
imbalance problems. Each proposal follows one of the main approaches reported in the
literature to deal with class imbalance problems, i.e., data level, algorithm level, and
cost-sensitive.
Finally, we proposed an emerging pattern-based classifier for class imbalance prob-
lems, which takes into account the class imbalance level of the training dataset for
classifying query objects.
The content of this chapter is organized as follows: Section 6.1 presents the con-
clusions of this PhD research, Section 6.2 shows the contributions of this research,
75

Chapter 6. Conclusions 76
Section 6.3 contains some directions for future work and finally, Section 6.4 lists the
publications derived from this PhD research.
6.1 Conclusions
Regarding our study about the effect of class imbalance on quality measures for patterns,
based on our experimental results, we can conclude that:
• Jacc is the best quality measure for ranking emerging patterns for supervised
classification in class imbalance problems.
• Quality measures perform differently depending on the class imbalance level. Our
study allowed determining what are the best quality measures for different class
imbalance levels (see Table 3.4).
Regarding our proposed emerging pattern miners, based on our experimental results,
we can conclude that:
• Into the data level approach, our proposal (SMOTE-TL+LCMine) allows obtain-
ing a set of emerging patterns which produce better classification results in class
imbalance problems than the best solution, at the data level, reported in the
literature for class imbalance problems.
• Into the algorithm level, our proposal for mining emerging patterns (HRFm)
extracts a set of emerging patterns which allows attaining better classification
results than other solutions reported in the literature for class imbalance problems.
• From comparing HRFm and SMOTE-TL+LCMIne, we have concluded that HRFm
is the best solution for mining emerging patterns in class imbalance problems with

Chapter 6. Conclusions 77
low or very high imbalance ratio (IR), while SMOTE-TL+LCMine is the best one
for those problems with medium IR (see Table 4.5).
• Our proposal into the cost-sensitive approach (CSEPm) obtains emerging patterns
that allow attaining significantly lower misclassification cost than those misclassi-
fication cost produced by using the emerging patterns mined by other well-known
emerging pattern miners, and the same classifier used in our proposed approach,
as base classifier for Metacost [Domingos, 1999].
Regarding our proposed emerging pattern-based classifier (PBC4cip), based on our
experimental results, we can conclude that:
• PBC4cip significantly outperforms iCAEP, the only emerging pattern-based clas-
sifier reported in the literature for solving class imbalance problems.
• PBC4cip significantly outperforms other state-of-the-art classifiers designed for
class imbalance problems, which are not based on emerging patterns.
6.2 Contributions
The contributions of this PhD research are the following:
• A study of quality measures for emerging patterns in class imbalance problems
that allows selecting the best quality measure for emerging patterns in this kind
of problems.
• A guide for determining which quality measures would have better behavior for
filtering emerging patterns regarding the class imbalance level of a dataset.

Chapter 6. Conclusions 78
• An emerging pattern miner (SMOTE-TL+LCMine), at the data level approach,
which obtains better emerging patterns for class imbalance problems than the
best emerging pattern miner, in this approach, reported in the literature.
• An emerging pattern miner for class imbalance problems (HRFm), at the al-
gorithm level approach, which to the best of our knowledge is the first emerging
pattern miner based on decision tree following this approach.
• An algorithm for mining emerging patterns based on cost matrices (CSEPm). As
far as we know, CSEPm is the first cost-sensitive emerging pattern miner.
• A new emerging pattern-based classifier designed to deal with class imbalance
problems (PBC4cip). As far as we know, PBC4cip is the first emerging pattern-
based classifier specifically designed for class imbalance problems.
6.3 Future work
The results obtained in this thesis open further studies on emerging pattern miners
and supervised classifiers based on emerging patterns for class imbalance problems. As
future work, we will consider the following:
• An interesting research line is to create fuzzy emerging pattern miners and fuzzy
emerging pattern-based classifiers for class imbalance problems. We suggest this
line because, in some domains, the fuzzy-based approach has reported better
classification results than the crisp-based approach. Also, as far as we know,
there are not algorithms reported for both fuzzy-emerging pattern miners and
fuzzy emerging pattern-based classifiers.
• Unlike univariate decision trees, multivariate decision trees are not restricted to
splits involving a single feature. Hence, an interesting alternative to explore is

Chapter 6. Conclusions 79
to extract emerging patterns, for class imbalance problems, from multivariate
decision trees. We suggest this line because, in some domains, multivariate de-
cision trees have reported better classification results than univariate decision
trees. Then, we have the hypothesis that emerging patterns extracted from mul-
tivariate decision trees could improve the classification results obtained regarding
those emerging patterns extracted from univariate decision trees. Also, as far as
we know, there are not algorithms reported for both mining emerging patterns
from multivariate decision trees and emerging pattern-based classifiers that use a
collection of emerging patterns extracted from multivariate decision trees.
6.4 Publications
The following publications were derived from this PhD research.
JCR Journals:
• O. Loyola-Gonzalez, MA. Medina-Perez, JF. Martınez-Trinidada, JA. Carrasco-Ochoa, R. Monroy, M. Garcıa-Borroto. PBC4cip: A New Contrast Pattern-basedClassifier for Class Imbalance Problems. Knowledge-Based Systems 115, pp. 100-109, 2017. [IF: 4.529, Q1]
• M. Garcıa-Borroto, O. Loyola-Gonzalez, JF. Martınez-Trinidada, JA. Carrasco-Ochoa. Evaluation of Quality Measures for Contrast Patterns by Using UnseenObjects. Expert Systems with Applications 83, pp. 104-113, 2017. [IF: 3.928, Q1]
• O. Loyola-Gonzalez, JF. Martınez-Trinidada, JA. Carrasco-Ochoa, M. Garcıa-Borroto. Effect of Class Imbalance on Quality Measures for Contrast Patterns:An Experimental Study. Information Science 374, pp. 179-192, 2016. [IF: 4.832,Q1]
• O. Loyola-Gonzalez, JF. Martınez-Trinidada, JA. Carrasco-Ochoa, M. Garcıa-Borroto. Study of the Impact of Resampling Methods for Contrast Pattern-basedClassifiers in Imbalanced Databases. Neurocomputing 175, pp. 935-947, 2016.[IF: 3.317, Q1]
• O. Loyola-Gonzalez, JF. Martınez-Trinidada, JA. Carrasco-Ochoa, M. Garcıa-Borroto. An Empirical Comparison among Quality Measures for Pattern-basedClassifiers. Intelligent Data Analysis 18, pp S5-S17, 2014. [IF: 0.772, Q4]

Chapter 6. Conclusions 80
Conference Proceedings:
• O. Loyola-Gonzalez, JF. Martınez-Trinidada, JA. Carrasco-Ochoa, M. Garcıa-Borroto. A Novel Contrast Pattern Selection Method for Class Imbalance Prob-lems. Lecture Notes in Computer Science 10267, pp. 42-52, 2017.
• O. Loyola-Gonzalez, JF. Martınez-Trinidada, JA. Carrasco-Ochoa, M. Garcıa-Borroto. Correlation of Resampling Methods for Contrast Pattern-based Classi-fiers. Lecture Notes in Computer Science 9116, pp. 93-102, 2015.
• M. Garcıa-Borroto, O. Loyola-Gonzalez, JF. Martınez-Trinidada, JA. Carrasco-Ochoa. Comparing Quality Measures for Contrast Pattern Classifiers. LectureNotes in Computer Science 8258, pp. 311-318, 2013.
• O. Loyola-Gonzalez, MA. Medina-Perez, JF. Martınez-Trinidada, JA. Carrasco-Ochoa, M. Garcıa-Borroto. An Empirical Study of Oversampling and Under-sampling Methods for LCMine an Emerging Pattern-based Classifier. LectureNotes in Computer Science 7914, pp. 264-273, 2013.
Technical Reports:
• O. Loyola-Gonzalez, JF. Martınez-Trinidada, M. Garcıa-Borroto. Supervised clas-sifiers based on Contrast Patterns for Class Imbalance Problems (Report No.CCC-14-004). Puebla, Mexico: Instituto Nacional de Astrofısica, Optica y Electronica,pp. 1-44, 2014.
Bibliography
Agrawal, R., Imielinski, T., and Swami, A. (1993). Mining association rules between sets ofitems in large databases. In Proceedings of the 1993 ACM SIGMOD International Confer-ence on Management of Data, SIGMOD ’93, pages 207–216, New York, NY, USA.
Aha, D. W., Kibler, D., and Albert, M. K. (1991). Instance-based learning algorithms.Machine Learning, 6(1):37–66.
Ahn, K.-I. and Kim, J.-Y. (2004). Efficient mining of frequent itemsets and a measure ofinterest for association rule mining. Journal of Information & Knowledge Management,03(03):245–257.
Al-shahib, A., Breitling, R., and Gilbert, D. (2005). Feature selection and the class imbalanceproblem in predicting protein function from sequence. Applied Bioinformatics, 4:195–203.
Albisua, I. n., Arbelaitz, O., Gurrutxaga, I., Lasarguren, A., Muguerza, J., and Perez, J.(2013). The quest for the optimal class distribution: an approach for enhancing the effect-iveness of learning via resampling methods for imbalanced data sets. Progress in ArtificialIntelligence, 2(1):45–63.
Alcala-Fdez, J., Fernandez, A., Luengo, J., Derrac, J., and Garcıa, S. (2011). KEEL Data-Mining Software Tool: Data Set Repository, Integration of Algorithms and ExperimentalAnalysis Framework. Journal of Multiple-Valued Logic and Soft Computing, 17(2-3):255–287.
Alcala-Fdez, J., Sanchez, L., Garcıa, S., del Jesus, M. J., Ventura, S., Garrell, J. M., Otero, J.,Romero, C., Bacardit, J., Rivas, V. M., Fernandez, J. C., and Herrera, F. (2009). KEEL: asoftware tool to assess evolutionary algorithms for data mining problems. Soft Computing,13(3):307–318.
Alhammady, H. (2007). A Novel Approach For Mining Emerging Patterns In Rare-ClassDatasets. In Sobh, T., editor, Innovations and Advanced Techniques in Computer andInformation Sciences and Engineering, pages 207–211. Springer Netherlands.
Alhammady, H. and Ramamohanarao, K. (2004a). The Application of Emerging Patterns forImproving the Quality of Rare-Class Classification. In Dai, H., Srikant, R., and Zhang, C.,editors, Advances in Knowledge Discovery and Data Mining, volume 3056 of Lecture Notesin Computer Science, pages 207–211. Springer Berlin Heidelberg.
81
Bibliography 82
Alhammady, H. and Ramamohanarao, K. (2004b). Using emerging patterns and decisiontrees in rare-class classification. In Fourth IEEE International Conference on Data Mining( ICDM ’04), pages 315–318.
Ali, K., Manganaris, S., and Srikant, R. (1997). Partial classification using association rules.In Heckerman, D., Mannila, H., Pregibon, D., and Uthurusamy, R., editors, Proceedings ofthe 3th International Conference on KDD (KDD’97), pages 115–118.
An, A. and Cercone, N. (1998). Elem2: A learning system for more accurate classifications.In Proceedings of the 12th Biennial Conference of the Canadian Society for ComputationalStudies of Intelligence on Advances in Artificial Intelligence, AI ’98, pages 426–441, London,UK, UK.
An, A. and Cercone, N. (2001). Rule quality measures for rule induction systems: Descriptionand evaluation. Computational Intelligence, 17(3):409–424.
Bahnsen, A. C., Aouada, D., and Ottersten, B. (2015). Example-dependent cost-sensitivedecision trees. Expert Systems with Applications, 42(19):6609–6619.
Bailey, J. (2012a). Statistical Measures for Contrast Patterns. In Dong, G. and Bailey, J.,editors, Contrast Data Mining: Concepts, Algorithms, and Applications, chapter 2, pages13–20. Chapman & Hall/CRC, United States of America.
Bailey, J. (2012b). Statistical Measures for Contrast Patterns. In Dong, G. and Bailey, J.,editors, Contrast Data Mining: Concepts, Algorithms, and Applications, Data Mining andKnowledge Discovery Series, chapter 2, pages 13–20. Chapman & Hall/CRC, United Statesof America.
Bailey, J., Manoukian, T., and Ramamohanarao, K. (2003). Classification using constrainedemerging patterns. In Dong, G., Tang, C., and Wang, W., editors, Advances in Web-AgeInformation Management: 4th International Conference, WAIM 2003, Chengdu, China,August 17-19, 2003. Proceedings, pages 226–237. Springer Berlin Heidelberg, Berlin, Heidel-berg.
Barrera-Animas, A. Y., Trejo, L. A., Medina-Prez, M. A., Monroy, R., Camia, J. B., andGodnez, F. (2017). Online personal risk detection based on behavioural and physiologicalpatterns. Information Sciences, 384:281 – 297.
Batista, G. E. A. P. A., Prati, R. C., and Monard, M. C. (2004). A Study of the Behavior ofSeveral Methods for Balancing Machine Learning Training Data. SIGKDD Explor. Newsl.,6(1):20–29.
Bay, S. D. and Pazzani, M. J. (1999). Detecting change in categorical data: mining contrastsets. In Proceedings of the fifth ACM SIGKDD international conference on Knowledgediscovery and data mining, KDD ’99, pages 302–306, New York, NY, USA.
Bayes, M. and Price, M. (1763). An essay towards solving a problem in the doctrine ofchances. by the late rev. mr. bayes, f. r. s. communicated by mr. price, in a letter to johncanton, a. m. f. r. s. Philosophical Transactions, 53:370–418.

Bibliography 83
Bergmann, B. and Hommel, G. (1988). Improvements of general multiple test procedures forredundant systems of hypotheses. In Bauer, P., Hommel, G., and Sonnemann, E., editors,Multiple Hypothesenprufung / Multiple Hypotheses Testing, pages 100–115. Springer BerlinHeidelberg, Berlin, Heidelberg.
Bertrand Cuissart Guillaume Poezevara, B. C. A. L. and Bureau, R. (2012). Emerging Pat-terns as Structural Alerts for Computational Toxicology. In Dong, G. and Bailey, J., editors,Contrast Data Mining: Concepts, Algorithms, and Applications, Data Mining and Know-ledge Discovery Series, chapter 19, pages 269–282. Chapman & Hall/CRC, United Statesof America.
Bouadjenek, M. R., Hacid, H., and Bouzeghoub, M. (2016). Social networks and informa-tion retrieval, how are they converging? a survey, a taxonomy and an analysis of socialinformation retrieval approaches and platforms. Information Systems, 56(0):1–18.
Bradley, A. P. (1997). The use of the area under the {ROC} curve in the evaluation of machinelearning algorithms. Pattern Recognition, 30(7):1145 – 1159.
Breiman, L. (1996). Bagging predictors. Machine Learning, 24(2):123–140.
Brin, S., Motwani, R., Ullman, J. D., and Tsur, S. (1997). Dynamic itemset counting andimplication rules for market basket data. In Proceedings of the ACM SIGMOD InternationalConference on Management of Data (SIGMOD ’97), SIGMOD ’97, pages 255–264, NewYork, NY, USA.
Bruha, I. and Kockova, S. (1993). Quality of decision rules: Empirical and statistical ap-proaches. Informatica (Slovenia), 17(3):233–243.
Camia, J. B., Monroy, R., Trejo, L. A., and Medina-Prez, M. A. (2016). Temporal and spatiallocality: An abstraction for masquerade detection. IEEE Transactions on InformationForensics and Security, 11(9):2036–2051.
Charte, F., Rivera, A., Jesus, M., and Herrera, F. (2013). A First Approach to Deal withImbalance in Multi-label Datasets. In Pan, J.-S., Polycarpou, M., Wozniak, M., Carvalho,A., Quintian, H., and Corchado, E., editors, Hybrid Artificial Intelligent Systems SE -16, volume 8073 of Lecture Notes in Computer Science, pages 150–160. Springer BerlinHeidelberg.
Charte, F., Rivera, A. J., del Jesus, M. J., and Herrera, F. (2015). Mlsmote: Approachingimbalanced multilabel learning through synthetic instance generation. Knowledge-BasedSystems, 89:385–397.
Chawla, N. V. (2010). Data Mining for Imbalanced Datasets: An Overview. In Maimon, O.and Rokach, L., editors, Data Mining and Knowledge Discovery Handbook, pages 875–886.Springer US.
Chawla, N. V., Bowyer, K. W., Hall, L. O., and Kegelmeyer, W. P. (2002). SMOTE :Synthetic Minority Over-sampling Technique. Journal of Artificial Intelligence Research,16(1):321–357.

Bibliography 84
Chawla, N. V., Lazarevic, A., Hall, L. O., and Bowyer, K. W. (2003). 7th european conferenceon principles and practice of knowledge discovery in databases (pkdd 2003). In Lavrac,N., Gamberger, D., Todorovski, L., and Blockeel, H., editors, SMOTEBoost: ImprovingPrediction of the Minority Class in Boosting, pages 107–119. Springer Berlin Heidelberg,Berlin, Heidelberg.
Chen, C. H. (2016). Handbook of Pattern Recognition and Computer Vision. World ScientificPublishing Co., Inc., River Edge, NJ, USA, 5th edition.
Chen, L. and Dong, G. (2012). Using Emerging Patterns in Outlier and Rare-Class Prediction.In Dong, G. and Bailey, J., editors, Contrast Data Mining: Concepts, Algorithms, andApplications, Data Mining and Knowledge Discovery Series, chapter 12, pages 171–186.Chapman & Hall/CRC, United States of America.
Chen, T.-T. and Lee, S.-J. (2015). A weighted ls-svm based learning system for time seriesforecasting. Information Sciences, 299(0):99–116.
Chen, X. and Chen, J. (2011). Emerging patterns and classification algorithms for dna se-quence. Journal of Software, 6(6):985–992.
Chen, X. and Liu, Z. (2016). Finding Contrast Patterns in Imbalanced Classification basedon Sliding Window. In Zhu, S. H., editor, Proceedings of the 4th International Conferenceon Mechanical Materials and Manufacturing Engineering (MMME 2016), volume 79 ofAdvances in Engineering Research, pages 161–166. Atlantis Press.
Church, K. W. and Hanks, P. (1990). Word association norms, mutual information, andlexicography. Computational Linguistics, 16(1):22–29.
Cieslak, D., Hoens, T., Chawla, N., and Kegelmeyer, W. (2012). Hellinger distance decisiontrees are robust and skew-insensitive. Data Mining and Knowledge Discovery, 24(1):136–158.
Cieslak, D. A. and Chawla, N. V. (2008). Learning decision trees for unbalanced data. InDaelemans, W., Goethals, B., and Morik, K., editors, Proceedings of the Machine Learningand Knowledge Discovery in Databases: European Conference (ECML PKDD 2008), pages241–256. Springer Berlin Heidelberg, Berlin, Heidelberg.
Cohen, G., Hilario, M., Sax, H., Hugonnet, S., and Geissbuhler, A. (2006). Learning fromimbalanced data in surveillance of nosocomial infection. Artificial Intelligence in Medicine,37:7–18.
Cortes, C. and Vapnik, V. (1995). Support-vector networks. Machine Learning, 20(3):273–297.
Demsar, J. (2006). Statistical Comparisons of Classifiers over Multiple Data Sets. Journal ofMachine Learning Research, 7:1–30.
Derrac, J., Garcıa, S., Molina, D., and Herrera, F. (2011). A practical tutorial on the useof nonparametric statistical tests as a methodology for comparing evolutionary and swarmintelligence algorithms. Swarm and Evolutionary Computation, 1(1):3–18.
Bibliography 85
Dıez-Pastor, J. F., Rodrıguez, J. J., Garcıa-Osorio, C., and Kuncheva, L. I. (2015). RandomBalance: Ensembles of variable priors classifiers for imbalanced data. Knowledge-BasedSystems, 85:96–111.
Domingos, P. (1999). MetaCost: a general method for making classifiers cost-sensitive. InProceedings of the fifth ACM SIGKDD international conference on Knowledge discoveryand data mining, pages 155–164, San Diego, California, United States. ACM.
Dong, G. (2012a). Overview of Results on Contrast Mining and Applications. In Dong, G.and Bailey, J., editors, Contrast Data Mining: Concepts, Algorithms, and Applications,Data Mining and Knowledge Discovery Series, chapter 25, pages 353–362. Chapman &Hall/CRC, United States of America.
Dong, G. (2012b). Preliminaries. In Dong, G. and Bailey, J., editors, Contrast Data Mining:Concepts, Algorithms, and Applications, Data Mining and Knowledge Discovery Series,chapter 1, pages 3–12. Chapman & Hall/CRC.
Dong, G. and Li, J. (1999). Efficient mining of emerging patterns: discovering trends and dif-ferences. In Proceedings of the fifth ACM SIGKDD international conference on Knowledgediscovery and data mining, KDD ’99, pages 43–52, New York, NY, USA. ACM.
Dong, G., Li, J., and Wong, L. (2004). The use of emerging patterns in the analysis of geneexpression profiles for the diagnosis and understanding of diseases. In New Generation ofData Mining Applications, chapter 14, pages 331–354. John Wiley.
Dong, G., Zhang, X., Wong, L., and Li, J. (1999). Caep: Classification by aggregating emer-ging patterns. In Arikawa, S. and Furukawa, K., editors, Proceedings of the Second Interna-tional Conference on Discovery Science (DS’99), pages 30–42. Springer Berlin Heidelberg,Berlin, Heidelberg.
Drummond, C. and Holte, R. C. (2006). Cost curves: An improved method for visualizingclassifier performance. Machine Learning, 65(1):95–130.
Du, J., Cai, Z., and Ling, C. (2007). Cost-Sensitive Decision Trees with Pre-pruning. InKobti, Z. and Wu, D., editors, Advances in Artificial Intelligence, volume 4509 of LectureNotes in Computer Science, pages 171–179. Springer Berlin / Heidelberg.
Esmeir, S. and Markovitch, S. (2008). Anytime induction of low-cost, low-error classifiers: asampling-based approach. Journal of Artificial Intelligence Research, 33(1):1–31.
Fan, H. and Kotagiri, R. (2002). An efficient single-scan algorithm for mining essential jumpingemerging patterns for classification. In Chen, M.-S., Yu, P. S., and Liu, B., editors, Advancesin Knowledge Discovery and Data Mining: Proceedings of the 6th Pacific-Asia Conference(PAKDD 2002), pages 456–462, Berlin, Heidelberg. Springer Berlin Heidelberg.
Fan, H. and Ramamohanarao, K. (2003). A bayesian approach to use emerging patterns forclassification. In Proceedings of the 14th Australasian Database Conference - Volume 17,ADC ’03, pages 39–48, Darlinghurst, Australia, Australia. Australian Computer Society,Inc.
Bibliography 86
Fan, H. and Ramamohanarao, K. (2006). Fast discovery and the generalization of strongjumping emerging patterns for building compact and accurate classifiers. Knowledge andData Engineering, IEEE Transactions on, 18(6):721–737.
Fan, J., Zhang, J., Mei, K., Peng, J., and Gao, L. (2015). Cost-sensitive learning of hierarchicaltree classifiers for large-scale image classification and novel category detection. PatternRecognition, 48(5):1673 – 1687.
Feng, H., Chen, Y., Zou, K., Liu, L., Zhu, Q., Ran, Z., Yao, L., Ji, L., and Liu, S. (2014). Anew rough set based classification rule generation algorithm(rga). In Ali, M., Pan, J.-S.,Chen, S.-M., and Horng, M.-F., editors, Proceedings of the 27th International Conferenceon Industrial Engineering and Other Applications of Applied Intelligent Systems, pages369–378, Cham. Springer International Publishing.
Feng, M. and Dong, G. (2012). Incremental Maintenance of Emerging Patterns. In Dong,G. and Bailey, J., editors, Contrast Data Mining: Concepts, Algorithms, and Applica-tions, Data Mining and Knowledge Discovery Series, chapter 7, pages 69–86. Chapman &Hall/CRC.
Fernandez, A., Garcıa, S., and Herrera, F. (2011). Addressing the Classification with Im-balanced Data: Open Problems and New Challenges on Class Distribution. In Corchado,E., Kurzynski, M., and Wozniak, M., editors, Hybrid Artificial Intelligent Systems, volume6678 of Lecture Notes in Computer Science, pages 1–10. Springer Berlin Heidelberg.
Finner, H. (1993). On a monotonicity problem in step-down multiple test procedures. Journalof the American Statistical Association, 88(423):920–923.
Frank, E. and Witten, I. H. (1998). Generating Accurate Rule Sets Without Global Optim-ization. In 15th International Coference on Machine Learning (ICML’98), Lecture Notesin Computer Science, pages 81–106. Springer International Publishing.
Freitas, A. (2011). Building cost-sensitive decision trees for medical applications. AI Com-munications, 24(3):285–287.
Freund, Y., Schapire, R. E., et al. (1996). Experiments with a new boosting algorithm. In13th International Conference on Machine Learning (ICML’96), volume 96, pages 148–156.
Friedman, M. (1937). The use of ranks to avoid the assumption of normality implicit in theanalysis of variance. Journal of the American Statistical Association, 32(200):675–701.
Friedman, M. (1940). A comparison of alternative tests of significance for the problem of mrankings. The Annals of Mathematical Statistics, 11(1):86–92.
Garcıa, S., Fernandez, A., Luengo, J., and Herrera, F. (2009). A study of statistical techniquesand performance measures for genetics-based machine learning: accuracy and interpretab-ility. Soft Computing, 13(10):959–977.
Garcıa, S., Fernandez, A., Luengo, J., and Herrera, F. (2010). Advanced nonparametric testsfor multiple comparisons in the design of experiments in computational intelligence anddata mining : Experimental analysis of power. Information Sciences, 180(10):2044–2064.

Bibliography 87
Garcıa, S. and Herrera, F. (2008). An Extension on ”Statistical Comparisons of Classifiers overMultiple Data Sets” for all Pairwise Comparisons. Journal of Machine Learning Research,9:2677–2694.
Garcıa-Borroto, M., Loyola-Gonzalez, O., Martınez-Trinidad, J., and Carrasco-Ochoa, J.(2013). Comparing Quality Measures for Contrast Pattern Classifiers. In Ruiz-Shulcloper,J. and Sanniti di Baja, G., editors, Progress in Pattern Recognition, Image Analysis, Com-puter Vision, and Applications SE - 39, volume 8258 of Lecture Notes in Computer Science,pages 311–318. Springer Berlin Heidelberg.
Garcıa-Borroto, M., Martınez-Trinidad, J., and Carrasco-Ochoa, J. (2010a). Cascading anEmerging Pattern Based Classifier. In Martınez-Trinidad, J., Carrasco-Ochoa, J., andKittler, J., editors, Advances in Pattern Recognition, volume 6256 of Lecture Notes inComputer Science, pages 240–249. Springer Berlin Heidelberg.
Garcıa-Borroto, M., Martınez-Trinidad, J., and Carrasco-Ochoa, J. (2014). A survey of emer-ging patterns for supervised classification. Artificial Intelligence Review, 42(4):705–721.
Garcıa-Borroto, M., Martınez-Trinidad, J. F., and Carrasco-Ochoa, J. A. (2015). Findingthe best diversity generation procedures for mining contrast patterns. Expert Systems withApplications, 42(11):4859–4866.
Garcıa-Borroto, M., Martınez-Trinidad, J. F., Carrasco-Ochoa, J. A., Medina-Perez, M. A.,and Ruiz-Shulcloper, J. (2010b). LCMine: An efficient algorithm for mining discriminativeregularities and its application in supervised classification. Pattern Recognition, 43(9):3025–3034.
Geng, L. and Hamilton, H. (2007). Choosing the right lens: Finding what is interesting indata mining. In Guillet, F. and Hamilton, H., editors, Quality Measures in Data Mining,volume 43 of Studies in Computational Intelligence, pages 3–24. Springer Berlin Heidelberg.
Geng, L. and Hamilton, H. J. (2006). Interestingness Measures for Data Mining: A Survey.ACM Comput. Surv., 38(3):1–32.
GhasemiGol, M., Ghaemi-Bafghi, A., and Takabi, H. (2016). A comprehensive approach fornetwork attack forecasting. Computers & Security, 58(0):83–105.
Gomes, J. P. P., Souza, A. H., Corona, F., and Neto, A. R. R. (2015). Proceedings of the22nd international conference on neural information processing (iconip 2015), part i. InArik, S., Huang, T., Lai, K. W., and Liu, Q., editors, A Cost Sensitive Minimal LearningMachine for Pattern Classification, pages 557–564. Springer International Publishing.
Good, J. (1965). The estimation of probabilities: An essay on modern bayesian methods.Technical report, The MIT Press.
Grabczewski, K. (2014). Techniques of Decision Tree Induction. In Meta-Learning in DecisionTree Induction, volume 498 of Studies in Computational Intelligence, pages 11–117. SpringerInternational Publishing.

Bibliography 88
Gras, R. (1996). L’implication statistique - Nouvelle methode exploratoire de donnees. LaPensee Sauvage Edition.
Guo, B. E., Liu, H. T., and Geng, C. (2014). Study on hybrid-weight for feature attribute innaive bayesian classifier. In Proceedings of the Fifth International Conference on IntelligentSystems Design and Engineering Applications, pages 958–962.
Hall, M., Frank, E., Holmes, G., Pfahringer, B., Reutemann, P., and Witten, I. H. (2009).The WEKA data mining software: an update. SIGKDD Explorations, 11(1):10–18.
Hamel, R., Liegeois, F., Wichit, S., Pompon, J., Diop, F., Talignani, L., Thomas, F., Despres,P., Yssel, H., and Misse, D. (2016). Zika virus: epidemiology, clinical features and host-virusinteractions. Microbes and Infection, 18(78):441–449.
Han, J., Cheng, H., Xin, D., and Yan, X. (2007). Frequent pattern mining: current statusand future directions. Data Mining and Knowledge Discovery, 15(1):55–86.
Hassanien, A. E., Al-Shammari, E. T., and Ghali, N. I. (2013). Computational intelligencetechniques in bioinformatics. Computational Biology and Chemistry, 47(0):37–47.
He, H. (2013). Introduction, chapter 1, pages 1–12. John Wiley & Sons, Inc.
He, H., Bai, Y., Garcia, E. A., and Li, S. (2008). ADASYN: Adaptive Synthetic SamplingApproach for Imbalanced Learning. In 2008 International Joint Conference on NeuralNetworks({IJCNN08}), pages 1322–1328.
He, H. and Garcia, E. A. (2009). Learning from imbalanced data. IEEE Transactions onKnowledge and Data Engineering, 21(9):1263–1284.
Hempstalk, K., Frank, E., and Witten, I. (2008). One-class classification by combining densityand class probability estimation. In Daelemans, W., Goethals, B., and Morik, K., editors,Machine Learning and Knowledge Discovery in Databases, volume 5211 of Lecture Notesin Computer Science, pages 505–519. Springer Berlin Heidelberg.
Hogo, M. A. (2014). Temporal analysis of intrusion detection. In International CarnahanConference on Security Technology (ICCST), pages 1–6.
Hong Cheng Jiawei Han, X. Y. and Yu, P. S. (2012). Efficient Direct Mining of SelectiveDiscriminative Patterns for Classification. In Dong, G. and Bailey, J., editors, Contrast DataMining: Concepts, Algorithms, and Applications, Data Mining and Knowledge DiscoverySeries, chapter 5, pages 39–58. Chapman & Hall/CRC, United States of America.
Huang, J. and Ling, C. X. (2005). Using AUC and accuracy in evaluating learning algorithms.Knowledge and Data Engineering, IEEE Transactions on, 17(3):299–310.
Huynh, X.-H., Guillet, F., Blanchard, J., Kuntz, P., Briand, H., and Gras, R. (2007). A graph-based clustering approach to evaluate interestingness measures: A tool and a comparativestudy. In Guillet, F. and Hamilton, H., editors, Quality Measures in Data Mining, volume 43of Studies in Computational Intelligence, pages 25–50. Springer Berlin Heidelberg.
Bibliography 89
Ibarguren, I., Perez, J. M., Muguerza, J., Gurrutxaga, I., and Arbelaitz, O. (2015). Coverage-based resampling: Building robust consolidated decision trees. Knowledge-Based Systems,79:51–67.
Jackowski, K., Krawczyk, B., and Wozniak, M. (2012). Cost-Sensitive Splitting and SelectionMethod for Medical Decision Support System. In Yin, H., Costa, J., and Barreto, G., edit-ors, Intelligent Data Engineering and Automated Learning - IDEAL 2012 SE - 101, volume7435 of Lecture Notes in Computer Science, pages 850–857. Springer Berlin Heidelberg.
Jacques, J., Taillard, J., Delerue, D., Jourdan, L., and Dhaenens, C. (2013). Moca-i: Dis-covering rules and guiding decision maker in the context of partial classification in largeand imbalanced datasets. In Nicosia, G. and Pardalos, P., editors, Proceedings of the 7thInternational Conference on Learning and Intelligent Optimization, pages 37–51, Berlin,Heidelberg. Springer Berlin Heidelberg.
Kang, S. and Ramamohanarao, K. (2014). A Robust Classifier for Imbalanced Datasets. InTseng, V., Ho, T., Zhou, Z.-H., Chen, A., and Kao, H.-Y., editors, Advances in KnowledgeDiscovery and Data Mining, volume 8443 of Lecture Notes in Computer Science, pages212–223. Springer International Publishing.
Keun Ho Ryu Dong Gyu Lee and Piao, M. (2012). Emerging Pattern Based Prediction ofHeart Diseases and Powerline Safety. In Dong, G. and Bailey, J., editors, Contrast DataMining: Concepts, Algorithms, and Applications, Data Mining and Knowledge DiscoverySeries, chapter 23, pages 329–336. Chapman & Hall/CRC, United States of America.
Khemchandani, R. and Sharma, S. (2016). Robust least squares twin support vector machinefor human activity recognition. Applied Soft Computing, 47:33–46.
Kim, J., Choi, K., Kim, G., and Suh, Y. (2012). Classification cost: An empirical comparisonamong traditional classifier, Cost-Sensitive Classifier, and MetaCost. Expert Systems withApplications, 39(4):4013–4019.
Klosgen, W. (1996). Explora: A multipattern and multistrategy discovery assistant. InFayyad, U. M., Piatetsky-Shapiro, G., Smyth, P., and Uthurusamy, R., editors, Advances inKnowledge Discovery and Data Mining, pages 249–271. American Association for ArtificialIntelligence, Menlo Park, CA, USA.
Kobylinski, L. and Walczak, K. (2012). Emerging Patterns and Classification for Spatialand Image Data. In Dong, G. and Bailey, J., editors, Contrast Data Mining: Concepts,Algorithms, and Applications, Data Mining and Knowledge Discovery Series, chapter 20,pages 285–302. Chapman & Hall/CRC, United States of America.
Kodratoff, Y. (2001). Comparing machine learning and knowledge discovery in databases:An application to knowledge discovery in texts. In Paliouras, G., Karkaletsis, V., andSpyropoulos, C., editors, Machine Learning and Its Applications, volume 2049 of LectureNotes in Computer Science, pages 1–21. Springer Berlin Heidelberg.
Konijn, R., Duivesteijn, W., Meeng, M., and Knobbe, A. (2014). Cost-based quality measuresin subgroup discovery. Journal of Intelligent Information Systems, 7867:1–19.

Bibliography 90
Krawczyk, B., Wozniak, M., and Schaefer, G. (2014). Cost-sensitive decision tree ensemblesfor effective imbalanced classification. Applied Soft Computing, 14, Part C(0):554–562.
Kretowski, M. and Grzes, M. (2006). Evolutionary Induction of Cost-Sensitive Decision Trees.In Esposito, F., Ras, Z., Malerba, D., and Semeraro, G., editors, Foundations of IntelligentSystems, volume 4203 of Lecture Notes in Computer Science, pages 121–126. Springer Berlin/ Heidelberg.
Kretowski, M. and Grzes, M. (2007). Evolutionary Induction of Decision Trees for Misclassi-fication Cost Minimization. In Beliczynski, B., Dzielinski, A., Iwanowski, M., and Ribeiro,B., editors, Adaptive and Natural Computing Algorithms, volume 4431 of Lecture Notes inComputer Science, pages 1–10. Springer Berlin / Heidelberg.
Lavrac, N., Flach, P., and Zupan, B. (1999). Rule evaluation measures: A unifying view. InDeroski, S. and Flach, P., editors, Inductive Logic Programming, volume 1634 of LectureNotes in Computer Science, pages 174–185. Springer Berlin Heidelberg.
Lavrac, N., Kavsek, B., Flach, P., and Todorovski, L. (2004). Subgroup discovery with cn2-sd.Journal of Machine Learning Research, 5:153–188.
Lenca, P., Lallich, S., Do, T.-N., and Pham, N.-K. (2008). A comparison of different off-centered entropies to deal with class imbalance for decision trees. In Proceedings of the12th Pacific-Asia conference on Advances in knowledge discovery and data mining, pages634–643. Springer-Verlag.
Lenca, P., Meyer, P., Vaillant, B., and Lallich, S. (2004). A multicriteria decision aid for inter-estingness measure selection. Technical report, LUSSI - Dept. Logique des Usages, SciencesSociales et de l’Information (Institut Mines-Telecom-Telecom Bretagne-UEB), Faculte desSciences, de la Technologie et de la Communication (Universite du Luxembourg), ERIC- Equipe de recherche en ingenierie des connaissances (Universite de Lyon 2). TechnicalReport LUSSI-TR-2004-01-EN.
Lenca, P., Vaillant, B., Meyer, P., and Lallich, S. (2007). Association rule interestingnessmeasures: Experimental and theoretical studies. In Guillet, F. and Hamilton, H., editors,Quality Measures in Data Mining, volume 43 of Studies in Computational Intelligence,pages 51–76. Springer Berlin Heidelberg.
Li, D.-C., Liu, C.-W., and Hu, S. C. (2010). A learning method for the class imbalanceproblem with medical data sets. Computers in Biology and Medicine, 40(5):509–518.
Li, J. and Wong, L. (2012). Emerging Pattern Based Rules Characterizing Subtypes of Leuk-emia. In Dong, G. and Bailey, J., editors, Contrast Data Mining: Concepts, Algorithms,and Applications, Data Mining and Knowledge Discovery Series, chapter 15, pages 219–232.Chapman & Hall/CRC.
Li, Y. and Zhang, X. (2011a). Improving k Nearest Neighbor with Exemplar Generalization forImbalanced Classification. In Huang, J. Z., Cao, L., and Srivastava, J., editors, Proceedingsof the 15th Pacific-Asia Conference on Advances in Knowledge Discovery and Data Mining(PAKDD 2011), Part II, pages 321–332. Springer Berlin Heidelberg, Berlin, Heidelberg.

Bibliography 91
Li, Y. and Zhang, X. (2011b). Improving k Nearest Neighbor with Exemplar Generalization forImbalanced Classification. In Huang, J. Z., Cao, L., and Srivastava, J., editors, Proceedingsof the 15th Pacific-Asia Conference on Advances in Knowledge Discovery and Data Mining(PAKDD 2011), Part II, pages 321–332. Springer Berlin Heidelberg, Berlin, Heidelberg.
Ling, C. X. and Sheng, V. S. (2010). Cost-Sensitive Learning. In Sammut, C. and Webb,G. I., editors, Encyclopedia of Machine Learning, pages 231–235. Springer US, Boston, MA.
Liu, B., Ma, Y., Wong, C., and Yu, P. (2003). Scoring the data using association rules. AppliedIntelligence, 18(2):119–135.
Liu, W. and Chawla, S. (2011a). Class Confidence Weighted k NN Algorithms for ImbalancedData Sets. In Proceedings of the 15th Pacific-Asia conference on Advances in knowledgediscovery and data mining - Volume Part II, pages 345–356, Berlin, Heidelberg. Springer-Verlag.
Liu, W. and Chawla, S. (2011b). Class confidence weighted knn algorithms for imbalanceddata sets. In Huang, J. Z., Cao, L., and Srivastava, J., editors, Proceedings of the 15thPacific-Asia Conference on Advances in Knowledge Discovery and Data Mining, pages345–356. Springer Berlin Heidelberg, Berlin, Heidelberg.
Liu, W., Chawla, S., Cieslak, D. A., and Chawla, N. V. (2010). A Robust Decision TreeAlgorithm for Imbalanced Data Sets. In Proceedings of the 2010 SIAM International Con-ference on Data Mining (SDM’10), pages 766–777. SIAM.
Lo, D., Cheng, H., Han, J., Khoo, S.-C., and Sun, C. (2009). Classification of softwarebehaviors for failure detection: A discriminative pattern mining approach. In Proceedingsof the 15th ACM SIGKDD International Conference on Knowledge Discovery and DataMining, KDD ’09, pages 557–566, New York, NY, USA.
Lomax, S. and Vadera, S. (2013). A Survey of Cost-sensitive Decision Tree Induction Al-gorithms. ACM Computing Surveys (CSUR), 45(2):16:1–16:35.
Lopez, V., Fernandez, A., Garcıa, S., Palade, V., and Herrera, F. (2013). An insight intoclassification with imbalanced data: Empirical results and current trends on using dataintrinsic characteristics. Information Sciences, 250(0):113–141.
Lopez, V., Fernandez, A., and Herrera, F. (2014a). On the importance of the validationtechnique for classification with imbalanced datasets: Addressing covariate shift when datais skewed. Information Sciences, 257(0):1–13.
Lopez, V., Fernandez, A., Moreno-Torres, J. G., and Herrera, F. (2012). Analysis of prepro-cessing vs. cost-sensitive learning for imbalanced classification. Open problems on intrinsicdata characteristics. Expert Systems with Applications, 39(7):6585–6608.
Lopez, V., Triguero, I., Carmona, C. J., Garcıa, S., and Herrera, F. (2014b). Addressingimbalanced classification with instance generation techniques: IPADE-ID. Neurocomputing,126(0):15–28.

Bibliography 92
Loyola-Gonzalez, O., Garcia-Borroto, M., Martınez-Trinidad, J. F., and Carrasco-Ochoa, J. A.(2014). An empirical comparison among quality measures for pattern based classifiers.Intelligent Data Analysis, 18(0):S5–S17.
Loyola-Gonzalez, O., Garcıa-Borroto, M., Medina-Perez, M. A., Martınez-Trinidad, J. F.,Carrasco-Ochoa, J. A., and Ita, G. (2013). An Empirical Study of Oversampling and Under-sampling Methods for LCMine an Emerging Pattern Based Classifier. In Carrasco-Ochoa,J. A., Martınez-Trinidad, J. F., Rodrıguez, J. S., and Baja, G. S., editors, Proceedings ofthe 5th Mexican Conference (MCPR 2013), volume 7914 of Lecture Notes in ComputerScience, pages 264–273. Springer Berlin Heidelberg.
Loyola-Gonzalez, O., Martınez-Trinidad, J. F., Carrasco-Ochoa, J. A., and Garcıa-Borroto,M. (2016a). Effect of class imbalance on quality measures for contrast patterns: An exper-imental study. Information Sciences, 374:179 – 192.
Loyola-Gonzalez, O., Martınez-Trinidad, J. F., Carrasco-Ochoa, J. A., and Garcıa-Borroto,M. (2016b). Study of the impact of resampling methods for contrast pattern based classifiersin imbalanced databases. Neurocomputing, 175(Part B):935–947.
Loyola-Gonzalez, O., Medina-Perez, M. A., Martınez-Trinidad, J. F., Carrasco-Ochoa, J. A.,Monroy, R., and Garcıa-Borroto, M. (2017). PBC4cip: A new contrast pattern-basedclassifier for class imbalance problems. Knowledge-Based Systems, 115:100–109.
Luengo, J., Fernandez, A., Garcıa, S., and Herrera, F. (2011). Addressing data complex-ity for imbalanced data sets: analysis of SMOTE-based oversampling and evolutionaryundersampling. Soft Computing, 15(10):1909–1936.
Manning, C. D., Raghavan, P., and Schutze, H. (2008). Introduction to information retrieval.Cambridge university press Cambridge, 1 edition.
Mao, S. and Dong, G. (2012). Discriminating Gene Transfer and Microarray ConcordanceAnalysis. In Dong, G. and Bailey, J., editors, Contrast Data Mining: Concepts, Algorithms,and Applications, Data Mining and Knowledge Discovery Series, chapter 16, pages 233–240.Chapman & Hall/CRC, United States of America.
McGarry, K. (2005). A survey of interestingness measures for knowledge discovery. Knowl.Eng. Rev., 1(3):39–61.
McGarry, K. and Malone, J. (2004). Analysis of rules discovered by the data mining process. InLotfi, A. and Garibaldi, J., editors, Applications and Science in Soft Computing, volume 24of Advances in Soft Computing, pages 219–224. Springer Berlin Heidelberg.
Medina-Perez, M. A., Monroy, R., Camina, J. B., and Garcıa-Borroto, M. (2017). Bagging-tpminer: a classifier ensemble for masquerader detection based on typical objects. SoftComputing, 21(3):557–569.
Menardi, G. and Torelli, N. (2014). Training and assessing classification rules with imbalanceddata. Data Mining and Knowledge Discovery, 28(1):92–122.
Bibliography 93
Michalski, R. S. and Stepp, R. (1982). Revealing conceptual structure in data by inductiveinference. Machine Intelligence, 10:173–196.
Min, F. and Zhu, W. (2012). A Competition Strategy to Cost-Sensitive Decision Trees. InLi, T., Nguyen, H., Wang, G., Grzymala-Busse, J., Janicki, R., Hassanien, A., and Yu, H.,editors, Rough Sets and Knowledge Technology SE - 45, volume 7414 of Lecture Notes inComputer Science, pages 359–368. Springer Berlin Heidelberg.
M.N, A. K. and Sheshadri, H. S. (2012). On the Classification of Imbalanced Datasets.International Journal of Computer Applications, 44(8):1–7.
Moreno-Torres, J. G., Saez, J. A., and Herrera, F. (2012). Study on the Impact of Partition-Induced Dataset Shift on k-Fold Cross-Validation. IEEE Transactions on Neural Networksand Learning Systems, 23(8):1304–1312.
Mulay, P. and Puri, K. (2016). Hawk eye: Intelligent analysis of socio inspired cohorts forplagiarism. In Snasel, V., Abraham, A., Kromer, P., Pant, M., and Muda, A. K., editors,Proceedings of the 6th International Conference on Innovations in Bio-Inspired Computingand Applications (IBICA 2015), pages 29–42, Cham. Springer International Publishing.
Napierala, K., Stefanowski, J., and Wilk, S. (2010). Learning from Imbalanced Data inPresence of Noisy and Borderline Examples. In 7th International Conference on RoughSets and Current Trends in Computing({RSCTC2010}), pages 158–167.
Novak, P. K., Lavrac, N., and Webb, G. I. (2009). Supervised Descriptive Rule Discovery:A Unifying Survey of Contrast Set, Emerging Pattern and Subgroup Mining. Journal ofMachine Learning Research, 10:377–403.
Onofri, L., Soda, P., Pechenizkiy, M., and Iannello, G. (2016). A survey on using domain andcontextual knowledge for human activity recognition in video streams. Expert Systems withApplications, 63(0):97–111.
Orriols-Puig, A. and Bernado-Mansilla, E. (2009). Evolutionary rule-based systems for im-balanced data sets. Soft Computing, 13(3):213–225.
Padmanabhan, B. and Tuzhilin, A. (2002). Knowledge refinement based on the discovery ofunexpected patterns in data mining. Decis. Support Syst., 33(3):309–321.
Palacios, A., Trawinski, K., Cordon, O., and Sanchez, L. (2014). Cost-Sensitive Learning ofFuzzy Rules for Imbalanced Classification Problems Using FURIA. International Journalof Uncertainty, Fuzziness and Knowledge-Based Systems, 22(05):643–675.
Pearson, K. (1896). Mathematical contributions to the theory of evolution. III. Regression,heredity, and panmixia. Philosophical Transactions of the Royal Society of London. SeriesA, 187:253–318.
Perez, J. M., Muguerza, J., Arbelaitz, O., Gurrutxaga, I., and Martın, J. I. (2007). Combiningmultiple class distribution modified subsamples in a single tree. Pattern Recognition Letters,28(4):414–422.
Bibliography 94
Piatetsky-Shapiro, G. (1991). Discovery, analysis, and presentation of strong rules. InPiatetsky-Shapiro, G. and Frawley, W., editors, Knowledge Discovery in Databases, pages229–238. AAAI/MIT Press, Cambridge, MA.
Piatetsky-Shapiro, G. and Steingold, S. (2000). Measuring lift quality in database marketing.ACM SIGKDD Explorations Newsletter, 2(2):76–80.
Quinlan, J. R. (1993). C4.5: programs for machine learning. Morgan Kaufmann PublishersInc.
Ramamohanarao, K. and Fan, H. (2007). Patterns based classifiers. World Wide Web,10(1):71–83.
Ramentol, E., Caballero, Y., Bello, R., and Herrera, F. (2011). SMOTE-RSB*: A HybridPreprocessing Approach based on Oversampling and Undersampling for High ImbalancedData-Sets using SMOTE and Rough Sets Theory. Knowledge and Information Systems,33(2):245–265.
Rodda, S. (2011). A Normalized Measure for Estimating Classification Rules for Multi-Class Imbalanced Datasets. International Journal of Engineering Science and Technology,3(4):3216–3220.
Rodrguez, J., Barrera-Animas, A. Y., Trejo, L. A., Medina-Prez, M. A., and Monroy, R.(2016). Ensemble of one-class classifiers for personal risk detection based on wearablesensor data. Sensors, 16(10).
Rodrıguez, J., Canete, L., Monroy, R., and Medina-Perez, M. A. (2016). Experimenting withmasquerade detection via user task usage. International Journal on Interactive Design andManufacturing (IJIDeM).
Rokach, L. and Maimon, O. (2014). Pruning Trees. In Bunke, H. and Wang, P. S. P., editors,Data mining with decision trees: theory and applications, volume 81 of Series in MachinePerception and Artificial Intelligence, chapter 6, pages 69–75. World Scientific, Singapore,2nd edition.
S. Kullback, R. A. L. (1951). On information and sufficiency. The Annals of MathematicalStatistics, 22(1):79–86.
Saez, J. A., Luengo, J., Stefanowski, J., and Herrera, F. (2015). SMOTEIPF: Addressingthe noisy and borderline examples problem in imbalanced classification by a re-samplingmethod with filtering. Information Sciences, 291(0):184–203.
Scholkopf, B., Platt, J. C., Shawe-Taylor, J. C., Smola, A. J., and Williamson, R. C.(2001). Estimating the support of a high-dimensional distribution. Neural Computation,13(7):1443–1471.
Sebag, M. and Schoenauer, M. (1988). Generation of rules with certainty and confidencefactors from incomplete and incoherent learning bases. In Gaines, B. R., Boose, J. H.,and Linster, M., editors, Proceedings of the European Knowledge Acquisition Workshop(EKAW’88), pages 28.1–28.20.

Bibliography 95
Seiffert, C., Khoshgoftaar, T. M., Van Hulse, J., and Napolitano, A. (2010). RUSBoost: AHybrid Approach to Alleviating Class Imbalance. Systems, Man and Cybernetics, Part A:Systems and Humans, IEEE Transactions on, 40(1):185–197.
Sheng, S., Ling, C., and Yang, Q. (2005). Simple Test Strategies for Cost-Sensitive DecisionTrees. In Gama, J., Camacho, R., Brazdil, P., Jorge, A., and Torgo, L., editors, MachineLearning: ECML 2005, volume 3720 of Lecture Notes in Computer Science, pages 365–376.Springer Berlin / Heidelberg.
Sheskin, D. J. (2007). Handbook of Parametric and Nonparametric Statistical Procedures.Chapman & Hall/CRC, 4 edition.
Soda, P. (2011). A multi-objective optimisation approach for class imbalance learning. PatternRecognition, 44(8):1801–1810.
Song, W., Liang, J. Z., Cao, X. L., and Park, S. C. (2014). An effective query recommendationapproach using semantic strategies for intelligent information retrieval. Expert Systems withApplications, 41(2):366–372.
Su, C., Ju, S., Liu, Y., and Yu, Z. (2015a). Improving PART algorithm with KL divergencefor imbalanced classification. Intelligent Data Analysis, 19(5):1035–1048.
Su, C., Ju, S., Liu, Y., and Yu, Z. (2015b). Improving Random Forest and Rotation Forestfor highly imbalanced datasets. Intelligent Data Analysis, 19(6):1409–1432.
Sun, Y., Kamel, M. S., Wong, A. K., and Wang, Y. (2007). Cost-sensitive boosting forclassification of imbalanced data. Pattern Recognition, 40(12):3358–3378.
Szathmary, L., Napoli, A., and Valtchev, P. (2007). Towards Rare Itemset Mining. In Toolswith Artificial Intelligence, 2007. ICTAI 2007. 19th IEEE International Conference on,volume 1, pages 305–312.
Tan, P.-N., Kumar, V., and Srivastava, J. (2002). Selecting the right interestingness measurefor association patterns. In Proceedings of the Eighth ACM SIGKDD International Con-ference on Knowledge Discovery and Data Mining, KDD ’02, pages 32–41, New York, NY,USA.
Tan, P.-N., Kumar, V., and Srivastava, J. (2004). Selecting the right objective measure forassociation analysis. Information Systems, 29(4):293–313.
Tang, F. M. (2001). Sequence classification and melody tracks selection. Master’s thesis, TheUniversity of Hong Kong (Pokfulam, Hong Kong).
Tang, S. and Chen, S. (2008). The Generation Mechanism of Synthetic Minority Class Ex-amples. In 5th International Conference on Information Technology and Applications inBiomedicine({ITAB 2008}), pages 444–447.
Tsai, C.-h., Chang, L.-c., and Chiang, H.-c. (2009). Forecasting of ozone episode days by cost-sensitive neural network methods. Science of The Total Environment, 407(6):2124–2135.

Bibliography 96
Tzanis, G., Kavakiotis, I., and Vlahavas, I. (2011). PolyA-iEP: A data mining method for theeffective prediction of polyadenylation sites. Expert Systems with Applications, 38(10):12398– 12408.
Tzanis, G., Kavakiotis, I., and Vlahavas, L. (2008). Polyadenylation site prediction usinginteresting emerging patterns. In 8th IEEE International Conference on BioInformaticsand BioEngineering (BIBE), pages 1–7.
Upton, G. J. G. (1992). Fisher’s exact test. Journal of the Royal Statistical Society. Series A(Statistics in Society), 155(3):395–402.
Verhein, F. and Chawla, S. (2006). Geometrically inspired itemset mining. In Sixth Interna-tional Conference on Data Mining (ICDM’06), pages 655–666.
Verhein, F. and Chawla, S. (2007). Using Significant, Positively Associated and RelativelyClass Correlated Rules for Associative Classification of Imbalanced Datasets. In Proceedingsof the 7th IEEE International Conference on Data Mining (ICDM 2007), pages 679–684.IEEE.
Wang, L., Zhao, H., Dong, G., and Li, J. (2004). On the complexity of finding emergingpatterns. In Computer Software and Applications Conference, 2004. COMPSAC 2004.Proceedings of the 28th Annual International, volume 2, pages 126–129 vol.2.
Webb, G. I. and Zhang, S. (2005). K-optimal rule discovery. Data Mining and KnowledgeDiscovery, 10(1):39–79.
Wei, W., Li, J., Cao, L., Ou, Y., and Chen, J. (2013). Effective detection of sophisticatedonline banking fraud on extremely imbalanced data. World Wide Web, 16(4):449–475.
Weiss, G. (2010a). Mining with Rare Cases. In Maimon, O. and Rokach, L., editors, DataMining and Knowledge Discovery Handbook, chapter 38, pages 747–757. Springer US.
Weiss, G., McCarthy, K., and Zabar, B. (2007). Cost-Sensitive Learning vs. Sampling: Whichis Best for Handling Unbalanced Classes with Unequal Error Costs? In Stahlbock, R.,Crone, S. F., and Lessmann, S., editors, DMIN, pages 35–41. CSREA Press.
Weiss, G. M. (2004). Mining with Rarity: A Unifying Framework. SIGKDD Explor. Newsl.,6(1):7–19.
Weiss, G. M. (2010b). The Impact of Small Disjuncts on Classifier Learning. In Stahlbock, R.,Crone, S. F., and Lessmann, S., editors, Data Mining, volume 8 of Annals of InformationSystems, pages 193–226. Springer US.
Weiss, G. M. and Tian, Y. (2008). Maximizing classifier utility when there are data acquisitionand modeling costs. Data Mining and Knowledge Discovery, 17(2):253–282.
Wu, D., Wang, Z., Chen, Y., and Zhao, H. (2016). Mixed-kernel based weighted extremelearning machine for inertial sensor based human activity recognition with imbalanceddataset. Neurocomputing, 190(0):35–49.
Bibliography 97
Wu, M.-S. (2015). Modeling query-document dependencies with topic language models forinformation retrieval. Information Sciences, 312(0):1–12.
Wu, Q., Ye, Y., Zhang, H., Ng, M. K., and Ho, S.-S. (2014). Forestexter: An efficient randomforest algorithm for imbalanced text categorization. Knowledge-Based Systems, 67:105 –116.
Yang, P., Shan, S., Gao, W., Li, S. Z., and Zhang, D. (2004). Face recognition using Ada-Boosted Gabor features. In Proceedings Sixth IEEE International Conference on AutomaticFace and Gesture Recognition, pages 356–361.
Yen, S. and Lee, Y. (2006). Under-sampling approaches for improving prediction of theminority class in an imbalanced dataset. In International Conference on Intelligent Com-puting({ICIC06}), pages 731–740.
Yijing, L., Haixiang, G., Xiao, L., Yanan, L., and Jinling, L. (2016). Adapted ensemble clas-sification algorithm based on multiple classifier system and feature selection for classifyingmulti-class imbalanced data. Knowledge-Based Systems, 94:88 – 104.
Yin, X. and Han, J. (2003). Cpar: Classification based on predictive association rules. In Bar-bar, D. and Kamath, C., editors, Proceedings of the 2003 SIAM International Conferenceon Data Mining, pages 331–335.
Yoon, K. and Kwek, S. (2005). An unsupervised learning approach to resolving the data im-balanced issue in supervised learning problems in functional genomics. In 5th InternationalConference on Hybrid Intelligent Systems({HIS05}), pages 303–308.
Yu, K., Ding, W., Simovici, D. A., and Wu, X. (2012). Mining Emerging Patterns by Stream-ing Feature Selection. In Proceedings of the 18th ACM SIGKDD International Conferenceon Knowledge Discovery and Data Mining, KDD ’12, pages 60–68, New York, NY, USA.ACM.
Zhang, S., Zhu, X., Zhang, J., and Zhang, C. (2007). Cost-Time Sensitive Decision Tree withMissing Values. In Zhang, Z. and Siekmann, J., editors, Knowledge Science, Engineeringand Management, volume 4798 of Lecture Notes in Computer Science, pages 447–459.Springer Berlin / Heidelberg.
Zhang, T. (2000). Association rules. In Terano, T., Liu, H., and Chen, A., editors, KnowledgeDiscovery and Data Mining. Current Issues and New Applications, volume 1805 of LectureNotes in Computer Science, pages 245–256. Springer Berlin Heidelberg.
Zhang, X. and Dong, G. (2012). Overview and Analysis of Contrast Pattern Based Classific-ation. In Dong, G. and Bailey, J., editors, Contrast Data Mining: Concepts, Algorithms,and Applications, Data Mining and Knowledge Discovery Series, chapter 11, pages 151–170.Chapman & Hall/CRC, United States of America.
Zhang, X., Dong, G., and Kotagiri, R. (2000a). Exploring constraints to efficiently mineemerging patterns from large high-dimensional datasets. In Proceedings of the Sixth ACMSIGKDD International Conference on Knowledge Discovery and Data Mining, KDD ’00,pages 310–314, New York, NY, USA. ACM.
Bibliography 98
Zhang, X., Dong, G., and Ramamohanarao, K. (2000b). Information-Based Classification byAggregating Emerging Patterns. In Leung, K., Chan, L.-W., and Meng, H., editors, Intel-ligent Data Engineering and Automated Learning IDEAL 2000. Data Mining, FinancialEngineering, and Intelligent Agents, volume 1983 of Lecture Notes in Computer Science,pages 48–53. Springer Berlin Heidelberg.
Zhang, X., Li, Y., Kotagiri, R., Wu, L., Tari, Z., and Cheriet, M. (2017). KRNN: k Rare-classNearest Neighbour classification. Pattern Recognition, 62:33–44.
Zhao, X.-M., Ngom, A., and Hao, J.-K. (2014). Pattern recognition in bioinformatics. Neuro-computing, 145(0):1–2.

Appendix AStatistical tests
This appendix presents a brief description of the statistical tests used throughout this
PhD thesis, which have been commonly used in the literature for comparing classifica-
tion results [Demsar, 2006; Garcıa and Herrera, 2008; Garcıa et al., 2010; Derrac et al.,
2011]. In this thesis, all statistical tests were performed using the KEEL data mining
tool [Alcala-Fdez et al., 2009]. In order to provide a better flow for the readers, we
split the content of this appendix as follows: Section A.1 describes the statistical test
used for comparing the classification results between two classifiers. After, Section A.2
presents the nonparametric statistical procedure for comparing the classification results
among more than two classifiers. Finally, Section A.3 describes the post-hoc procedures
used in our experiments for determining which classifiers obtain significantly better or
worse results among all the classifiers under comparison.
A.1 Wilcoxon signed-rank test
Several authors consider the Wilcoxon signed-rank test as a safe and robust nonparamet-
ric test for pairwise statistical comparisons between the classification results provided
by two supervised classifiers [Demsar, 2006; Garcıa and Herrera, 2008; Garcıa et al.,
2010; Derrac et al., 2011]. This test does not assume normal distributions, and outliers
(exceptionally good/bad performances on a few databases) have less effect on the Wil-
coxon signed-rank test than other on pairwise statistical tests as t-test [Derrac et al.,
2011]. We used the Wilcoxon signed-rank test, in Chapter 4 and Chapter 5, to verify
whether the results obtained by our proposal are statistically better than the results
99
Appendix A. Statistical tests 100
obtained by other proposal reported in the literature.
In the context of supervised classification, the Wilcoxon signed-rank test aims to
determine whether or not there is a statistically significant difference between the results
reached by two supervised classifiers, when applied over several databases. For that, for
each database i, the difference di between the classification results of the two compared
classifiers is computed. After, the differences are ranked according to their absolute
rank(di); where rank 1 is assigned for the lowest difference di, rank i for the highest
difference di, and average ranks are assigned in case of ties di = 0. Finally, the sum
of ranks for the databases in which the first algorithm outperformed the second one
(R+) and the sum of ranks for the opposite (R−) are computed using the following
expression:
R+ =∑di>0
rank(di) +1
2
∑di=0
rank(di)
R− =∑di<0
rank(di) +1
2
∑di=0
rank(di)
(A.1)
Finally, if the value of min(R+, R−) is less than or equal to a certain value (see
Table A5 in [Sheskin, 2007], containing the critical values of the Wilcoxon signed-ranks
test) then, it means that, an algorithm statistically outperforms the other one according
to the associated p-value. The p-value provides information about how significant the
statistical result is: the smaller the p-value, the more significant the statistical results
[Derrac et al., 2011]. According to Garcıa and Herrera [2008], the p-value is computed
through normal approximations by using a normal distribution table (see Table A1 in
[Sheskin, 2007]).

Appendix A. Statistical tests 101
A.2 Friedman test
Friedman’s test [Friedman, 1937, 1940] is a non-parametric test, equivalent to the
repeated-measures ANOVA (Analysis of Variance), with the aim of detecting signi-
ficant differences among the classification results provided by more than two classifiers
[Demsar, 2006; Derrac et al., 2011].
We used the Friedman’s test for creating a ranking among our proposals, (in Sec-
tion 4.1, Section 4.2, Section 4.3, and Section 5.1), and the other algorithms reported
in the literature.
For calculating the Friedman’s test the first step is to convert the original results to
ranks as follows:
1. Gather all the classification results for each classifier j in each database i.
2. For each database, rank the result of the classifiers from 1 (for the best result)
to k (for the worst result), denoted as rji with 1 ≤ j ≤ k being k the number of
compared classifiers. For ties an average is computed, i.e., if two classifiers have
the same rank value for a specific database (e.g. 1), then a rank value of 1.5 for
both classifiers will be assigned.
3. For each classifier, compute the average of the ranks obtained in all databases as
follows: Rj =1n
∑i r
ji , being n the total number of tested databases.
Following these steps, the classifier with the best classification result should have
the smallest rank value, the second best one should have the second best average rank
value, and so on.
Finally, the Friedman’s test is computed by using Equation A.2, which is distributed
Appendix A. Statistical tests 102
according to a X2 distribution [Derrac et al., 2011].
F =12n
k(k + 1)
[∑j
R2j −
k(k + 1)2
4
](A.2)
The Friedman’s test only reveals whether or not there are significant statistical
differences among the compared classifiers. However, the Friedman’s test is not able
to determine which classifiers have statistical differences among them. Hence, in or-
der to determine which classifiers have statistical differences among them, a post-hoc
procedure is needed.
A.3 Post-hoc procedures
Commonly, once the Friedman’s test determined that there are statistical differences
among the classification results of the compared classifiers, a post-hoc procedure is
executed [Garcıa et al., 2010; Derrac et al., 2011]. A post-hoc procedure aims to find
those pairwise comparisons which produce statistically significant differences.
To statistically validate a study among the classification results provided by more
than two classifiers, a statistical test for evaluating all possible pairwise comparisons
among these results should be executed. For this, the Bergmann-Hommel’s procedure
[Bergmann and Hommel, 1988] is suggested by several authors [Garcıa and Herrera,
2008; Garcıa et al., 2010; Derrac et al., 2011].
The Bergmann-Hommel’s procedure is based on the idea of finding a set of hy-
potheses H which cannot be rejected. For doing this, first, all possible hypotheses
about pairwise comparisons, according to the k evaluated classifiers, C1, · · · , Ck are
considered. Each Hi corresponds to a hypothesis: the classifier Cs statistically has the
same behavior as the classifier Cr; s, r = 1, · · · , k. Clearly, there arem = (k · (k − 1)) /2
different hypotheses. According to [Derrac et al., 2011] the p-value (pj) is not suitable

Appendix A. Statistical tests 103
for post-hoc procedures; therefore, for each hypothesis Hi, they propose computing an
adjusted p-value (APVi) as APVi = min {vi, 1}, where
vi = maxI is exhaustive and i ∈ I
{|I| ·min {pj, j ∈ I}}
where I ⊆ {1, . . . ,m} is called exhaustive if exactly all Hi, i ∈ I, could be true; i.e.,
for all i = 1, · · · ,m : Hi is true iff i ∈ I. An algorithm for obtaining all exhaustive sets
is provided by Derrac et al. [2011]. The Bergmann-Hommel’s procedure rejects all Hi
such that i /∈ A, where A is computed as:
A =∪{I : I is exhaustive and min {APVi : i ∈ I} > α/ |I|}
where α is a significance level provided by the user.
We used the Bergmann-Hommel’s procedure in our study about quality measures
for patterns (see Section 3.2) with the aim of knowing which quality measures are stat-
istically similar among them. Also, we used this procedure in Section 4.1 for knowing
which resampling methods, for balancing classes before mining emerging patterns, are
statistically similar among them.
To statistically validate the results obtained by a new classifier proposed by us and
the results obtained by other classifiers reported in the literature, a test of multiple
comparisons with a control classifier should be executed. According to Derrac et al.
[2011], the Finner’s procedure, proposed by Finner [1993], shows the best behavior for
this type of comparison.
The Finner’s procedure considers all possible hypotheses about pairwise comparisons
of a classifier C1 and the remaining ones C2, . . . , Ck. Here, each Hi corresponds to a
hypothesis: C1 statistically has the same behavior as Cr, for (r = 2, . . . , k). Thus,
for k classifiers to be evaluated, there are m = k − 1 different hypotheses. Then,
the hypotheses are sorted according the p-value (pj) of the corresponding pairwise
Appendix A. Statistical tests 104
comparison. The Finner’s procedure rejects the hypotheses H1 to Hi−1 if i is the
smallest integer so that APVi > 1 − (1 − α)(m−1)/i. Where α is a significance level
provided by the user and APVi is the adjusted p-value computed for each hypothesis
Hi as: APVi = min {vi, 1}; where vi = max{1− (1− pj)
(m−1)/j : 1 ≤ j ≤ i}.
We used the Finner’s procedure (in Section 4.2, Section 4.3, and Section 5.1) in
order to compare our proposal versus other proposals reported in the literature.