supervision and alll - booth school of...
TRANSCRIPT

ACCOUNTING WORKSHOP
“Is Bank Supervision Effective? Evidence from the Allowance for Loan and Lease Losses”
By
Ling Yang* University of Chicago Booth School of Business
Thursday, Dec. 8th, 2016 1:20 – 2:50 p.m.
Room C06 *Speaker Paper Available in Room 447

Is Bank Supervision Effective? Evidence from the Allowance for Loan and Lease Losses
Ling Yang1
University of Chicago, Booth School of Business
Abstract
I investigate whether bank supervision is effective to enforce written rules on the estimations of the allowance for loan and lease losses (ALLL) consistently between public and private banks, which have different intensity of incentives to misreport the ALLL. Results suggest that bank supervision of the ALLL estimations is effective between 2002 and 2012, but has become lax recently. State-chartered public banks underestimate the ALLL by about 13% annually between 2013 and 2015. Bank regulators are willing to cater to banks’ private interests when the economic environment is good and the regulatory emphasis is weak, but not during the crisis.
December 1, 2016
1 Email: [email protected]. I thank Ray Ball and João Granja for insightful discussions and feedback. I also appreciate invaluable comments from Christian Leuz on an early idea.

2
1 Introduction
Is bank supervision effective to ensure that banks comply with written regulations2?
Since the 2008 financial crisis, effective bank supervision is no longer a priori. Lax
supervisory practices exist beforehand and are blamed for several high-profiled bank
failures during the crisis. Recently, weaknesses in the institutional design of bank
supervision also surface (Agarwal et al. 2014; Rezende 2014), casting doubt on the
effectiveness of bank supervision.
Whether bank supervision is effective is a fundamental inquiry, but it has received
limited attention in the literature. As a result, we know little about whether supervisory
laxity is a widespread phenomenon, whether it is affected by the institutional design
weaknesses, and whether it varies over time. The shortage of empirical evidence is due to
several research design limitations. First, because bank supervision is shrouded in secrecy,
data on the supervisory processes are inaccessible to outsiders. In addition, written bank
regulations are numerous. No variable can summarize a bank’s compliance with all
regulations. Even for a single regulation, no benchmark exists to evaluate banks’
compliance individually.
To circumvent these research design limitations, I raise a testable prediction that can
yield relevant inference to the open question: If bank supervision is effective, it will achieve
consistent regulatory reporting across banks that have different intensity of incentives to
misreport. Specifically, I test whether bank supervision can result in consistent estimations
of the allowance for loan and lease losses (ALLL) between public and private banks.
2 The definitions of bank regulation and supervision in this paper follow the Federal Reserve’s: Bank regulation refers to “the written rules that define acceptable behavior and conduct for financial institutions.” Bank supervision refers to “the enforcement of these rules.” (https://www.stlouisfed.org/in-plain-english/introduction-to-supervision-and-regulation.)

3
The ALLL is one of the most common and important targets of bank supervision. It
covers estimated credit losses in a bank’s loan and lease (hereafter “loan”) portfolio. All
domestic banks with lending activities must follow written regulatory guidance to estimate
the ALLL and document the estimation methodology for bank examiners’ regular review.
The bank examiners make the final determination on whether the level of the ALLL is
appropriate. Therefore, the reported ALLL is a direct and observable outcome of bank
supervision.
Public and private banks have different intensity of incentives to misreport the ALLL.
Allocations to the ALLL via loan loss provisioning reduce banks’ current-period earnings
and the impact of provisioning on earnings is pro-cyclical. During a credit expansion, when
bank profits are high, banks have few problems collecting loan payments from borrowers.
The level of the estimated ALLL is low and the allocation of net interest income to the
ALLL is small. However, in an economic downturn, when bank profits are already under
pressure, the level of the estimated ALLL also increases and the proportion of net interest
income allocated to the ALLL is large. As a result, when bank profitability is high, banks
have incentives to overestimate the ALLL to smooth out the cyclical impact of loan loss
provisioning on earnings (Kanagaretnam et al. 2004; Liu and Ryan 2006). When bank
profitability is low, banks have incentives to underestimate the ALLL to preserve earnings
and minimize the negative impact of earnings declines on equity capital (Huizinga and
Laeven 2012). Because periodic performance measures, such as earnings and equity capital,
are more important to public banks than to private banks, the incentives to misreport the
ALLL are intensified among public banks (e.g., Balla and Rose 2015; Beatty et al. 2002).

4
Effective bank supervision should restrict banks from misreporting the ALLL, no
matter how incentivized the banks are. If bank supervision is effective, banks would report
the same level of the ALLL regardless whether they are publicly listed or not. But otherwise,
if supervisory laxity exists, banks’ private interests are catered to. Since public banks are
more incentivized to misreport the ALLL, when bank profitability is high, public banks
would overestimate the ALLL relative to their private counterfactuals; but when bank
profitability is under pressure, public banks would underestimate the ALLL relative to their
private counterfactuals.
Because the directions banks take to misreport the ALLL vary with the banks’
financial strength, I examine bank supervision of the ALLL estimations over three periods
of different economic and regulatory environments. The first period runs from 2002 to
2007. During this pre-crisis period, bank profitability was high and the regulatory emphasis
on compliant ALLL estimations was strong. Between 2001 and 2006, a total of three policy
statements on the ALLL estimations were issued, requiring banks to estimate the ALLL in
accordance with generally accepted accounting principles (GAAP), essentially reinforcing
the “incurred loss” model. The second period covers the recent financial crisis from 2008
to 2009, when bank profitability reached historical lows. During the last period from 2010
to 2015, the economy was in recovery. Since 2013, the proportions of problem loans held
by banks have fallen to pre-crisis levels. But because of rising regulatory compliance costs
and squeezed interest margins, bank profitability is still under pressure. In contrast to the
first period, no interagency statements on the ALLL estimations were issued in the last two
periods.

5
Based on the relation between bank profitability and their incentives to misreport the
ALLL, I predict that if supervisory laxity exists, public banks would overestimate the
ALLL relative to their private counterfactuals between 2002 and 2007, despite the strong
regulatory emphasis on compliant ALLL estimations during the period; but public banks
would underestimate the ALLL relative to their private counterfactuals between 2008 and
2015. If bank supervision of the ALLL estimations is effective, no ALLL differences
should be observed between these two types of banks over the entire sample period.
The empirical challenge is that the counterfactuals of public banks are unobservable.
The observed ALLL differences between public and private banks cannot give unbiased
inference about whether bank supervision is effective, because they are confounded by
institutional and loan portfolio characteristics that are associated with both the banks’
listing decisions and their ALLL estimations. To estimate the unbiased effect of reporting
incentives due to public listing on the ALLL estimations, I sample public and private banks
at the end of each calendar year between 2002 and 2015 and use a weighting method
proposed in Li and Greene (2013) to balance 55 covariates that capture institutional and
loan portfolio differences between public and private banks. The 55 covariates are
constructed around the key inputs in the ALLL estimation process as outlined in the
regulatory guidance and are closely related to institutional factors affecting banks’ listing
decisions. The weighting method achieves better covariate balance than propensity score
matching and creates a pseudo-population of public and private banks from which the
unbiased effect can be estimated.
The results suggest that bank supervision of the ALLL estimations is effective
between 2002 and 2012, but has become lax between 2013 and 2015. Between 2002 and

6
2005, public banks only slightly overestimate the ALLL relative to private banks. The
overestimations range from $0.0004 to $0.0006 per dollar of total loans. The
overestimations disappear in 2006 and 2007. During the crisis period between 2008 and
2009, public banks do not underestimate the ALLL relative to private banks. The ALLL
estimations between public and private banks do not differ in 2008 and public banks
overestimate the ALLL by $0.0010 per dollar of total loans in 2009. During the post-crisis
period from 2010 to 2012, the ALLL estimations do not differ between public and private
banks. However, between 2013 and 2015, public banks underestimate the ALLL by
$0.0016, $0.0015, and $0.0013 per dollar of total loans respectively.
I conduct three additional tests to confirm that the variations of the ALLL differences
between public and private banks over the sample period are results from changes in
supervisory effectiveness. First, I use the insight from Agarwal et al. (2014) that state
regulators are more lenient than federal regulators to test whether the ALLL
overestimations by public banks between 2002 and 2005 and the ALLL underestimations
by public banks between 2013 and 2015 are due to supervisory laxity. If bank supervision
is lax in these years, more supervisory laxity, in terms of larger ALLL differences between
public and private banks, would occur between state-chartered public and private banks
than between federally chartered public and private banks, and occur between state-
chartered public and private banks located in more leniently supervised states than between
state-chartered public and private banks located in less leniently supervised states.
The results confirm such predictions. Between 2002 and 2005, only state-chartered
public banks, but not federally chartered public banks overestimate the ALLL. The
overestimations range from $0.0005 to $0.0007 per dollar of total loans. During the same

7
period, state-chartered public banks located in more leniently supervised states
overestimate the ALLL in 2003 and 2005, by $0.0010 and $0.0008 per dollar of total loans
respectively; while state-chartered public banks located in less leniently supervised states
only overestimate the ALLL in 2005, by $0.0004 per dollar of total loans. Given that the
ALLL overestimations among all state-chartered banks remain small, I conclude that bank
supervision of the ALLL estimations is effective between 2002 and 2005.
Between 2013 and 2015, federally chartered public banks only underestimate the
ALLL in 2014 and 2015, by $0.0009 and $0.0007 per dollar of total loans respectively. But
state-chartered public banks underestimate the ALLL in all three years and the
underestimations are much larger, averaging $0.0022, $0.0016, and $0.0015 per dollar of
total loans respectively. In these three years, state-chartered public banks located in more
leniently supervised states also underestimate the ALLL more than state-chartered public
banks located in less leniently supervised states. In addition, state-chartered public banks
located in more leniently supervised states start to underestimate the ALLL in 2012, one
year earlier than state-chartered public banks located in less leniently supervised states.
These results support the conclusion that bank supervision of the ALLL estimations has
become lax recently.
Next, I pin down effective bank supervision as the sole reason for the undetected
underestimations by public banks during the financial crisis and the insignificant ALLL
differences between public and private banks during the rest of the sample period. First,
based on the previous tests, the ALLL overestimation by public banks in 2009 is not
associated with supervisory leniency. Neither state-chartered public banks nor state-
chartered public banks located in more leniently supervised states overestimate the ALLL

8
relative to their private counterparts. But state-chartered public banks located in less
leniently supervised states overestimate the ALLL by $0.0009 per dollar of total loans.
These results are inconsistent with the claim that the ALLL overestimation by public banks
in 2009 is due to the “big bath” reporting behavior, which is more likely to occur under the
supervision of more lenient bank regulators.
Second, I rule out stock market discipline as an alternative explanation for the results.
I use the percentage of institutional ownership, the institutional ownership Herfindahl–
Hirschman Index (HHI), and the number of block owners as proxies to measure the
intensity of institutional monitoring, which is the cornerstone of stock market discipline. I
do not find consistent evidence suggesting that public banks exposed to a higher intensity
of institutional monitoring overestimate or underestimate the ALLL relative to public
banks exposed to a lower intensity of institutional monitoring throughout the entire sample
period. Stock market discipline is absent with regard to banks’ ALLL estimations.
Effective bank supervision is responsible for the undetected underestimations by public
banks during the financial crisis and the insignificant ALLL differences between public
and private banks during the rest of the sample period.
My interpretation of the results implies that bank regulators are unwilling to cater to
banks’ private interests during the financial crisis, or when the regulatory emphasis is
strong, such as the period between 2002 and 2007. However, when the economic
environment is good and the regulatory emphasis is weak, such as the period between 2013
and 2015, bank regulators are willing to cater to banks’ private interests. The ALLL
underestimations by state-chartered public banks between 2013 and 2015 represent about
13% of their annually reported ALLL. Absent income taxes, the ALLL underestimations

9
inflate the reported earnings of state-chartered public banks by 5.8-8.5% per year and their
reported equity capital by 0.8-1.2% per year. But the ALLL underestimations only increase
the Tier 1 risk-based capital ratio by 0.1-0.2% per year. These calculations suggest that
bank regulators allow state-chartered public banks to underestimate the ALLL between
2013 and 2015 to report higher earnings, and to a lesser extent, higher equity capital. But
the allowed reporting discretion is not to inflate the banks’ regulatory capital adequacy.
The research design of this study invokes a crucial assumption that there are no
unobservable confounders to bias the results. Given that the set of covariates balanced in
the study is comprehensive and closely ties to the ALLL estimation process in the
regulatory guidance, any unobservable confounders very likely contain parallel
information to the 55 covariates. Once the 55 covariates are balanced, the unobservable
confounders are no longer a threat to the internal validity. As demonstrated in the
sensitivity analysis, once current-year loan loss rates are balanced, including the loan loss
information beyond the current year does not change the inference. Although the
assumption cannot be tested directly, it is reasonable to doubt the existence of such
unobservable confounders that can meaningfully alter the inference.
This paper makes three contributions to the literature. First, it provides direct
evidence on whether bank supervision is effective, a question that is not adequately
addressed in the literature. Agarwal et al. (2014) find that federal and state regulators are
inconsistent in rating state-chartered banks under the CAMELS rating system. But
inconsistency in assigning ratings cannot serve as concluding evidence that bank
supervision is ineffective, for two reasons. First, the rules governing the CAMELS ratings
are not directed towards regulating behaviors of banks. These rules are at most incomplete

10
representations of bank regulations. Second, since state and federal regulators assign
different ratings after observing the same information reported by banks, the reporting
outcomes may not be compromised during the supervisory processes. This paper studies a
supervisory target that directly governs the reporting behaviors of banks and is central to
the safety and soundness of the banking system. The results provide direct inference on
whether bank supervision is effective. In fact, despite the imperfections of the institutional
design of bank supervision, during the majority of the sample period examined and
especially during the recent financial crisis, bank supervision of the ALLL estimations does
not appear to be ineffective. But this study confirms the finding in Agarwal et al. (2014)
that the federal-state alternate supervision scheme can lead to lax enforcement of written
banking rules.
Second, prior literature often assumes that supervisory laxity is constant over time,
with the exception of Costello et al. (2016), who explore the time-varying relation between
supervisory strictness and accounting restatements. This paper documents the
heterogeneity in supervisory laxity under various economic and regulatory environments.
Bank regulators, especially local bank regulators, are willing to cater to banks’ private
interests when the economic environment is good and the regulatory emphasis is weak, but
not during the crisis. This insight is consistent with a number of observations where banks
claim that the reason to switch from federal charters to state charters post crisis is that local
regulators understand their business environments better. It also raises the doubt whether
bank regulators exercised regulatory forbearance during the recent financial crisis.
Finally, this paper introduces a new method to model banks’ provisioning decisions.
When examining loan loss provisioning-related questions, the literature often uses the

11
provision for loan and lease losses (PLLL) as the dependent variable, coupled with a small
number of covariates to fit an OLS model (see Beatty and Liao (2014) for a review of the
literature). The OLS approach has two major shortcomings. First, the PLLL is not a
regulatory target, but rather a means to bring the ALLL to a level that is deemed appropriate
by the bank examiners. In practice, bank examiners do not review the PLLL. Inferences
about banks’ provisioning decisions should be made from the level of the ALLL, rather
than the level of the PLLL. Second, as demonstrated in Armstrong et al. (2010) via
propensity score matching, controlling a small number of covariates in an OLS model is
inadequate to remove bias in observational studies. Likely due to these two shortcomings,
the literature gives conflicting results regarding whether public or private banks are timelier
to provision for loan losses (Nichols et al. 2009; Olszak et al. 2016). This study finds that
public and private banks report almost the same level of the ALLL between 2002 and 2012
after balancing 55 covariates with a weighting method that is more effective than
propensity score matching to remove bias. The finding suggests that public banks provision
neither more nor less timely than private banks. Future research on banks’ provisioning
decisions can utilize and refine the method used in this paper for better inference.
2 Predictions
The current accounting standards require an “incurred loss” model to estimate the
ALLL; the ALLL must reflect loan losses that have probably occurred as of the evaluation
date. Under this model, the ALLL is high when banks have trouble collecting principal and
interest payments from borrowers, usually during economic downturns; while the ALLL is

12
low when banks have few problems collecting loan payments, usually during credit
expansions.
The ALLL is funded by reducing banks’ current-period earnings via the PLLL, an
expense account that immediately follows the net interest income on banks’ income
statements. As a result, the impact of loan loss provisioning on banks’ earnings is pro-
cyclical and amplifies the cyclicality of bank profits. During credit expansions, bank profits
are high and the allocation of net interest income to the ALLL is low. The average PLLL
can be as low as 5% of a bank’s net interest income. However, during economic downturns,
when bank profits are already low, banks have to set aside more net interest income to fund
increased ALLL. The ratio of the PLLL to net interest income can go over 30%, dragging
banks’ earnings into the negative territory.
Because the impact of loan loss provisioning on banks’ earnings amplifies the
cyclicality of bank profits, banks have incentives to overestimate the ALLL to book
“cookie jar reserves” to smooth earnings when profits are high (Kanagaretnam et al. 2004;
Liu and Ryan 2006); but when banks are financially weak, they are incentivized to
underprovision to preserve earnings and mitigate the negative impact of reduced earnings
on equity capital (Huizinga and Laeven 2012).
These incentives can be intensified among public banks. Public entities face more
short-term profit pressure than private entities and focus more on periodic performance
measures (Narayanan 1985; Stein 1989; Shleifer and Vishny 1990; Bushee 1998; Asker et
al. 2015). As a result, when bank profits are high, public banks are more incentivized than
private banks to overestimate the ALLL to smooth earnings (Balla and Rose 2015); when
facing profit declines, public banks are more incentivized to underprovision (Beatty et al.

13
2002). Because banks’ incentives drive their incompliant reporting behaviors, the different
intensity of incentives to misreport the ALLL between public and private banks forms a
testing ground for effective bank supervision. If supervisory laxity exists, public banks
would overestimate the ALLL relative to their private counterfactuals when both are
financially strong; while public banks would underestimate the ALLL relative to their
private counterfactuals when both are financially weak. If bank supervision is effective, no
ALLL differences would exist between the two types of banks any time.
I examine bank supervision of the ALLL estimations over a sample period between
2002 and 2015, during which economic environments differ. To show how bank profits
vary during the period, I plot banks’ ROA and ROE in Figure 1. Between 2002 and 2007,
bank profits were high. During the crisis period between 2008 and 2009, bank profits,
especially profits of public banks, experienced steep declines.
After the crisis, although profits of both public and private banks recovered from
historical lows, they are still under pressure. Banks’ ROA and ROE have remained stable
since 2013, but they have not reached the pre-crisis levels. Compared to the early 2000s,
when banks came out of the “tech bubble” unscathed, banks today face rising regulatory
compliance costs and a prolonged near-zero interest rate environment. Both factors slow
down banks’ profit growth. For example, post crisis, the net interest margins of both public
and private banks, shown in Figure 1, continued their downward trajectory and in 2015,
reached their lowest points in 14 years. The growth of total loans during this period, also
shown in Figure 1, was tepid. Low margins and slow loan growth exacerbate the difficulties
of banks to make a profit.

14
Unlike the period from 2008 to 2015, the period from 2002 to 2007 is associated with
strong regulatory emphasis on compliant ALLL estimations. Between 2001 and 2007, a
total of three policy statements on compliant ALLL estimations were issued. The strong
regulatory emphasis on the ALLL estimations during this period is due to the SEC’s
concern that public banks overestimated the ALLL to book “cookie jar reserves” to smooth
earnings. In 1998, as a warning signal sent to all banks, the SEC publicly ordered the IPO-
pending SunTrust Bank to restate its past three years’ ALLL by a total reduction of $100
million. In 2001, the securities regulator issued the Staff Accounting Bulletin No. 102
Selected Loan Loss Allowance Methodology and Documentation Issues (SAB 102),
requiring all banks estimate the ALLL in accordance with GAAP and properly document
supporting methodologies. The SEC’s stance was endorsed by all bank regulators, which
in the same year issued the Policy Statement on Allowance for Loan and Lease Losses
Methodologies and Documentation for Banks and Savings Institutions (2001 Policy
Statement). In 2006, the bank regulators again issued the Interagency Policy Statement on
the Allowance for Loan and Lease Losses (2006 Interagency Statement), reiterating the
“key concepts and requirements included in GAAP and existing ALLL supervisory
guidance.”
Based on my predictions of the relation between bank profitability and public banks’
incentives to misreport the ALLL, under lax supervision, public banks would overestimate
the ALLL relative to their private counterfactuals between 2002 and 2007, despite the
strong regulatory emphasis on compliant ALLL estimations during the period; but public
banks would underestimate the ALLL relative to their private counterfactuals between
2008 and 2015. If bank supervision of the ALLL estimations is effective, no ALLL

15
differences should be observed between these two types of banks over the entire sample
period.
Unlike private banks, the ALLL estimations of public banks are also subject to audit.
But this difference between public and private banks does not change the validity of the
inference from the predictions above with regard to whether bank supervision is effective.
The ALLL estimations of both public and private banks are supervised by bank regulators.
Therefore, as long as the estimations differ between public banks and their private
counterfactuals, bank regulators do not enforce the regulation that governs the ALLL
estimations consistently across banks. Whether bank supervision is effective is in question.
3 Method
This section discusses the method to estimate the effect of reporting incentives due
to public listing on the ALLL estimations to infer whether bank supervision is effective to
achieve consistent ALLL reporting between public and private banks. The effect is
estimated by sample year. Section 3.1 discusses the selection of public and private banks
for the sample. Section 3.2 briefly reviews the regulatory guidance on the ALLL
estimations. The guidance forms the basis to identify and construct covariates that
confound the effect estimation. Covariate construction is detailed in Section 3.3. Section
3.4 discusses the statistical approach to create the pseudo-population of public and private
banks from which the unbiased effect can be estimated.
3.1 Sample Selection
I use bank data reported as of December 31 of each calendar year between 2002 and
2015 to construct the sample. Bank data come from two sources: the Bank Regulatory

16
database of Wharton Research Data Services (WRDS) for years between 2002 and 2013
and the FFIEC Central Data Repository’s Public Data Distribution website for years 2014
and 2015.
A typical banking organization in the United States is structured as a bank holding
company (BHC), a corporation that owns one or more commercial banks (hereafter
“banks”) and other non-banking subsidiaries. Amendments to the BHC Act in 1999 allow
a BHC to declare itself a financial holding company (FHC) to engage in financial activities,
such as securities underwriting and dealing, insurance underwriting and agency activities,
and merchant banking.
Banks are supervised by one of the three regulatory agencies. The Office of the
Comptroller of the Currency (the “OCC”) supervises national banks that are federally
chartered; the Federal Reserve Board (the “Fed”) supervises state-chartered banks that are
members of the Federal Reserve System; the Federal Deposit Insurance Corporation (the
“FDIC”) supervises state-chartered banks that are not members of the Federal Reserve
System. The holding parent of a bank, either a BHC or an FHC, is supervised by the Fed.
To minimize observable and unobservable differences between public and private
banks, I impose the following criteria on the sample selection: Every bank selected to the
sample is a national bank, a state member bank, or a state nonmember bank and is held by
a BHC or an FHC; both the bank and its holding parent are headquartered in the continental
United States; neither the bank nor its holding parent is owned by any foreign entity or
person.
A bank is “public” if either the bank itself or its holding parent is listed on one of the
three major exchanges, i.e., the NYSE, the AMEX, or the NASDAQ. I identify public

17
banks in the sample using the CRSP-FRB link table (2014-3), which is available on the
website of the Federal Reserve Bank of New York. The table lists the majority of the banks
or their holding parents that are once listed on one of the three major exchanges between
January 1, 1990 and March 31, 2014. I use the CRSP Daily Stock File of WRDS to obtain
the start and end dates of the listings up to December 31, 2015, the last day of the sample
period.
I delete the bank-year observations of a public bank before the start date and after
the end date of its listing from the sample, for two reasons. First, many banks are traded on
an OTC market before being listed on a major exchange and almost all banks are moved
to an OTC market after a delisting event. An OTC-listing is distinctive from both “being
public” and “being private” (Bushee and Leuz 2005). Such bank-year observations are not
suitable to be considered either public or private. Second, Ball and Shivakumar (2008)
show that prior to a public listing, private non-financial firms start to adjust their financial
reporting to resemble that of public firms as early as three years before their IPOs. Banks
that consider an IPO may do the same. Given that the exact dates when banks contemplate
to go public are unknown, it is not appropriate to consider such pre-IPO bank-year
observations either public or private.
For banks that do not have a match in the CRSP-FRB link table, I search SNL
Financials to identify omitted public listings and code the remaining banks “private” if I
cannot find a trading history on any OTC market. A few banks have holding parents that
are themselves subsidiaries of a BHC or an FHC. If the higher holders are publicly listed,
the banks held underneath are coded “public”.
3.2 The Regulatory Guidance on the ALLL Estimations
18
Estimating the ALLL is essentially estimating loan losses (impairments) that have
probably occurred as of the evaluation date. The ALLL has two major components: loan
losses estimated under ASC 310-10-35 (FAS 114) and loan losses estimated under ASC
450-20 (FAS 5)3. Figure 2 illustrates the steps a bank must follow to estimate loan losses.
The first step is to classify each loan into the FAS 114 pool and the FAS 5 pool, based on
whether the loan is considered impaired. Loans in the FAS 114 pool are evaluated
individually for impairments, using one of the three valuation methods: fair value of the
collateral if the loan is collateral-dependent, present value of expected future cash flows,
or the loan’s observable market price. Which method to use is at the banks’ discretion.
Loans that are not considered impaired are evaluated under FAS 5. Loan losses
estimated under FAS 5 often constitute the largest component of the ALLL. The evaluation
follows three steps: (1) segmenting the loan pool into different loan categories based on
common risk characteristics, (2) estimating the adjusted historical loan loss rate (net
charge-off rate) for each loan category, and (3) applying the estimated loan loss rate to
estimate loan losses. How to segment the loan pool and how to estimate the adjusted
historical loan loss rate are not prescribed in the regulatory guidance. They are determined
by banks, based on the complexity of the banks’ lending activities and the capability of the
banks’ information systems.
The historical loan loss rate is estimated from historical net charge-offs. To decide
the historical net charge-offs relevant to the loan loss rate estimation, banks either take a
simple average of the net charge-offs over a period of time in the past or use a more
complex migration analysis assigning more weights to more recent net charge-offs.
3 A small component of the ALLL is estimated under ASC 310-30 (SOP 03-3), Accounting for Certain Loans or Debt Securities Acquired in a Transfer.

19
Because the loan portfolio condition when historical loan losses occurred may differ from
the loan portfolio condition at the date of the evaluation, the historical loan loss rate must
adjust for environmental factors that are relevant to the current condition of the loan
portfolio before being applied to estimate loan losses. The environmental factors can
include the following: volume and changes of volume of past due and nonaccrual loans;
changes of volume and types of loans; changes of lending policies and procedures; changes
of experience, ability, and depth of lending staff and management; and changes of local
and national economic and business conditions (2001 Policy Statement; 2006 Interagency
Statement).
The ALLL covers estimated losses within all loans held for investment, but does not
cover estimated losses within loans carried at fair value, loans held for sale, off-balance
sheet credit exposures, or general business risks.
3.3 Covariate Construction
The raw ALLL differences between public and private banks cannot give unbiased
effects of reporting incentives due to public listing on the ALLL estimations, because they
are confounded by loan portfolio and institutional characteristics, which are associated with
both the ALLL estimations and the banks’ listing status. First, based on the regulatory
guidance, the ALLL estimations are determined by the characteristics of the banks’ loan
portfolios and institutional factors, such as the complexity of the banks’ lending activities
and the capability of the banks’ management, lending staff, and information systems.
Second, the same loan portfolio and institutional characteristics are also associated with
the banks’ public listing status. A major factor that influences a bank’s decision to go public
is to have access to the equity market to fund expansions of their lending businesses. Banks

20
that opt for an IPO also have the capability to carry out such endeavors. Over time, with an
objective to pursue faster growth, public banks not only build loan portfolios vastly
different from the loan portfolios of private banks, but they also become more sophisticated
institutions.
To adequately control for confounding, these loan portfolio and institutional
characteristic differences must be balanced between public and private banks. Moreover,
the covariates to capture these characteristic differences must closely tie to the ALLL
estimations. To an academic researcher who does not have access to individual loan
impairment data, estimating the ALLL is no different from estimating probable loan losses
by banks for the FAS 5 loan pool, of which banks also cannot observe the loan losses. I
follow the FAS 5 estimation steps to identify and construct 55 covariates that capture these
loan portfolio and institutional differences between public and private banks. This
approach does not consider the factors that influence the loss estimations of the FAS 114
loans. But because the FAS 114 factors are specific to individual loans, they are likely
idiosyncratic in nature and do not contribute to systematic ALLL differences between
public and private banks. Therefore, ignoring these factors is not likely to introduce bias in
the effect estimation.
3.3.1 Covariates that Reflect Loan Portfolio Characteristics
According to FAS 5, the first step to estimate loan losses is to segment the loan pool
into different loan categories based on common risk characteristics. Following this
approach, I segment the loan portfolios of the banks in the sample into the following six
categories: residential real estate loans, commercial real estate loans, commercial &
industrial loans, consumer loans, loans secured by farmland, and agricultural loans.

21
These loan categories expose banks to significant credit risks and the risk exposures
are statistically different between public and private banks. To illustrate this point, I list all
loan categories reported by banks in the Call Report filings in Figure 1 and compare the
average concentration of credit of each loan category between public and private banks
over the sample period. A concentration of credit is calculated by dividing the amount of
loans in each category by the sum of Tier 1 risk-based capital and the ALLL. This formula
to calculate the concentration of credit is taken from the Comptrollers Handbook
(December 2011) of the OCC.
The OCC considers a concentration of credit exceeding 0.25 a material exposure to
credit risks. Of both public and private banks, the concentrations of credit of residential
real estate loans (real estate loans secured by 1-4 family residential properties), commercial
real estate loans (real estate loans secured by commercial properties), commercial &
industrial loans, and consumer loans all exceed 0.25. The p-values from the Kruskal-Wallis
Rank Sum Test4 and the SMDs both suggest that the differences in the concentrations of
credit of these loans are statistically significant between public and private banks. Unlike
private banks, public banks engage in less agriculture-related lending. For public banks,
the concentrations of credit of real estate loans secured by farmland and agricultural loans
are below 0.25; but for private banks, these concentrations of credit are often above 0.5.
For the rest of the loan categories held by both public and private banks, such as
municipal loans, loans to depository institutions, loans to foreign government, other loans,
and lease financing receivables, the concentrations of credit are small. Many of these loan
4 The null hypothesis of the test is that the two comparison groups originate from the same distribution. Unlike the t-test, the Kruskal-Wallis test is non-parametric and does not assume normal distributions.

22
categories do not exhibit statistically significant differences between public and private
banks. Therefore, I do not consider these loan categories to construct the covariates.
Based on the regulatory guidance, the second step in the ALLL estimation under
FAS 5 is to estimate the adjusted historical loan loss rate for each loan category. Loan loss
rates are estimated from historical net charge-offs and are adjusted for environmental
factors. First, I construct the covariate “current-year loan loss rate” for each loan category
using current-year net charge-offs of each loan category divided by total loans. Using
average 12-month net charge-offs over the past 12 to 36 months is common among banks
to estimate loan loss rates. In the sensitivity analysis, I show that including information
from the prior-year net charge-offs does not change the inference.
Next, I construct covariates to capture the environmental factors related to loan
portfolio characteristics when adjusting the historical loan loss rates. These environmental
factors include the volume of loans, the change of volume of loans, and the volume and the
change of volume of problem loans. I measure the volume of loans and the change of
volume of loans of each loan category by its concentration of credit and its year-over-year
growth respectively. I follow the Call Report filings to categorize problem loans into three
likelihoods of default: past due 30-89 days and still accruing principal and interest
payments, past due 90 or more days and still accruing principal and interest payments, and
in nonaccrual status. I measure the volume of problem loans by dividing the amount of
problem loans in each loan category by the amount of total loans. The reason to use total
loans as the scaler is that the ALLL is reported at the total loan level. The impact of problem
loans of each loan category on the ALLL estimations should consider their proportional
relevance to the entire loan portfolio. Because zero values appear often when individual

23
banks report problem loans in each loan category, I calculate the change of volume of
problem loans as the year-over-year growth of problem loans at the total loan level to
preserve sample size. A total of 39 covariates are constructed to reflect the banks’ loan
portfolio characteristics. They are listed in Appendix A-I.
3.3.2 Covariates that Reflect Institutional Characteristics
In this section, I discuss convariate construction to capture the environmental factors
associated with institutional characteristics of the banks, such as the capability of the banks’
management, lending staff, and information systems. A common covariate that reflects
banks’ institutional characteristics is the size of the bank. Bank size is measured as the log
of total assets. Banks can be held by either an FHC or a BHC. Because an FHC engages in
more complex financial activities and must meet more stringent performance criteria, I use
an indicator variable TYPE to differentiate banks held by FHCs from banks held by BHCs.
The rest of the covariates are constructed to be closely related to the CAMELS rating
system, following the variable definitions in Bassett et al. (2015), Falato and Scharfstein
(2016), and the Uniform Bank Performance Report. The CAMELS rating system is by far
the only uniform rating system to evaluate a bank’s managerial, operational, financial, and
compliance performance. The CAMELS ratings consist of six components: capital
adequacy (C), asset quality (A), management capability (M), earnings quantity and quality
(E), the adequacy of liquidity (L), and sensitivity to market risk (S). Appendix A-II lists
and defines the covariates constructed under each of the six components. The covariates
that reflect loan portfolio characteristics also reflect “asset quality” of the banks, so only
one covariate is included under “asset quality”. A total of 16 covariates are constructed to
reflect the banks’ institutional characteristics.

24
3.4 Weighting to Estimate the Unbiased Effect
When modeling banks’ provisioning decisions, the current literature often uses an
OLS model with the PLLL as the dependent variable and a few covariates as control
variables (see Beatty and Liao (2014) for a literature review). This approach is unlikely to
yield reliable inference, because of two shortcomings. First, the level of the ALLL, rather
than the level of the PLLL, determines whether a bank adequately provisioned for its loan
losses and should be the outcome variable to approach loan loss provisioning-related
empirical problems. The PLLL is only a derivative of the ALLL estimations. Its only
purpose is to bring the ALLL to an appropriate level to cover estimated loan losses. In fact,
the PLLL is not a supervisory target and bank examiners do not review the level of the
PLLL at all.
Moreover, using the PLLL as the outcome variable assumes that the ALLL has a
constant baseline level and the net charge-offs have a 1-to-1 relation with the PLLL. This
assumption is not always correct. Consider a bank that experiences an increase in estimated
losses in the loan portfolio during the current evaluation period. If the net charge-offs
neither increase nor decrease from the last evaluation period, more losses should be
provisioned to bring the ALLL to a higher level. However, if the net charge-offs decrease
from the last evaluation period, the ALLL can be enough to cover the increased loss
estimate and zero loss should be provisioned during the current period. Throughout this
study, the outcome variable is the ALLL scaled by total loans, as in Beck and
Narayanamoorthy (2013).
The second shortcoming of the OLS approach is that the success of an OLS model
to remove bias depends on the validity of two assumptions. First, that the comparison
25
groups share the same distributions in the covariates. Second, that the relationship between
the dependent variable and the covariates is not only linear, but the linear relationship is
the same between the comparison groups. These assumptions are often too stringent to be
satisfied with observational data, causing effects estimated under an OLS model to be
model-dependent.
Instead of imposing model assumptions on the data, I use a matching method for this
study. The advantage of a matching method over the OLS approach is that the former
mimics a randomized experiment to separate the stages of design and outcome analysis. In
the design stage, comparison groups are balanced over covariates that likely contribute bias
to the effect estimation. Under the conditional independence assumption, once the
covariates are balanced, the outcomes of comparison groups no longer depend on the
treatment assignment, just like the outcomes of comparison groups do not depend on the
treatment assignment in a randomized experiment. In the outcome analysis stage, the effect
can be estimated by simply calculating the difference in group means.
A common matching method is matching on the propensity score, the probability to
receive the treatment conditional on the covariates. A disadvantage of propensity score
matching is that it often does not use all the data in the sample. In a typical 1-to-1 matching
without replacement, observations in one of the comparison groups without a match in the
other are dropped from the sample, reducing the estimation precision and the external
validity. K-to-1 matching or matching with replacement can keep more data in the matched
sample. But the former can introduce bias in the effect estimation; while the latter makes
inference more complicated, because units selected from one of the comparison groups are

26
likely sampled multiple times and are no longer independent of each other in the matched
sample (Stuart 2010).
Because private banks outnumber public banks in my sample, I use a weighting
method developed by Li and Greene (2013) to circumvent the disadvantage of propensity
score matching. The weighting method is analog to 1-to-1 without-replacement propensity
score matching, but uses all the data in the sample. In their simulation study, Li and Greene
(2013) demonstrate that the weighting method achieves better balance and more efficient
estimation than propensity score matching.
The first step of the weighting method, as in propensity score matching, is to estimate
the propensity scores. I run the following logistic regression for each sample year to
estimate the propensity scores:
Log
.
is the “Public” dummy. = 1 if bank is public; = 0 if bank is private. indexes
the state where bank is physically headquartered. Because the environmental factors to
adjust the historical loan loss rates take into account regional economic conditions, adding
the state indicator controls for all observable and unobservable economic and business
environmental differences across states. is a vector containing the 55 covariates of bank
.
There are two general concerns about the propensity score estimation. First, the
estimation model may be misspecified. This concern, however, is not an issue if the 55
covariates are balanced between public and private banks. Once such balance is achieved,
the estimated propensity scores are consistent estimators of the true propensity scores (Ho
et al. 2007).

27
The second concern is that some unobservable confounders continue to contribute
bias in the estimation. However, the unobservable confounders can only contribute bias to
the effect estimation when they are both related to the ALLL estimations and orthogonal
to the 55 covariates. But otherwise, if the unobservable confounders are correlated with
one or more covariates, once the 55 covariates are balanced, the unobservable confounders
are also balanced. Given that this study uses a large set of covariates to estimate the
propensity scores and the covariates are constructed around the key inputs of the ALLL
estimation process, the unobservable confounders likely contain parallel information to the
55 covariates and therefore, are not threats to the internal validity. I demonstrate in the
sensitivity analysis that the 55 covariates can indeed balance omitted variables that contain
parallel information to the 55 covariates.
The second step of the weighting method is to calculate the “matching weight” (Li
and Greene 2013) assigned to each observation based on the estimated propensity score.
The following is the formula to calculate the matching weight for bank :
min , 11 1
,
where denotes the estimated propensity score of bank . The matching weight closely
resembles the weight used in the inverse probability of treatment weighting (IPTW). They
share the same denominator, but the matching weight replaces the numerator “1” in the
IPTW weight with min ,1 – . As a result, unlike IPTW, which often suffers from
extreme propensity score values, this weighting method assigns smaller weights to
observations with extremely large and small propensity scores (when equals 0 or 1, the
observation receives zero weight).
The final step is to run a matching weight-weighted regression:

28
.
is the estimated effect of reporting incentives due to public listing on the ALLL
estimations. If the 55 covariates are balanced between public and private banks, the above
regression will give the unbiased effect estimate under the conditional independence
assumption.
I also run a longer version of the above regression, controlling for all 55 covariates
used in the propensity score estimation model and with the state fixed effects:
.
If the covariates are balanced between public and private banks, adding covariates and
fixed effects to the regression will not alter the size of the estimated effect from the shorter
regression, i.e., = , but may yield a smaller standard error on . If = , the
estimated effect is indeed unbiased under the conditional independence assumption.
4 Results
Data analysis is conducted in R (R Core Team 2016) and uses the following R
packages: “data.table” (Dowle et al. 2015), “dplyr” (Wickham and Francois 2016),
“ggplot2” (Wickham 2009), “glm2” (Marschner 2014), “lmtest” (Zeileis and Hothorn
2012), “Matching” (Sekhon 2011), “multcomp” (Hothorn et al. 2008), “multiwayvcov”
(Graham et al. 2016), “reshape2” (Wickham 2007), “survey” (Lumley 2016, 2004), and
“tableone” (Yoshida and Bohn 2015).
4.1 Check Balance

29
Before moving to the outcome analysis stage to estimate the effect, we need to make
sure that the estimated propensity scores can balance the 55 covariates between public and
private banks. Table 2 presents, by sample year, the balance statistics of the 55 covariates
of the unmatched and the weighted samples. To test whether the state fixed effects in the
propensity score estimation model can balance the differences of economic conditions
between states where the public and private banks are located, I also check the balances of
three economic indicators: the state unemployment rate (UNST), the state GDP growth
(GDPST), and the state year-over-year change of the value of housing permits (PMST).
These economic indicators are obtained from the websites of the Bureau of Labor Statistics,
the Bureau of Economic Analysis, and the Census Bureau respectively.
To compare the balancing capability of the weighting method with that of propensity
score matching, I present the balance statistics of a matched sample after applying 1-to-1
without-replacement matching on the logit of the propensity score, with a caliper of width
equal to 0.2 of the standard deviation of the logit of the propensity score. In simulation
studies, this particular propensity score matching method is found to estimate the treatment
effect with smaller bias and mean squared error than optimal and nearest neighbor
matching (Austin 2014). The propensity scores used in the matching method are the same
as the ones used in the weighting method.
Three sets of balance statistics for each covariate are calculated for the unmatched,
the matched, and the weighted samples respectively: the means and standard deviations (in
parentheses) of the samples of public and private banks, the p-values from the Kruskal-
Wallis Rank Sum Test, and the SMDs. An SMD < 0.1 usually suggests that the covariate
is balanced between the comparison groups, while an SMD > 0.1 often suggests that the

30
covariate is not balanced and may contribute bias to the effect estimation. The SMDs are
preferred to the p-values from a statistical test of hypothesis to infer whether covariates
between comparison groups are balanced, because the SMDs are calculated independent
of the sample size (Austin and Stuart 2015). If the sample size is reduced during the design
stage, the p-values from a hypothesis test can be inflated simply because of a loss of
statistical power.
To give a visual comparison of the covariate balances, I graph the SMDs of the
unmatched, the matched, and the weighted samples by sample year in Figure 2. Covariates
are listed in each graph in the descending order of the magnitude of the SMDs of the
unmatched sample. In each graph, the red line plots the SMDs of the unmatched sample;
the green line plots the SMDs of the matched sample; and the blue line plots the SMDs of
the weighted sample. SMD = 0.1 is noted in all graphs as a solid straight line to the right
of 0.0.
The rank order of the magnitude of the SMDs among covariates in the unmatched
samples varies from year to year, but bank size (SIZE) remains the covariate with the
largest imbalance between public and private banks across all years. Imbalances of entity
type (TYPE) and concentrations of credit of agricultural loans (AG.CON), real estate loans
secured by farmland (FARM.CON), and commercial real estate loans (CRE.CON) are also
frequently among the top five largest.
The graphs clearly show that the weighting method achieves better balances among
covariates than propensity score matching in all years. All SMDs under the weighting
method, including the SMDs of the three economic indicators, are smaller than 0.1. In fact,
across all years and all covariates, the maximum SMD under the weighting method is 0.067,

31
while the maximum SMD under the propensity score matching is 0.267. In addition, the
propensity score matching often causes the SMDs of several covariates that are balanced
in the unmatched samples to exceed 0.1 after matching.
A side-by-side comparison of the p-values and the SMDs in Table 2 demonstrates
that the p-values from the Kruskal-Wallis Rank Sum Test can lead to biased inference
about the balances of the covariates between public and private banks. For example, in the
matched sample of 2015, covariates TYPE, CRE.NAC, CI.NAC, CI.CON, FARM.CON,
AG.CON, CS.G, FARM.G, PD30.G, and PSEC all have a p-value above 0.1, suggesting
insignificant imbalances between public and private banks. However, the SMDs of these
covariates are all above 0.1. These discrepancies occur quite often in the matched samples.
4.2 Baseline Results
Results in Column (4) of Table 3, Panel A are the baseline results of this study. The
effect of reporting incentives due to public listing on the ALLL estimations is the
coefficient on “Public”. It is estimated from the weighted regression with the 55 covariates
as control variables and the state fixed effects. For comparison purposes, I also report the
ALLL differences between public and private banks estimated under other methods in
Columns (1) to (3) of Table 3, Panel A. Column (1) reports the observed raw differences,
obtained by regressing the dependent variable
on the “Public” dummy using the
unmatched samples, without adjusting for any covariates. Column (2) reports the ALLL
differences between public and private banks estimated from the OLS model with the 55
covariates as control variables and the state fixed effects. Results in Column (3) are
estimated from the same weighting method as used for Column (4), but without adding the
55 covariates and the state fixed effects to the weighted regression. All standard errors are

32
in parentheses and are clustered at the state level. The coefficients on “Public” from
Columns (1) to (4) of Panel A are separately listed in Columns (1) to (4) of Panel B for a
better presentation of time-series changes of the ALLL differences between public and
private banks.
If the weighting method is successful to remove bias captured by the 55 covariates
and the state indicator variable in the propensity score estimation model, the coefficients
on “Public” will be the same in Columns (3) and (4) of both panels. That is, if the outcome
is independent of the treatment assignment, adding covariates and fixed effects to a linear
regression does not attenuate the effect estimation. A side-by-side comparison of Columns
(3) and (4) of Panel B shows that either the coefficients under both columns are identical
or the discrepancy is no larger than 0.0003 across all years. But the OLS approach likely
continues to give biased effect estimates. A side-by-side comparison of the coefficients in
Columns (2) and (4) of Panel B shows that although the signs of the coefficients are almost
identical in all years under both the weighting method and the OLS approach, the effect
estimates from the OLS approach are often larger.
Based on the predictions discussed in Section 2, if bank supervision of the ALLL
estimations is effective, public and private banks in the weighted sample would report the
same level of the ALLL throughout the entire sample period. If bank supervision of the
ALLL estimations is lax, public banks would overestimate the ALLL relative to private
banks between 2002 and 2007, when bank profitability is high; but public banks would
underestimate the ALLL between 2008 and 2015, when bank profitability is under pressure.
Bank supervision of the ALLL estimations is effective between 2002 and 2007.
Column (4) of both panels shows that between 2002 and 2007, public banks only

33
overestimate the ALLL between 2002 and 2005. The overestimations range from $0.0004
to $0.0006 per dollar of total loans. Based on the average total loans held by public banks
during the period, these ALLL overestimations are small in economic magnitude; they
represent 2.1-4.1% of report ALLL. In 2006 and 2007, the ALLL estimations do not differ
between public and private banks. These results can be explained by the strong regulatory
emphasis on compliant ALLL estimations during this period. After the issuance of the SAB
102 and the 2001 Policy Statement, public banks constrained their behaviors to smooth
earnings (Balla and Rose 2015). The disappearance of the ALLL differences between
public and private banks in 2006 and 2007 also coincides with the issuance of the 2006
Interagency Statement.
The results between 2008 and 2015 suggest that bank supervision is effective during
the crisis and the short period afterwards, but has become lax in the last three years of the
sample period. In 2008, the ALLL difference between public and private banks is zero, and
in 2009, public banks overestimate the ALLL by $0.0010 per dollar of total loans. From
2010 to 2012, public and private banks report the same level of the ALLL. However,
between 2013 and 2015, public banks underestimate the ALLL by $0.0016, $0.0015, and
$0.0013 per dollar of total loans respectively. These ALLL underestimations are both
statistically and economically significant. The average total loans of public banks in 2013,
2014, and 2015 are $13.42 billion, $14.24 billion, and $18.22 billion respectively, which
convert the per-dollar-of-total-loan ALLL underestimations in these three years to
respective dollar amount of $21.47 million, $21.37 million, and $23.68 million. They
account for about 9% of reported ALLL of public banks.
4.3 Additional Tests for Supervisory Laxity

34
I conduct two additional tests to confirm that the observed ALLL differences
between public and private banks, especially the differences in the recent years, are due to
lax supervision. The tests are based on the finding in Agarwal et al. (2014) that state
regulators are more lenient than federal regulators when assigning the CAMELS ratings to
the same state-chartered banks, which are subject to the federal-state alternate supervision
scheme. If the ALLL differences between public and private banks are due to supervisory
laxity, more supervisory laxity, in terms of larger ALLL differences between public and
private banks, should be observed between state-chartered public and private banks than
between federally chartered public and private banks, which are subject to supervision from
federal regulators only; more supervisory laxity should also be observed between state-
chartered public and private banks located in more leniently supervised states than
observed between state-chartered public and private banks located in less leniently
supervised states.
To test the first prediction that the ALLL differences are larger between state-
chartered public and private banks, I interact the “Public” dummy with an indicator
variable “State charter”, which equals “1” if the bank has a state charter and “0” if the bank
has a federal charter. The results are reported in Column (5) of Table 3, Panel A. The
coefficients of “Public” estimate the ALLL differences between federally chartered public
and private banks. The combined coefficients of “Public” and “Public × State charter”
estimate the ALLL differences between state-chartered public and private banks. All
standard errors are in parentheses and are clustered at the state level. For better comparison
of the estimated ALLL differences over time, the coefficients of “Public” and “Public +
Public × State charter” are separately listed in Columns (5) and (6) of Table 3, Panel B.

35
The ALLL differences between state-chartered public and private banks can almost
entirely explain the ALLL differences estimated from the all-bank sample. Between 2002
and 2004, only state-chartered public banks, but not federally chartered public banks
overestimate the ALLL. The overestimations remain small. Between 2013 and 2015, the
ALLL underestimations of state-chartered public banks are larger than the
underestimations of public banks from the all-bank sample, the former averaging $0.0022,
$0.0016, and $0.0015 per dollar of total loans in the respective three years. Federally
chartered public banks do not underestimate the ALLL in 2013. In 2014 and 2015, federally
chartered public banks only underestimate the ALLL by $0.0009 and $0.0007 per dollar of
total loans respectively. These results are consistent with the conclusion that bank
supervision of the ALLL estimations has become lax in recent years.
To test the second prediction that the ALLL differences are larger between state-
chartered public and private banks located in more leniently supervised states than between
state-chartered public and private banks located in less leniently supervised states, I split
the sample of state-chartered banks into two subsamples. One subsample consists of state-
chartered banks located in states with an above-average state leniency index as computed
in Agarwal et al. (2014) and the other consists of state-chartered banks located in states
with an average or below-average state leniency index. The state leniency index, which is
generously made available by Amit Seru, is the average spread between the CAMELS
ratings assigned by the federal regulator and the ratings assigned by the state regulator to
the same state-chartered banks in a given state. The higher the index value, the more
differently state and federal regulators rate the same state-chartered banks in a given state.
Because state regulators are found to assign more favorable ratings to the same state-

36
chartered banks than federal regulators, the higher the index value, the more lenient the
state regulator in a given state5. The results of this test are reported in Table 4.
As predicted, larger ALLL differences are observed between state-chartered public
and private banks located in more leniently supervised states than observed between state-
chartered public and private banks located in less leniently supervised states. Between 2002
and 2005, state-chartered public banks located in more leniently supervised states
overestimate the ALLL in 2003 and 2005, by $0.0010 and $0.0008 per dollar of total loans
respectively. During the same period, state-chartered public banks located in less leniently
supervised states only overestimate the ALLL by $0.0004 per dollar of total loans in 2005.
Between 2013 and 2015, the ALLL underestimations are larger among state-chartered
public banks located in more leniently supervised states than among state-chartered public
banks located in less leniently supervised states. In addition, state-chartered public banks
located in more leniently supervised states start to underestimate the ALLL in 2012, one
year earlier than state-chartered public banks located in less leniently supervised states.
These findings are again consistent with the conclusion that bank supervision has become
lax recently.
The above two tests also suggest that between 2006 and 2011, bank supervision of
the ALLL estimations are effective. First, during this period, state-chartered public and
private banks report the same level of the ALLL, suggesting little supervisory laxity. This
conclusion is consistent with the conclusion from the all-bank sample. In 2006 and 2011,
the ALLL estimations differ between state-chartered public and private banks located in
5 The index is computed up to the fourth quarter of 2010. But because the rating spreads are persistent over time, the state leniency index is still a good proxy for the post-2010 period of this study.

37
more leniently supervised states. But because these differences do not have counterparts in
the test of the federal-state split, I do not over-interpret their meanings.
Second, because the ALLL overestimation by public banks in 2009 is not associated
with state supervisory leniency, the overestimation is not likely due to public banks’ “big
bath” reporting behavior, which also suggests ineffective bank supervision. In the federal-
state split, neither state-chartered public banks nor federally chartered public banks
overestimate the ALLL relative to their private counterparts in 2009. In the split by the
state leniency index, state-chartered public banks located in more leniently supervised
states do not overestimate the ALLL in 2009 either. In fact, it is the state-chartered public
banks located in less leniently supervised states that overestimate the ALLL in 2009.
Although I hesitate to interpret these results as evidence that less lenient bank regulators
precautiously require public banks to overestimate the ALLL at the worst of the financial
crisis, at least the results do not support the claim that public banks take a “big bath”
approach towards the ALLL estimations in the crisis. In the next section, I further rule out
the possibility of the existence of stock market discipline as an alternative explanation that
competes with effective bank supervision for the results.
4.4 Tests for the Existence of Stock Market Discipline
Either voluntarily or as required by securities regulations, public entities
communicate and disclose more to their shareholders and the investment community than
private entities. Therefore, compared to private entities, public entities are subject to added
scrutiny from stock market participants and the scrutiny may help discipline their reporting
behaviors (e.g., see studies by Ball and Shivakumar (2005) and Burgstahler et al. (2006)
on non-financial firms).

38
Since we do not have empirical evidence on whether the stock market can discipline
banks’ reporting behaviors, I conduct three tests to find out whether stock market discipline
exists and takes part to suppress public banks’ incentives to misreport the ALLL. Because
institutional investors are generally believed to actively monitor the management of public
entities, I use the following three proxies to capture the intensity of stock market discipline:
the percentage of institutional ownership, the institutional ownership HHI, and the number
of institutional block owners. Data for the three proxies come from the database of
Thomson Reuters Institutional (13f) Holdings of WRDS.
The tests use the all-bank sample. I split the sample of public banks into two
subsamples based on whether the banks have an above-average, or an average or below-
average proxy and retain all private banks as the comparison group for both subsamples. If
stock market discipline exists, we should observe smaller ALLL underestimations or
overestimations among public banks with an above-average proxy than we should observe
among public banks with an average or below-average proxy. The results are reported in
Table 5.
Panel A of Table 5 presents the results from the split by the percentage of institutional
ownership. Between 2002 and 2005, public banks with an above-average percentage of
institutional ownership overestimate the ALLL in 2002 and 2004, by $0.0007 and $0.0015
per dollar of total loans respectively. Public banks with an average or below-average
percentage of institutional ownership only overestimate the ALLL in 2002, by $0.0003 per
dollar of total loans. Public banks with an above-average percentage of institutional
ownership starts to underestimate the ALLL in 2012, one year earlier than public banks
with an average or below-average percentage of institutional ownership. In two out of the

39
three years between 2013 and 2015, the ALLL underestimations by public banks with an
above-average percentage of institutional ownership are larger than the underestimations
by public banks with an average or below-average percentage of institutional ownership.
For the rest of the sample period, public and private banks do not differ in the ALLL
estimations in either subsample. Even if the results cannot conclude that higher institutional
ownership drives public banks to misreport the ALLL, they suggest that stock market
discipline is absent in the context of ALLL estimations.
Panels B and C of Table 5 present the results from the splits by the institutional
ownership HHI and the number of institutional block owners respectively. The results show
that throughout the entire sample period and especially for the period between 2013 and
2015, when bank supervision has become lax, public banks subject to a higher intensity of
institutional monitoring do not misreport the ALLL less than public banks subject to a
lower intensity of institutional monitoring. The results again suggest that stock market
discipline is absent regarding the ALLL estimations. The insignificant ALLL differences
between public and private banks, especially during the financial crisis, are due to effective
bank supervision.
The stock market discipline hypothesis is a counter-argument to the underpinnning
of the predictions raised by this study, i.e., the stock market creates pressure for banks to
engage in misreporting. Therefore, the conclusion that stock market discipline is absent
proves that the predictions of this study are well-reasoned.
4.5 Sensitivity Analysis
The validity of my results rests on a crucial assumption that no unobservable
confounders exist to meaningfully bias the effect estimations. This assumption cannot be

40
tested directly. But I argue that such confounders very likely do not exist, because the 55
covariates balanced between public and private banks are comprehensive and capture the
key inputs of the ALLL estimation process as outlined in the regulatory guidance.
Unobservable confounders, which must also relate to the ALLL estimations, very likely
contain parallel information to the 55 covariates. Therefore, once the 55 covariates are
balanced, the unobservable confounders can no longer contribute bias to the effect
estimations.
I offer a demonstration of this argument. So far in this study, only the current-year
net charge-offs are used to calculate the historical loan loss rates. However, banks often
use average net charge-offs of both the current year and the past few years to calculate the
historical loan loss rates. Such loan loss rate calculation contains information about past
loan losses that are not balanced in this study. But because the average net charge-offs
correlate with the current-year net charge-offs, the historical loan loss rate calculated using
only the current-year net charge-offs can balance the historical loan loss rate containing
information about past loan losses.
I calculate an alternative historical loan loss rate by averaging both the current-year
and the prior-year net charge-offs and use this alternative loan loss rate to re-estimate the
ALLL differences between public and private banks, between federally chartered public
and private banks, and between state-chartered public and private banks. The results are
reported in Columns (2), (4), and (6) of Table 6. The original estimates as reported in Table
3 are presented in Columns (1), (3), and (5) of Table 6. The sizes of the estimated effects
are fairly similar under the two different loan loss rate calculations. The inference from the
original results still holds.

41
4.6 Implications of the Overall Results
Table 7 presents the impact of the ALLL underestimations of state-chartered public
banks between 2013 and 2015 on their reported earnings, equity capital, and Tier 1 risk-
based capital ratio. Columns (1) to (3) convert the per-dollar-of-total-loan ALLL
underestimations to dollar amounts. In these three years, state-chartered public banks
underestimate the ALLL by $10.40 million, $8.35 million, and $8.84 million respectively.
The ALLL underestimations account for about 11.9-14.4% of reported ALLL (reported in
Column (8)), 5.8-8.5% of reported income before taxes and extraordinary items (reported
in Column (9)), and 0.8-1.2% of reported equity capital (reported in Column (10)).
However, the ALLL underestimations account for only 0.1-0.2% of total risk-weighted
assests (reported in Column (11)), the maximum impact on Tier 1 risk-based capital ratio
absent income taxes. These calculations suggest that bank regulators allow state-chartered
public banks to underestimate the ALLL to report higher earnings, and to a lesser degree,
equity capital. Because the impact on Tier 1 risk-based capital ratio is marginal, the allowed
reporting discretion is not to inflate the banks’ regulatory capital adequacy.
Overall, the results imply that bank regulators are unwilling to cater to banks’ private
interests when the regulatory emphasis is strong – the ALLL overestimations at the
beginning of the sample period are small. Bank regulators are also unwilling to cater to
banks’ private interests during the financial crisis, as public banks do not underestimate the
ALLL between 2008 and 2009. However, bank regulators are willing to cater to banks’
private interests when the economic environment is good and the regulatory emphasis is
weak, such as the period between 2013 and 2015. During these three years, the proportions
of problem loans held by banks have almost reached the pre-crisis low levels (see Figure

42
4), but as discussed before, bank profits are still under pressure. Supervisory laxity is not a
constant; it varies with changing economic and regulatory environments.
5 Conclusion
I study whether bank supervision is effective to enforce the written regulation
governing the estimations of the allowance for loan and lease losses (ALLL) consistently
between public and private banks between 2002 and 2015. Based on prior literature, public
banks are more incentivized than private banks to overestimate the ALLL when bank
profitability is high; but public banks are more incentivized than private banks to
underestimate the ALLL when bank profitability is low. I predict that if bank supervision
is lax, public banks would overestimate the ALLL relative to their private counterfactuals
between 2002 and 2007 and underestimate the ALLL relative to their private
counterfactuals between 2008 and 2015.
By balancing 55 covariates that confound the effect of reporting incentives due to
public listing on the ALLL estimations, I create a pseudo-population of public and private
banks from which the unbiased effect can be estimated. I find that public banks, especially
state-chartered public banks, slightly overestimate the ALLL between 2002 and 2005 and
significantly underestimate the ALLL between 2013 and 2015. Public and private banks
do not differ in their ALLL estimations during the financial crisis and the rest of the sample
period. Bank supervision of the ALLL estimations is effective between 2002 and 2012, but
has become lax recently. The results imply that bank regulators are only willing to cater to
banks’ private interests when the economic environment is good and the regulatory
emphasis is weak, but not during the financial crisis.

43
References
Agarwal, S., D. Lucca, A. Seru, and F. Trebbi. 2014. Inconsistent Regulators: Evidence from Banking. Quarterly Journal of Economics 129 (2):889-938.
Armstrong, C. S., A. D. Jagolinzer, and D. F. Larcker. 2010. Chief Executive Officer Equity Incentives and Accounting Irregularities. Journal of Accounting Research 48 (2):225-271.
Asker, J., J. Farre-Mensa, and A. Ljungqvist. 2015. Corporate Investment and Stock Market Listing: A Puzzle? Review of Financial Studies 28 (2):342-390.
Austin, P. C. 2014. A Comparison of 12 Algorithms for Matching on the Propensity Score. Statistics in Medicine 33 (6):1057-1069.
Austin, P. C., and E. A. Stuart. 2015. Moving towards Best Practice when Using Inverse Probability of Treatment Weighting (IPTW) Using the Propensity Score to Estimate Causal Treatment Effects in Observational Studies. Statistics in Medicine 34 (28):3661-3679.
Ball, R., and L. Shivakumar. 2005. Earnings Quality in UK Private Firms: Comparative Loss Recognition Timeliness. Journal of Accounting & Economics 39 (1):83-128.
———. 2008. Earnings Quality at Initial Public Offerings. Journal of Accounting & Economics 45 (2-3):324-349.
Balla, E., and M. J. Rose. 2015. Loan Loss Provisions, Accounting Constraints, and Bank Ownership Structure. Journal of Economics and Business 78:92-117.
Bassett, W. F., S. J. Lee, and T. P. Spiller. 2015. Estimating Changes in Supervisory Standards and Their Economic Effects. Journal of Banking & Finance 60:21-43.
Beatty, A., and S. Liao. 2014. Financial Accounting in the Banking Industry: A Review of the Empirical Literature. Journal of Accounting & Economics 58 (2-3):339-383.
Beatty, A. L., B. Ke, and K. R. Petroni. 2002. Earnings Management to Avoid Earnings Declines Across Publicly and Privately Held Banks. Accounting Review 77 (3):547-570.
Beck, P. J., and G. S. Narayanamoorthy. 2013. Did the SEC Impact Banks’ Loan Loss Reserve Policies and Their Informativeness? Journal of Accounting & Economics 56 (2-3):42-65.
Burgstahler, D. C., L. Hail, and C. Leuz. 2006. The Importance of Reporting Incentives: Earnings Management in European Private and Public Firms. Accounting Review 81 (5):983-1016.
Bushee, B. J. 1998. The Influence of Institutional Investors on Myopic R&D Investment Behavior. Accounting Review 73 (3):305-333.
Bushee, B. J., and C. Leuz. 2005. Economic Consequences of SEC Disclosure Regulation: Evidence from the OTC Bulletin Board. Journal of Accounting & Economics 39 (2):233-264.
Costello, A. M., J. Granja, and J. Weber. 2016. Do Strict Regulators Increase the Transparency of the Banking System? Available at SSRN: https://ssrn.com/abstract=2620853.
Dowle, M., A. Srinivasan, T. Short, and S. Lianoglou with contributions from R. Saporta and E. Antonyan. 2015. data.table: Extension of Data.frame. R package version 1.9.6. https://CRAN.R-project.org/package=data.table.
Falato, A., and D. Scharfstein. 2016. The Stock Market and Bank Risk-Taking. NBER Working Paper No. 22689.
Graham, N., M. Arai, and B. Hagströmer. 2016. multiwayvcov: Multi-Way Standard Error Clustering. R package version 1.2.3. https://CRAN.R-project.org/package=multiwayvcov.
Ho, D. E., K. Imai, G. King, and E. A. Stuart. 2007. Matching as Nonparametric Preprocessing for Reducing Model Dependence in Parametric Causal Inference. Political Analysis 15 (3):199-236.

44
Hothorn, T., F. Bretz, and P. Westfall. 2008. Simultaneous Inference in General Parametric Models. Biometrical Journal 50(3), 346-363.
Huizinga, H., and L. Laeven. 2012. Bank Valuation and Accounting Discretion during a Financial Crisis. Journal of Financial Economics 106 (3):614-634.
Kanagaretnam, K., G. J. Lobo, and D. H. Yang. 2004. Joint Tests of Signaling and Income Smoothing through Bank Loan Loss Provisions. Contemporary Accounting Research 21 (4):843-884.
Li, L., and T. Greene. 2013. A Weighting Analogue to Pair Matching in Propensity Score Analysis. International Journal of Biostatistics 9 (2):215-234.
Liu, C. C., and S. G. Ryan. 2006. Income Smoothing over the Business Cycle: Changes in Banks' Coordinated Management of Provisions for Loan Losses and Loan Charge-Offs from the Pre-1990 Bust to the 1990s Boom. Accounting Review 81 (2):421-441.
Lumley, T. 2004. Analysis of Complex Survey Samples. Journal of Statistical Software 9(1): 1-19.
Lumley, T. 2016. Survey: Analysis of Complex Survey Samples. R package version 3.31-2. https://CRAN.R-project.org/package=survey.
Marschner, I. 2014. glm2: Fitting Generalized Linear Models. R package version 1.1.2. https://CRAN.R-project.org/package=glm2.
Narayanan, M. P. 1985. Managerial Incentives for Short-Term Results. Journal of Finance 40 (5):1469-1484.
Nichols, D. C., J. M. Wahlen, and M. M. Wieland. 2009. Publicly Traded versus Privately Held: Implications for Conditional Conservatism in Bank Accounting. Review of Accounting Studies 14 (1):88-122.
Olszak, M., M. Pipien, I. Kowalska, and S. Roszkowska. 2016. What Drives Heterogeneity of Cyclicality of Loan Loss Provisions in the EU? Journal of Financial Services Research. Forthcoming.
R Core Team. 2016. R: A Language and Environment for Statistical Computing. R Foundation for Statistical Computing, Vienna, Austria. https://www.R-project.org/.
Rezende, M. 2014. The Effects of Bank Charter Switching on Supervisory Ratings. FEDS Working Paper No. 2014-20. Available at SSRN: https://ssrn.com/abstract=2412748.
Sekhon, J. S. 2011. Multivariate and Propensity Score Matching Software with Automated Balance Optimization: The Matching Package for R. Journal of Statistical Software 42(7), 1-52.
Shleifer, A., and R. W. Vishny. 1990. Equilibrium Short Horizons of Investors and Firms. American Economic Review 80 (2):148-153.
Stein, J. C. 1989. Efficient Capital-Markets, Inefficient Firms: A Model of Myopic Corporate Behavior. Quarterly Journal of Economics 104 (4):655-669.
Stuart, E. A. 2010. Matching Methods for Causal Inference: A Review and a Look Forward. Statistical Science 25 (1):1-21.
Wickham, H. 2007. Reshaping Data with the reshape Package. Journal of Statistical Software 21(12), 1-20.
Wickham, H. 2009. ggplot2: Elegant Graphics for Data Analysis. Springer-Verlag New York.
Wickham, H., and R. Francois. 2016. dplyr: A Grammar of Data Manipulation. R package version 0.5.0. https://CRAN.R-project.org/package=dplyr.
Yoshida, K., and J. Bohn. 2015. tableone: Create “Table 1” to Describe Baseline Characteristics. R package version 0.7.3. https://CRAN.R-project.org/package=tableone.
Zeileis, A., and T. Hothorn. 2002. Diagnostic Checking in Regression Relationships. R News 2(3), 7-10. http://CRAN.R-project.org/doc/Rnews/.

45
Appendix A Covariate Definitions
I. Covariates that reflect loan portfolio characteristics
Volume of loans past due 30-89 days and still accruing principal and interest payments (scaled by total loans) by loan category.
1) Residential real estate loans (RRE.PD30) 2) Commercial real estate loans (CRE.PD30) 3) Commercial and industrial loans (CI.PD30) 4) Consumer loans (CS.PD30) 5) Loans secured by farmland (FARM.PD30) 6) Agricultural loans (AG.PD30)
Volume of loans past due 90 days or more and still accruing principal and interest
payments (scaled by total loans) by loan category. 7) Residential real estate loans (RRE.PD90) 8) Commercial real estate loans (CRE.PD90) 9) Commercial and industrial loans (CI.PD90) 10) Consumer loans (CS.PD90) 11) Loans secured by farmland (FARM.PD90) 12) Agricultural loans (AG.PD90)
Volume of nonaccrual loans (scaled by total loans) by loan category.
13) Residential real estate loans (RRE.NAC) 14) Commercial real estate loans (CRE.NAC) 15) Commercial and industrial loans (CI.NAC) 16) Consumer loans (CS.NAC) 17) Loans secured by farmland (FARM.NAC) 18) Agricultural loans (AG.NAC)
Growth of total past due and nonaccrual loans: year-over-year change of total volume
of problem loans. 19) Total loans past due 30-89 days and still accruing principal and interest
payments (PD30.G) 20) Total loans past due 90 days or more and still accruing principal and interest
payments (PD90.G) 21) Total nonaccrual loans (NAC.G)
Current-year loan loss rate by loan category: current-year net charge-offs (charge-offs
minus recoveries) of each loan category divided by total loans. 22) Residential real estate loans (RRE.NCH) 23) Commercial real estate loans (CRE.NCH) 24) Commercial and industrial loans (CI.NCH) 25) Consumer loans (CS.NCH) 26) Loans secured by farmland (FARM.NCH) 27) Agricultural loans (AG.NCH)

46
Loan growth: year-over-year change of loan volume of each loan category.
28) Residential real estate loans (RRE.G) 29) Commercial real estate loans (CRE.G) 30) Commercial and industrial loans (CI.G) 31) Consumer loans (CS.G) 32) Loans secured by farmland (FARM.G) 33) Agricultural loans (AG.G)
Credits of concentration: loan volume of each loan category divided by the sum of Tier
1 risk-based capital and the ALLL. 34) Residential real estate loans (RRE.CON) 35) Commercial real estate loans (CRE.CON) 36) Commercial and industrial loans (CI.CON) 37) Consumer loans (CS.CON) 38) Loans secured by farmland (FARM.CON) 39) Agricultural loans (AG.CON)
II. Covariates that reflect institutional characteristics
40) Type (TYPE): an indicator variable. “1” if a bank’s holding parent is a financial holding company (FHC), “0” if a bank’s holding parent is a bank holding company (BHC).
41) Bank size (SIZE): the natural logarithm of total assets.
Capital adequacy 42) Tier 1 leverage ratio (T1LR): the ratio of Tier 1 capital divided by total assets
for the leverage ratio purpose. 43) Tier 1 risk-based capital ratio (T1CR): the ratio of Tier 1 capital divided by
total risk-weighted assets. 44) Total risk-based capital ratio (TTCR): the ratio of total capital divided by total
risk-weighted assets. 45) Total delinquent loans to the ALLL (DELAL): total delinquent loans are the
sum of total loans past due 30-89 days and still accruing principal and interest payments, total loans past due 90 days or more and still accruing principal and interest payments, and total nonaccrual loans.
Asset quality 46) Private securities to total assets (PSEC): private securities are available-for-
sale and held-to-maturity securities, excluding U.S. Treasury securities, U.S. Government agency obligations, and mortgage-backed securities issued or guaranteed by the U.S. Government or U.S. Government-sponsored agencies.
Management quality
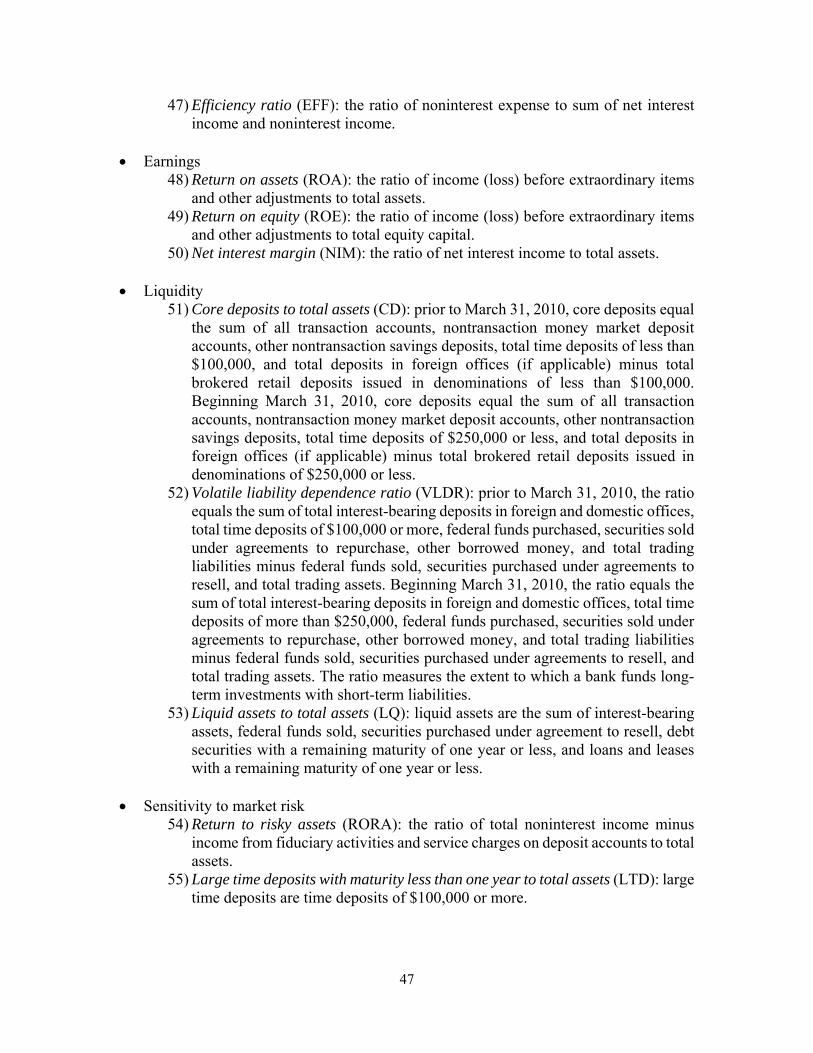
47
47) Efficiency ratio (EFF): the ratio of noninterest expense to sum of net interest income and noninterest income.
Earnings 48) Return on assets (ROA): the ratio of income (loss) before extraordinary items
and other adjustments to total assets. 49) Return on equity (ROE): the ratio of income (loss) before extraordinary items
and other adjustments to total equity capital. 50) Net interest margin (NIM): the ratio of net interest income to total assets.
Liquidity
51) Core deposits to total assets (CD): prior to March 31, 2010, core deposits equal the sum of all transaction accounts, nontransaction money market deposit accounts, other nontransaction savings deposits, total time deposits of less than $100,000, and total deposits in foreign offices (if applicable) minus total brokered retail deposits issued in denominations of less than $100,000. Beginning March 31, 2010, core deposits equal the sum of all transaction accounts, nontransaction money market deposit accounts, other nontransaction savings deposits, total time deposits of $250,000 or less, and total deposits in foreign offices (if applicable) minus total brokered retail deposits issued in denominations of $250,000 or less.
52) Volatile liability dependence ratio (VLDR): prior to March 31, 2010, the ratio equals the sum of total interest-bearing deposits in foreign and domestic offices, total time deposits of $100,000 or more, federal funds purchased, securities sold under agreements to repurchase, other borrowed money, and total trading liabilities minus federal funds sold, securities purchased under agreements to resell, and total trading assets. Beginning March 31, 2010, the ratio equals the sum of total interest-bearing deposits in foreign and domestic offices, total time deposits of more than $250,000, federal funds purchased, securities sold under agreements to repurchase, other borrowed money, and total trading liabilities minus federal funds sold, securities purchased under agreements to resell, and total trading assets. The ratio measures the extent to which a bank funds long-term investments with short-term liabilities.
53) Liquid assets to total assets (LQ): liquid assets are the sum of interest-bearing assets, federal funds sold, securities purchased under agreement to resell, debt securities with a remaining maturity of one year or less, and loans and leases with a remaining maturity of one year or less.
Sensitivity to market risk 54) Return to risky assets (RORA): the ratio of total noninterest income minus
income from fiduciary activities and service charges on deposit accounts to total assets.
55) Large time deposits with maturity less than one year to total assets (LTD): large time deposits are time deposits of $100,000 or more.

48
III. Covariates that reflect regional economic conditions
The following covariates are not used in the propensity score estimation model, but are checked for balances between public and private banks.
56) State unemployment rate (UNST) 57) State GDP growth (GDPST) 58) State year-over-year change of housing permit (value) (PMST)
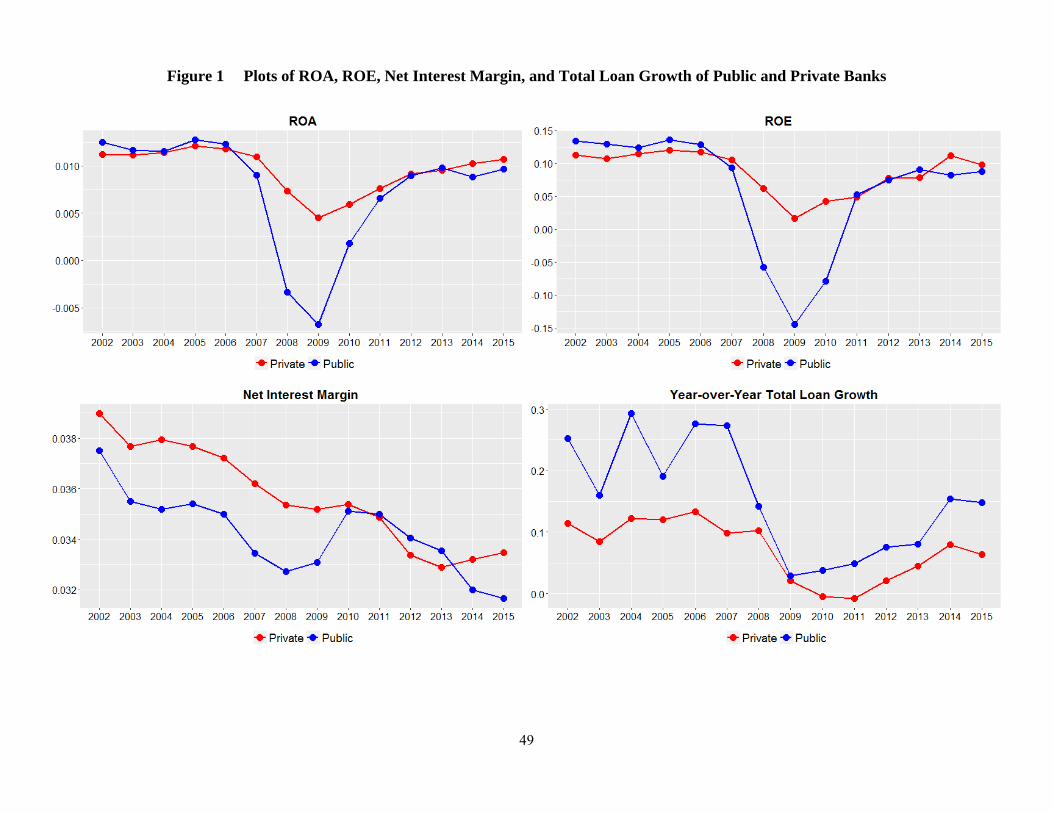
49
Figure 1 Plots of ROA, ROE, Net Interest Margin, and Total Loan Growth of Public and Private Banks
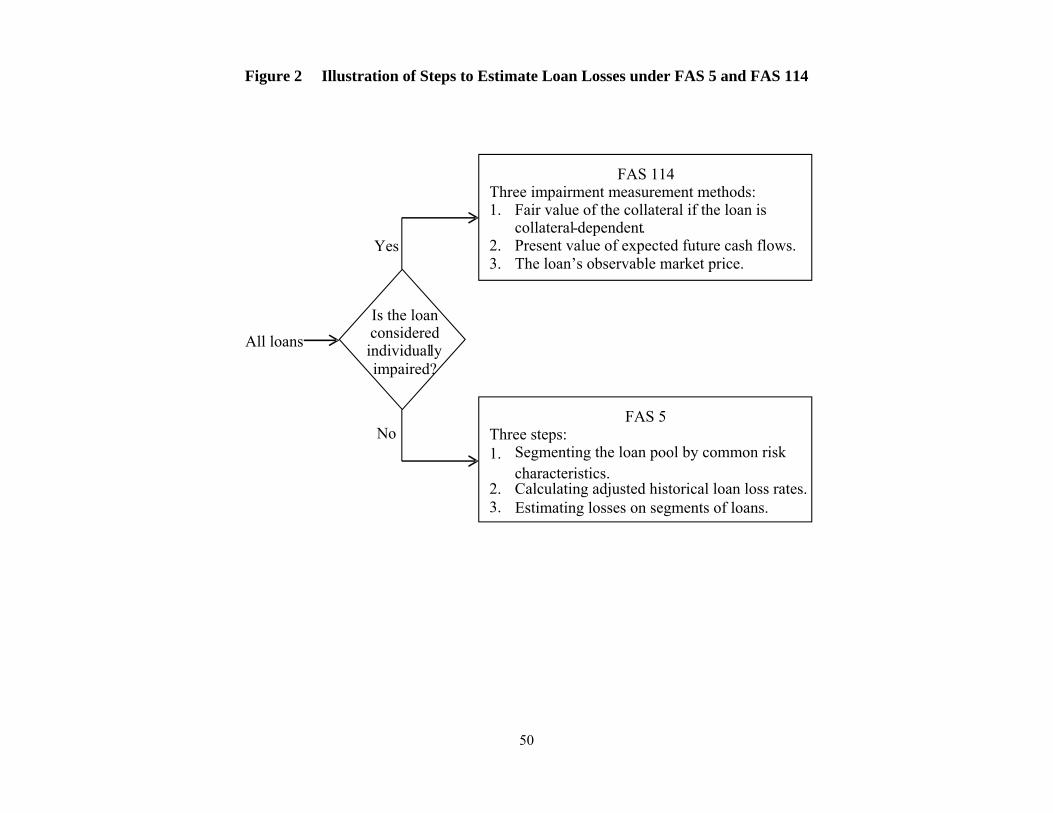
50
Figure 2 Illustration of Steps to Estimate Loan Losses under FAS 5 and FAS 114
FAS 114 Three impairment measurement methods: 1. Fair value of the collateral if the loan is
collateral-dependent. 2. Present value of expected future cash flows.3. The loan’s observable market price.
FAS 5 Three steps: 1. Segmenting the loan pool by common risk
characteristics. 2. Calculating adjusted historical loan loss rates.3. Estimating losses on segments of loans.
Is the loan considered individuallyimpaired?
All loans
Yes
No
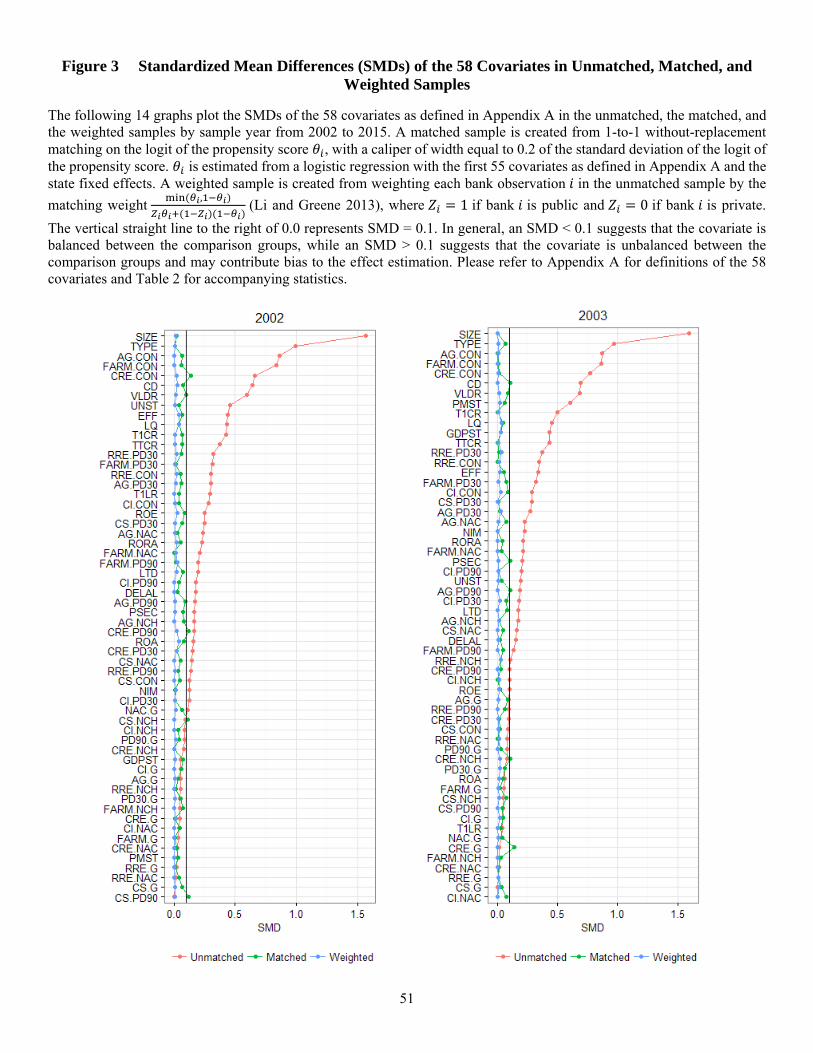
51
Figure 3 Standardized Mean Differences (SMDs) of the 58 Covariates in Unmatched, Matched, and Weighted Samples
The following 14 graphs plot the SMDs of the 58 covariates as defined in Appendix A in the unmatched, the matched, and the weighted samples by sample year from 2002 to 2015. A matched sample is created from 1-to-1 without-replacement matching on the logit of the propensity score , with a caliper of width equal to 0.2 of the standard deviation of the logit of the propensity score. is estimated from a logistic regression with the first 55 covariates as defined in Appendix A and the state fixed effects. A weighted sample is created from weighting each bank observation in the unmatched sample by the
matching weight ,
(Li and Greene 2013), where 1 if bank is public and 0 if bank is private.
The vertical straight line to the right of 0.0 represents SMD = 0.1. In general, an SMD < 0.1 suggests that the covariate is balanced between the comparison groups, while an SMD > 0.1 suggests that the covariate is unbalanced between the comparison groups and may contribute bias to the effect estimation. Please refer to Appendix A for definitions of the 58 covariates and Table 2 for accompanying statistics.

52
Figure 2 (continued)
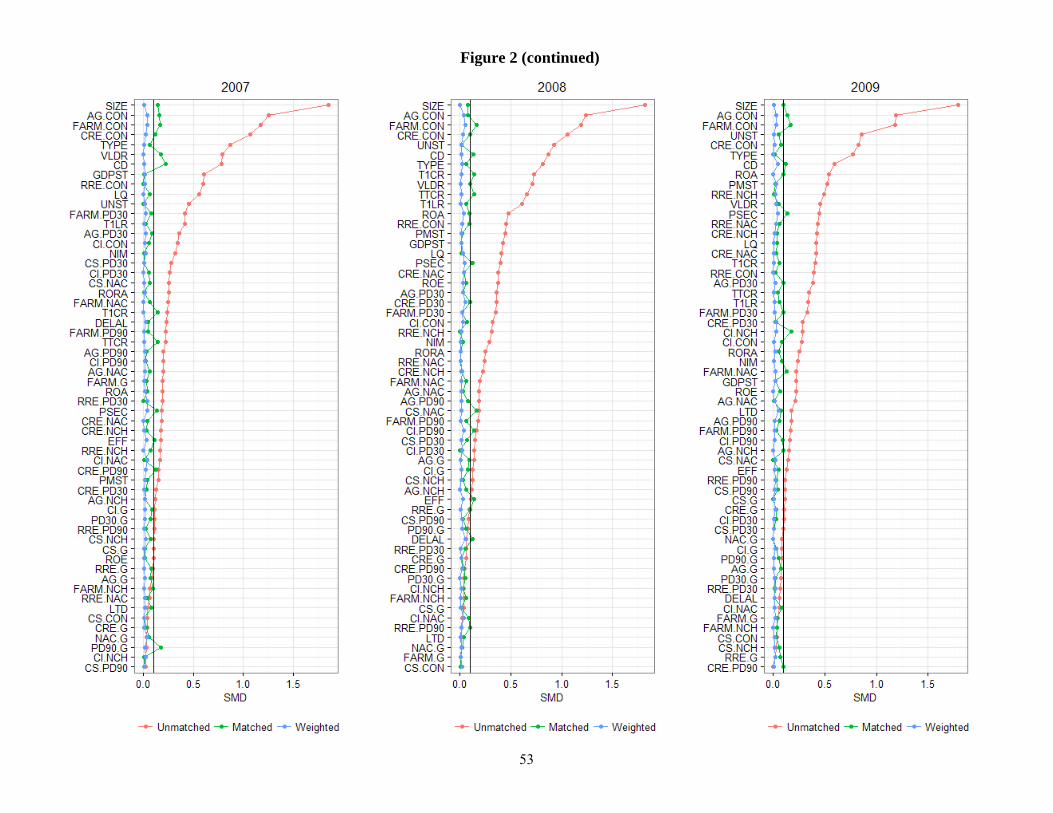
53
Figure 2 (continued)

54
Figure 2 (continued)
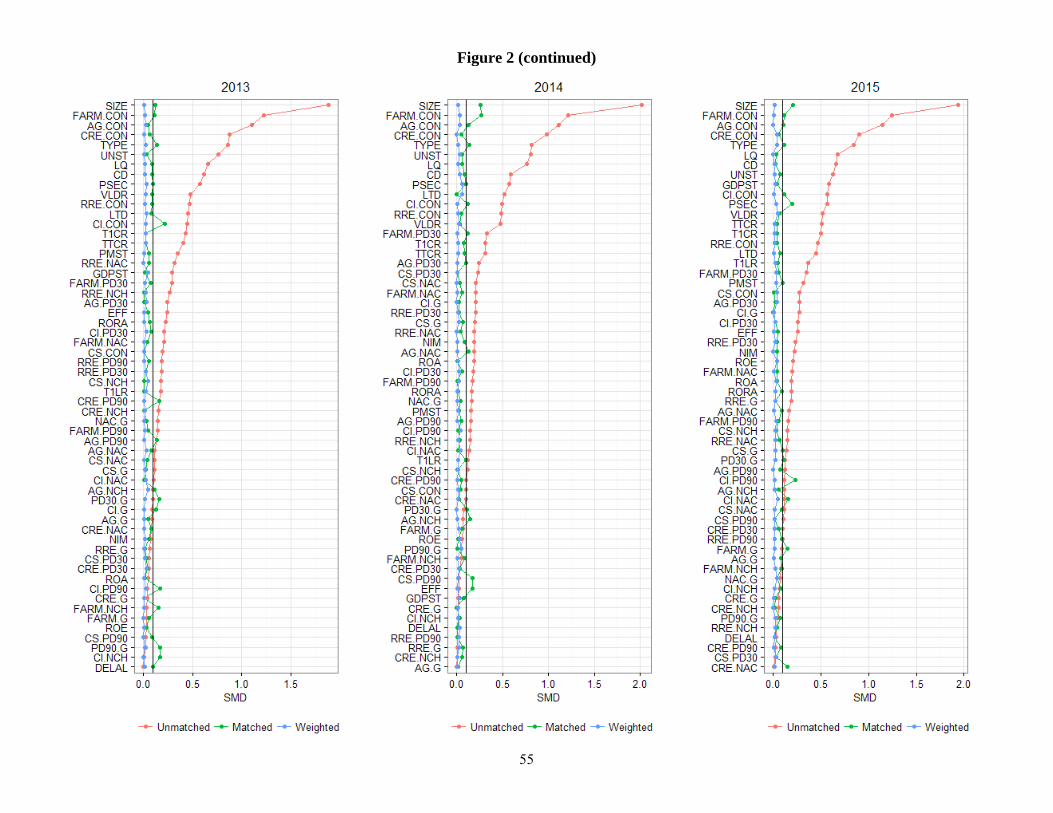
55
Figure 2 (continued)

56
Figure 4 Plots of Ratios of Total Non-Current Loans and Total Net Charge-Offs to Total Loans of Public and Private Banks

57
Table 1 Comparison of Concentrations of Credit between Public and Private Banks
This table presents the average concentrations of credit of loan categories held by public and private banks on the last day of each sample year from 2002 to 2015. The concentration of credit of each loan category is calculated as the amount of loans in each category divided by the sum of Tier 1 risk-based capital and the ALLL. P-values are calculated under the Kruskal-Wallis Rank Sum Test. The null hypothesis of the test is that the two comparison groups originate from the same distribution. SMD stands for standardized mean difference. In general, an SMD < 0.1 suggests that the variable is balanced between the two comparison groups, while an SMD > 0.1 suggests that the variable is unbalanced between the two comparison groups and may contribute bias to the effect estimation.
2002 2003 2004 2005 2006 2007 2008 2009 2010 2011 2012 2013 2014 2015
Total Loans and Leases
Public 7.165 7.179 7.435 7.429 7.516 7.620 7.515 7.025 6.450 6.008 6.074 6.215 6.567 6.677
Private 6.341 6.186 6.272 6.280 6.311 6.360 6.544 6.391 6.082 5.728 5.604 5.538 5.682 5.678
p <0.001 <0.001 <0.001 <0.001 <0.001 <0.001 <0.001 <0.001 0.001 0.005 <0.001 <0.001 <0.001 <0.001
SMD 0.318 0.461 0.547 0.532 0.409 0.588 0.456 0.271 0.162 0.151 0.243 0.376 0.326 0.544
1. Loans Secured by Real Estate
Public 4.871 5.058 5.417 5.520 5.651 5.742 5.666 5.330 4.857 4.402 4.373 4.424 4.670 4.671
Private 3.884 3.894 4.060 4.134 4.199 4.264 4.474 4.424 4.231 3.982 3.897 3.816 3.920 3.926
p <0.001 <0.001 <0.001 <0.001 <0.001 <0.001 <0.001 <0.001 <0.001 <0.001 <0.001 <0.001 <0.001 <0.001
SMD 0.467 0.584 0.666 0.665 0.617 0.705 0.566 0.400 0.278 0.231 0.258 0.355 0.294 0.423
1.1 Secured by 1-4 Family Residential Properties
Public 2.030 1.974 2.065 1.934 1.851 1.825 1.836 1.800 1.755 1.683 1.705 1.655 1.678 1.678
Private 1.706 1.603 1.609 1.570 1.537 1.524 1.613 1.632 1.580 1.511 1.486 1.433 1.469 1.474
p <0.001 <0.001 <0.001 <0.001 <0.001 <0.001 <0.001 0.001 0.001 0.002 <0.001 <0.001 <0.001 <0.001
SMD 0.243 0.298 0.352 0.279 0.234 0.223 0.175 0.137 0.143 0.153 0.193 0.215 0.204 0.197
1.2 Secured by Commercial Properties
Public 2.727 2.958 3.226 3.455 3.670 3.792 3.702 3.407 2.996 2.615 2.574 2.670 2.891 2.884
Private 1.693 1.806 1.958 2.075 2.172 2.238 2.340 2.253 2.102 1.932 1.860 1.821 1.875 1.851
p <0.001 <0.001 <0.001 <0.001 <0.001 <0.001 <0.001 <0.001 <0.001 <0.001 <0.001 <0.001 <0.001 <0.001
SMD 0.644 0.708 0.749 0.776 0.792 0.864 0.758 0.615 0.497 0.491 0.517 0.643 0.469 0.746
1.2.1 Construction and Land Development
Public 0.628 0.721 0.902 1.123 1.331 1.407 1.199 0.841 0.571 0.408 0.356 0.357 0.403 0.446
Private 0.384 0.425 0.508 0.603 0.690 0.734 0.692 0.548 0.427 0.337 0.309 0.308 0.329 0.337
p <0.001 <0.001 <0.001 <0.001 <0.001 <0.001 <0.001 <0.001 <0.001 <0.001 0.012 0.005 0.001 <0.001
SMD 0.395 0.438 0.498 0.556 0.619 0.646 0.564 0.394 0.260 0.197 0.145 0.161 0.207 0.303
1.2.2 Secured by Multi-Family Residential Properties
Public 0.168 0.187 0.197 0.201 0.192 0.202 0.212 0.225 0.216 0.219 0.237 0.292 0.345 0.349
Private 0.092 0.100 0.106 0.106 0.107 0.112 0.130 0.142 0.140 0.139 0.139 0.139 0.151 0.149
p <0.001 <0.001 <0.001 <0.001 <0.001 <0.001 <0.001 <0.001 <0.001 <0.001 <0.001 <0.001 <0.001 <0.001
SMD 0.282 0.293 0.326 0.313 0.310 0.305 0.298 0.289 0.312 0.327 0.397 0.467 0.417 0.472
1.2.3 Secured by Nonfarm Nonresidential Properties
Public 1.932 2.051 2.128 2.131 2.147 2.183 2.291 2.340 2.209 1.988 1.981 2.021 2.142 2.090
Private 1.217 1.280 1.344 1.365 1.376 1.393 1.519 1.563 1.534 1.455 1.412 1.374 1.394 1.364
p <0.001 <0.001 <0.001 <0.001 <0.001 <0.001 <0.001 <0.001 <0.001 <0.001 <0.001 <0.001 <0.001 <0.001
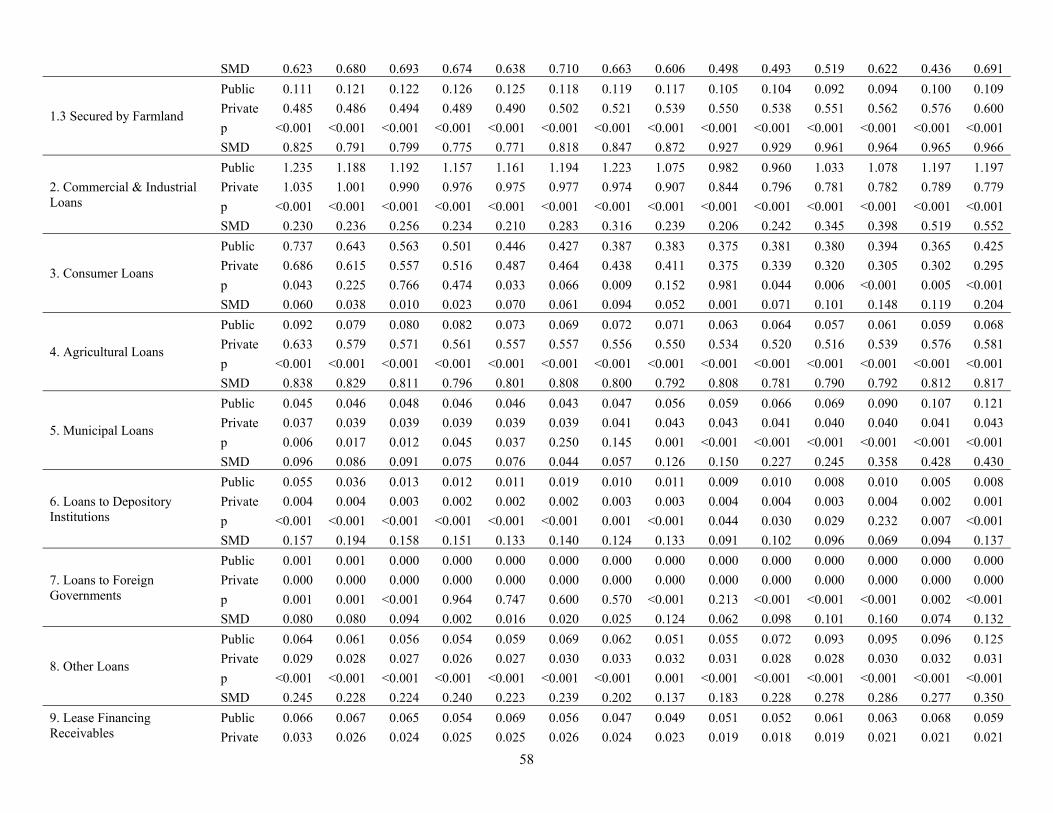
58
SMD 0.623 0.680 0.693 0.674 0.638 0.710 0.663 0.606 0.498 0.493 0.519 0.622 0.436 0.691
1.3 Secured by Farmland
Public 0.111 0.121 0.122 0.126 0.125 0.118 0.119 0.117 0.105 0.104 0.092 0.094 0.100 0.109
Private 0.485 0.486 0.494 0.489 0.490 0.502 0.521 0.539 0.550 0.538 0.551 0.562 0.576 0.600
p <0.001 <0.001 <0.001 <0.001 <0.001 <0.001 <0.001 <0.001 <0.001 <0.001 <0.001 <0.001 <0.001 <0.001
SMD 0.825 0.791 0.799 0.775 0.771 0.818 0.847 0.872 0.927 0.929 0.961 0.964 0.965 0.966
2. Commercial & Industrial Loans
Public 1.235 1.188 1.192 1.157 1.161 1.194 1.223 1.075 0.982 0.960 1.033 1.078 1.197 1.197
Private 1.035 1.001 0.990 0.976 0.975 0.977 0.974 0.907 0.844 0.796 0.781 0.782 0.789 0.779
p <0.001 <0.001 <0.001 <0.001 <0.001 <0.001 <0.001 <0.001 <0.001 <0.001 <0.001 <0.001 <0.001 <0.001
SMD 0.230 0.236 0.256 0.234 0.210 0.283 0.316 0.239 0.206 0.242 0.345 0.398 0.519 0.552
3. Consumer Loans
Public 0.737 0.643 0.563 0.501 0.446 0.427 0.387 0.383 0.375 0.381 0.380 0.394 0.365 0.425
Private 0.686 0.615 0.557 0.516 0.487 0.464 0.438 0.411 0.375 0.339 0.320 0.305 0.302 0.295
p 0.043 0.225 0.766 0.474 0.033 0.066 0.009 0.152 0.981 0.044 0.006 <0.001 0.005 <0.001
SMD 0.060 0.038 0.010 0.023 0.070 0.061 0.094 0.052 0.001 0.071 0.101 0.148 0.119 0.204
4. Agricultural Loans
Public 0.092 0.079 0.080 0.082 0.073 0.069 0.072 0.071 0.063 0.064 0.057 0.061 0.059 0.068
Private 0.633 0.579 0.571 0.561 0.557 0.557 0.556 0.550 0.534 0.520 0.516 0.539 0.576 0.581
p <0.001 <0.001 <0.001 <0.001 <0.001 <0.001 <0.001 <0.001 <0.001 <0.001 <0.001 <0.001 <0.001 <0.001
SMD 0.838 0.829 0.811 0.796 0.801 0.808 0.800 0.792 0.808 0.781 0.790 0.792 0.812 0.817
5. Municipal Loans
Public 0.045 0.046 0.048 0.046 0.046 0.043 0.047 0.056 0.059 0.066 0.069 0.090 0.107 0.121
Private 0.037 0.039 0.039 0.039 0.039 0.039 0.041 0.043 0.043 0.041 0.040 0.040 0.041 0.043
p 0.006 0.017 0.012 0.045 0.037 0.250 0.145 0.001 <0.001 <0.001 <0.001 <0.001 <0.001 <0.001
SMD 0.096 0.086 0.091 0.075 0.076 0.044 0.057 0.126 0.150 0.227 0.245 0.358 0.428 0.430
6. Loans to Depository Institutions
Public 0.055 0.036 0.013 0.012 0.011 0.019 0.010 0.011 0.009 0.010 0.008 0.010 0.005 0.008
Private 0.004 0.004 0.003 0.002 0.002 0.002 0.003 0.003 0.004 0.004 0.003 0.004 0.002 0.001
p <0.001 <0.001 <0.001 <0.001 <0.001 <0.001 0.001 <0.001 0.044 0.030 0.029 0.232 0.007 <0.001
SMD 0.157 0.194 0.158 0.151 0.133 0.140 0.124 0.133 0.091 0.102 0.096 0.069 0.094 0.137
7. Loans to Foreign Governments
Public 0.001 0.001 0.000 0.000 0.000 0.000 0.000 0.000 0.000 0.000 0.000 0.000 0.000 0.000
Private 0.000 0.000 0.000 0.000 0.000 0.000 0.000 0.000 0.000 0.000 0.000 0.000 0.000 0.000
p 0.001 0.001 <0.001 0.964 0.747 0.600 0.570 <0.001 0.213 <0.001 <0.001 <0.001 0.002 <0.001
SMD 0.080 0.080 0.094 0.002 0.016 0.020 0.025 0.124 0.062 0.098 0.101 0.160 0.074 0.132
8. Other Loans
Public 0.064 0.061 0.056 0.054 0.059 0.069 0.062 0.051 0.055 0.072 0.093 0.095 0.096 0.125
Private 0.029 0.028 0.027 0.026 0.027 0.030 0.033 0.032 0.031 0.028 0.028 0.030 0.032 0.031
p <0.001 <0.001 <0.001 <0.001 <0.001 <0.001 <0.001 0.001 <0.001 <0.001 <0.001 <0.001 <0.001 <0.001
SMD 0.245 0.228 0.224 0.240 0.223 0.239 0.202 0.137 0.183 0.228 0.278 0.286 0.277 0.350
9. Lease Financing Receivables
Public 0.066 0.067 0.065 0.054 0.069 0.056 0.047 0.049 0.051 0.052 0.061 0.063 0.068 0.059
Private 0.033 0.026 0.024 0.025 0.025 0.026 0.024 0.023 0.019 0.018 0.019 0.021 0.021 0.021
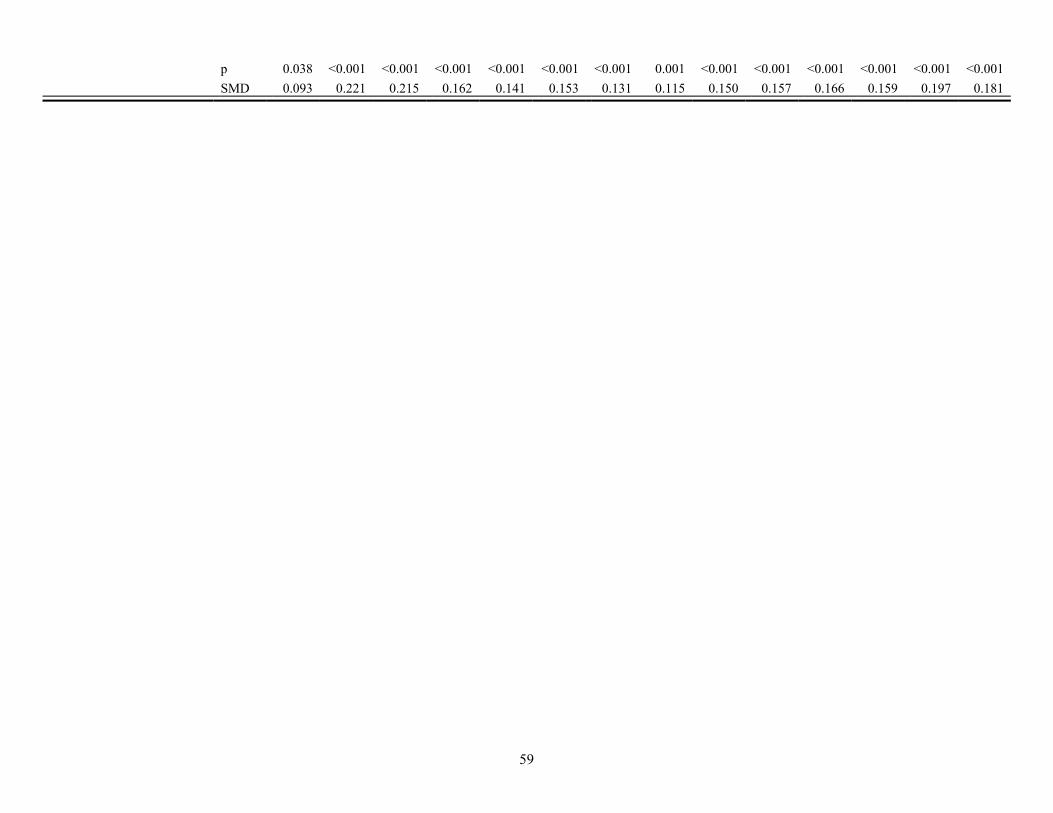
59
p 0.038 <0.001 <0.001 <0.001 <0.001 <0.001 <0.001 0.001 <0.001 <0.001 <0.001 <0.001 <0.001 <0.001
SMD 0.093 0.221 0.215 0.162 0.141 0.153 0.131 0.115 0.150 0.157 0.166 0.159 0.197 0.181

60
Table 2 Balance Statistics of the 58 Covariates in Unmatched, Matched, and Weighted Samples
This table presents balance statistics of the 58 covariates as defined in Appendix A between public and private banks in the unmatched, the matched, and the weighted samples by each sample year from 2002 to 2015. A matched sample is created from 1-to-1 without-replacement matching on the logit of the propensity score , with a caliper of width equal to 0.2 of the standard deviation of the logit of the propensity score. is estimated from a logistic regression with the first 55 covariates as defined in Appendix A and the state fixed effects. A weighted sample is created from weighting each bank observation in the unmatched sample by the matching
weight ,
(Li and Greene 2013), where 1 if bank is public and 0 if bank is private. “N” is the effective sample size. For a weighted
sample, N shows the sample size after applying the matching weights to the sample. The columns “Private” and “Public” list the mean and standard deviation (in parentheses) of each covariate of the samples of private and public banks respectively. The column “p” lists the p-values calculated under the Kruskal-Wallis Rank Sum Test. The null hypothesis of the test is that the two comparison groups originate from the same distribution. SMD stands for standardized mean difference. In general, an SMD < 0.1 suggests that the covariate is balanced between the comparison groups, while an SMD > 0.1 suggests that the covariate is unbalanced and may contribute bias to the effect estimation. Figure 2 plots the SMDs of the unmatched, the matched, and the weighted samples by sample year presented in this table. Please refer to Appendix A for definitions of the 58 covariates.
2002 Unmatched Matched Weighted Private Public p SMD Private Public p SMD Private Public p SMD
N 3493 661 287 287 261.0 263.6
TYPE = FHC (%)
336 (9.6)
333 (50.4)
<0.001 0.993 98
(34.1) 97
(33.8) 1.000 0.007
85.2 (32.7)
84.6 (32.1)
0.873 0.012
CRE.PD30 0.0028
(0.0059) 0.0021
(0.0037) 0.002 0.150
0.0026 (0.0049)
0.0025 (0.0047)
0.667 0.036 0.0027
(0.0049) 0.0025
(0.0049) 0.629 0.037
CRE.PD90 0.0006
(0.0025) 0.0003
(0.0012) 0.001 0.163
0.0005 (0.0015)
0.0004 (0.0013)
0.431 0.066 0.0004
(0.0013) 0.0004
(0.0014) 0.796 0.018
CRE.NAC 0.0022
(0.0060) 0.0024
(0.0043) 0.564 0.027
0.0033 (0.0088)
0.0029 (0.0056)
0.599 0.044 0.0029
(0.0075) 0.0030
(0.0056) 0.949 0.004
CRE.NCH 0.0003
(0.0021) 0.0005
(0.0015) 0.072 0.084
0.0006 (0.0048)
0.0005 (0.0015)
0.718 0.030 0.0006
(0.0038) 0.0005
(0.0016) 0.919 0.007
RRE.PD30 0.0053
(0.0065) 0.0035
(0.0044) <0.001 0.324
0.0042 (0.0053)
0.0038 (0.0054)
0.388 0.072 0.0043
(0.0055) 0.0042
(0.0056) 0.736 0.026
RRE.PD90 0.0009
(0.0034) 0.0006
(0.0012) 0.007 0.143
0.0005 (0.0011)
0.0006 (0.0013)
0.658 0.037 0.0006
(0.0013) 0.0006
(0.0013) 0.939 0.005
RRE.NAC 0.0015
(0.0034) 0.0015
(0.0023) 0.721 0.017
0.0018 (0.0034)
0.0016 (0.0027)
0.477 0.059 0.0017
(0.0036) 0.0017
(0.0028) 0.928 0.007
RRE.NCH 0.0003
(0.0012) 0.0003
(0.0009) 0.236 0.054
0.0005 (0.0017)
0.0004 (0.0012)
0.393 0.071 0.0004
(0.0013) 0.0004
(0.0011) 0.975 0.002
CI.PD30 0.0027
(0.0047) 0.0022
(0.0047) 0.003 0.126
0.0023 (0.0040)
0.0023 (0.0046)
0.858 0.015 0.0021
(0.0036) 0.0021
(0.0041) 0.806 0.015
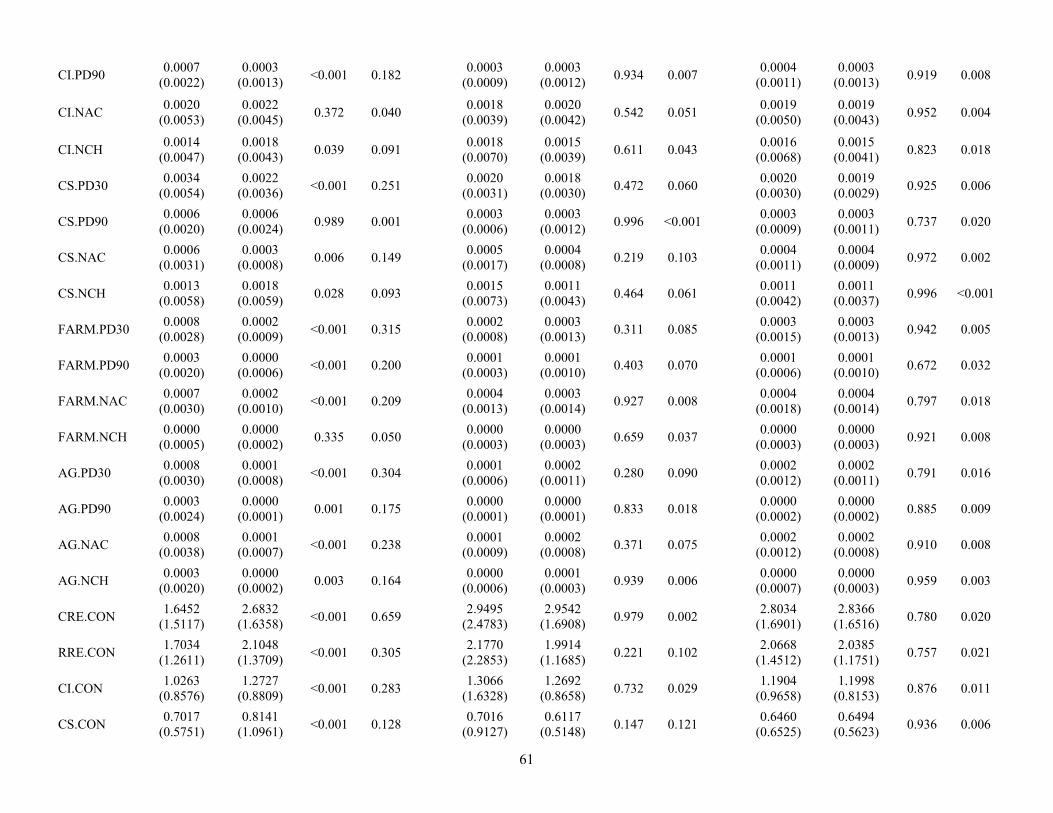
61
CI.PD90 0.0007
(0.0022) 0.0003
(0.0013) <0.001 0.182
0.0003 (0.0009)
0.0003 (0.0012)
0.934 0.007 0.0004
(0.0011) 0.0003
(0.0013) 0.919 0.008
CI.NAC 0.0020
(0.0053) 0.0022
(0.0045) 0.372 0.040
0.0018 (0.0039)
0.0020 (0.0042)
0.542 0.051 0.0019
(0.0050) 0.0019
(0.0043) 0.952 0.004
CI.NCH 0.0014
(0.0047) 0.0018
(0.0043) 0.039 0.091
0.0018 (0.0070)
0.0015 (0.0039)
0.611 0.043 0.0016
(0.0068) 0.0015
(0.0041) 0.823 0.018
CS.PD30 0.0034
(0.0054) 0.0022
(0.0036) <0.001 0.251
0.0020 (0.0031)
0.0018 (0.0030)
0.472 0.060 0.0020
(0.0030) 0.0019
(0.0029) 0.925 0.006
CS.PD90 0.0006
(0.0020) 0.0006
(0.0024) 0.989 0.001
0.0003 (0.0006)
0.0003 (0.0012)
0.996 <0.001 0.0003
(0.0009) 0.0003
(0.0011) 0.737 0.020
CS.NAC 0.0006
(0.0031) 0.0003
(0.0008) 0.006 0.149
0.0005 (0.0017)
0.0004 (0.0008)
0.219 0.103 0.0004
(0.0011) 0.0004
(0.0009) 0.972 0.002
CS.NCH 0.0013
(0.0058) 0.0018
(0.0059) 0.028 0.093
0.0015 (0.0073)
0.0011 (0.0043)
0.464 0.061 0.0011
(0.0042) 0.0011
(0.0037) 0.996 <0.001
FARM.PD30 0.0008
(0.0028) 0.0002
(0.0009) <0.001 0.315
0.0002 (0.0008)
0.0003 (0.0013)
0.311 0.085 0.0003
(0.0015) 0.0003
(0.0013) 0.942 0.005
FARM.PD90 0.0003
(0.0020) 0.0000
(0.0006) <0.001 0.200
0.0001 (0.0003)
0.0001 (0.0010)
0.403 0.070 0.0001
(0.0006) 0.0001
(0.0010) 0.672 0.032
FARM.NAC 0.0007
(0.0030) 0.0002
(0.0010) <0.001 0.209
0.0004 (0.0013)
0.0003 (0.0014)
0.927 0.008 0.0004
(0.0018) 0.0004
(0.0014) 0.797 0.018
FARM.NCH 0.0000
(0.0005) 0.0000
(0.0002) 0.335 0.050
0.0000 (0.0003)
0.0000 (0.0003)
0.659 0.037 0.0000
(0.0003) 0.0000
(0.0003) 0.921 0.008
AG.PD30 0.0008
(0.0030) 0.0001
(0.0008) <0.001 0.304
0.0001 (0.0006)
0.0002 (0.0011)
0.280 0.090 0.0002
(0.0012) 0.0002
(0.0011) 0.791 0.016
AG.PD90 0.0003
(0.0024) 0.0000
(0.0001) 0.001 0.175
0.0000 (0.0001)
0.0000 (0.0001)
0.833 0.018 0.0000
(0.0002) 0.0000
(0.0002) 0.885 0.009
AG.NAC 0.0008
(0.0038) 0.0001
(0.0007) <0.001 0.238
0.0001 (0.0009)
0.0002 (0.0008)
0.371 0.075 0.0002
(0.0012) 0.0002
(0.0008) 0.910 0.008
AG.NCH 0.0003
(0.0020) 0.0000
(0.0002) 0.003 0.164
0.0000 (0.0006)
0.0001 (0.0003)
0.939 0.006 0.0000
(0.0007) 0.0000
(0.0003) 0.959 0.003
CRE.CON 1.6452
(1.5117) 2.6832
(1.6358) <0.001 0.659
2.9495 (2.4783)
2.9542 (1.6908)
0.979 0.002 2.8034
(1.6901) 2.8366
(1.6516) 0.780 0.020
RRE.CON 1.7034
(1.2611) 2.1048
(1.3709) <0.001 0.305
2.1770 (2.2853)
1.9914 (1.1685)
0.221 0.102 2.0668
(1.4512) 2.0385
(1.1751) 0.757 0.021
CI.CON 1.0263
(0.8576) 1.2727
(0.8809) <0.001 0.283
1.3066 (1.6328)
1.2692 (0.8658)
0.732 0.029 1.1904
(0.9658) 1.1998
(0.8153) 0.876 0.011
CS.CON 0.7017
(0.5751) 0.8141
(1.0961) <0.001 0.128
0.7016 (0.9127)
0.6117 (0.5148)
0.147 0.121 0.6460
(0.6525) 0.6494
(0.5623) 0.936 0.006

62
FARM.CON 0.5115
(0.6031) 0.1245
(0.2513) <0.001 0.838
0.2069 (0.3716)
0.1981 (0.3219)
0.761 0.025 0.2093
(0.3647) 0.2086
(0.3308) 0.976 0.002
AG.CON 0.6683
(0.8933) 0.1045
(0.2411) <0.001 0.862
0.1456 (0.3236)
0.1656 (0.3163)
0.453 0.063 0.1671
(0.3847) 0.1690
(0.3183) 0.934 0.005
CRE.G 0.2784
(2.7617) 0.1799
(0.4199) 0.360 0.050
0.1938 (0.2742)
0.2094 (0.3949)
0.584 0.046 0.2038
(0.3382) 0.1982
(0.3985) 0.834 0.015
RRE.G 0.1221
(1.0716) 0.1049
(0.3962) 0.684 0.021
0.1163 (0.3089)
0.1287 (0.4424)
0.696 0.033 0.1106
(0.2959) 0.1123
(0.4410) 0.954 0.004
CI.G 0.1553
(2.2803) 122.5694
(3148.2434) 0.022 0.055
0.1133 (0.4017)
0.1928 (1.4585)
0.373 0.074 0.1499
(2.3927) 0.1888
(17.0990) 0.711 0.003
CS.G 0.0222
(1.1765) 0.0343
(0.6235) 0.797 0.013
0.0342 (0.7141)
0.0088 (0.6125)
0.647 0.038 0.0022
(0.8733) -0.0013 (0.5874)
0.930 0.005
FARM.G 0.3550
(3.6785) 0.2506
(1.6004) 0.473 0.037
0.2378 (1.3965)
0.2249 (1.1721)
0.904 0.010 0.1701
(1.1389) 0.1709
(1.0769) 0.991 0.001
AG.G 0.2811
(7.6020) 1.9503
(42.3316) 0.031 0.055
0.6166 (7.8604)
0.3941 (3.1617)
0.657 0.037 0.9704
(13.4706) 0.7995
(23.5845) 0.828 0.009
PD30.G 0.6871
(6.4088) 1.3119
(16.1143) 0.091 0.051
0.4060 (3.6677)
0.5636 (5.0079)
0.667 0.036 0.6601
(6.3897) 0.7162
(7.4057) 0.895 0.008
PD90.G 2.4215
(15.8367) 1.2360
(11.1636) 0.066 0.087
1.9819 (14.4430)
1.8836 (14.0309)
0.934 0.007 1.9031
(14.3894) 2.0436
(14.6448) 0.902 0.010
NAC.G 2.8272
(23.7485) 0.9027
(3.4517) 0.038 0.113
1.2580 (5.5592)
1.2252 (4.0401)
0.936 0.007 1.2471
(7.4532) 1.3506
(4.6137) 0.756 0.017
SIZE 11.3831 (0.9436)
13.5814 (1.7488)
<0.001 1.565 12.5080 (0.9258)
12.5968 (1.1469)
0.308 0.085 12.5091 (0.9325)
12.5274 (1.1591)
0.809 0.017
T1LR 0.0972
(0.0280) 0.0863
(0.0441) <0.001 0.294
0.0869 (0.0193)
0.0874 (0.0297)
0.818 0.019 0.0882
(0.0204) 0.0883
(0.0358) 0.963 0.003
T1CR 0.1515
(0.0656) 0.1228
(0.0684) <0.001 0.429
0.1256 (0.0390)
0.1267 (0.0717)
0.821 0.019 0.1287
(0.0438) 0.1286
(0.0662) 0.975 0.002
TTCR 0.1627
(0.0655) 0.1378
(0.0675) <0.001 0.375
0.1373 (0.0389)
0.1385 (0.0711)
0.788 0.023 0.1405
(0.0436) 0.1404
(0.0658) 0.969 0.003
DELAL 2.0363
(1.7656) 1.4637
(4.2224) <0.001 0.177
1.4990 (1.0769)
1.4601 (1.0802)
0.665 0.036 1.5022
(1.1509) 1.4908
(1.1137) 0.886 0.010
PSEC 0.0631
(0.0617) 0.0530
(0.0593) <0.001 0.167
0.0524 (0.0495)
0.0519 (0.0515)
0.907 0.010 0.0542
(0.0513) 0.0539
(0.0541) 0.947 0.005
EFF 0.6455
(0.1439) 0.5846
(0.1312) <0.001 0.443
0.6173 (0.1242)
0.6040 (0.1347)
0.222 0.102 0.6154
(0.1236) 0.6104
(0.1385) 0.602 0.038
ROA 0.0112
(0.0076) 0.0125
(0.0082) <0.001 0.163
0.0104 (0.0100)
0.0114 (0.0068)
0.173 0.114 0.0108
(0.0091) 0.0112
(0.0072) 0.522 0.047
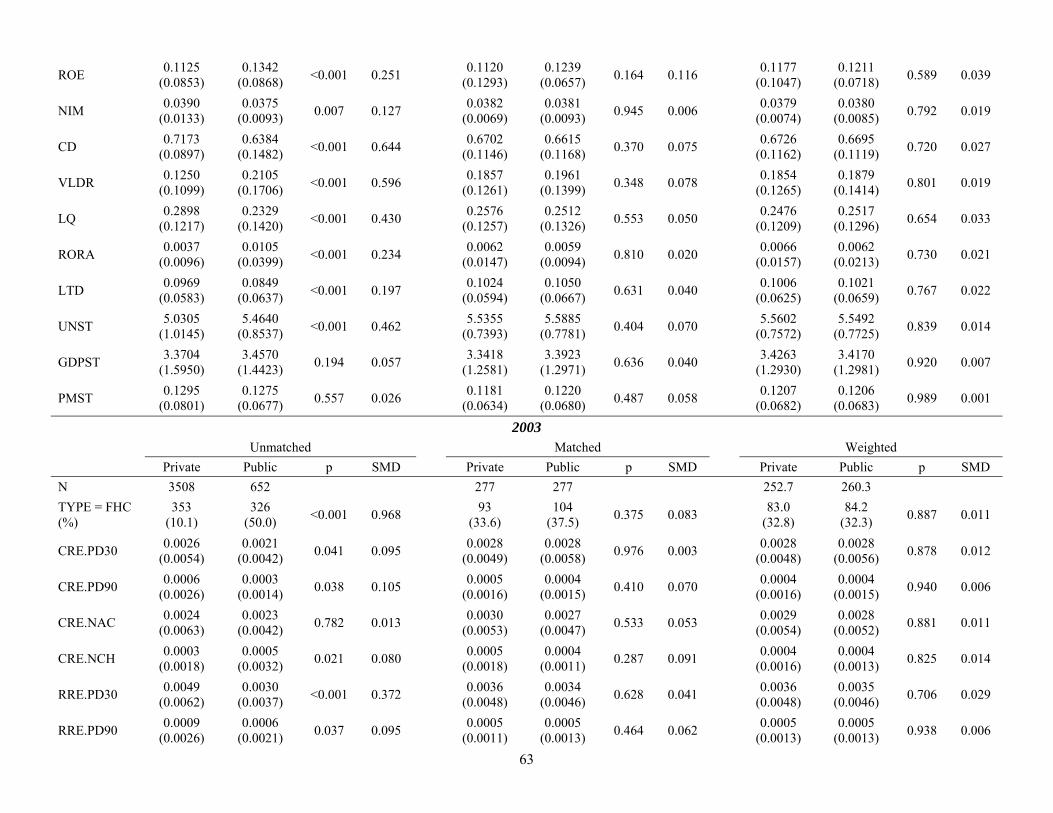
63
ROE 0.1125
(0.0853) 0.1342
(0.0868) <0.001 0.251
0.1120 (0.1293)
0.1239 (0.0657)
0.164 0.116 0.1177
(0.1047) 0.1211
(0.0718) 0.589 0.039
NIM 0.0390
(0.0133) 0.0375
(0.0093) 0.007 0.127
0.0382 (0.0069)
0.0381 (0.0093)
0.945 0.006 0.0379
(0.0074) 0.0380
(0.0085) 0.792 0.019
CD 0.7173
(0.0897) 0.6384
(0.1482) <0.001 0.644
0.6702 (0.1146)
0.6615 (0.1168)
0.370 0.075 0.6726
(0.1162) 0.6695
(0.1119) 0.720 0.027
VLDR 0.1250
(0.1099) 0.2105
(0.1706) <0.001 0.596
0.1857 (0.1261)
0.1961 (0.1399)
0.348 0.078 0.1854
(0.1265) 0.1879
(0.1414) 0.801 0.019
LQ 0.2898
(0.1217) 0.2329
(0.1420) <0.001 0.430
0.2576 (0.1257)
0.2512 (0.1326)
0.553 0.050 0.2476
(0.1209) 0.2517
(0.1296) 0.654 0.033
RORA 0.0037
(0.0096) 0.0105
(0.0399) <0.001 0.234
0.0062 (0.0147)
0.0059 (0.0094)
0.810 0.020 0.0066
(0.0157) 0.0062
(0.0213) 0.730 0.021
LTD 0.0969
(0.0583) 0.0849
(0.0637) <0.001 0.197
0.1024 (0.0594)
0.1050 (0.0667)
0.631 0.040 0.1006
(0.0625) 0.1021
(0.0659) 0.767 0.022
UNST 5.0305
(1.0145) 5.4640
(0.8537) <0.001 0.462
5.5355 (0.7393)
5.5885 (0.7781)
0.404 0.070 5.5602
(0.7572) 5.5492
(0.7725) 0.839 0.014
GDPST 3.3704
(1.5950) 3.4570
(1.4423) 0.194 0.057
3.3418 (1.2581)
3.3923 (1.2971)
0.636 0.040 3.4263
(1.2930) 3.4170
(1.2981) 0.920 0.007
PMST 0.1295
(0.0801) 0.1275
(0.0677) 0.557 0.026
0.1181 (0.0634)
0.1220 (0.0680)
0.487 0.058 0.1207
(0.0682) 0.1206
(0.0683) 0.989 0.001
2003 Unmatched Matched Weighted
Private Public p SMD Private Public p SMD Private Public p SMD
N 3508 652 277 277 252.7 260.3
TYPE = FHC (%)
353 (10.1)
326 (50.0)
<0.001 0.968 93
(33.6) 104
(37.5) 0.375 0.083
83.0 (32.8)
84.2 (32.3)
0.887 0.011
CRE.PD30 0.0026
(0.0054) 0.0021
(0.0042) 0.041 0.095
0.0028 (0.0049)
0.0028 (0.0058)
0.976 0.003 0.0028
(0.0048) 0.0028
(0.0056) 0.878 0.012
CRE.PD90 0.0006
(0.0026) 0.0003
(0.0014) 0.038 0.105
0.0005 (0.0016)
0.0004 (0.0015)
0.410 0.070 0.0004
(0.0016) 0.0004
(0.0015) 0.940 0.006
CRE.NAC 0.0024
(0.0063) 0.0023
(0.0042) 0.782 0.013
0.0030 (0.0053)
0.0027 (0.0047)
0.533 0.053 0.0029
(0.0054) 0.0028
(0.0052) 0.881 0.011
CRE.NCH 0.0003
(0.0018) 0.0005
(0.0032) 0.021 0.080
0.0005 (0.0018)
0.0004 (0.0011)
0.287 0.091 0.0004
(0.0016) 0.0004
(0.0013) 0.825 0.014
RRE.PD30 0.0049
(0.0062) 0.0030
(0.0037) <0.001 0.372
0.0036 (0.0048)
0.0034 (0.0046)
0.628 0.041 0.0036
(0.0048) 0.0035
(0.0046) 0.706 0.029
RRE.PD90 0.0009
(0.0026) 0.0006
(0.0021) 0.037 0.095
0.0005 (0.0011)
0.0005 (0.0013)
0.464 0.062 0.0005
(0.0013) 0.0005
(0.0013) 0.938 0.006
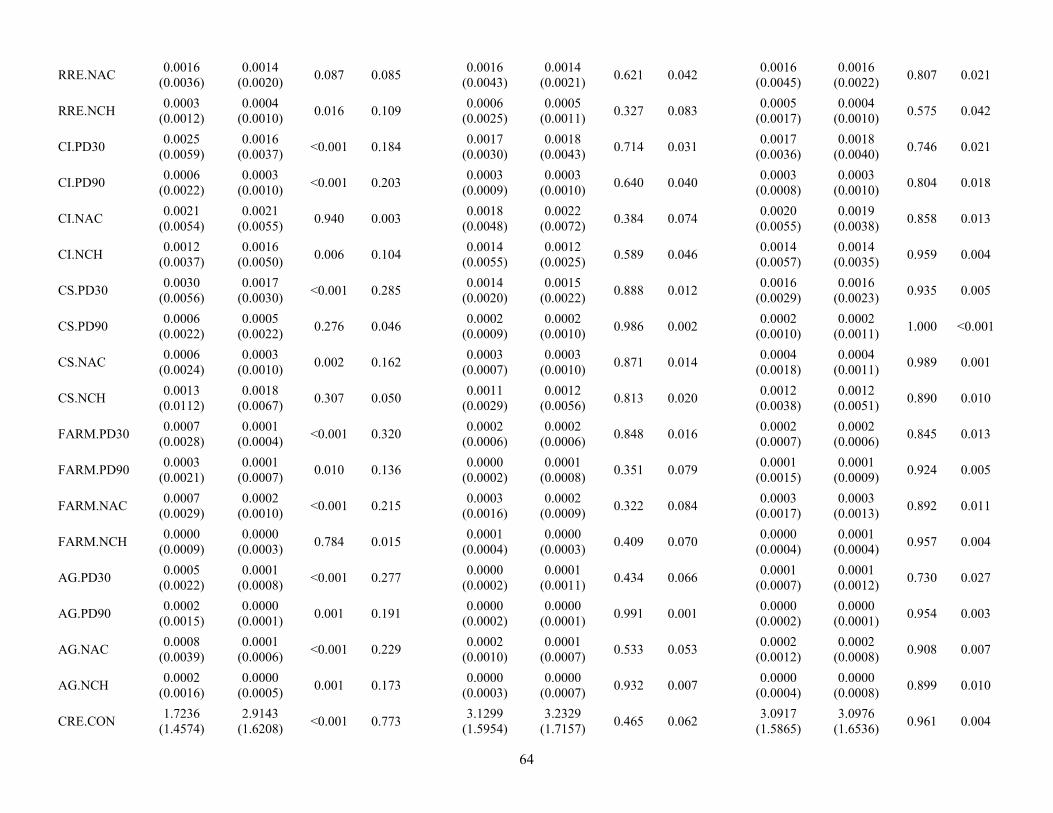
64
RRE.NAC 0.0016
(0.0036) 0.0014
(0.0020) 0.087 0.085
0.0016 (0.0043)
0.0014 (0.0021)
0.621 0.042 0.0016
(0.0045) 0.0016
(0.0022) 0.807 0.021
RRE.NCH 0.0003
(0.0012) 0.0004
(0.0010) 0.016 0.109
0.0006 (0.0025)
0.0005 (0.0011)
0.327 0.083 0.0005
(0.0017) 0.0004
(0.0010) 0.575 0.042
CI.PD30 0.0025
(0.0059) 0.0016
(0.0037) <0.001 0.184
0.0017 (0.0030)
0.0018 (0.0043)
0.714 0.031 0.0017
(0.0036) 0.0018
(0.0040) 0.746 0.021
CI.PD90 0.0006
(0.0022) 0.0003
(0.0010) <0.001 0.203
0.0003 (0.0009)
0.0003 (0.0010)
0.640 0.040 0.0003
(0.0008) 0.0003
(0.0010) 0.804 0.018
CI.NAC 0.0021
(0.0054) 0.0021
(0.0055) 0.940 0.003
0.0018 (0.0048)
0.0022 (0.0072)
0.384 0.074 0.0020
(0.0055) 0.0019
(0.0038) 0.858 0.013
CI.NCH 0.0012
(0.0037) 0.0016
(0.0050) 0.006 0.104
0.0014 (0.0055)
0.0012 (0.0025)
0.589 0.046 0.0014
(0.0057) 0.0014
(0.0035) 0.959 0.004
CS.PD30 0.0030
(0.0056) 0.0017
(0.0030) <0.001 0.285
0.0014 (0.0020)
0.0015 (0.0022)
0.888 0.012 0.0016
(0.0029) 0.0016
(0.0023) 0.935 0.005
CS.PD90 0.0006
(0.0022) 0.0005
(0.0022) 0.276 0.046
0.0002 (0.0009)
0.0002 (0.0010)
0.986 0.002 0.0002
(0.0010) 0.0002
(0.0011) 1.000 <0.001
CS.NAC 0.0006
(0.0024) 0.0003
(0.0010) 0.002 0.162
0.0003 (0.0007)
0.0003 (0.0010)
0.871 0.014 0.0004
(0.0018) 0.0004
(0.0011) 0.989 0.001
CS.NCH 0.0013
(0.0112) 0.0018
(0.0067) 0.307 0.050
0.0011 (0.0029)
0.0012 (0.0056)
0.813 0.020 0.0012
(0.0038) 0.0012
(0.0051) 0.890 0.010
FARM.PD30 0.0007
(0.0028) 0.0001
(0.0004) <0.001 0.320
0.0002 (0.0006)
0.0002 (0.0006)
0.848 0.016 0.0002
(0.0007) 0.0002
(0.0006) 0.845 0.013
FARM.PD90 0.0003
(0.0021) 0.0001
(0.0007) 0.010 0.136
0.0000 (0.0002)
0.0001 (0.0008)
0.351 0.079 0.0001
(0.0015) 0.0001
(0.0009) 0.924 0.005
FARM.NAC 0.0007
(0.0029) 0.0002
(0.0010) <0.001 0.215
0.0003 (0.0016)
0.0002 (0.0009)
0.322 0.084 0.0003
(0.0017) 0.0003
(0.0013) 0.892 0.011
FARM.NCH 0.0000
(0.0009) 0.0000
(0.0003) 0.784 0.015
0.0001 (0.0004)
0.0000 (0.0003)
0.409 0.070 0.0000
(0.0004) 0.0001
(0.0004) 0.957 0.004
AG.PD30 0.0005
(0.0022) 0.0001
(0.0008) <0.001 0.277
0.0000 (0.0002)
0.0001 (0.0011)
0.434 0.066 0.0001
(0.0007) 0.0001
(0.0012) 0.730 0.027
AG.PD90 0.0002
(0.0015) 0.0000
(0.0001) 0.001 0.191
0.0000 (0.0002)
0.0000 (0.0001)
0.991 0.001 0.0000
(0.0002) 0.0000
(0.0001) 0.954 0.003
AG.NAC 0.0008
(0.0039) 0.0001
(0.0006) <0.001 0.229
0.0002 (0.0010)
0.0001 (0.0007)
0.533 0.053 0.0002
(0.0012) 0.0002
(0.0008) 0.908 0.007
AG.NCH 0.0002
(0.0016) 0.0000
(0.0005) 0.001 0.173
0.0000 (0.0003)
0.0000 (0.0007)
0.932 0.007 0.0000
(0.0004) 0.0000
(0.0008) 0.899 0.010
CRE.CON 1.7236
(1.4574) 2.9143
(1.6208) <0.001 0.773
3.1299 (1.5954)
3.2329 (1.7157)
0.465 0.062 3.0917
(1.5865) 3.0976
(1.6536) 0.961 0.004

65
RRE.CON 1.5936
(1.0883) 2.0081
(1.2803) <0.001 0.349
1.9009 (1.1983)
1.8532 (1.1384)
0.631 0.041 1.8750
(1.1882) 1.8679
(1.1029) 0.934 0.006
CI.CON 0.9917
(0.7420) 1.2136
(0.8062) <0.001 0.286
1.1181 (0.7423)
1.2255 (0.8219)
0.107 0.137 1.1572
(0.7775) 1.1763
(0.7735) 0.733 0.025
CS.CON 0.6387
(0.5431) 0.7045
(0.8988) 0.012 0.089
0.5863 (0.7918)
0.5566 (0.6557)
0.631 0.041 0.5908
(0.7224) 0.5871
(0.6381) 0.942 0.005
FARM.CON 0.5196
(0.5970) 0.1259
(0.2420) <0.001 0.864
0.1875 (0.3206)
0.1738 (0.2910)
0.599 0.045 0.1932
(0.3452) 0.1945
(0.3070) 0.953 0.004
AG.CON 0.6211
(0.8415) 0.0891
(0.2060) <0.001 0.869
0.1239 (0.2604)
0.1245 (0.2592)
0.978 0.002 0.1362
(0.3225) 0.1390
(0.2696) 0.884 0.009
CRE.G 0.2611
(1.1219) 0.3045
(3.5947) 0.562 0.016
0.2234 (0.3721)
0.1734 (0.2479)
0.064 0.158 0.2593
(0.8960) 0.2513
(2.5677) 0.922 0.004
RRE.G 0.1187
(5.0148) 0.0942
(0.6658) 0.901 0.007
0.0389 (0.2793)
0.0576 (0.3537)
0.490 0.059 0.0476
(0.3044) 0.0419
(0.2994) 0.799 0.019
CI.G 0.1242
(0.9820) 0.0916
(0.4318) 0.404 0.043
0.0976 (0.3715)
0.0962 (0.4215)
0.967 0.004 0.1081
(0.4876) 0.0984
(0.4570) 0.773 0.021
CS.G -0.0156 (0.4468)
-0.0137 (0.4890)
0.925 0.004 -0.0248 (0.3291)
-0.0101 (0.6697)
0.743 0.028 -0.0047 (0.4673)
-0.0029 (0.6892)
0.968 0.003
FARM.G 0.2612
(3.7471) 0.7779
(12.1749) 0.041 0.057
0.2825 (1.2203)
0.3593 (1.7484)
0.549 0.051 0.4966
(5.8114) 0.4522
(5.1768) 0.833 0.008
AG.G 0.0700
(1.4614) 0.2743
(2.5451) 0.004 0.098
0.0549 (0.8782)
0.0771 (1.0155)
0.783 0.023 0.1859
(2.4706) 0.1785
(1.6192) 0.951 0.004
PD30.G 0.7170
(9.0815) 0.2889
(2.5298) 0.232 0.064
0.3441 (3.2042)
0.5041 (3.5953)
0.581 0.047 0.3501
(2.4787) 0.4023
(3.0488) 0.769 0.019
PD90.G 2.9317
(28.0058) 1.2283
(8.0023) 0.123 0.083
2.5645 (23.0509)
1.6312 (8.5783)
0.528 0.054 1.7276
(15.1429) 1.7029
(8.9650) 0.973 0.002
NAC.G 2.9933
(29.4418) 1.9666
(32.6887) 0.422 0.033
2.4667 (14.8404)
3.7485 (49.8182)
0.682 0.035 2.3685
(15.6496) 2.0484
(32.5287) 0.837 0.013
SIZE 11.4444 (0.9577)
13.6341 (1.6931)
<0.001 1.592 12.7454 (0.9409)
12.7422 (1.1103)
0.971 0.003 12.6738 (0.9787)
12.6819 (1.1340)
0.918 0.008
T1LR 0.0985
(0.0282) 0.0930
(0.1911) 0.107 0.040
0.0892 (0.0203)
0.0867 (0.0193)
0.134 0.128 0.0890
(0.0210) 0.0887
(0.0842) 0.890 0.005
T1CR 0.1537
(0.0650) 0.1208
(0.0672) <0.001 0.498
0.1252 (0.0388)
0.1222 (0.0432)
0.388 0.073 0.1252
(0.0401) 0.1248
(0.0575) 0.923 0.006
TTCR 0.1649
(0.0649) 0.1364
(0.0668) <0.001 0.433
0.1371 (0.0385)
0.1341 (0.0431)
0.400 0.072 0.1371
(0.0397) 0.1368
(0.0574) 0.924 0.006
DELAL 1.9927
(7.5863) 1.1523
(0.9039) 0.005 0.156
1.2949 (1.0264)
1.2741 (0.9779)
0.807 0.021 1.3100
(1.0417) 1.2957
(0.9995) 0.850 0.014

66
PSEC 0.0657
(0.0643) 0.0528
(0.0599) <0.001 0.209
0.0553 (0.0543)
0.0475 (0.0497)
0.078 0.150 0.0525
(0.0526) 0.0521
(0.0527) 0.925 0.007
EFF 0.6602
(0.2085) 0.6001
(0.1361) <0.001 0.341
0.6195 (0.1268)
0.6168 (0.1441)
0.814 0.020 0.6283
(0.1298) 0.6237
(0.1387) 0.657 0.034
ROA 0.0111
(0.0077) 0.0117
(0.0096) 0.116 0.062
0.0108 (0.0091)
0.0109 (0.0064)
0.961 0.004 0.0105
(0.0096) 0.0108
(0.0070) 0.636 0.038
ROE 0.1068
(0.3102) 0.1295
(0.0887) 0.064 0.099
0.1180 (0.1035)
0.1184 (0.0663)
0.954 0.005 0.1135
(0.1085) 0.1174
(0.0670) 0.593 0.043
NIM 0.0377
(0.0097) 0.0355
(0.0097) <0.001 0.225
0.0365 (0.0070)
0.0365 (0.0105)
0.972 0.003 0.0366
(0.0079) 0.0366
(0.0101) 0.997 <0.001
CD 0.7184
(0.0926) 0.6338
(0.1463) <0.001 0.691
0.6650 (0.1220)
0.6541 (0.1223)
0.295 0.089 0.6643
(0.1200) 0.6640
(0.1174) 0.972 0.003
VLDR 0.1330
(0.1113) 0.2258
(0.1556) <0.001 0.686
0.2005 (0.1276)
0.2118 (0.1397)
0.321 0.084 0.2001
(0.1261) 0.1999
(0.1357) 0.984 0.002
LQ 0.2800
(0.1220) 0.2215
(0.1350) <0.001 0.455
0.2475 (0.1188)
0.2501 (0.1415)
0.817 0.020 0.2442
(0.1131) 0.2477
(0.1357) 0.706 0.028
RORA 0.0043
(0.0123) 0.0116
(0.0462) <0.001 0.216
0.0077 (0.0234)
0.0063 (0.0100)
0.347 0.080 0.0080
(0.0245) 0.0081
(0.0410) 0.939 0.005
LTD 0.0914
(0.0569) 0.0809
(0.0608) <0.001 0.178
0.0973 (0.0623)
0.1025 (0.0673)
0.344 0.081 0.0981
(0.0639) 0.0979
(0.0653) 0.972 0.003
UNST 5.2070
(0.9041) 5.3933
(0.9716) <0.001 0.198
5.4671 (0.9618)
5.4921 (0.9688)
0.761 0.026 5.4999
(0.9695) 5.4863
(0.9712) 0.853 0.014
GDPST 5.4771
(1.7931) 4.7739
(1.4080) <0.001 0.436
4.7682 (1.2795)
4.8477 (1.3976)
0.486 0.059 4.8138
(1.4387) 4.8516
(1.4530) 0.717 0.026
PMST 0.1561
(0.0614) 0.1165
(0.0695) <0.001 0.605
0.1357 (0.0686)
0.1378 (0.0675)
0.714 0.031 0.1340
(0.0680) 0.1348
(0.0678) 0.863 0.013
2004 Unmatched Matched Weighted
Private Public p SMD Private Public p SMD Private Public p SMD
N 3546 607 295 295 269.0 273.8
TYPE = FHC (%)
375 (10.6)
297 (48.9)
<0.001 0.924 96
(32.5) 102
(34.6) 0.663 0.043
90.6 (33.7)
91.1 (33.3)
0.904 0.009
CRE.PD30 0.0023
(0.0044) 0.0018
(0.0037) 0.007 0.126
0.0022 (0.0035)
0.0022 (0.0047)
0.979 0.002 0.0023
(0.0037) 0.0022
(0.0049) 0.821 0.018
CRE.PD90 0.0005
(0.0021) 0.0002
(0.0010) 0.013 0.131
0.0003 (0.0011)
0.0003 (0.0010)
0.965 0.004 0.0003
(0.0010) 0.0003
(0.0010) 0.913 0.007
CRE.NAC 0.0020
(0.0054) 0.0022
(0.0041) 0.366 0.043
0.0023 (0.0043)
0.0027 (0.0049)
0.310 0.084 0.0027
(0.0069) 0.0027
(0.0050) 0.965 0.003
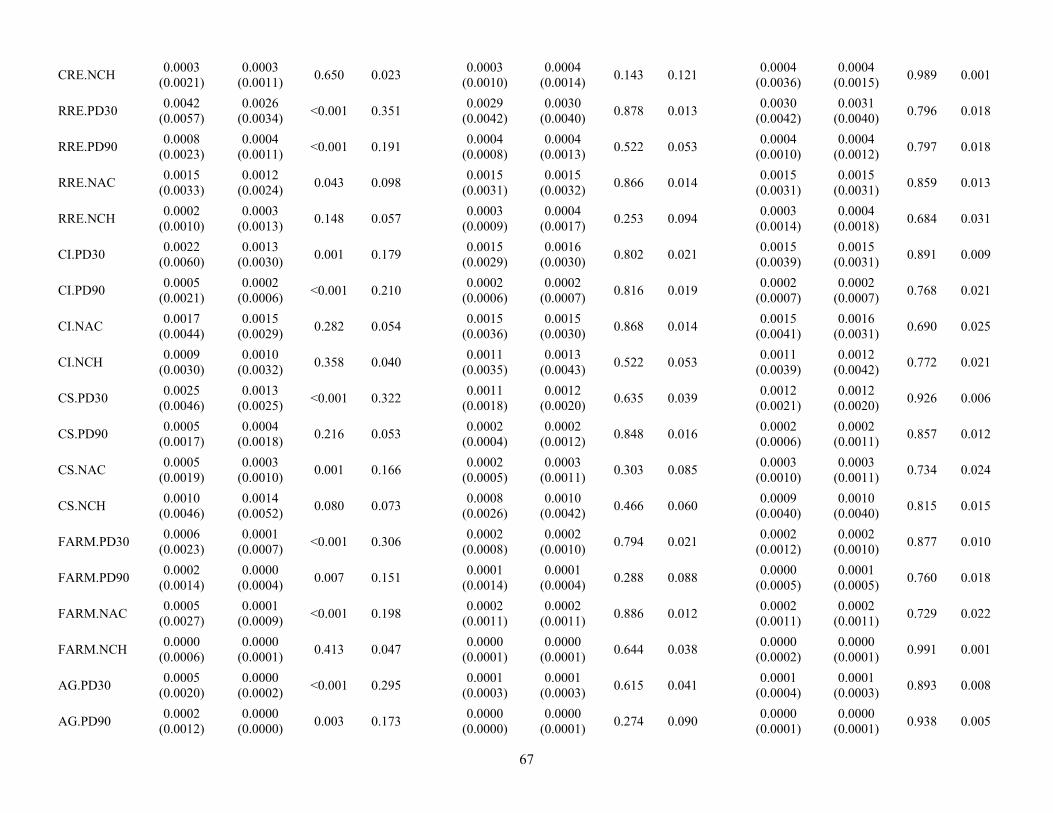
67
CRE.NCH 0.0003
(0.0021) 0.0003
(0.0011) 0.650 0.023
0.0003 (0.0010)
0.0004 (0.0014)
0.143 0.121 0.0004
(0.0036) 0.0004
(0.0015) 0.989 0.001
RRE.PD30 0.0042
(0.0057) 0.0026
(0.0034) <0.001 0.351
0.0029 (0.0042)
0.0030 (0.0040)
0.878 0.013 0.0030
(0.0042) 0.0031
(0.0040) 0.796 0.018
RRE.PD90 0.0008
(0.0023) 0.0004
(0.0011) <0.001 0.191
0.0004 (0.0008)
0.0004 (0.0013)
0.522 0.053 0.0004
(0.0010) 0.0004
(0.0012) 0.797 0.018
RRE.NAC 0.0015
(0.0033) 0.0012
(0.0024) 0.043 0.098
0.0015 (0.0031)
0.0015 (0.0032)
0.866 0.014 0.0015
(0.0031) 0.0015
(0.0031) 0.859 0.013
RRE.NCH 0.0002
(0.0010) 0.0003
(0.0013) 0.148 0.057
0.0003 (0.0009)
0.0004 (0.0017)
0.253 0.094 0.0003
(0.0014) 0.0004
(0.0018) 0.684 0.031
CI.PD30 0.0022
(0.0060) 0.0013
(0.0030) 0.001 0.179
0.0015 (0.0029)
0.0016 (0.0030)
0.802 0.021 0.0015
(0.0039) 0.0015
(0.0031) 0.891 0.009
CI.PD90 0.0005
(0.0021) 0.0002
(0.0006) <0.001 0.210
0.0002 (0.0006)
0.0002 (0.0007)
0.816 0.019 0.0002
(0.0007) 0.0002
(0.0007) 0.768 0.021
CI.NAC 0.0017
(0.0044) 0.0015
(0.0029) 0.282 0.054
0.0015 (0.0036)
0.0015 (0.0030)
0.868 0.014 0.0015
(0.0041) 0.0016
(0.0031) 0.690 0.025
CI.NCH 0.0009
(0.0030) 0.0010
(0.0032) 0.358 0.040
0.0011 (0.0035)
0.0013 (0.0043)
0.522 0.053 0.0011
(0.0039) 0.0012
(0.0042) 0.772 0.021
CS.PD30 0.0025
(0.0046) 0.0013
(0.0025) <0.001 0.322
0.0011 (0.0018)
0.0012 (0.0020)
0.635 0.039 0.0012
(0.0021) 0.0012
(0.0020) 0.926 0.006
CS.PD90 0.0005
(0.0017) 0.0004
(0.0018) 0.216 0.053
0.0002 (0.0004)
0.0002 (0.0012)
0.848 0.016 0.0002
(0.0006) 0.0002
(0.0011) 0.857 0.012
CS.NAC 0.0005
(0.0019) 0.0003
(0.0010) 0.001 0.166
0.0002 (0.0005)
0.0003 (0.0011)
0.303 0.085 0.0003
(0.0010) 0.0003
(0.0011) 0.734 0.024
CS.NCH 0.0010
(0.0046) 0.0014
(0.0052) 0.080 0.073
0.0008 (0.0026)
0.0010 (0.0042)
0.466 0.060 0.0009
(0.0040) 0.0010
(0.0040) 0.815 0.015
FARM.PD30 0.0006
(0.0023) 0.0001
(0.0007) <0.001 0.306
0.0002 (0.0008)
0.0002 (0.0010)
0.794 0.021 0.0002
(0.0012) 0.0002
(0.0010) 0.877 0.010
FARM.PD90 0.0002
(0.0014) 0.0000
(0.0004) 0.007 0.151
0.0001 (0.0014)
0.0001 (0.0004)
0.288 0.088 0.0000
(0.0005) 0.0001
(0.0005) 0.760 0.018
FARM.NAC 0.0005
(0.0027) 0.0001
(0.0009) <0.001 0.198
0.0002 (0.0011)
0.0002 (0.0011)
0.886 0.012 0.0002
(0.0011) 0.0002
(0.0011) 0.729 0.022
FARM.NCH 0.0000
(0.0006) 0.0000
(0.0001) 0.413 0.047
0.0000 (0.0001)
0.0000 (0.0001)
0.644 0.038 0.0000
(0.0002) 0.0000
(0.0001) 0.991 0.001
AG.PD30 0.0005
(0.0020) 0.0000
(0.0002) <0.001 0.295
0.0001 (0.0003)
0.0001 (0.0003)
0.615 0.041 0.0001
(0.0004) 0.0001
(0.0003) 0.893 0.008
AG.PD90 0.0002
(0.0012) 0.0000
(0.0000) 0.003 0.173
0.0000 (0.0000)
0.0000 (0.0001)
0.274 0.090 0.0000
(0.0001) 0.0000
(0.0001) 0.938 0.005
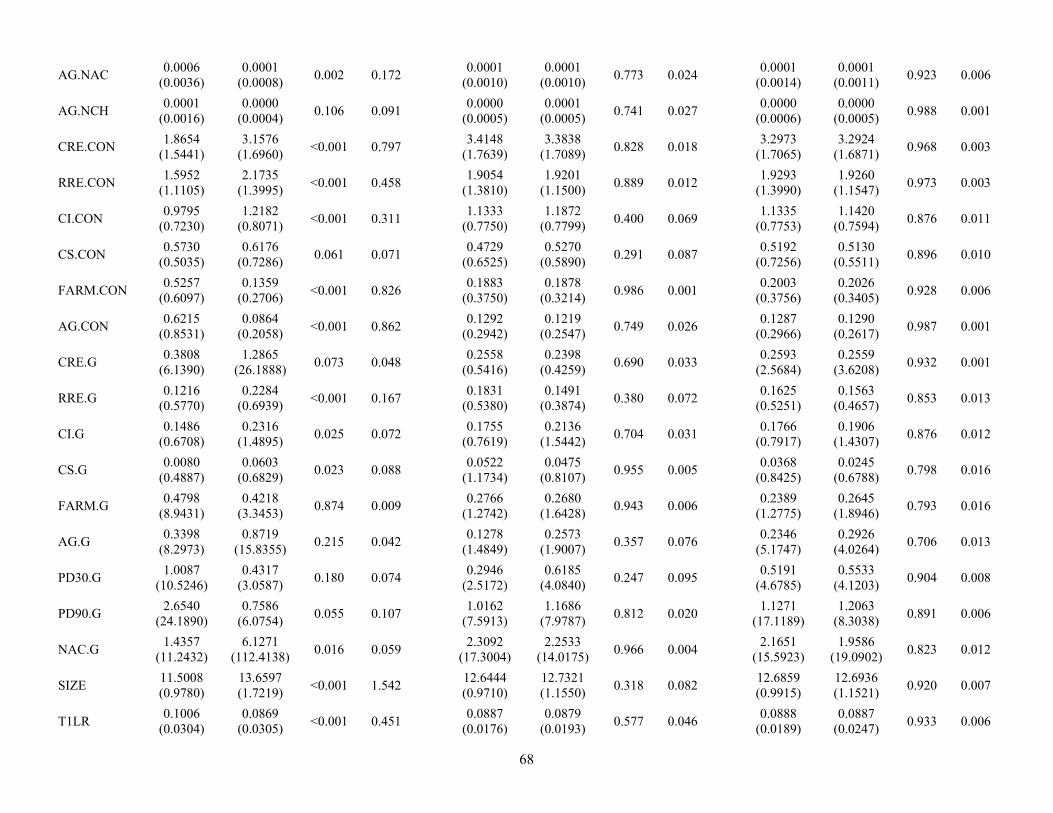
68
AG.NAC 0.0006
(0.0036) 0.0001
(0.0008) 0.002 0.172
0.0001 (0.0010)
0.0001 (0.0010)
0.773 0.024 0.0001
(0.0014) 0.0001
(0.0011) 0.923 0.006
AG.NCH 0.0001
(0.0016) 0.0000
(0.0004) 0.106 0.091
0.0000 (0.0005)
0.0001 (0.0005)
0.741 0.027 0.0000
(0.0006) 0.0000
(0.0005) 0.988 0.001
CRE.CON 1.8654
(1.5441) 3.1576
(1.6960) <0.001 0.797
3.4148 (1.7639)
3.3838 (1.7089)
0.828 0.018 3.2973
(1.7065) 3.2924
(1.6871) 0.968 0.003
RRE.CON 1.5952
(1.1105) 2.1735
(1.3995) <0.001 0.458
1.9054 (1.3810)
1.9201 (1.1500)
0.889 0.012 1.9293
(1.3990) 1.9260
(1.1547) 0.973 0.003
CI.CON 0.9795
(0.7230) 1.2182
(0.8071) <0.001 0.311
1.1333 (0.7750)
1.1872 (0.7799)
0.400 0.069 1.1335
(0.7753) 1.1420
(0.7594) 0.876 0.011
CS.CON 0.5730
(0.5035) 0.6176
(0.7286) 0.061 0.071
0.4729 (0.6525)
0.5270 (0.5890)
0.291 0.087 0.5192
(0.7256) 0.5130
(0.5511) 0.896 0.010
FARM.CON 0.5257
(0.6097) 0.1359
(0.2706) <0.001 0.826
0.1883 (0.3750)
0.1878 (0.3214)
0.986 0.001 0.2003
(0.3756) 0.2026
(0.3405) 0.928 0.006
AG.CON 0.6215
(0.8531) 0.0864
(0.2058) <0.001 0.862
0.1292 (0.2942)
0.1219 (0.2547)
0.749 0.026 0.1287
(0.2966) 0.1290
(0.2617) 0.987 0.001
CRE.G 0.3808
(6.1390) 1.2865
(26.1888) 0.073 0.048
0.2558 (0.5416)
0.2398 (0.4259)
0.690 0.033 0.2593
(2.5684) 0.2559
(3.6208) 0.932 0.001
RRE.G 0.1216
(0.5770) 0.2284
(0.6939) <0.001 0.167
0.1831 (0.5380)
0.1491 (0.3874)
0.380 0.072 0.1625
(0.5251) 0.1563
(0.4657) 0.853 0.013
CI.G 0.1486
(0.6708) 0.2316
(1.4895) 0.025 0.072
0.1755 (0.7619)
0.2136 (1.5442)
0.704 0.031 0.1766
(0.7917) 0.1906
(1.4307) 0.876 0.012
CS.G 0.0080
(0.4887) 0.0603
(0.6829) 0.023 0.088
0.0522 (1.1734)
0.0475 (0.8107)
0.955 0.005 0.0368
(0.8425) 0.0245
(0.6788) 0.798 0.016
FARM.G 0.4798
(8.9431) 0.4218
(3.3453) 0.874 0.009
0.2766 (1.2742)
0.2680 (1.6428)
0.943 0.006 0.2389
(1.2775) 0.2645
(1.8946) 0.793 0.016
AG.G 0.3398
(8.2973) 0.8719
(15.8355) 0.215 0.042
0.1278 (1.4849)
0.2573 (1.9007)
0.357 0.076 0.2346
(5.1747) 0.2926
(4.0264) 0.706 0.013
PD30.G 1.0087
(10.5246) 0.4317
(3.0587) 0.180 0.074
0.2946 (2.5172)
0.6185 (4.0840)
0.247 0.095 0.5191
(4.6785) 0.5533
(4.1203) 0.904 0.008
PD90.G 2.6540
(24.1890) 0.7586
(6.0754) 0.055 0.107
1.0162 (7.5913)
1.1686 (7.9787)
0.812 0.020 1.1271
(17.1189) 1.2063
(8.3038) 0.891 0.006
NAC.G 1.4357
(11.2432) 6.1271
(112.4138) 0.016 0.059
2.3092 (17.3004)
2.2533 (14.0175)
0.966 0.004 2.1651
(15.5923) 1.9586
(19.0902) 0.823 0.012
SIZE 11.5008 (0.9780)
13.6597 (1.7219)
<0.001 1.542 12.6444 (0.9710)
12.7321 (1.1550)
0.318 0.082 12.6859 (0.9915)
12.6936 (1.1521)
0.920 0.007
T1LR 0.1006
(0.0304) 0.0869
(0.0305) <0.001 0.451
0.0887 (0.0176)
0.0879 (0.0193)
0.577 0.046 0.0888
(0.0189) 0.0887
(0.0247) 0.933 0.006
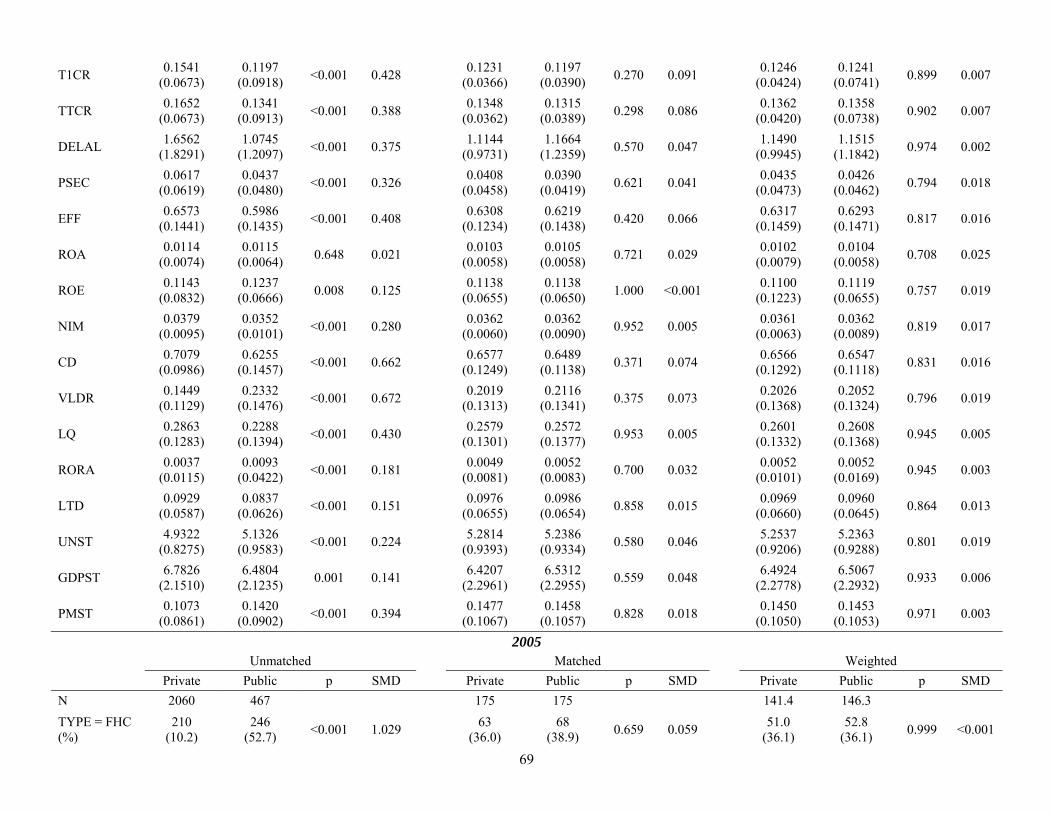
69
T1CR 0.1541
(0.0673) 0.1197
(0.0918) <0.001 0.428
0.1231 (0.0366)
0.1197 (0.0390)
0.270 0.091 0.1246
(0.0424) 0.1241
(0.0741) 0.899 0.007
TTCR 0.1652
(0.0673) 0.1341
(0.0913) <0.001 0.388
0.1348 (0.0362)
0.1315 (0.0389)
0.298 0.086 0.1362
(0.0420) 0.1358
(0.0738) 0.902 0.007
DELAL 1.6562
(1.8291) 1.0745
(1.2097) <0.001 0.375
1.1144 (0.9731)
1.1664 (1.2359)
0.570 0.047 1.1490
(0.9945) 1.1515
(1.1842) 0.974 0.002
PSEC 0.0617
(0.0619) 0.0437
(0.0480) <0.001 0.326
0.0408 (0.0458)
0.0390 (0.0419)
0.621 0.041 0.0435
(0.0473) 0.0426
(0.0462) 0.794 0.018
EFF 0.6573
(0.1441) 0.5986
(0.1435) <0.001 0.408
0.6308 (0.1234)
0.6219 (0.1438)
0.420 0.066 0.6317
(0.1459) 0.6293
(0.1471) 0.817 0.016
ROA 0.0114
(0.0074) 0.0115
(0.0064) 0.648 0.021
0.0103 (0.0058)
0.0105 (0.0058)
0.721 0.029 0.0102
(0.0079) 0.0104
(0.0058) 0.708 0.025
ROE 0.1143
(0.0832) 0.1237
(0.0666) 0.008 0.125
0.1138 (0.0655)
0.1138 (0.0650)
1.000 <0.001 0.1100
(0.1223) 0.1119
(0.0655) 0.757 0.019
NIM 0.0379
(0.0095) 0.0352
(0.0101) <0.001 0.280
0.0362 (0.0060)
0.0362 (0.0090)
0.952 0.005 0.0361
(0.0063) 0.0362
(0.0089) 0.819 0.017
CD 0.7079
(0.0986) 0.6255
(0.1457) <0.001 0.662
0.6577 (0.1249)
0.6489 (0.1138)
0.371 0.074 0.6566
(0.1292) 0.6547
(0.1118) 0.831 0.016
VLDR 0.1449
(0.1129) 0.2332
(0.1476) <0.001 0.672
0.2019 (0.1313)
0.2116 (0.1341)
0.375 0.073 0.2026
(0.1368) 0.2052
(0.1324) 0.796 0.019
LQ 0.2863
(0.1283) 0.2288
(0.1394) <0.001 0.430
0.2579 (0.1301)
0.2572 (0.1377)
0.953 0.005 0.2601
(0.1332) 0.2608
(0.1368) 0.945 0.005
RORA 0.0037
(0.0115) 0.0093
(0.0422) <0.001 0.181
0.0049 (0.0081)
0.0052 (0.0083)
0.700 0.032 0.0052
(0.0101) 0.0052
(0.0169) 0.945 0.003
LTD 0.0929
(0.0587) 0.0837
(0.0626) <0.001 0.151
0.0976 (0.0655)
0.0986 (0.0654)
0.858 0.015 0.0969
(0.0660) 0.0960
(0.0645) 0.864 0.013
UNST 4.9322
(0.8275) 5.1326
(0.9583) <0.001 0.224
5.2814 (0.9393)
5.2386 (0.9334)
0.580 0.046 5.2537
(0.9206) 5.2363
(0.9288) 0.801 0.019
GDPST 6.7826
(2.1510) 6.4804
(2.1235) 0.001 0.141
6.4207 (2.2961)
6.5312 (2.2955)
0.559 0.048 6.4924
(2.2778) 6.5067
(2.2932) 0.933 0.006
PMST 0.1073
(0.0861) 0.1420
(0.0902) <0.001 0.394
0.1477 (0.1067)
0.1458 (0.1057)
0.828 0.018 0.1450
(0.1050) 0.1453
(0.1053) 0.971 0.003
2005 Unmatched Matched Weighted
Private Public p SMD Private Public p SMD Private Public p SMD
N 2060 467 175 175 141.4 146.3
TYPE = FHC (%)
210 (10.2)
246 (52.7)
<0.001 1.029 63
(36.0) 68
(38.9) 0.659 0.059
51.0 (36.1)
52.8 (36.1)
0.999 <0.001
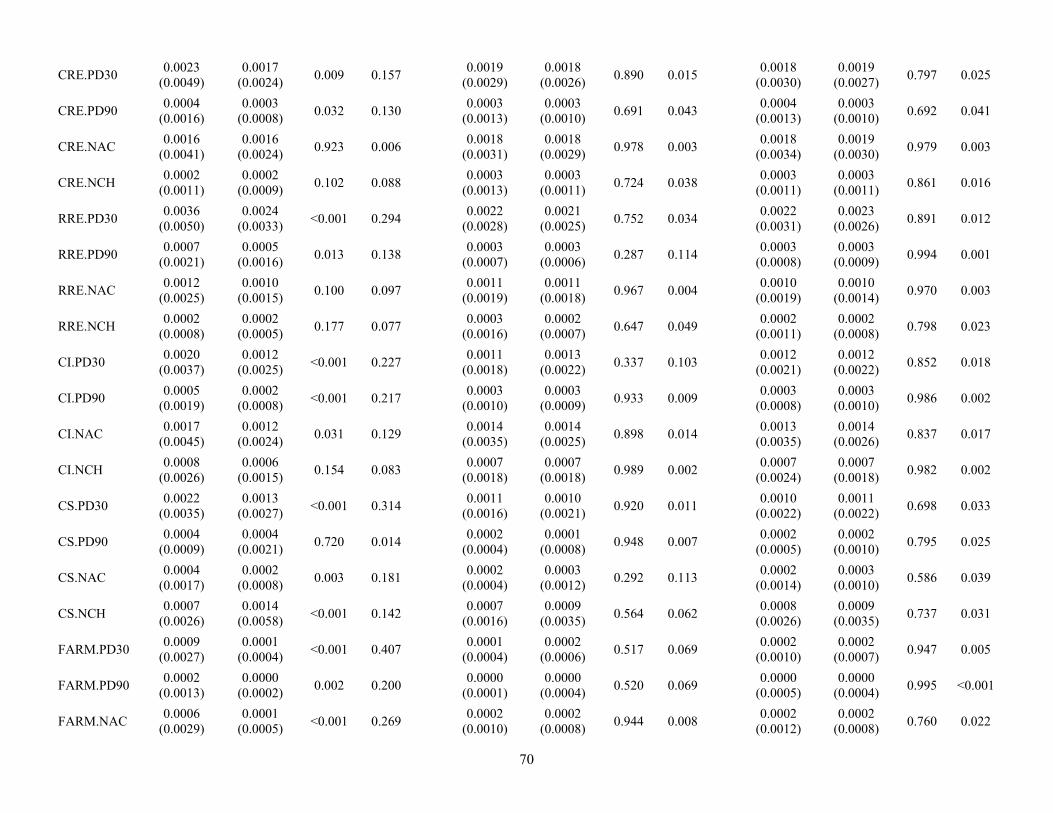
70
CRE.PD30 0.0023
(0.0049) 0.0017
(0.0024) 0.009 0.157
0.0019 (0.0029)
0.0018 (0.0026)
0.890 0.015 0.0018
(0.0030) 0.0019
(0.0027) 0.797 0.025
CRE.PD90 0.0004
(0.0016) 0.0003
(0.0008) 0.032 0.130
0.0003 (0.0013)
0.0003 (0.0010)
0.691 0.043 0.0004
(0.0013) 0.0003
(0.0010) 0.692 0.041
CRE.NAC 0.0016
(0.0041) 0.0016
(0.0024) 0.923 0.006
0.0018 (0.0031)
0.0018 (0.0029)
0.978 0.003 0.0018
(0.0034) 0.0019
(0.0030) 0.979 0.003
CRE.NCH 0.0002
(0.0011) 0.0002
(0.0009) 0.102 0.088
0.0003 (0.0013)
0.0003 (0.0011)
0.724 0.038 0.0003
(0.0011) 0.0003
(0.0011) 0.861 0.016
RRE.PD30 0.0036
(0.0050) 0.0024
(0.0033) <0.001 0.294
0.0022 (0.0028)
0.0021 (0.0025)
0.752 0.034 0.0022
(0.0031) 0.0023
(0.0026) 0.891 0.012
RRE.PD90 0.0007
(0.0021) 0.0005
(0.0016) 0.013 0.138
0.0003 (0.0007)
0.0003 (0.0006)
0.287 0.114 0.0003
(0.0008) 0.0003
(0.0009) 0.994 0.001
RRE.NAC 0.0012
(0.0025) 0.0010
(0.0015) 0.100 0.097
0.0011 (0.0019)
0.0011 (0.0018)
0.967 0.004 0.0010
(0.0019) 0.0010
(0.0014) 0.970 0.003
RRE.NCH 0.0002
(0.0008) 0.0002
(0.0005) 0.177 0.077
0.0003 (0.0016)
0.0002 (0.0007)
0.647 0.049 0.0002
(0.0011) 0.0002
(0.0008) 0.798 0.023
CI.PD30 0.0020
(0.0037) 0.0012
(0.0025) <0.001 0.227
0.0011 (0.0018)
0.0013 (0.0022)
0.337 0.103 0.0012
(0.0021) 0.0012
(0.0022) 0.852 0.018
CI.PD90 0.0005
(0.0019) 0.0002
(0.0008) <0.001 0.217
0.0003 (0.0010)
0.0003 (0.0009)
0.933 0.009 0.0003
(0.0008) 0.0003
(0.0010) 0.986 0.002
CI.NAC 0.0017
(0.0045) 0.0012
(0.0024) 0.031 0.129
0.0014 (0.0035)
0.0014 (0.0025)
0.898 0.014 0.0013
(0.0035) 0.0014
(0.0026) 0.837 0.017
CI.NCH 0.0008
(0.0026) 0.0006
(0.0015) 0.154 0.083
0.0007 (0.0018)
0.0007 (0.0018)
0.989 0.002 0.0007
(0.0024) 0.0007
(0.0018) 0.982 0.002
CS.PD30 0.0022
(0.0035) 0.0013
(0.0027) <0.001 0.314
0.0011 (0.0016)
0.0010 (0.0021)
0.920 0.011 0.0010
(0.0022) 0.0011
(0.0022) 0.698 0.033
CS.PD90 0.0004
(0.0009) 0.0004
(0.0021) 0.720 0.014
0.0002 (0.0004)
0.0001 (0.0008)
0.948 0.007 0.0002
(0.0005) 0.0002
(0.0010) 0.795 0.025
CS.NAC 0.0004
(0.0017) 0.0002
(0.0008) 0.003 0.181
0.0002 (0.0004)
0.0003 (0.0012)
0.292 0.113 0.0002
(0.0014) 0.0003
(0.0010) 0.586 0.039
CS.NCH 0.0007
(0.0026) 0.0014
(0.0058) <0.001 0.142
0.0007 (0.0016)
0.0009 (0.0035)
0.564 0.062 0.0008
(0.0026) 0.0009
(0.0035) 0.737 0.031
FARM.PD30 0.0009
(0.0027) 0.0001
(0.0004) <0.001 0.407
0.0001 (0.0004)
0.0002 (0.0006)
0.517 0.069 0.0002
(0.0010) 0.0002
(0.0007) 0.947 0.005
FARM.PD90 0.0002
(0.0013) 0.0000
(0.0002) 0.002 0.200
0.0000 (0.0001)
0.0000 (0.0004)
0.520 0.069 0.0000
(0.0005) 0.0000
(0.0004) 0.995 <0.001
FARM.NAC 0.0006
(0.0029) 0.0001
(0.0005) <0.001 0.269
0.0002 (0.0010)
0.0002 (0.0008)
0.944 0.008 0.0002
(0.0012) 0.0002
(0.0008) 0.760 0.022

71
FARM.NCH 0.0000
(0.0007) 0.0000
(0.0001) 0.854 0.012
-0.0000 (0.0005)
0.0000 (0.0002)
0.203 0.136 0.0000
(0.0005) 0.0000
(0.0001) 0.964 0.002
AG.PD30 0.0007
(0.0027) 0.0001
(0.0006) <0.001 0.329
0.0001 (0.0006)
0.0001 (0.0009)
0.990 0.001 0.0001
(0.0006) 0.0001
(0.0009) 0.813 0.023
AG.PD90 0.0003
(0.0024) 0.0000
(0.0001) 0.006 0.179
0.0000 (0.0001)
0.0000 (0.0001)
0.697 0.042 0.0000
(0.0001) 0.0000
(0.0001) 0.978 0.002
AG.NAC 0.0006
(0.0030) 0.0001
(0.0005) <0.001 0.256
0.0002 (0.0023)
0.0001 (0.0007)
0.624 0.052 0.0001
(0.0013) 0.0001
(0.0008) 0.874 0.010
AG.NCH 0.0000
(0.0009) 0.0000
(0.0004) 0.585 0.033
0.0001 (0.0009)
0.0000 (0.0007)
0.550 0.064 0.0000
(0.0004) 0.0001
(0.0008) 0.795 0.027
CRE.CON 1.6535
(1.4818) 3.2769
(1.7315) <0.001 1.007
3.4710 (1.6836)
3.6288 (1.7442)
0.390 0.092 3.4295
(1.6679) 3.4787
(1.6975) 0.769 0.029
RRE.CON 1.3140
(1.0959) 2.0873
(1.5030) <0.001 0.588
1.8117 (2.4113)
1.6981 (1.1357)
0.573 0.060 1.7332
(1.5197) 1.7086
(1.1578) 0.838 0.018
CI.CON 0.9685
(0.6462) 1.2265
(0.8547) <0.001 0.340
1.1912 (0.7328)
1.2146 (0.8263)
0.780 0.030 1.1715
(0.7582) 1.1612
(0.7980) 0.896 0.013
CS.CON 0.5117
(0.4345) 0.5955
(0.8612) 0.002 0.123
0.4773 (0.7187)
0.4801 (0.6504)
0.969 0.004 0.4659
(0.7087) 0.4754
(0.5749) 0.881 0.015
FARM.CON 0.7175
(0.6544) 0.1148
(0.2186) <0.001 1.235
0.2133 (0.3161)
0.1940 (0.2765)
0.543 0.065 0.2109
(0.3466) 0.2092
(0.2913) 0.951 0.005
AG.CON 0.9275
(0.8968) 0.0885
(0.2144) <0.001 1.287
0.1961 (0.3790)
0.1605 (0.3011)
0.331 0.104 0.1838
(0.3754) 0.1807
(0.3210) 0.919 0.009
CRE.G 0.3233
(3.5794) 0.2016
(0.3696) 0.463 0.048
0.3378 (1.1992)
0.2280 (0.4338)
0.256 0.122 0.2178
(0.3855) 0.2253
(0.4648) 0.858 0.017
RRE.G 0.1217
(1.3425) 0.5492
(9.2224) 0.044 0.065
0.4328 (3.9609)
0.1096 (0.3193)
0.283 0.115 0.1226
(0.5570) 0.1202
(0.7623) 0.943 0.004
CI.G 0.1908
(3.1574) 0.1159
(0.2655) 0.609 0.033
0.1163 (0.2922)
0.1235 (0.2702)
0.810 0.026 0.1206
(0.2702) 0.1169
(0.2642) 0.882 0.014
CS.G 0.0817
(2.0371) 0.0592
(0.7968) 0.814 0.015
0.0264 (0.3075)
0.0247 (0.3802)
0.964 0.005 0.0060
(0.2679) 0.0204
(0.4053) 0.683 0.042
FARM.G 0.1955
(2.5654) 20.2987
(410.7548) 0.026 0.069
0.8122 (8.2702)
0.4040 (2.4542)
0.532 0.067 0.9613
(9.1689) 0.7685
(64.4920) 0.832 0.004
AG.G 0.1797
(4.7966) 0.4258
(3.6330) 0.297 0.058
1.4207 (16.4082)
0.8037 (5.6248)
0.638 0.050 0.6118
(9.7042) 0.5276
(5.3333) 0.892 0.011
PD30.G 1.8207
(17.3359) 1.0506
(9.5544) 0.353 0.055
1.3924 (10.9639)
1.9038 (15.4204)
0.721 0.038 1.7457
(13.3001) 2.1156
(16.7947) 0.829 0.024
PD90.G 3.1355
(19.8527) 1.6330
(9.7033) 0.111 0.096
4.2135 (26.4131)
2.3793 (12.4283)
0.406 0.089 2.7527
(17.1263) 2.6211
(13.7918) 0.927 0.008

72
NAC.G 1.9311
(23.0385) 1.2119
(8.0336) 0.506 0.042
4.7231 (45.3694)
0.9787 (4.8781)
0.278 0.116 1.1562
(12.5252) 1.1540
(6.3302) 0.997 <0.001
SIZE 11.5720 (1.1498)
14.2722 (1.5665)
<0.001 1.965 13.3159 (0.9127)
13.4338 (0.9812)
0.245 0.124 13.3296 (0.9103)
13.3316 (0.9597)
0.982 0.002
T1LR 0.1076
(0.2008) 0.0869
(0.0345) 0.027 0.144
0.0888 (0.0182)
0.0878 (0.0182)
0.592 0.057 0.0887
(0.0180) 0.0886
(0.0242) 0.984 0.002
T1CR 0.1584
(0.2670) 0.1190
(0.1249) 0.002 0.189
0.1193 (0.0346)
0.1154 (0.0341)
0.296 0.112 0.1208
(0.0393) 0.1200
(0.0728) 0.843 0.014
TTCR 0.1700
(0.2925) 0.1338
(0.1239) 0.009 0.162
0.1312 (0.0339)
0.1275 (0.0347)
0.314 0.108 0.1329
(0.0384) 0.1320
(0.0729) 0.826 0.015
DELAL 1.5831
(1.4399) 1.1150
(1.4123) <0.001 0.328
1.0184 (0.7772)
1.0147 (0.7591)
0.964 0.005 1.0155
(0.8485) 1.0341
(0.8479) 0.815 0.022
PSEC 0.0619
(0.0591) 0.0486
(0.0535) <0.001 0.236
0.0499 (0.0510)
0.0445 (0.0421)
0.288 0.114 0.0493
(0.0509) 0.0470
(0.0446) 0.631 0.047
EFF 0.6414
(0.1244) 0.5659
(0.1353) <0.001 0.581
0.6031 (0.1348)
0.5877 (0.1511)
0.314 0.108 0.6009
(0.1287) 0.5996
(0.1560) 0.930 0.009
ROA 0.0121
(0.0069) 0.0128
(0.0059) 0.053 0.104
0.0112 (0.0082)
0.0118 (0.0056)
0.450 0.081 0.0116
(0.0073) 0.0116
(0.0058) 0.918 0.010
ROE 0.1201
(0.1025) 0.1363
(0.0652) 0.001 0.189
0.1111 (0.2036)
0.1263 (0.0704)
0.350 0.100 0.1233
(0.1318) 0.1229
(0.0728) 0.953 0.004
NIM 0.0377
(0.0075) 0.0354
(0.0101) <0.001 0.253
0.0362 (0.0067)
0.0372 (0.0106)
0.283 0.115 0.0362
(0.0072) 0.0368
(0.0102) 0.508 0.067
CD 0.6954
(0.0998) 0.6033
(0.1458) <0.001 0.737
0.6322 (0.1288)
0.6248 (0.1252)
0.586 0.058 0.6347
(0.1275) 0.6344
(0.1174) 0.984 0.002
VLDR 0.1560
(0.1146) 0.2557
(0.1502) <0.001 0.746
0.2319 (0.1354)
0.2418 (0.1364)
0.494 0.073 0.2299
(0.1315) 0.2291
(0.1314) 0.952 0.006
LQ 0.3126
(0.1240) 0.2379
(0.1447) <0.001 0.555
0.2842 (0.1298)
0.2786 (0.1416)
0.698 0.042 0.2762
(0.1365) 0.2787
(0.1437) 0.860 0.018
RORA 0.0035
(0.0065) 0.0087
(0.0214) <0.001 0.329
0.0060 (0.0116)
0.0051 (0.0054)
0.354 0.099 0.0057
(0.0099) 0.0055
(0.0069) 0.802 0.023
LTD 0.0986
(0.0585) 0.0993
(0.0675) 0.805 0.012
0.1135 (0.0690)
0.1182 (0.0634)
0.509 0.071 0.1125
(0.0684) 0.1131
(0.0639) 0.934 0.008
UNST 4.7115
(0.8853) 5.0218
(1.0837) <0.001 0.314
5.1766 (1.1498)
5.1040 (1.0798)
0.543 0.065 5.1199
(1.0926) 5.1144
(1.0946) 0.958 0.005
GDPST 6.0673
(2.5235) 6.2180
(2.3392) 0.238 0.062
6.2766 (2.3424)
6.5743 (2.5988)
0.261 0.120 6.4267
(2.5574) 6.4710
(2.5703) 0.860 0.017
PMST 0.1314
(0.1063) 0.1267
(0.1069) 0.394 0.044
0.1389 (0.1177)
0.1415 (0.1217)
0.834 0.022 0.1412
(0.1164) 0.1397
(0.1194) 0.903 0.012
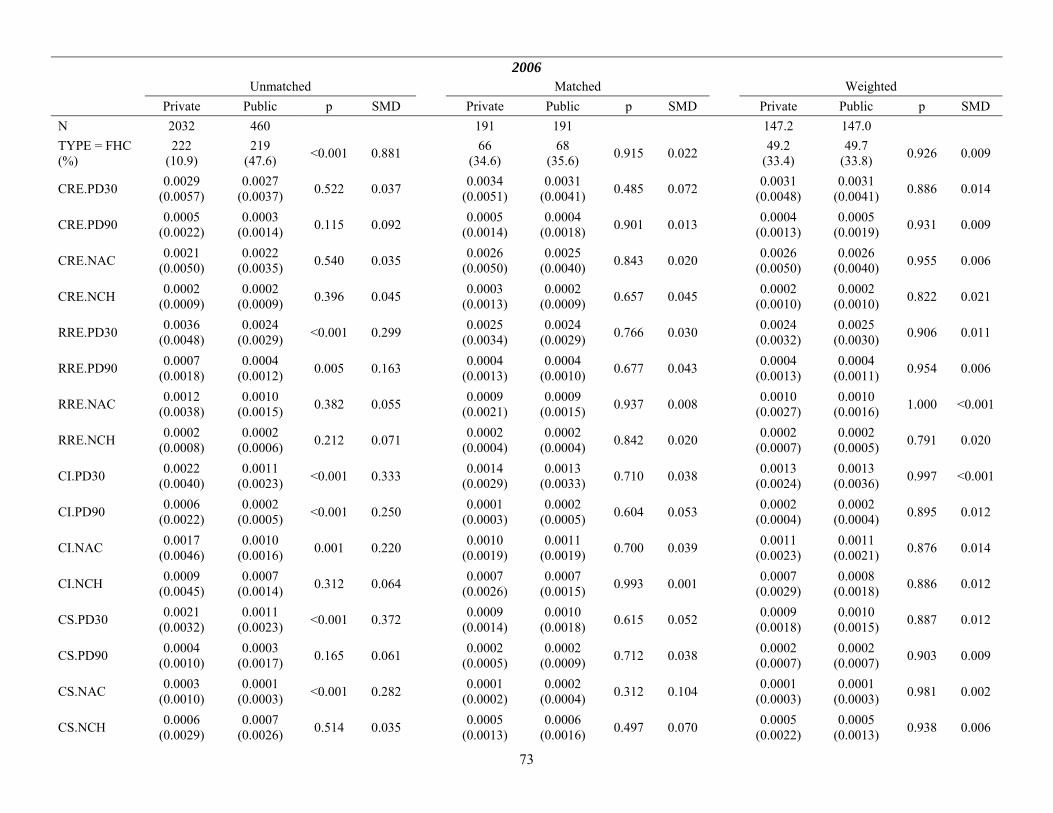
73
2006 Unmatched Matched Weighted
Private Public p SMD Private Public p SMD Private Public p SMD
N 2032 460 191 191 147.2 147.0
TYPE = FHC (%)
222 (10.9)
219 (47.6)
<0.001 0.881 66
(34.6) 68
(35.6) 0.915 0.022
49.2 (33.4)
49.7 (33.8)
0.926 0.009
CRE.PD30 0.0029
(0.0057) 0.0027
(0.0037) 0.522 0.037
0.0034 (0.0051)
0.0031 (0.0041)
0.485 0.072 0.0031
(0.0048) 0.0031
(0.0041) 0.886 0.014
CRE.PD90 0.0005
(0.0022) 0.0003
(0.0014) 0.115 0.092
0.0005 (0.0014)
0.0004 (0.0018)
0.901 0.013 0.0004
(0.0013) 0.0005
(0.0019) 0.931 0.009
CRE.NAC 0.0021
(0.0050) 0.0022
(0.0035) 0.540 0.035
0.0026 (0.0050)
0.0025 (0.0040)
0.843 0.020 0.0026
(0.0050) 0.0026
(0.0040) 0.955 0.006
CRE.NCH 0.0002
(0.0009) 0.0002
(0.0009) 0.396 0.045
0.0003 (0.0013)
0.0002 (0.0009)
0.657 0.045 0.0002
(0.0010) 0.0002
(0.0010) 0.822 0.021
RRE.PD30 0.0036
(0.0048) 0.0024
(0.0029) <0.001 0.299
0.0025 (0.0034)
0.0024 (0.0029)
0.766 0.030 0.0024
(0.0032) 0.0025
(0.0030) 0.906 0.011
RRE.PD90 0.0007
(0.0018) 0.0004
(0.0012) 0.005 0.163
0.0004 (0.0013)
0.0004 (0.0010)
0.677 0.043 0.0004
(0.0013) 0.0004
(0.0011) 0.954 0.006
RRE.NAC 0.0012
(0.0038) 0.0010
(0.0015) 0.382 0.055
0.0009 (0.0021)
0.0009 (0.0015)
0.937 0.008 0.0010
(0.0027) 0.0010
(0.0016) 1.000 <0.001
RRE.NCH 0.0002
(0.0008) 0.0002
(0.0006) 0.212 0.071
0.0002 (0.0004)
0.0002 (0.0004)
0.842 0.020 0.0002
(0.0007) 0.0002
(0.0005) 0.791 0.020
CI.PD30 0.0022
(0.0040) 0.0011
(0.0023) <0.001 0.333
0.0014 (0.0029)
0.0013 (0.0033)
0.710 0.038 0.0013
(0.0024) 0.0013
(0.0036) 0.997 <0.001
CI.PD90 0.0006
(0.0022) 0.0002
(0.0005) <0.001 0.250
0.0001 (0.0003)
0.0002 (0.0005)
0.604 0.053 0.0002
(0.0004) 0.0002
(0.0004) 0.895 0.012
CI.NAC 0.0017
(0.0046) 0.0010
(0.0016) 0.001 0.220
0.0010 (0.0019)
0.0011 (0.0019)
0.700 0.039 0.0011
(0.0023) 0.0011
(0.0021) 0.876 0.014
CI.NCH 0.0009
(0.0045) 0.0007
(0.0014) 0.312 0.064
0.0007 (0.0026)
0.0007 (0.0015)
0.993 0.001 0.0007
(0.0029) 0.0008
(0.0018) 0.886 0.012
CS.PD30 0.0021
(0.0032) 0.0011
(0.0023) <0.001 0.372
0.0009 (0.0014)
0.0010 (0.0018)
0.615 0.052 0.0009
(0.0018) 0.0010
(0.0015) 0.887 0.012
CS.PD90 0.0004
(0.0010) 0.0003
(0.0017) 0.165 0.061
0.0002 (0.0005)
0.0002 (0.0009)
0.712 0.038 0.0002
(0.0007) 0.0002
(0.0007) 0.903 0.009
CS.NAC 0.0003
(0.0010) 0.0001
(0.0003) <0.001 0.282
0.0001 (0.0002)
0.0002 (0.0004)
0.312 0.104 0.0001
(0.0003) 0.0001
(0.0003) 0.981 0.002
CS.NCH 0.0006
(0.0029) 0.0007
(0.0026) 0.514 0.035
0.0005 (0.0013)
0.0006 (0.0016)
0.497 0.070 0.0005
(0.0022) 0.0005
(0.0013) 0.938 0.006
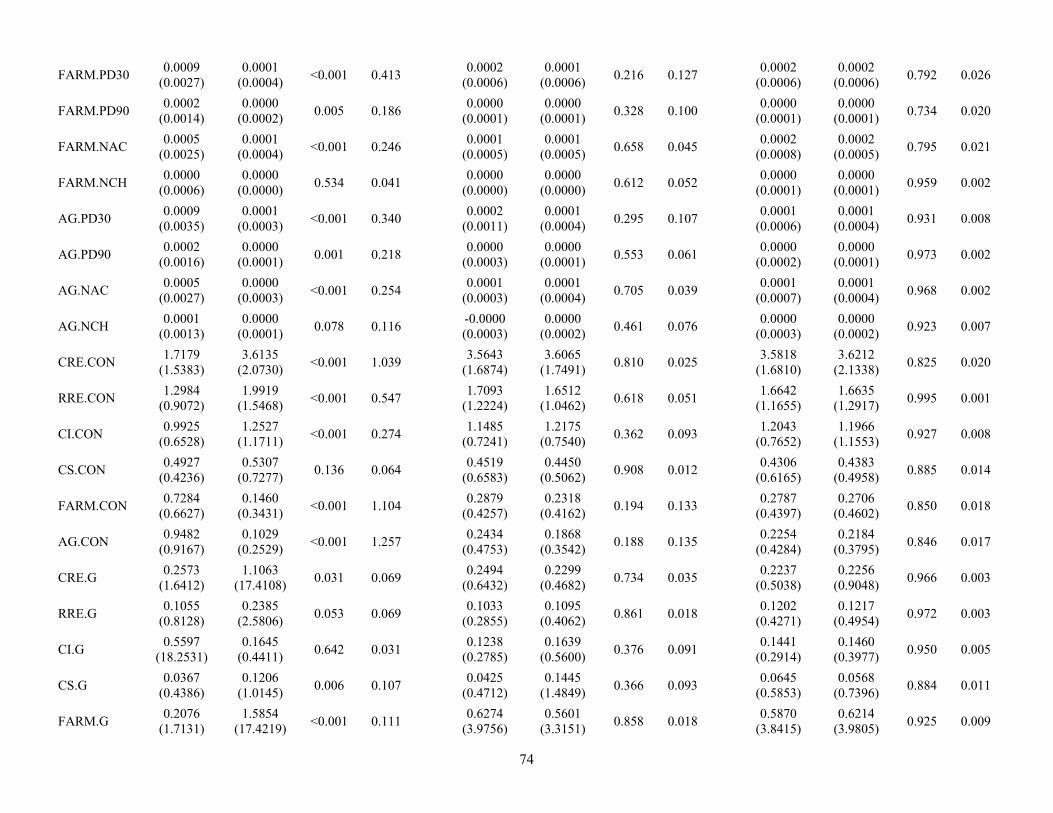
74
FARM.PD30 0.0009
(0.0027) 0.0001
(0.0004) <0.001 0.413
0.0002 (0.0006)
0.0001 (0.0006)
0.216 0.127 0.0002
(0.0006) 0.0002
(0.0006) 0.792 0.026
FARM.PD90 0.0002
(0.0014) 0.0000
(0.0002) 0.005 0.186
0.0000 (0.0001)
0.0000 (0.0001)
0.328 0.100 0.0000
(0.0001) 0.0000
(0.0001) 0.734 0.020
FARM.NAC 0.0005
(0.0025) 0.0001
(0.0004) <0.001 0.246
0.0001 (0.0005)
0.0001 (0.0005)
0.658 0.045 0.0002
(0.0008) 0.0002
(0.0005) 0.795 0.021
FARM.NCH 0.0000
(0.0006) 0.0000
(0.0000) 0.534 0.041
0.0000 (0.0000)
0.0000 (0.0000)
0.612 0.052 0.0000
(0.0001) 0.0000
(0.0001) 0.959 0.002
AG.PD30 0.0009
(0.0035) 0.0001
(0.0003) <0.001 0.340
0.0002 (0.0011)
0.0001 (0.0004)
0.295 0.107 0.0001
(0.0006) 0.0001
(0.0004) 0.931 0.008
AG.PD90 0.0002
(0.0016) 0.0000
(0.0001) 0.001 0.218
0.0000 (0.0003)
0.0000 (0.0001)
0.553 0.061 0.0000
(0.0002) 0.0000
(0.0001) 0.973 0.002
AG.NAC 0.0005
(0.0027) 0.0000
(0.0003) <0.001 0.254
0.0001 (0.0003)
0.0001 (0.0004)
0.705 0.039 0.0001
(0.0007) 0.0001
(0.0004) 0.968 0.002
AG.NCH 0.0001
(0.0013) 0.0000
(0.0001) 0.078 0.116
-0.0000 (0.0003)
0.0000 (0.0002)
0.461 0.076 0.0000
(0.0003) 0.0000
(0.0002) 0.923 0.007
CRE.CON 1.7179
(1.5383) 3.6135
(2.0730) <0.001 1.039
3.5643 (1.6874)
3.6065 (1.7491)
0.810 0.025 3.5818
(1.6810) 3.6212
(2.1338) 0.825 0.020
RRE.CON 1.2984
(0.9072) 1.9919
(1.5468) <0.001 0.547
1.7093 (1.2224)
1.6512 (1.0462)
0.618 0.051 1.6642
(1.1655) 1.6635
(1.2917) 0.995 0.001
CI.CON 0.9925
(0.6528) 1.2527
(1.1711) <0.001 0.274
1.1485 (0.7241)
1.2175 (0.7540)
0.362 0.093 1.2043
(0.7652) 1.1966
(1.1553) 0.927 0.008
CS.CON 0.4927
(0.4236) 0.5307
(0.7277) 0.136 0.064
0.4519 (0.6583)
0.4450 (0.5062)
0.908 0.012 0.4306
(0.6165) 0.4383
(0.4958) 0.885 0.014
FARM.CON 0.7284
(0.6627) 0.1460
(0.3431) <0.001 1.104
0.2879 (0.4257)
0.2318 (0.4162)
0.194 0.133 0.2787
(0.4397) 0.2706
(0.4602) 0.850 0.018
AG.CON 0.9482
(0.9167) 0.1029
(0.2529) <0.001 1.257
0.2434 (0.4753)
0.1868 (0.3542)
0.188 0.135 0.2254
(0.4284) 0.2184
(0.3795) 0.846 0.017
CRE.G 0.2573
(1.6412) 1.1063
(17.4108) 0.031 0.069
0.2494 (0.6432)
0.2299 (0.4682)
0.734 0.035 0.2237
(0.5038) 0.2256
(0.9048) 0.966 0.003
RRE.G 0.1055
(0.8128) 0.2385
(2.5806) 0.053 0.069
0.1033 (0.2855)
0.1095 (0.4062)
0.861 0.018 0.1202
(0.4271) 0.1217
(0.4954) 0.972 0.003
CI.G 0.5597
(18.2531) 0.1645
(0.4411) 0.642 0.031
0.1238 (0.2785)
0.1639 (0.5600)
0.376 0.091 0.1441
(0.2914) 0.1460
(0.3977) 0.950 0.005
CS.G 0.0367
(0.4386) 0.1206
(1.0145) 0.006 0.107
0.0425 (0.4712)
0.1445 (1.4849)
0.366 0.093 0.0645
(0.5853) 0.0568
(0.7396) 0.884 0.011
FARM.G 0.2076
(1.7131) 1.5854
(17.4219) <0.001 0.111
0.6274 (3.9756)
0.5601 (3.3151)
0.858 0.018 0.5870
(3.8415) 0.6214
(3.9805) 0.925 0.009

75
AG.G 0.1442
(2.2192) 2.6686
(43.2374) 0.009 0.082
0.0963 (1.1985)
0.1213 (0.8839)
0.817 0.024 0.2392
(2.9062) 0.2609
(2.8510) 0.900 0.008
PD30.G 2.1493
(19.5174) 1.5522
(6.3831) 0.517 0.041
1.9146 (10.7027)
2.2766 (9.1517)
0.723 0.036 2.2988
(12.1641) 1.9097
(8.0137) 0.722 0.038
PD90.G 3.3979
(29.3350) 10.1190
(127.3237) 0.032 0.073
5.8634 (50.9173)
2.9344 (14.7437)
0.446 0.078 5.7504
(48.3220) 5.2440
(70.9900) 0.882 0.008
NAC.G 2.8962
(24.8123) 6.2651
(56.9885) 0.049 0.077
2.4952 (9.5221)
1.8699 (14.2320)
0.614 0.052 2.6586
(18.2811) 2.4808
(20.0591) 0.904 0.009
SIZE 11.6376 (1.1868)
14.2660 (1.5561)
<0.001 1.899 13.3139 (0.9002)
13.4679 (1.0598)
0.127 0.157 13.3318 (0.9672)
13.3498 (1.0291)
0.849 0.018
T1LR 0.1031
(0.0311) 0.0865
(0.0204) <0.001 0.632
0.0890 (0.0153)
0.0890 (0.0186)
0.996 0.001 0.0891
(0.0157) 0.0891
(0.0200) 0.992 0.001
T1CR 0.1506
(0.0617) 0.1158
(0.1176) <0.001 0.370
0.1178 (0.0304)
0.1152 (0.0295)
0.406 0.085 0.1178
(0.0315) 0.1172
(0.0384) 0.867 0.015
TTCR 0.1615
(0.0617) 0.1296
(0.1167) <0.001 0.342
0.1292 (0.0298)
0.1267 (0.0291)
0.415 0.083 0.1291
(0.0308) 0.1285
(0.0380) 0.837 0.018
DELAL 1.7366
(1.5726) 1.2907
(2.1342) <0.001 0.238
1.2986 (1.2660)
1.2346 (0.9106)
0.571 0.058 1.2528
(1.0775) 1.2511
(0.9359) 0.987 0.002
PSEC 0.0593
(0.0557) 0.0502
(0.0569) 0.002 0.163
0.0517 (0.0471)
0.0463 (0.0495)
0.268 0.114 0.0508
(0.0486) 0.0490
(0.0526) 0.717 0.036
EFF 0.6489
(0.1298) 0.5727
(0.1212) <0.001 0.607
0.5961 (0.1241)
0.5895 (0.1160)
0.595 0.054 0.5948
(0.1279) 0.5943
(0.1110) 0.963 0.005
ROA 0.0118
(0.0068) 0.0123
(0.0065) 0.160 0.074
0.0120 (0.0054)
0.0116 (0.0058)
0.579 0.057 0.0116
(0.0059) 0.0117
(0.0061) 0.894 0.013
ROE 0.1176
(0.0777) 0.1287
(0.0689) 0.005 0.150
0.1284 (0.0531)
0.1235 (0.0582)
0.392 0.088 0.1244
(0.0788) 0.1256
(0.0637) 0.843 0.017
NIM 0.0372
(0.0078) 0.0350
(0.0114) <0.001 0.227
0.0363 (0.0078)
0.0359 (0.0131)
0.730 0.035 0.0361
(0.0071) 0.0364
(0.0137) 0.821 0.024
CD 0.6800
(0.1010) 0.5916
(0.1318) <0.001 0.752
0.6126 (0.1291)
0.5982 (0.1265)
0.271 0.113 0.6101
(0.1290) 0.6114
(0.1120) 0.911 0.011
VLDR 0.1623
(0.1183) 0.2608
(0.1393) <0.001 0.762
0.2470 (0.1319)
0.2588 (0.1276)
0.373 0.091 0.2478
(0.1339) 0.2469
(0.1193) 0.941 0.007
LQ 0.3276
(0.1227) 0.2587
(0.1458) <0.001 0.511
0.3047 (0.1474)
0.2949 (0.1444)
0.509 0.068 0.2979
(0.1438) 0.2954
(0.1367) 0.856 0.018
RORA 0.0033
(0.0068) 0.0072
(0.0196) <0.001 0.264
0.0047 (0.0088)
0.0047 (0.0073)
0.999 <0.001 0.0048
(0.0081) 0.0047
(0.0073) 0.884 0.011
LTD 0.1204
(0.0644) 0.1279
(0.0776) 0.031 0.105
0.1434 (0.0732)
0.1444 (0.0793)
0.901 0.013 0.1431
(0.0713) 0.1400
(0.0722) 0.656 0.043
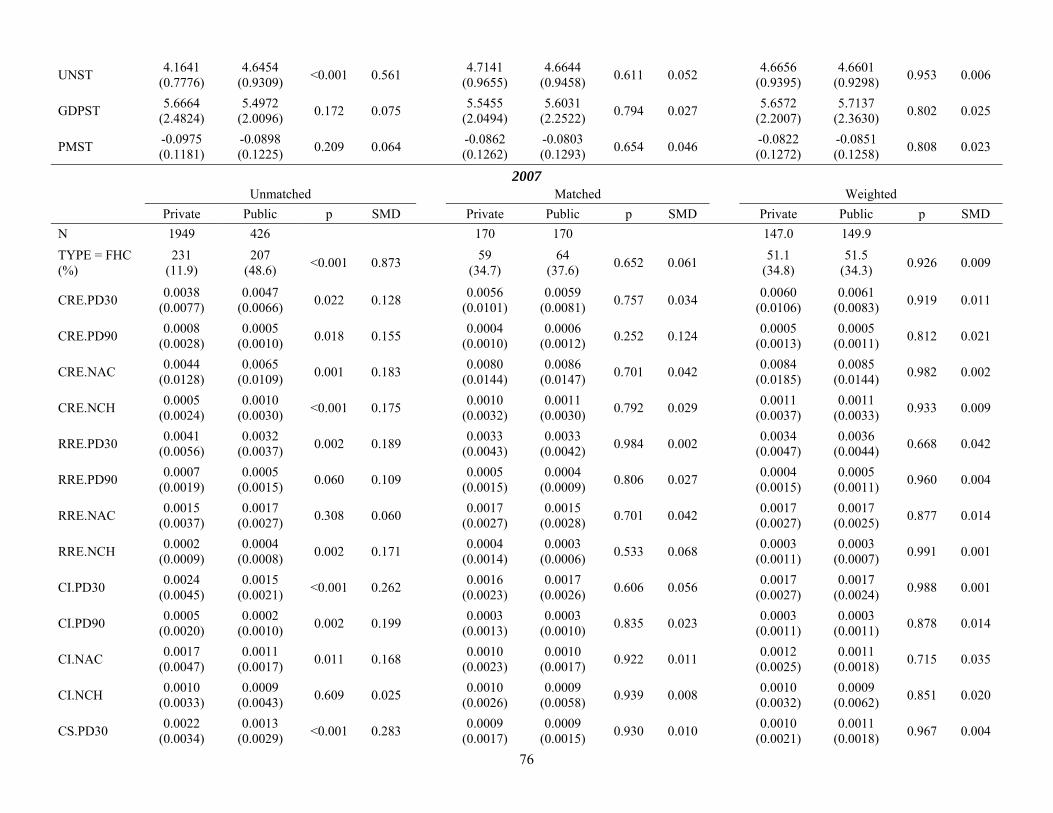
76
UNST 4.1641
(0.7776) 4.6454
(0.9309) <0.001 0.561
4.7141 (0.9655)
4.6644 (0.9458)
0.611 0.052 4.6656
(0.9395) 4.6601
(0.9298) 0.953 0.006
GDPST 5.6664
(2.4824) 5.4972
(2.0096) 0.172 0.075
5.5455 (2.0494)
5.6031 (2.2522)
0.794 0.027 5.6572
(2.2007) 5.7137
(2.3630) 0.802 0.025
PMST -0.0975 (0.1181)
-0.0898 (0.1225)
0.209 0.064 -0.0862 (0.1262)
-0.0803 (0.1293)
0.654 0.046 -0.0822 (0.1272)
-0.0851 (0.1258)
0.808 0.023
2007 Unmatched Matched Weighted
Private Public p SMD Private Public p SMD Private Public p SMD
N 1949 426 170 170 147.0 149.9
TYPE = FHC (%)
231 (11.9)
207 (48.6)
<0.001 0.873 59
(34.7) 64
(37.6) 0.652 0.061
51.1 (34.8)
51.5 (34.3)
0.926 0.009
CRE.PD30 0.0038
(0.0077) 0.0047
(0.0066) 0.022 0.128
0.0056 (0.0101)
0.0059 (0.0081)
0.757 0.034 0.0060
(0.0106) 0.0061
(0.0083) 0.919 0.011
CRE.PD90 0.0008
(0.0028) 0.0005
(0.0010) 0.018 0.155
0.0004 (0.0010)
0.0006 (0.0012)
0.252 0.124 0.0005
(0.0013) 0.0005
(0.0011) 0.812 0.021
CRE.NAC 0.0044
(0.0128) 0.0065
(0.0109) 0.001 0.183
0.0080 (0.0144)
0.0086 (0.0147)
0.701 0.042 0.0084
(0.0185) 0.0085
(0.0144) 0.982 0.002
CRE.NCH 0.0005
(0.0024) 0.0010
(0.0030) <0.001 0.175
0.0010 (0.0032)
0.0011 (0.0030)
0.792 0.029 0.0011
(0.0037) 0.0011
(0.0033) 0.933 0.009
RRE.PD30 0.0041
(0.0056) 0.0032
(0.0037) 0.002 0.189
0.0033 (0.0043)
0.0033 (0.0042)
0.984 0.002 0.0034
(0.0047) 0.0036
(0.0044) 0.668 0.042
RRE.PD90 0.0007
(0.0019) 0.0005
(0.0015) 0.060 0.109
0.0005 (0.0015)
0.0004 (0.0009)
0.806 0.027 0.0004
(0.0015) 0.0005
(0.0011) 0.960 0.004
RRE.NAC 0.0015
(0.0037) 0.0017
(0.0027) 0.308 0.060
0.0017 (0.0027)
0.0015 (0.0028)
0.701 0.042 0.0017
(0.0027) 0.0017
(0.0025) 0.877 0.014
RRE.NCH 0.0002
(0.0009) 0.0004
(0.0008) 0.002 0.171
0.0004 (0.0014)
0.0003 (0.0006)
0.533 0.068 0.0003
(0.0011) 0.0003
(0.0007) 0.991 0.001
CI.PD30 0.0024
(0.0045) 0.0015
(0.0021) <0.001 0.262
0.0016 (0.0023)
0.0017 (0.0026)
0.606 0.056 0.0017
(0.0027) 0.0017
(0.0024) 0.988 0.001
CI.PD90 0.0005
(0.0020) 0.0002
(0.0010) 0.002 0.199
0.0003 (0.0013)
0.0003 (0.0010)
0.835 0.023 0.0003
(0.0011) 0.0003
(0.0011) 0.878 0.014
CI.NAC 0.0017
(0.0047) 0.0011
(0.0017) 0.011 0.168
0.0010 (0.0023)
0.0010 (0.0017)
0.922 0.011 0.0012
(0.0025) 0.0011
(0.0018) 0.715 0.035
CI.NCH 0.0010
(0.0033) 0.0009
(0.0043) 0.609 0.025
0.0010 (0.0026)
0.0009 (0.0058)
0.939 0.008 0.0010
(0.0032) 0.0009
(0.0062) 0.851 0.020
CS.PD30 0.0022
(0.0034) 0.0013
(0.0029) <0.001 0.283
0.0009 (0.0017)
0.0009 (0.0015)
0.930 0.010 0.0010
(0.0021) 0.0011
(0.0018) 0.967 0.004
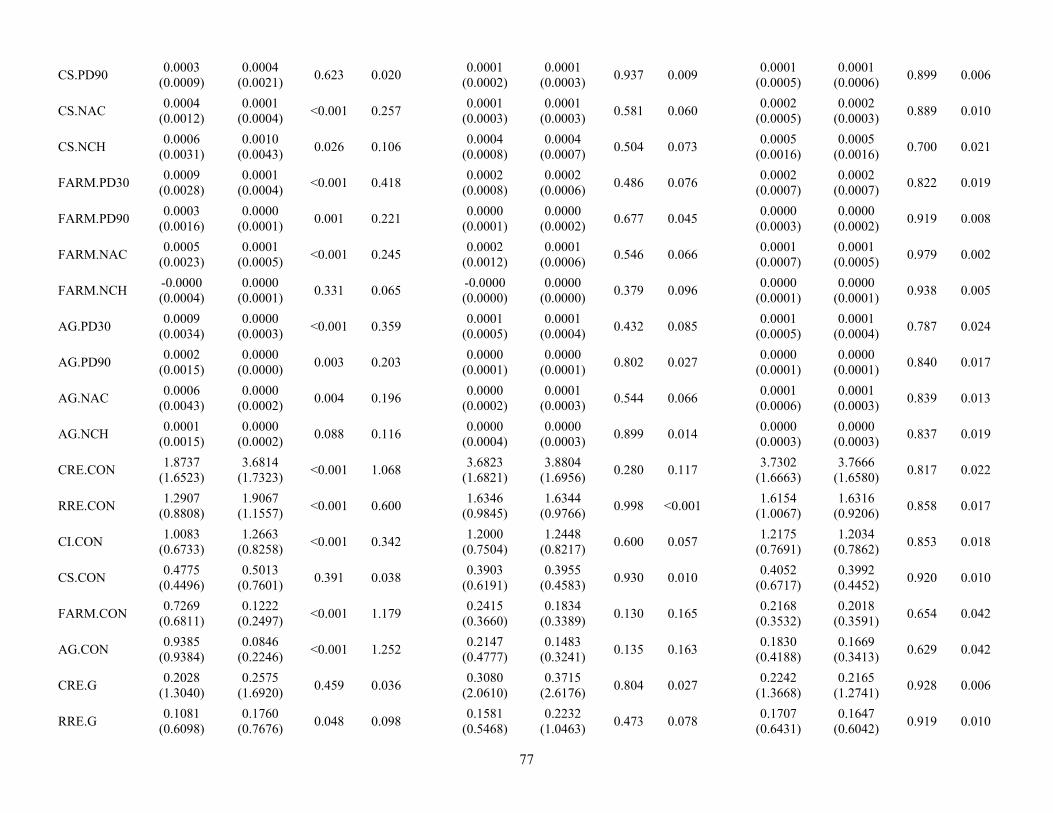
77
CS.PD90 0.0003
(0.0009) 0.0004
(0.0021) 0.623 0.020
0.0001 (0.0002)
0.0001 (0.0003)
0.937 0.009 0.0001
(0.0005) 0.0001
(0.0006) 0.899 0.006
CS.NAC 0.0004
(0.0012) 0.0001
(0.0004) <0.001 0.257
0.0001 (0.0003)
0.0001 (0.0003)
0.581 0.060 0.0002
(0.0005) 0.0002
(0.0003) 0.889 0.010
CS.NCH 0.0006
(0.0031) 0.0010
(0.0043) 0.026 0.106
0.0004 (0.0008)
0.0004 (0.0007)
0.504 0.073 0.0005
(0.0016) 0.0005
(0.0016) 0.700 0.021
FARM.PD30 0.0009
(0.0028) 0.0001
(0.0004) <0.001 0.418
0.0002 (0.0008)
0.0002 (0.0006)
0.486 0.076 0.0002
(0.0007) 0.0002
(0.0007) 0.822 0.019
FARM.PD90 0.0003
(0.0016) 0.0000
(0.0001) 0.001 0.221
0.0000 (0.0001)
0.0000 (0.0002)
0.677 0.045 0.0000
(0.0003) 0.0000
(0.0002) 0.919 0.008
FARM.NAC 0.0005
(0.0023) 0.0001
(0.0005) <0.001 0.245
0.0002 (0.0012)
0.0001 (0.0006)
0.546 0.066 0.0001
(0.0007) 0.0001
(0.0005) 0.979 0.002
FARM.NCH -0.0000 (0.0004)
0.0000 (0.0001)
0.331 0.065 -0.0000 (0.0000)
0.0000 (0.0000)
0.379 0.096 0.0000
(0.0001) 0.0000
(0.0001) 0.938 0.005
AG.PD30 0.0009
(0.0034) 0.0000
(0.0003) <0.001 0.359
0.0001 (0.0005)
0.0001 (0.0004)
0.432 0.085 0.0001
(0.0005) 0.0001
(0.0004) 0.787 0.024
AG.PD90 0.0002
(0.0015) 0.0000
(0.0000) 0.003 0.203
0.0000 (0.0001)
0.0000 (0.0001)
0.802 0.027 0.0000
(0.0001) 0.0000
(0.0001) 0.840 0.017
AG.NAC 0.0006
(0.0043) 0.0000
(0.0002) 0.004 0.196
0.0000 (0.0002)
0.0001 (0.0003)
0.544 0.066 0.0001
(0.0006) 0.0001
(0.0003) 0.839 0.013
AG.NCH 0.0001
(0.0015) 0.0000
(0.0002) 0.088 0.116
0.0000 (0.0004)
0.0000 (0.0003)
0.899 0.014 0.0000
(0.0003) 0.0000
(0.0003) 0.837 0.019
CRE.CON 1.8737
(1.6523) 3.6814
(1.7323) <0.001 1.068
3.6823 (1.6821)
3.8804 (1.6956)
0.280 0.117 3.7302
(1.6663) 3.7666
(1.6580) 0.817 0.022
RRE.CON 1.2907
(0.8808) 1.9067
(1.1557) <0.001 0.600
1.6346 (0.9845)
1.6344 (0.9766)
0.998 <0.001 1.6154
(1.0067) 1.6316
(0.9206) 0.858 0.017
CI.CON 1.0083
(0.6733) 1.2663
(0.8258) <0.001 0.342
1.2000 (0.7504)
1.2448 (0.8217)
0.600 0.057 1.2175
(0.7691) 1.2034
(0.7862) 0.853 0.018
CS.CON 0.4775
(0.4496) 0.5013
(0.7601) 0.391 0.038
0.3903 (0.6191)
0.3955 (0.4583)
0.930 0.010 0.4052
(0.6717) 0.3992
(0.4452) 0.920 0.010
FARM.CON 0.7269
(0.6811) 0.1222
(0.2497) <0.001 1.179
0.2415 (0.3660)
0.1834 (0.3389)
0.130 0.165 0.2168
(0.3532) 0.2018
(0.3591) 0.654 0.042
AG.CON 0.9385
(0.9384) 0.0846
(0.2246) <0.001 1.252
0.2147 (0.4777)
0.1483 (0.3241)
0.135 0.163 0.1830
(0.4188) 0.1669
(0.3413) 0.629 0.042
CRE.G 0.2028
(1.3040) 0.2575
(1.6920) 0.459 0.036
0.3080 (2.0610)
0.3715 (2.6176)
0.804 0.027 0.2242
(1.3668) 0.2165
(1.2741) 0.928 0.006
RRE.G 0.1081
(0.6098) 0.1760
(0.7676) 0.048 0.098
0.1581 (0.5468)
0.2232 (1.0463)
0.473 0.078 0.1707
(0.6431) 0.1647
(0.6042) 0.919 0.010
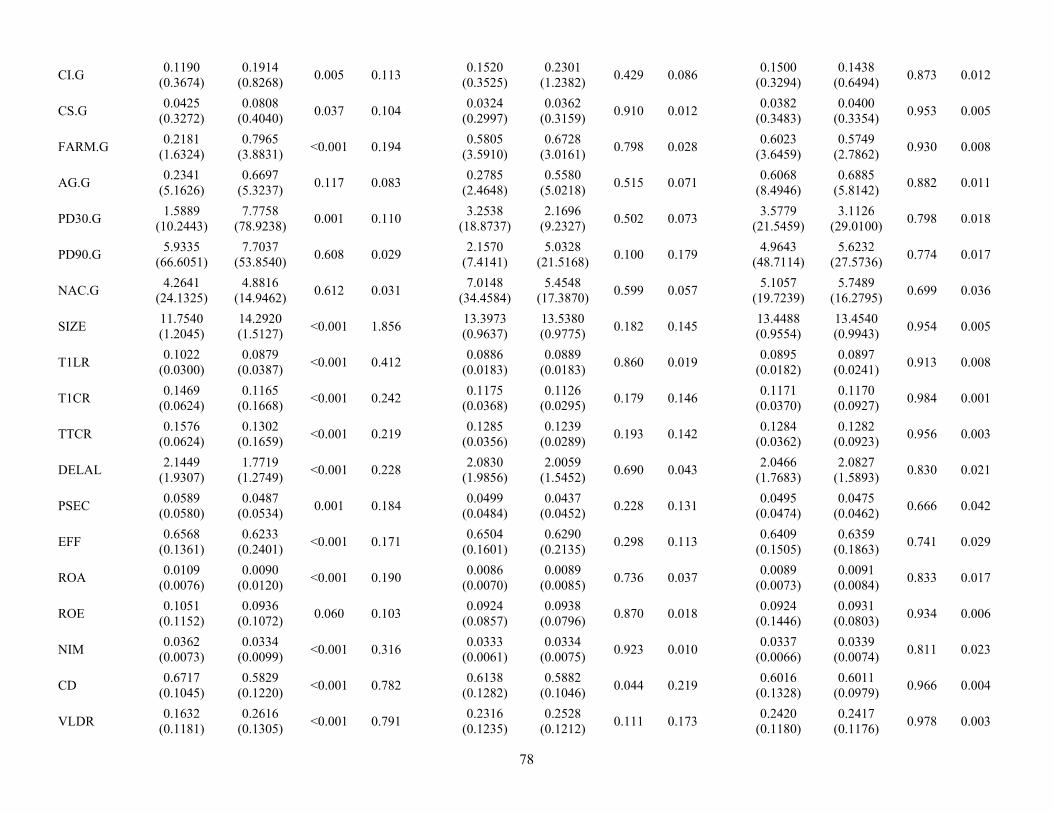
78
CI.G 0.1190
(0.3674) 0.1914
(0.8268) 0.005 0.113
0.1520 (0.3525)
0.2301 (1.2382)
0.429 0.086 0.1500
(0.3294) 0.1438
(0.6494) 0.873 0.012
CS.G 0.0425
(0.3272) 0.0808
(0.4040) 0.037 0.104
0.0324 (0.2997)
0.0362 (0.3159)
0.910 0.012 0.0382
(0.3483) 0.0400
(0.3354) 0.953 0.005
FARM.G 0.2181
(1.6324) 0.7965
(3.8831) <0.001 0.194
0.5805 (3.5910)
0.6728 (3.0161)
0.798 0.028 0.6023
(3.6459) 0.5749
(2.7862) 0.930 0.008
AG.G 0.2341
(5.1626) 0.6697
(5.3237) 0.117 0.083
0.2785 (2.4648)
0.5580 (5.0218)
0.515 0.071 0.6068
(8.4946) 0.6885
(5.8142) 0.882 0.011
PD30.G 1.5889
(10.2443) 7.7758
(78.9238) 0.001 0.110
3.2538 (18.8737)
2.1696 (9.2327)
0.502 0.073 3.5779
(21.5459) 3.1126
(29.0100) 0.798 0.018
PD90.G 5.9335
(66.6051) 7.7037
(53.8540) 0.608 0.029
2.1570 (7.4141)
5.0328 (21.5168)
0.100 0.179 4.9643
(48.7114) 5.6232
(27.5736) 0.774 0.017
NAC.G 4.2641
(24.1325) 4.8816
(14.9462) 0.612 0.031
7.0148 (34.4584)
5.4548 (17.3870)
0.599 0.057 5.1057
(19.7239) 5.7489
(16.2795) 0.699 0.036
SIZE 11.7540 (1.2045)
14.2920 (1.5127)
<0.001 1.856 13.3973 (0.9637)
13.5380 (0.9775)
0.182 0.145 13.4488 (0.9554)
13.4540 (0.9943)
0.954 0.005
T1LR 0.1022
(0.0300) 0.0879
(0.0387) <0.001 0.412
0.0886 (0.0183)
0.0889 (0.0183)
0.860 0.019 0.0895
(0.0182) 0.0897
(0.0241) 0.913 0.008
T1CR 0.1469
(0.0624) 0.1165
(0.1668) <0.001 0.242
0.1175 (0.0368)
0.1126 (0.0295)
0.179 0.146 0.1171
(0.0370) 0.1170
(0.0927) 0.984 0.001
TTCR 0.1576
(0.0624) 0.1302
(0.1659) <0.001 0.219
0.1285 (0.0356)
0.1239 (0.0289)
0.193 0.142 0.1284
(0.0362) 0.1282
(0.0923) 0.956 0.003
DELAL 2.1449
(1.9307) 1.7719
(1.2749) <0.001 0.228
2.0830 (1.9856)
2.0059 (1.5452)
0.690 0.043 2.0466
(1.7683) 2.0827
(1.5893) 0.830 0.021
PSEC 0.0589
(0.0580) 0.0487
(0.0534) 0.001 0.184
0.0499 (0.0484)
0.0437 (0.0452)
0.228 0.131 0.0495
(0.0474) 0.0475
(0.0462) 0.666 0.042
EFF 0.6568
(0.1361) 0.6233
(0.2401) <0.001 0.171
0.6504 (0.1601)
0.6290 (0.2135)
0.298 0.113 0.6409
(0.1505) 0.6359
(0.1863) 0.741 0.029
ROA 0.0109
(0.0076) 0.0090
(0.0120) <0.001 0.190
0.0086 (0.0070)
0.0089 (0.0085)
0.736 0.037 0.0089
(0.0073) 0.0091
(0.0084) 0.833 0.017
ROE 0.1051
(0.1152) 0.0936
(0.1072) 0.060 0.103
0.0924 (0.0857)
0.0938 (0.0796)
0.870 0.018 0.0924
(0.1446) 0.0931
(0.0803) 0.934 0.006
NIM 0.0362
(0.0073) 0.0334
(0.0099) <0.001 0.316
0.0333 (0.0061)
0.0334 (0.0075)
0.923 0.010 0.0337
(0.0066) 0.0339
(0.0074) 0.811 0.023
CD 0.6717
(0.1045) 0.5829
(0.1220) <0.001 0.782
0.6138 (0.1282)
0.5882 (0.1046)
0.044 0.219 0.6016
(0.1328) 0.6011
(0.0979) 0.966 0.004
VLDR 0.1632
(0.1181) 0.2616
(0.1305) <0.001 0.791
0.2316 (0.1235)
0.2528 (0.1212)
0.111 0.173 0.2420
(0.1180) 0.2417
(0.1176) 0.978 0.003

79
LQ 0.3352
(0.1227) 0.2624
(0.1368) <0.001 0.560
0.3002 (0.1419)
0.3085 (0.1365)
0.586 0.059 0.3016
(0.1440) 0.3018
(0.1362) 0.989 0.001
RORA 0.0035
(0.0081) 0.0062
(0.0124) <0.001 0.257
0.0043 (0.0067)
0.0044 (0.0058)
0.927 0.010 0.0047
(0.0081) 0.0046
(0.0072) 0.849 0.016
LTD 0.1241
(0.0658) 0.1213
(0.0710) 0.427 0.041
0.1330 (0.0708)
0.1386 (0.0667)
0.457 0.081 0.1354
(0.0730) 0.1341
(0.0639) 0.851 0.019
UNST 4.5900
(0.8667) 4.9977
(0.9286) <0.001 0.454
5.0406 (0.9351)
5.0394 (0.8565)
0.990 0.001 5.0720
(0.9205) 5.0591
(0.9089) 0.888 0.014
GDPST 5.3508
(2.1445) 4.1486
(1.7913) <0.001 0.608
4.6135 (1.9391)
4.6018 (1.9930)
0.956 0.006 4.5489
(1.9882) 4.5784
(1.9689) 0.876 0.015
PMST -0.1834 (0.0965)
-0.1982 (0.1011)
0.004 0.150 -0.2207 (0.1075)
-0.2162 (0.1047)
0.701 0.042 -0.2191 (0.1062)
-0.2177 (0.1070)
0.894 0.013
2008 Unmatched Matched Weighted
Private Public p SMD Private Public p SMD Private Public p SMD
N 2031 415 201 201 165.6 171.7
TYPE = FHC (%)
226 (11.1)
187 (45.1)
<0.001 0.815 66
(32.8) 72
(35.8) 0.599 0.063
58.5 (35.3)
58.7 (34.2)
0.801 0.024
CRE.PD30 0.0044
(0.0078) 0.0076
(0.0098) <0.001 0.358
0.0079 (0.0103)
0.0090 (0.0111)
0.315 0.100 0.0083
(0.0101) 0.0089
(0.0116) 0.596 0.051
CRE.PD90 0.0009
(0.0031) 0.0008
(0.0019) 0.487 0.043
0.0009 (0.0025)
0.0010 (0.0023)
0.677 0.042 0.0010
(0.0026) 0.0010
(0.0023) 0.835 0.019
CRE.NAC 0.0089
(0.0196) 0.0203
(0.0382) <0.001 0.378
0.0190 (0.0350)
0.0202 (0.0303)
0.705 0.038 0.0194
(0.0331) 0.0206
(0.0332) 0.684 0.036
CRE.NCH 0.0019
(0.0067) 0.0067
(0.0294) <0.001 0.226
0.0048 (0.0141)
0.0050 (0.0092)
0.857 0.018 0.0049
(0.0120) 0.0052
(0.0143) 0.770 0.021
RRE.PD30 0.0043
(0.0058) 0.0040
(0.0042) 0.282 0.064
0.0038 (0.0050)
0.0041 (0.0044)
0.572 0.056 0.0040
(0.0051) 0.0040
(0.0043) 0.968 0.004
RRE.PD90 0.0007
(0.0022) 0.0007
(0.0018) 0.779 0.016
0.0004 (0.0007)
0.0004 (0.0009)
0.296 0.104 0.0004
(0.0008) 0.0004
(0.0012) 0.850 0.014
RRE.NAC 0.0022
(0.0047) 0.0034
(0.0047) <0.001 0.242
0.0034 (0.0053)
0.0034 (0.0053)
0.961 0.005 0.0034
(0.0051) 0.0035
(0.0054) 0.922 0.009
RRE.NCH 0.0004
(0.0011) 0.0012
(0.0036) <0.001 0.313
0.0010 (0.0020)
0.0010 (0.0018)
0.992 0.001 0.0010
(0.0019) 0.0010
(0.0018) 0.905 0.011
CI.PD30 0.0024
(0.0045) 0.0018
(0.0029) 0.022 0.139
0.0020 (0.0046)
0.0020 (0.0036)
0.996 0.001 0.0020
(0.0039) 0.0021
(0.0039) 0.841 0.019
CI.PD90 0.0005
(0.0021) 0.0002
(0.0006) 0.017 0.160
0.0002 (0.0005)
0.0002 (0.0006)
0.158 0.141 0.0002
(0.0011) 0.0003
(0.0006) 0.565 0.039

80
CI.NAC 0.0023
(0.0058) 0.0022
(0.0035) 0.757 0.019
0.0017 (0.0030)
0.0020 (0.0040)
0.397 0.085 0.0018
(0.0032) 0.0020
(0.0038) 0.662 0.038
CI.NCH 0.0014
(0.0055) 0.0016
(0.0023) 0.517 0.042
0.0013 (0.0028)
0.0014 (0.0019)
0.765 0.030 0.0013
(0.0026) 0.0013
(0.0019) 0.880 0.013
CS.PD30 0.0020
(0.0032) 0.0014
(0.0040) 0.003 0.150
0.0008 (0.0015)
0.0009 (0.0015)
0.499 0.067 0.0009
(0.0020) 0.0010
(0.0019) 0.854 0.015
CS.PD90 0.0003
(0.0009) 0.0005
(0.0032) 0.018 0.085
0.0001 (0.0003)
0.0001 (0.0004)
0.787 0.027 0.0001
(0.0005) 0.0001
(0.0008) 0.746 0.026
CS.NAC 0.0004
(0.0011) 0.0002
(0.0005) 0.004 0.185
0.0002 (0.0003)
0.0002 (0.0006)
0.108 0.161 0.0002
(0.0006) 0.0002
(0.0005) 0.856 0.013
CS.NCH 0.0008
(0.0045) 0.0015
(0.0067) 0.007 0.127
0.0006 (0.0010)
0.0006 (0.0015)
0.767 0.030 0.0006
(0.0021) 0.0007
(0.0023) 0.836 0.015
FARM.PD30 0.0009
(0.0030) 0.0002
(0.0009) <0.001 0.351
0.0003 (0.0012)
0.0003 (0.0012)
0.831 0.021 0.0002
(0.0010) 0.0003
(0.0012) 0.797 0.021
FARM.PD90 0.0002
(0.0016) 0.0000
(0.0001) 0.010 0.179
0.0000 (0.0001)
0.0000 (0.0001)
0.535 0.062 0.0000
(0.0002) 0.0000
(0.0001) 0.942 0.005
FARM.NAC 0.0006
(0.0025) 0.0002
(0.0011) 0.003 0.194
0.0003 (0.0019)
0.0002 (0.0013)
0.513 0.065 0.0002
(0.0014) 0.0003
(0.0015) 0.860 0.015
FARM.NCH 0.0000
(0.0006) 0.0000
(0.0002) 0.581 0.037
0.0001 (0.0006)
0.0000 (0.0002)
0.538 0.061 0.0000
(0.0005) 0.0000
(0.0002) 0.956 0.004
AG.PD30 0.0008
(0.0031) 0.0000
(0.0002) <0.001 0.362
0.0001 (0.0003)
0.0000 (0.0002)
0.735 0.034 0.0001
(0.0003) 0.0001
(0.0002) 0.701 0.034
AG.PD90 0.0002
(0.0015) 0.0000
(0.0001) 0.008 0.185
0.0000 (0.0000)
0.0000 (0.0001)
0.430 0.079 0.0000
(0.0002) 0.0000
(0.0001) 0.721 0.017
AG.NAC 0.0005
(0.0032) 0.0001
(0.0005) 0.006 0.190
0.0001 (0.0007)
0.0001 (0.0007)
0.785 0.027 0.0001
(0.0012) 0.0001
(0.0007) 0.847 0.011
AG.NCH 0.0002
(0.0019) 0.0000
(0.0001) 0.093 0.116
-0.0000 (0.0004)
0.0000 (0.0002)
0.527 0.063 0.0000
(0.0004) 0.0000
(0.0002) 0.978 0.001
CRE.CON 1.9542
(1.7008) 3.7516
(1.7057) <0.001 1.055
3.8725 (1.8590)
4.0453 (1.6462)
0.324 0.098 3.9417
(1.8566) 3.9938
(1.7090) 0.748 0.029
RRE.CON 1.3791
(0.9434) 1.9432
(1.4961) <0.001 0.451
1.6823 (1.0073)
1.7862 (1.2703)
0.364 0.091 1.7536
(1.0080) 1.7297
(1.0809) 0.793 0.023
CI.CON 0.9836
(0.6617) 1.2202
(0.7993) <0.001 0.322
1.1466 (0.7155)
1.2017 (0.8007)
0.467 0.073 1.1596
(0.7111) 1.1809
(0.8134) 0.765 0.028
CS.CON 0.4452
(0.3986) 0.4413
(0.6467) 0.873 0.007
0.3437 (0.4173)
0.3464 (0.4555)
0.950 0.006 0.3477
(0.4634) 0.3385
(0.4371) 0.811 0.020
FARM.CON 0.7552
(0.6896) 0.1336
(0.2682) <0.001 1.188
0.2849 (0.5968)
0.2063 (0.3559)
0.110 0.160 0.2437
(0.3906) 0.2234
(0.3758) 0.547 0.053

81
AG.CON 0.9162
(0.9251) 0.0837
(0.2140) <0.001 1.240
0.1563 (0.3462)
0.1315 (0.2820)
0.432 0.078 0.1556
(0.3217) 0.1433
(0.2921) 0.622 0.040
CRE.G 0.5109
(8.7703) 0.1352
(0.3936) 0.383 0.061
0.1227 (0.1979)
0.1186 (0.3642)
0.887 0.014 0.1185
(0.2653) 0.1137
(0.3548) 0.856 0.015
RRE.G 0.1487
(0.4190) 0.1930
(0.5411) 0.063 0.091
0.2151 (0.4357)
0.1747 (0.3492)
0.306 0.102 0.1981
(0.4057) 0.1946
(0.4948) 0.926 0.008
CI.G 0.0769
(0.3756) 0.1630
(0.8729) 0.001 0.128
0.1432 (0.5398)
0.1079 (0.3475)
0.437 0.078 0.1279
(0.4439) 0.1208
(0.5869) 0.850 0.014
CS.G 0.0144
(0.3010) 0.0293
(0.5097) 0.423 0.036
0.0186 (0.4134)
0.0115 (0.6341)
0.895 0.013 0.0187
(0.4060) 0.0207
(0.6523) 0.971 0.004
FARM.G 0.4274
(5.5802) 0.3839
(2.0929) 0.876 0.010
0.5382 (2.3268)
0.5647 (2.8179)
0.918 0.010 0.4996
(2.2282) 0.4826
(2.6389) 0.940 0.007
AG.G 0.1482
(1.6056) 1.1073
(9.7162) <0.001 0.138
0.7005 (4.5921)
0.3461 (3.0433)
0.362 0.091 0.4420
(3.4268) 0.4238
(3.8868) 0.954 0.005
PD30.G 1.9573
(17.6632) 2.7155
(18.3228) 0.429 0.042
3.1445 (19.9351)
2.3340 (8.8663)
0.599 0.053 2.6008
(15.5268) 2.5961
(12.2346) 0.996 <0.001
PD90.G 3.8564
(34.4954) 9.8166
(107.5859) 0.042 0.075
7.0920 (65.5209)
13.8043 (146.3592)
0.553 0.059 9.3802
(78.5650) 7.5817
(90.3340) 0.794 0.021
NAC.G 6.5337
(57.5716) 6.0404
(21.8798) 0.863 0.011
7.7761 (36.6216)
8.5965 (30.0997)
0.806 0.024 8.6628
(59.6778) 9.2902
(32.3131) 0.846 0.013
SIZE 11.8625 (1.2020)
14.3855 (1.5499)
<0.001 1.819 13.5370 (0.8869)
13.6083 (0.9157)
0.428 0.079 13.5215 (0.9452)
13.5231 (0.9117)
0.984 0.002
T1LR 0.0994
(0.0301) 0.0844
(0.0167) <0.001 0.614
0.0860 (0.0181)
0.0849 (0.0158)
0.511 0.066 0.0851
(0.0180) 0.0850
(0.0150) 0.952 0.005
T1CR 0.1436
(0.0646) 0.1075
(0.0280) <0.001 0.726
0.1132 (0.0358)
0.1088 (0.0289)
0.169 0.138 0.1107
(0.0313) 0.1103
(0.0308) 0.876 0.014
TTCR 0.1546
(0.0643) 0.1223
(0.0270) <0.001 0.655
0.1259 (0.0346)
0.1216 (0.0281)
0.167 0.138 0.1234
(0.0300) 0.1230
(0.0299) 0.886 0.013
DELAL 2.4153
(2.1483) 2.5890
(3.0976) 0.168 0.065
2.4666 (1.7463)
2.6780 (1.7150)
0.221 0.122 2.5764
(1.7403) 2.6696
(1.7794) 0.572 0.053
PSEC 0.0633
(0.0607) 0.0423
(0.0434) <0.001 0.398
0.0471 (0.0451)
0.0413 (0.0476)
0.210 0.125 0.0462
(0.0453) 0.0440
(0.0502) 0.623 0.045
EFF 0.6842
(0.2137) 0.7442
(0.7515) 0.002 0.109
0.7115 (0.2738)
0.7808 (0.6467)
0.163 0.139 0.7263
(0.3193) 0.7427
(0.7031) 0.712 0.030
ROA 0.0073
(0.0137) -0.0033 (0.0282)
<0.001 0.481 0.0006
(0.0263) -0.0018 (0.0247)
0.340 0.095 -0.0001 (0.0242)
-0.0009 (0.0236)
0.682 0.036
ROE 0.0623
(0.2118) -0.0582 (0.4033)
<0.001 0.374 -0.0182 (0.3331)
-0.0383 (0.3229)
0.539 0.061 -0.0241 (0.3245)
-0.0336 (0.3538)
0.731 0.028

82
NIM 0.0354
(0.0073) 0.0327
(0.0107) <0.001 0.287
0.0330 (0.0062)
0.0332 (0.0071)
0.772 0.029 0.0328
(0.0068) 0.0328
(0.0071) 0.927 0.008
CD 0.6530
(0.1130) 0.5428
(0.1391) <0.001 0.869
0.5797 (0.1374)
0.5632 (0.1162)
0.196 0.129 0.5686
(0.1392) 0.5663
(0.1158) 0.849 0.017
VLDR 0.1897
(0.1079) 0.2730
(0.1259) <0.001 0.710
0.2526 (0.1086)
0.2633 (0.1033)
0.315 0.100 0.2603
(0.1060) 0.2598
(0.1035) 0.956 0.005
LQ 0.3019
(0.1171) 0.2523
(0.1260) <0.001 0.408
0.2737 (0.1154)
0.2753 (0.1193)
0.894 0.013 0.2728
(0.1184) 0.2763
(0.1232) 0.750 0.029
RORA 0.0034
(0.0077) 0.0056
(0.0103) <0.001 0.247
0.0043 (0.0057)
0.0043 (0.0047)
0.944 0.007 0.0044
(0.0071) 0.0044
(0.0049) 0.960 0.005
LTD 0.1217
(0.0657) 0.1207
(0.0752) 0.772 0.015
0.1298 (0.0719)
0.1324 (0.0670)
0.700 0.038 0.1320
(0.0741) 0.1325
(0.0726) 0.947 0.006
UNST 6.0456
(1.4537) 7.3855
(1.4338) <0.001 0.928
7.3358 (1.4234)
7.3154 (1.3719)
0.884 0.015 7.3094
(1.3853) 7.3262
(1.3847) 0.894 0.012
GDPST 2.8575
(3.2493) 1.6125
(2.6701) <0.001 0.419
1.7428 (2.8039)
1.7040 (2.8681)
0.891 0.014 1.7008
(2.8520) 1.6587
(2.8288) 0.869 0.015
PMST -0.3213 (0.1099)
-0.3675 (0.0976)
<0.001 0.445 -0.3801 (0.0872)
-0.3782 (0.0872)
0.827 0.022 -0.3778 (0.0864)
-0.3788 (0.0863)
0.898 0.012
2009 Unmatched Matched Weighted
Private Public p SMD Private Public p SMD Private Public p SMD
N 2075 404 182 182 142.6 140.9
TYPE = FHC (%)
213 (10.3)
169 (41.8)
<0.001 0.771 56
(30.8) 55
(30.2) 1.000 0.012
41.1 (28.8)
40.4 (28.7)
0.983 0.002
CRE.PD30 0.0043
(0.0086) 0.0069
(0.0099) <0.001 0.286
0.0081 (0.0129)
0.0084 (0.0125)
0.849 0.020 0.0074
(0.0112) 0.0078
(0.0118) 0.748 0.032
CRE.PD90 0.0009
(0.0035) 0.0009
(0.0024) 0.984 0.001
0.0006 (0.0019)
0.0009 (0.0027)
0.350 0.098 0.0008
(0.0025) 0.0008
(0.0025) 0.951 0.006
CRE.NAC 0.0137
(0.0273) 0.0249
(0.0270) <0.001 0.413
0.0278 (0.0358)
0.0268 (0.0276)
0.760 0.032 0.0267
(0.0332) 0.0265
(0.0290) 0.962 0.005
CRE.NCH 0.0046
(0.0122) 0.0105
(0.0156) <0.001 0.422
0.0100 (0.0164)
0.0106 (0.0145)
0.717 0.038 0.0100
(0.0159) 0.0099
(0.0150) 0.915 0.011
RRE.PD30 0.0047
(0.0060) 0.0043
(0.0048) 0.265 0.065
0.0044 (0.0048)
0.0043 (0.0046)
0.869 0.017 0.0042
(0.0050) 0.0043
(0.0046) 0.823 0.021
RRE.PD90 0.0008
(0.0022) 0.0012
(0.0042) 0.006 0.118
0.0006 (0.0016)
0.0006 (0.0016)
0.769 0.031 0.0006
(0.0014) 0.0006
(0.0016) 0.824 0.023
RRE.NAC 0.0035
(0.0059) 0.0066
(0.0084) <0.001 0.433
0.0065 (0.0089)
0.0060 (0.0079)
0.556 0.062 0.0058
(0.0076) 0.0060
(0.0076) 0.767 0.028

83
RRE.NCH 0.0010
(0.0025) 0.0025
(0.0036) <0.001 0.491
0.0023 (0.0038)
0.0023 (0.0032)
0.945 0.007 0.0022
(0.0036) 0.0023
(0.0036) 0.809 0.025
CI.PD30 0.0022
(0.0043) 0.0018
(0.0034) 0.070 0.106
0.0018 (0.0030)
0.0019 (0.0041)
0.765 0.031 0.0018
(0.0030) 0.0018
(0.0036) 0.925 0.009
CI.PD90 0.0005
(0.0019) 0.0003
(0.0007) 0.015 0.163
0.0002 (0.0006)
0.0002 (0.0006)
0.402 0.088 0.0002
(0.0006) 0.0002
(0.0005) 0.877 0.015
CI.NAC 0.0030
(0.0063) 0.0033
(0.0039) 0.339 0.060
0.0025 (0.0040)
0.0028 (0.0038)
0.440 0.081 0.0026
(0.0042) 0.0026
(0.0036) 0.885 0.014
CI.NCH 0.0023
(0.0053) 0.0037
(0.0045) <0.001 0.284
0.0025 (0.0037)
0.0032 (0.0042)
0.097 0.174 0.0027
(0.0040) 0.0028
(0.0037) 0.777 0.027
CS.PD30 0.0019
(0.0034) 0.0015
(0.0040) 0.062 0.096
0.0011 (0.0025)
0.0010 (0.0030)
0.924 0.010 0.0011
(0.0024) 0.0011
(0.0032) 0.968 0.004
CS.PD90 0.0003
(0.0015) 0.0007
(0.0038) 0.002 0.118
0.0001 (0.0005)
0.0002 (0.0012)
0.652 0.047 0.0002
(0.0007) 0.0002
(0.0013) 0.888 0.013
CS.NAC 0.0004
(0.0015) 0.0003
(0.0006) 0.030 0.144
0.0003 (0.0011)
0.0003 (0.0008)
0.993 0.001 0.0003
(0.0009) 0.0003
(0.0008) 0.839 0.019
CS.NCH 0.0019
(0.0383) 0.0027
(0.0111) 0.682 0.028
0.0010 (0.0026)
0.0012 (0.0041)
0.584 0.057 0.0011
(0.0120) 0.0012
(0.0044) 0.766 0.012
FARM.PD30 0.0009
(0.0028) 0.0002
(0.0014) <0.001 0.334
0.0006 (0.0025)
0.0003 (0.0020)
0.330 0.102 0.0004
(0.0023) 0.0004
(0.0023) 0.866 0.018
FARM.PD90 0.0004
(0.0028) 0.0000
(0.0004) 0.017 0.166
0.0001 (0.0004)
0.0001 (0.0005)
0.759 0.032 0.0001
(0.0004) 0.0001
(0.0005) 0.910 0.011
FARM.NAC 0.0010
(0.0036) 0.0004
(0.0012) 0.001 0.225
0.0007 (0.0021)
0.0005 (0.0015)
0.222 0.128 0.0006
(0.0020) 0.0006
(0.0016) 0.848 0.020
FARM.NCH 0.0001
(0.0007) 0.0001
(0.0010) 0.395 0.039
0.0002 (0.0012)
0.0002 (0.0015)
0.735 0.035 0.0002
(0.0012) 0.0002
(0.0017) 0.988 0.002
AG.PD30 0.0007
(0.0023) 0.0000
(0.0002) <0.001 0.388
0.0001 (0.0002)
0.0000 (0.0002)
0.348 0.098 0.0000
(0.0002) 0.0000
(0.0002) 0.804 0.023
AG.PD90 0.0002
(0.0016) 0.0000
(0.0000) 0.012 0.177
0.0000 (0.0000)
0.0000 (0.0000)
0.577 0.058 0.0000
(0.0000) 0.0000
(0.0000) 0.877 0.014
AG.NAC 0.0007
(0.0034) 0.0001
(0.0009) 0.002 0.217
0.0002 (0.0016)
0.0002 (0.0012)
0.930 0.009 0.0002
(0.0014) 0.0002
(0.0010) 0.825 0.016
AG.NCH 0.0004
(0.0030) 0.0000
(0.0001) 0.026 0.157
0.0000 (0.0002)
0.0000 (0.0001)
0.336 0.101 0.0000
(0.0005) 0.0000
(0.0001) 0.973 0.002
CRE.CON 1.9092
(1.6588) 3.3138
(1.7457) <0.001 0.825
3.4261 (1.5957)
3.5534 (1.8051)
0.476 0.075 3.4046
(1.6594) 3.4292
(1.8367) 0.887 0.014
RRE.CON 1.3782
(0.9390) 1.8337
(1.3292) <0.001 0.396
1.6500 (0.9351)
1.6738 (0.9223)
0.807 0.026 1.6310
(0.9128) 1.6324
(0.8878) 0.987 0.002
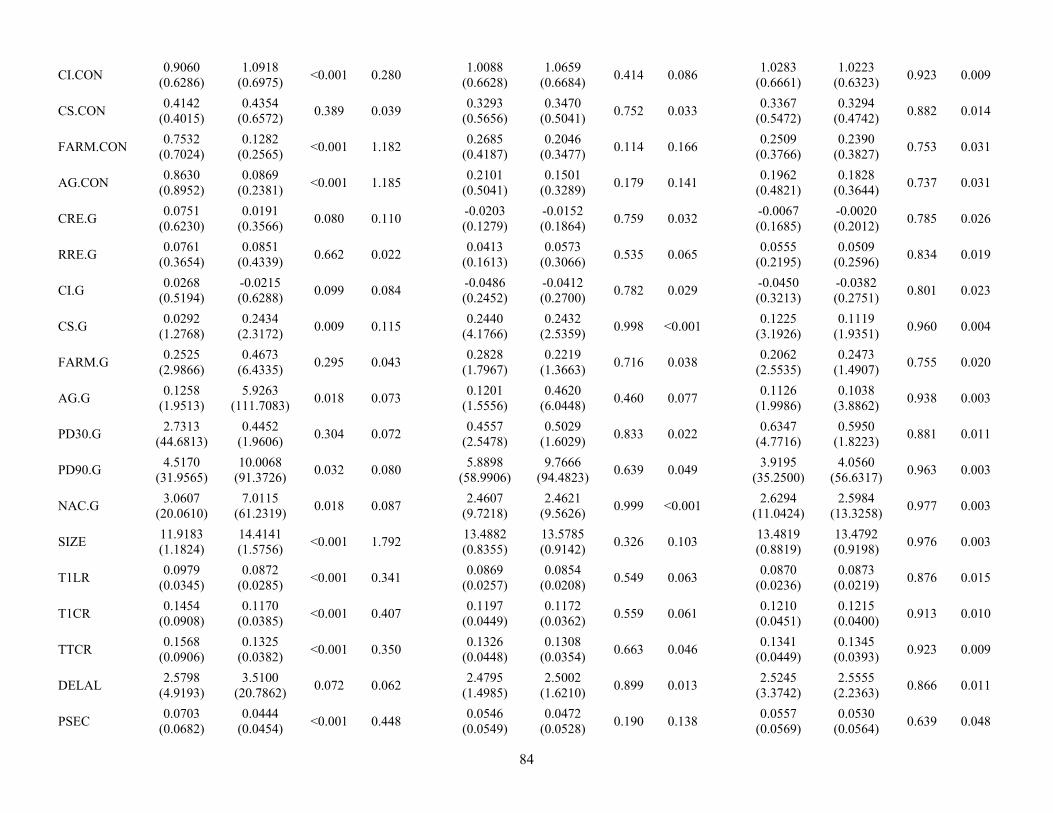
84
CI.CON 0.9060
(0.6286) 1.0918
(0.6975) <0.001 0.280
1.0088 (0.6628)
1.0659 (0.6684)
0.414 0.086 1.0283
(0.6661) 1.0223
(0.6323) 0.923 0.009
CS.CON 0.4142
(0.4015) 0.4354
(0.6572) 0.389 0.039
0.3293 (0.5656)
0.3470 (0.5041)
0.752 0.033 0.3367
(0.5472) 0.3294
(0.4742) 0.882 0.014
FARM.CON 0.7532
(0.7024) 0.1282
(0.2565) <0.001 1.182
0.2685 (0.4187)
0.2046 (0.3477)
0.114 0.166 0.2509
(0.3766) 0.2390
(0.3827) 0.753 0.031
AG.CON 0.8630
(0.8952) 0.0869
(0.2381) <0.001 1.185
0.2101 (0.5041)
0.1501 (0.3289)
0.179 0.141 0.1962
(0.4821) 0.1828
(0.3644) 0.737 0.031
CRE.G 0.0751
(0.6230) 0.0191
(0.3566) 0.080 0.110
-0.0203 (0.1279)
-0.0152 (0.1864)
0.759 0.032 -0.0067 (0.1685)
-0.0020 (0.2012)
0.785 0.026
RRE.G 0.0761
(0.3654) 0.0851
(0.4339) 0.662 0.022
0.0413 (0.1613)
0.0573 (0.3066)
0.535 0.065 0.0555
(0.2195) 0.0509
(0.2596) 0.834 0.019
CI.G 0.0268
(0.5194) -0.0215 (0.6288)
0.099 0.084 -0.0486 (0.2452)
-0.0412 (0.2700)
0.782 0.029 -0.0450 (0.3213)
-0.0382 (0.2751)
0.801 0.023
CS.G 0.0292
(1.2768) 0.2434
(2.3172) 0.009 0.115
0.2440 (4.1766)
0.2432 (2.5359)
0.998 <0.001 0.1225
(3.1926) 0.1119
(1.9351) 0.960 0.004
FARM.G 0.2525
(2.9866) 0.4673
(6.4335) 0.295 0.043
0.2828 (1.7967)
0.2219 (1.3663)
0.716 0.038 0.2062
(2.5535) 0.2473
(1.4907) 0.755 0.020
AG.G 0.1258
(1.9513) 5.9263
(111.7083) 0.018 0.073
0.1201 (1.5556)
0.4620 (6.0448)
0.460 0.077 0.1126
(1.9986) 0.1038
(3.8862) 0.938 0.003
PD30.G 2.7313
(44.6813) 0.4452
(1.9606) 0.304 0.072
0.4557 (2.5478)
0.5029 (1.6029)
0.833 0.022 0.6347
(4.7716) 0.5950
(1.8223) 0.881 0.011
PD90.G 4.5170
(31.9565) 10.0068
(91.3726) 0.032 0.080
5.8898 (58.9906)
9.7666 (94.4823)
0.639 0.049 3.9195
(35.2500) 4.0560
(56.6317) 0.963 0.003
NAC.G 3.0607
(20.0610) 7.0115
(61.2319) 0.018 0.087
2.4607 (9.7218)
2.4621 (9.5626)
0.999 <0.001 2.6294
(11.0424) 2.5984
(13.3258) 0.977 0.003
SIZE 11.9183 (1.1824)
14.4141 (1.5756)
<0.001 1.792 13.4882 (0.8355)
13.5785 (0.9142)
0.326 0.103 13.4819 (0.8819)
13.4792 (0.9198)
0.976 0.003
T1LR 0.0979
(0.0345) 0.0872
(0.0285) <0.001 0.341
0.0869 (0.0257)
0.0854 (0.0208)
0.549 0.063 0.0870
(0.0236) 0.0873
(0.0219) 0.876 0.015
T1CR 0.1454
(0.0908) 0.1170
(0.0385) <0.001 0.407
0.1197 (0.0449)
0.1172 (0.0362)
0.559 0.061 0.1210
(0.0451) 0.1215
(0.0400) 0.913 0.010
TTCR 0.1568
(0.0906) 0.1325
(0.0382) <0.001 0.350
0.1326 (0.0448)
0.1308 (0.0354)
0.663 0.046 0.1341
(0.0449) 0.1345
(0.0393) 0.923 0.009
DELAL 2.5798
(4.9193) 3.5100
(20.7862) 0.072 0.062
2.4795 (1.4985)
2.5002 (1.6210)
0.899 0.013 2.5245
(3.3742) 2.5555
(2.2363) 0.866 0.011
PSEC 0.0703
(0.0682) 0.0444
(0.0454) <0.001 0.448
0.0546 (0.0549)
0.0472 (0.0528)
0.190 0.138 0.0557
(0.0569) 0.0530
(0.0564) 0.639 0.048
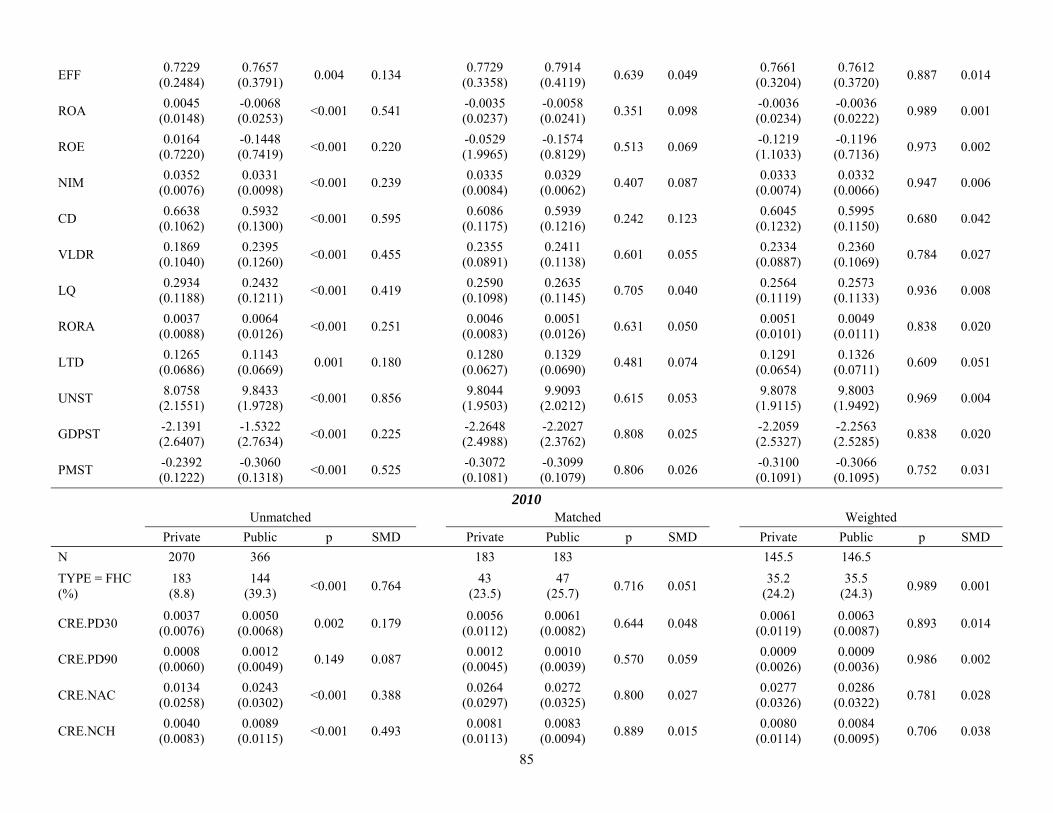
85
EFF 0.7229
(0.2484) 0.7657
(0.3791) 0.004 0.134
0.7729 (0.3358)
0.7914 (0.4119)
0.639 0.049 0.7661
(0.3204) 0.7612
(0.3720) 0.887 0.014
ROA 0.0045
(0.0148) -0.0068 (0.0253)
<0.001 0.541 -0.0035 (0.0237)
-0.0058 (0.0241)
0.351 0.098 -0.0036 (0.0234)
-0.0036 (0.0222)
0.989 0.001
ROE 0.0164
(0.7220) -0.1448 (0.7419)
<0.001 0.220 -0.0529 (1.9965)
-0.1574 (0.8129)
0.513 0.069 -0.1219 (1.1033)
-0.1196 (0.7136)
0.973 0.002
NIM 0.0352
(0.0076) 0.0331
(0.0098) <0.001 0.239
0.0335 (0.0084)
0.0329 (0.0062)
0.407 0.087 0.0333
(0.0074) 0.0332
(0.0066) 0.947 0.006
CD 0.6638
(0.1062) 0.5932
(0.1300) <0.001 0.595
0.6086 (0.1175)
0.5939 (0.1216)
0.242 0.123 0.6045
(0.1232) 0.5995
(0.1150) 0.680 0.042
VLDR 0.1869
(0.1040) 0.2395
(0.1260) <0.001 0.455
0.2355 (0.0891)
0.2411 (0.1138)
0.601 0.055 0.2334
(0.0887) 0.2360
(0.1069) 0.784 0.027
LQ 0.2934
(0.1188) 0.2432
(0.1211) <0.001 0.419
0.2590 (0.1098)
0.2635 (0.1145)
0.705 0.040 0.2564
(0.1119) 0.2573
(0.1133) 0.936 0.008
RORA 0.0037
(0.0088) 0.0064
(0.0126) <0.001 0.251
0.0046 (0.0083)
0.0051 (0.0126)
0.631 0.050 0.0051
(0.0101) 0.0049
(0.0111) 0.838 0.020
LTD 0.1265
(0.0686) 0.1143
(0.0669) 0.001 0.180
0.1280 (0.0627)
0.1329 (0.0690)
0.481 0.074 0.1291
(0.0654) 0.1326
(0.0711) 0.609 0.051
UNST 8.0758
(2.1551) 9.8433
(1.9728) <0.001 0.856
9.8044 (1.9503)
9.9093 (2.0212)
0.615 0.053 9.8078
(1.9115) 9.8003
(1.9492) 0.969 0.004
GDPST -2.1391 (2.6407)
-1.5322 (2.7634)
<0.001 0.225 -2.2648 (2.4988)
-2.2027 (2.3762)
0.808 0.025 -2.2059 (2.5327)
-2.2563 (2.5285)
0.838 0.020
PMST -0.2392 (0.1222)
-0.3060 (0.1318)
<0.001 0.525 -0.3072 (0.1081)
-0.3099 (0.1079)
0.806 0.026 -0.3100 (0.1091)
-0.3066 (0.1095)
0.752 0.031
2010 Unmatched Matched Weighted
Private Public p SMD Private Public p SMD Private Public p SMD
N 2070 366 183 183 145.5 146.5
TYPE = FHC (%)
183 (8.8)
144 (39.3)
<0.001 0.764 43
(23.5) 47
(25.7) 0.716 0.051
35.2 (24.2)
35.5 (24.3)
0.989 0.001
CRE.PD30 0.0037
(0.0076) 0.0050
(0.0068) 0.002 0.179
0.0056 (0.0112)
0.0061 (0.0082)
0.644 0.048 0.0061
(0.0119) 0.0063
(0.0087) 0.893 0.014
CRE.PD90 0.0008
(0.0060) 0.0012
(0.0049) 0.149 0.087
0.0012 (0.0045)
0.0010 (0.0039)
0.570 0.059 0.0009
(0.0026) 0.0009
(0.0036) 0.986 0.002
CRE.NAC 0.0134
(0.0258) 0.0243
(0.0302) <0.001 0.388
0.0264 (0.0297)
0.0272 (0.0325)
0.800 0.027 0.0277
(0.0326) 0.0286
(0.0322) 0.781 0.028
CRE.NCH 0.0040
(0.0083) 0.0089
(0.0115) <0.001 0.493
0.0081 (0.0113)
0.0083 (0.0094)
0.889 0.015 0.0080
(0.0114) 0.0084
(0.0095) 0.706 0.038

86
RRE.PD30 0.0043
(0.0057) 0.0041
(0.0045) 0.381 0.054
0.0037 (0.0040)
0.0040 (0.0047)
0.444 0.080 0.0038
(0.0047) 0.0039
(0.0044) 0.768 0.028
RRE.PD90 0.0006
(0.0019) 0.0012
(0.0040) <0.001 0.197
0.0006 (0.0014)
0.0005 (0.0013)
0.633 0.050 0.0005
(0.0012) 0.0005
(0.0015) 0.852 0.019
RRE.NAC 0.0040
(0.0067) 0.0070
(0.0090) <0.001 0.379
0.0067 (0.0094)
0.0066 (0.0081)
0.925 0.010 0.0067
(0.0088) 0.0068
(0.0089) 0.879 0.015
RRE.NCH 0.0012
(0.0024) 0.0027
(0.0035) <0.001 0.520
0.0023 (0.0033)
0.0022 (0.0028)
0.781 0.029 0.0022
(0.0031) 0.0022
(0.0029) 0.841 0.020
CI.PD30 0.0017
(0.0038) 0.0013
(0.0024) 0.056 0.124
0.0016 (0.0025)
0.0015 (0.0026)
0.797 0.027 0.0016
(0.0027) 0.0016
(0.0029) 0.990 0.001
CI.PD90 0.0004
(0.0017) 0.0003
(0.0008) 0.225 0.083
0.0002 (0.0010)
0.0003 (0.0009)
0.631 0.050 0.0003
(0.0010) 0.0003
(0.0007) 0.905 0.010
CI.NAC 0.0030
(0.0062) 0.0031
(0.0038) 0.780 0.018
0.0027 (0.0038)
0.0029 (0.0039)
0.546 0.063 0.0026
(0.0040) 0.0028
(0.0038) 0.547 0.058
CI.NCH 0.0020
(0.0043) 0.0026
(0.0034) 0.009 0.160
0.0022 (0.0039)
0.0024 (0.0037)
0.519 0.068 0.0022
(0.0039) 0.0023
(0.0035) 0.824 0.022
CS.PD30 0.0015
(0.0029) 0.0013
(0.0038) 0.500 0.034
0.0008 (0.0018)
0.0007 (0.0019)
0.518 0.068 0.0008
(0.0018) 0.0007
(0.0023) 0.862 0.017
CS.PD90 0.0002
(0.0013) 0.0007
(0.0035) <0.001 0.169
0.0001 (0.0002)
0.0001 (0.0002)
0.575 0.059 0.0001
(0.0005) 0.0001
(0.0008) 0.823 0.011
CS.NAC 0.0004
(0.0013) 0.0003
(0.0010) 0.572 0.035
0.0002 (0.0008)
0.0003 (0.0009)
0.525 0.067 0.0003
(0.0009) 0.0003
(0.0008) 0.815 0.025
CS.NCH 0.0007
(0.0044) 0.0025
(0.0117) <0.001 0.202
0.0006 (0.0017)
0.0005 (0.0012)
0.671 0.044 0.0007
(0.0022) 0.0006
(0.0021) 0.775 0.025
FARM.PD30 0.0008
(0.0025) 0.0001
(0.0007) <0.001 0.347
0.0003 (0.0010)
0.0002 (0.0006)
0.242 0.122 0.0003
(0.0011) 0.0003
(0.0009) 0.818 0.022
FARM.PD90 0.0002
(0.0013) 0.0000
(0.0002) 0.018 0.173
0.0000 (0.0002)
0.0000 (0.0002)
0.699 0.040 0.0000
(0.0004) 0.0000
(0.0002) 0.670 0.027
FARM.NAC 0.0012
(0.0044) 0.0004
(0.0015) <0.001 0.253
0.0006 (0.0017)
0.0006 (0.0021)
0.966 0.004 0.0007
(0.0026) 0.0007
(0.0023) 0.870 0.014
FARM.NCH 0.0001
(0.0008) 0.0001
(0.0004) 0.701 0.026
0.0001 (0.0003)
0.0001 (0.0005)
0.613 0.053 0.0001
(0.0009) 0.0001
(0.0006) 0.750 0.024
AG.PD30 0.0004
(0.0018) 0.0000
(0.0002) <0.001 0.319
0.0000 (0.0002)
0.0000 (0.0003)
0.830 0.022 0.0000
(0.0002) 0.0000
(0.0003) 0.767 0.032
AG.PD90 0.0001
(0.0009) 0.0000
(0.0002) 0.043 0.148
0.0000 (0.0000)
0.0000 (0.0001)
0.511 0.069 0.0000
(0.0003) 0.0000
(0.0001) 0.926 0.004
AG.NAC 0.0006
(0.0027) 0.0001
(0.0006) 0.002 0.228
0.0002 (0.0009)
0.0001 (0.0008)
0.929 0.009 0.0001
(0.0012) 0.0002
(0.0008) 0.560 0.040
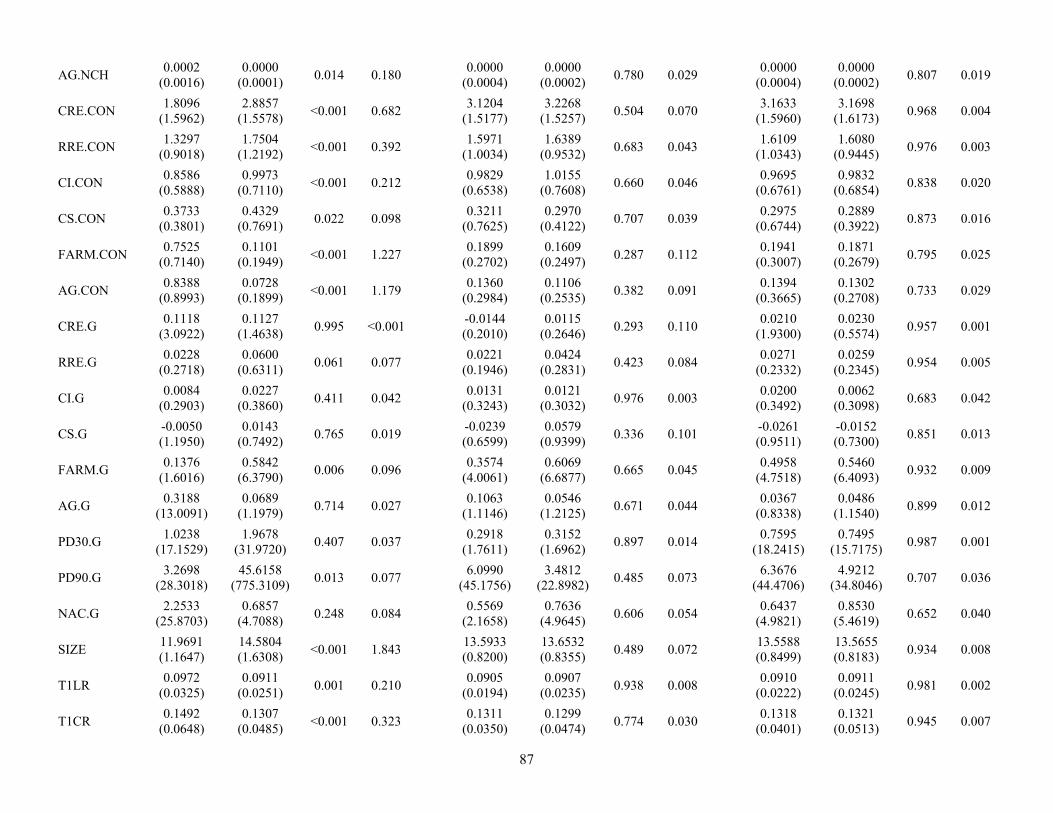
87
AG.NCH 0.0002
(0.0016) 0.0000
(0.0001) 0.014 0.180
0.0000 (0.0004)
0.0000 (0.0002)
0.780 0.029 0.0000
(0.0004) 0.0000
(0.0002) 0.807 0.019
CRE.CON 1.8096
(1.5962) 2.8857
(1.5578) <0.001 0.682
3.1204 (1.5177)
3.2268 (1.5257)
0.504 0.070 3.1633
(1.5960) 3.1698
(1.6173) 0.968 0.004
RRE.CON 1.3297
(0.9018) 1.7504
(1.2192) <0.001 0.392
1.5971 (1.0034)
1.6389 (0.9532)
0.683 0.043 1.6109
(1.0343) 1.6080
(0.9445) 0.976 0.003
CI.CON 0.8586
(0.5888) 0.9973
(0.7110) <0.001 0.212
0.9829 (0.6538)
1.0155 (0.7608)
0.660 0.046 0.9695
(0.6761) 0.9832
(0.6854) 0.838 0.020
CS.CON 0.3733
(0.3801) 0.4329
(0.7691) 0.022 0.098
0.3211 (0.7625)
0.2970 (0.4122)
0.707 0.039 0.2975
(0.6744) 0.2889
(0.3922) 0.873 0.016
FARM.CON 0.7525
(0.7140) 0.1101
(0.1949) <0.001 1.227
0.1899 (0.2702)
0.1609 (0.2497)
0.287 0.112 0.1941
(0.3007) 0.1871
(0.2679) 0.795 0.025
AG.CON 0.8388
(0.8993) 0.0728
(0.1899) <0.001 1.179
0.1360 (0.2984)
0.1106 (0.2535)
0.382 0.091 0.1394
(0.3665) 0.1302
(0.2708) 0.733 0.029
CRE.G 0.1118
(3.0922) 0.1127
(1.4638) 0.995 <0.001
-0.0144 (0.2010)
0.0115 (0.2646)
0.293 0.110 0.0210
(1.9300) 0.0230
(0.5574) 0.957 0.001
RRE.G 0.0228
(0.2718) 0.0600
(0.6311) 0.061 0.077
0.0221 (0.1946)
0.0424 (0.2831)
0.423 0.084 0.0271
(0.2332) 0.0259
(0.2345) 0.954 0.005
CI.G 0.0084
(0.2903) 0.0227
(0.3860) 0.411 0.042
0.0131 (0.3243)
0.0121 (0.3032)
0.976 0.003 0.0200
(0.3492) 0.0062
(0.3098) 0.683 0.042
CS.G -0.0050 (1.1950)
0.0143 (0.7492)
0.765 0.019 -0.0239 (0.6599)
0.0579 (0.9399)
0.336 0.101 -0.0261 (0.9511)
-0.0152 (0.7300)
0.851 0.013
FARM.G 0.1376
(1.6016) 0.5842
(6.3790) 0.006 0.096
0.3574 (4.0061)
0.6069 (6.6877)
0.665 0.045 0.4958
(4.7518) 0.5460
(6.4093) 0.932 0.009
AG.G 0.3188
(13.0091) 0.0689
(1.1979) 0.714 0.027
0.1063 (1.1146)
0.0546 (1.2125)
0.671 0.044 0.0367
(0.8338) 0.0486
(1.1540) 0.899 0.012
PD30.G 1.0238
(17.1529) 1.9678
(31.9720) 0.407 0.037
0.2918 (1.7611)
0.3152 (1.6962)
0.897 0.014 0.7595
(18.2415) 0.7495
(15.7175) 0.987 0.001
PD90.G 3.2698
(28.3018) 45.6158
(775.3109) 0.013 0.077
6.0990 (45.1756)
3.4812 (22.8982)
0.485 0.073 6.3676
(44.4706) 4.9212
(34.8046) 0.707 0.036
NAC.G 2.2533
(25.8703) 0.6857
(4.7088) 0.248 0.084
0.5569 (2.1658)
0.7636 (4.9645)
0.606 0.054 0.6437
(4.9821) 0.8530
(5.4619) 0.652 0.040
SIZE 11.9691 (1.1647)
14.5804 (1.6308)
<0.001 1.843 13.5933 (0.8200)
13.6532 (0.8355)
0.489 0.072 13.5588 (0.8499)
13.5655 (0.8183)
0.934 0.008
T1LR 0.0972
(0.0325) 0.0911
(0.0251) 0.001 0.210
0.0905 (0.0194)
0.0907 (0.0235)
0.938 0.008 0.0910
(0.0222) 0.0911
(0.0245) 0.981 0.002
T1CR 0.1492
(0.0648) 0.1307
(0.0485) <0.001 0.323
0.1311 (0.0350)
0.1299 (0.0474)
0.774 0.030 0.1318
(0.0401) 0.1321
(0.0513) 0.945 0.007
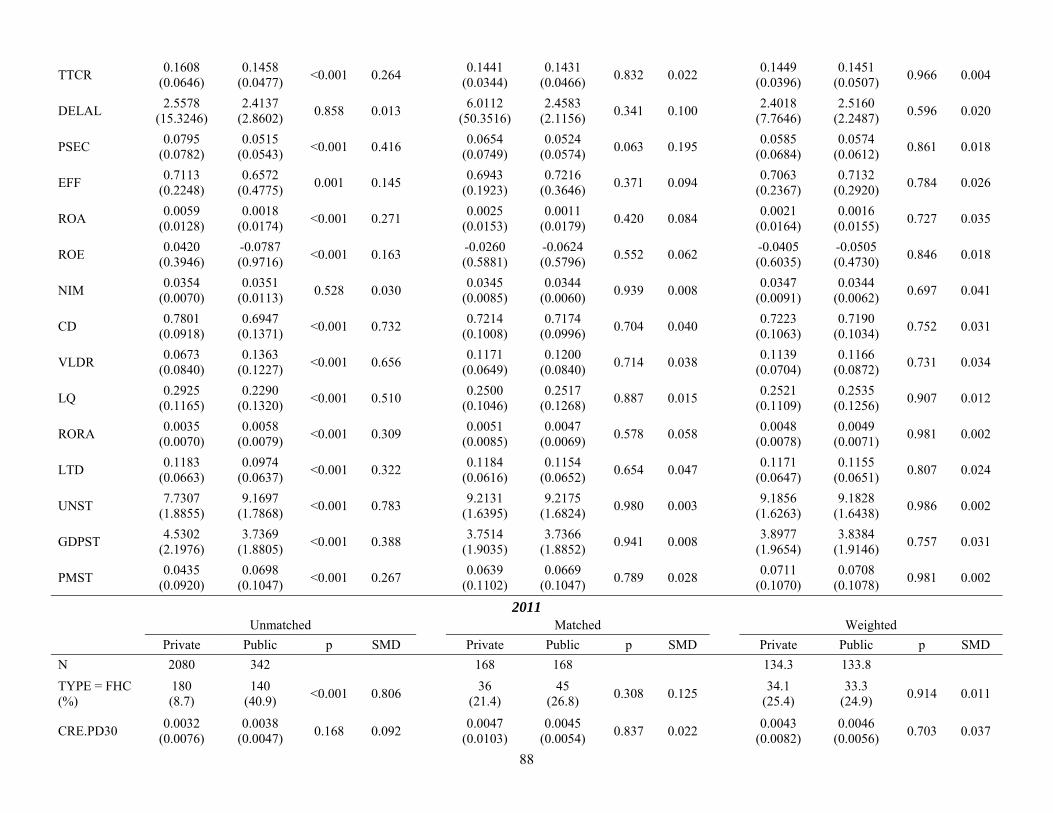
88
TTCR 0.1608
(0.0646) 0.1458
(0.0477) <0.001 0.264
0.1441 (0.0344)
0.1431 (0.0466)
0.832 0.022 0.1449
(0.0396) 0.1451
(0.0507) 0.966 0.004
DELAL 2.5578
(15.3246) 2.4137
(2.8602) 0.858 0.013
6.0112 (50.3516)
2.4583 (2.1156)
0.341 0.100 2.4018
(7.7646) 2.5160
(2.2487) 0.596 0.020
PSEC 0.0795
(0.0782) 0.0515
(0.0543) <0.001 0.416
0.0654 (0.0749)
0.0524 (0.0574)
0.063 0.195 0.0585
(0.0684) 0.0574
(0.0612) 0.861 0.018
EFF 0.7113
(0.2248) 0.6572
(0.4775) 0.001 0.145
0.6943 (0.1923)
0.7216 (0.3646)
0.371 0.094 0.7063
(0.2367) 0.7132
(0.2920) 0.784 0.026
ROA 0.0059
(0.0128) 0.0018
(0.0174) <0.001 0.271
0.0025 (0.0153)
0.0011 (0.0179)
0.420 0.084 0.0021
(0.0164) 0.0016
(0.0155) 0.727 0.035
ROE 0.0420
(0.3946) -0.0787 (0.9716)
<0.001 0.163 -0.0260 (0.5881)
-0.0624 (0.5796)
0.552 0.062 -0.0405 (0.6035)
-0.0505 (0.4730)
0.846 0.018
NIM 0.0354
(0.0070) 0.0351
(0.0113) 0.528 0.030
0.0345 (0.0085)
0.0344 (0.0060)
0.939 0.008 0.0347
(0.0091) 0.0344
(0.0062) 0.697 0.041
CD 0.7801
(0.0918) 0.6947
(0.1371) <0.001 0.732
0.7214 (0.1008)
0.7174 (0.0996)
0.704 0.040 0.7223
(0.1063) 0.7190
(0.1034) 0.752 0.031
VLDR 0.0673
(0.0840) 0.1363
(0.1227) <0.001 0.656
0.1171 (0.0649)
0.1200 (0.0840)
0.714 0.038 0.1139
(0.0704) 0.1166
(0.0872) 0.731 0.034
LQ 0.2925
(0.1165) 0.2290
(0.1320) <0.001 0.510
0.2500 (0.1046)
0.2517 (0.1268)
0.887 0.015 0.2521
(0.1109) 0.2535
(0.1256) 0.907 0.012
RORA 0.0035
(0.0070) 0.0058
(0.0079) <0.001 0.309
0.0051 (0.0085)
0.0047 (0.0069)
0.578 0.058 0.0048
(0.0078) 0.0049
(0.0071) 0.981 0.002
LTD 0.1183
(0.0663) 0.0974
(0.0637) <0.001 0.322
0.1184 (0.0616)
0.1154 (0.0652)
0.654 0.047 0.1171
(0.0647) 0.1155
(0.0651) 0.807 0.024
UNST 7.7307
(1.8855) 9.1697
(1.7868) <0.001 0.783
9.2131 (1.6395)
9.2175 (1.6824)
0.980 0.003 9.1856
(1.6263) 9.1828
(1.6438) 0.986 0.002
GDPST 4.5302
(2.1976) 3.7369
(1.8805) <0.001 0.388
3.7514 (1.9035)
3.7366 (1.8852)
0.941 0.008 3.8977
(1.9654) 3.8384
(1.9146) 0.757 0.031
PMST 0.0435
(0.0920) 0.0698
(0.1047) <0.001 0.267
0.0639 (0.1102)
0.0669 (0.1047)
0.789 0.028 0.0711
(0.1070) 0.0708
(0.1078) 0.981 0.002
2011 Unmatched Matched Weighted
Private Public p SMD Private Public p SMD Private Public p SMD
N 2080 342 168 168 134.3 133.8
TYPE = FHC (%)
180 (8.7)
140 (40.9)
<0.001 0.806 36
(21.4) 45
(26.8) 0.308 0.125
34.1 (25.4)
33.3 (24.9)
0.914 0.011
CRE.PD30 0.0032
(0.0076) 0.0038
(0.0047) 0.168 0.092
0.0047 (0.0103)
0.0045 (0.0054)
0.837 0.022 0.0043
(0.0082) 0.0046
(0.0056) 0.703 0.037

89
CRE.PD90 0.0009
(0.0070) 0.0013
(0.0051) 0.231 0.077
0.0007 (0.0028)
0.0011 (0.0048)
0.359 0.100 0.0009
(0.0042) 0.0009
(0.0042) 0.944 0.006
CRE.NAC 0.0119
(0.0237) 0.0176
(0.0203) <0.001 0.259
0.0228 (0.0287)
0.0218 (0.0244)
0.728 0.038 0.0220
(0.0277) 0.0224
(0.0246) 0.886 0.014
CRE.NCH 0.0030
(0.0067) 0.0071
(0.0124) <0.001 0.413
0.0075 (0.0113)
0.0078 (0.0122)
0.810 0.026 0.0074
(0.0116) 0.0074
(0.0110) 0.996 0.001
RRE.PD30 0.0040
(0.0056) 0.0037
(0.0040) 0.311 0.066
0.0034 (0.0047)
0.0034 (0.0039)
0.991 0.001 0.0034
(0.0044) 0.0035
(0.0038) 0.768 0.028
RRE.PD90 0.0007
(0.0030) 0.0013
(0.0044) 0.003 0.151
0.0006 (0.0014)
0.0006 (0.0022)
0.732 0.037 0.0006
(0.0018) 0.0006
(0.0023) 0.873 0.016
RRE.NAC 0.0038
(0.0067) 0.0067
(0.0089) <0.001 0.364
0.0067 (0.0095)
0.0064 (0.0088)
0.770 0.032 0.0063
(0.0077) 0.0065
(0.0078) 0.863 0.017
RRE.NCH 0.0012
(0.0023) 0.0024
(0.0029) <0.001 0.458
0.0021 (0.0031)
0.0022 (0.0029)
0.695 0.043 0.0020
(0.0030) 0.0020
(0.0025) 0.969 0.004
CI.PD30 0.0015
(0.0035) 0.0011
(0.0021) 0.068 0.123
0.0011 (0.0026)
0.0011 (0.0016)
0.840 0.022 0.0012
(0.0031) 0.0012
(0.0019) 0.994 0.001
CI.PD90 0.0003
(0.0013) 0.0002
(0.0007) 0.107 0.113
0.0002 (0.0005)
0.0002 (0.0008)
0.504 0.073 0.0002
(0.0006) 0.0002
(0.0006) 0.869 0.014
CI.NAC 0.0027
(0.0073) 0.0025
(0.0033) 0.496 0.048
0.0025 (0.0042)
0.0025 (0.0041)
0.992 0.001 0.0024
(0.0041) 0.0024
(0.0036) 0.890 0.013
CI.NCH 0.0014
(0.0054) 0.0017
(0.0025) 0.388 0.061
0.0016 (0.0032)
0.0016 (0.0026)
0.843 0.022 0.0015
(0.0033) 0.0015
(0.0025) 0.987 0.002
CS.PD30 0.0014
(0.0027) 0.0012
(0.0034) 0.191 0.070
0.0007 (0.0018)
0.0006 (0.0015)
0.567 0.063 0.0006
(0.0014) 0.0006
(0.0013) 0.998 <0.001
CS.PD90 0.0002
(0.0010) 0.0007
(0.0045) <0.001 0.153
0.0001 (0.0004)
0.0001 (0.0011)
0.703 0.042 0.0001
(0.0004) 0.0001
(0.0007) 0.983 0.002
CS.NAC 0.0003
(0.0009) 0.0002
(0.0005) 0.037 0.141
0.0002 (0.0005)
0.0002 (0.0006)
0.989 0.001 0.0002
(0.0005) 0.0002
(0.0005) 0.794 0.024
CS.NCH 0.0005
(0.0030) 0.0014
(0.0062) <0.001 0.190
0.0005 (0.0010)
0.0005 (0.0025)
0.859 0.019 0.0004
(0.0009) 0.0004
(0.0017) 0.898 0.010
FARM.PD30 0.0007
(0.0024) 0.0001
(0.0005) <0.001 0.327
0.0001 (0.0004)
0.0002 (0.0006)
0.886 0.016 0.0002
(0.0007) 0.0002
(0.0007) 0.843 0.019
FARM.PD90 0.0002
(0.0017) 0.0000
(0.0002) 0.043 0.154
0.0000 (0.0002)
0.0000 (0.0002)
0.604 0.057 0.0000
(0.0003) 0.0000
(0.0002) 0.981 0.002
FARM.NAC 0.0011
(0.0041) 0.0005
(0.0020) 0.005 0.197
0.0007 (0.0022)
0.0007 (0.0028)
0.953 0.006 0.0008
(0.0024) 0.0008
(0.0029) 0.799 0.026
FARM.NCH 0.0001
(0.0008) 0.0001
(0.0003) 0.389 0.062
0.0001 (0.0004)
0.0001 (0.0004)
0.888 0.015 0.0001
(0.0005) 0.0001
(0.0005) 0.976 0.003
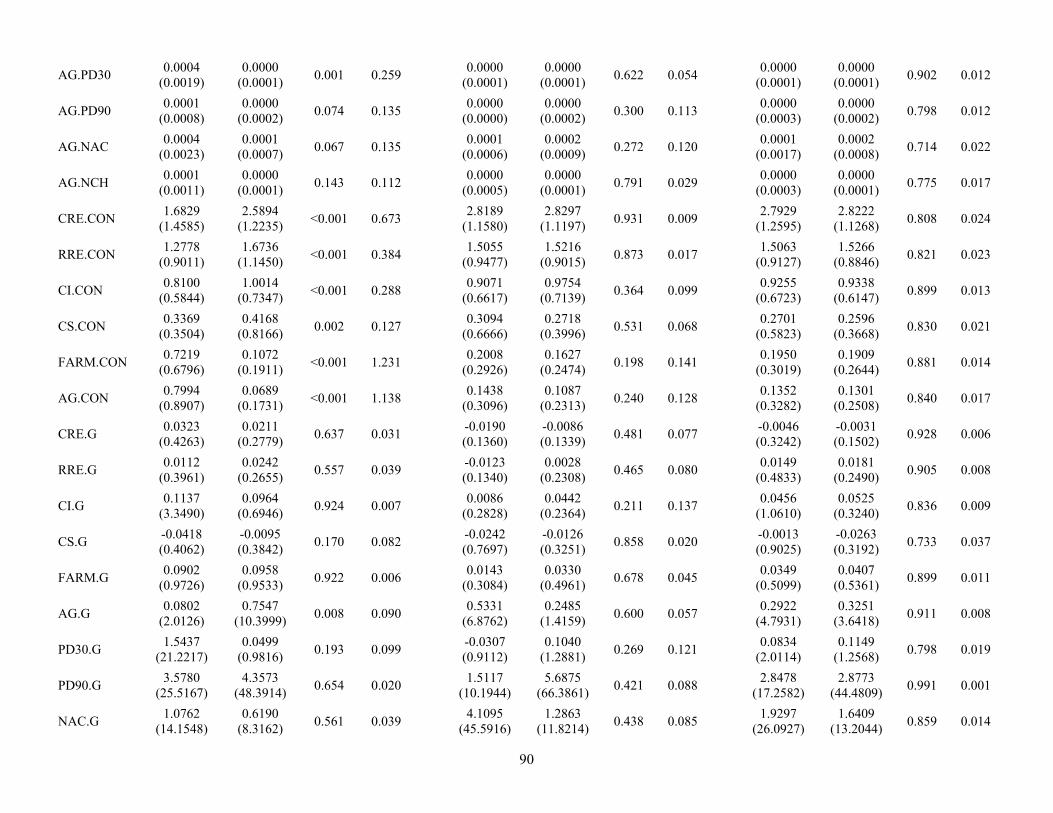
90
AG.PD30 0.0004
(0.0019) 0.0000
(0.0001) 0.001 0.259
0.0000 (0.0001)
0.0000 (0.0001)
0.622 0.054 0.0000
(0.0001) 0.0000
(0.0001) 0.902 0.012
AG.PD90 0.0001
(0.0008) 0.0000
(0.0002) 0.074 0.135
0.0000 (0.0000)
0.0000 (0.0002)
0.300 0.113 0.0000
(0.0003) 0.0000
(0.0002) 0.798 0.012
AG.NAC 0.0004
(0.0023) 0.0001
(0.0007) 0.067 0.135
0.0001 (0.0006)
0.0002 (0.0009)
0.272 0.120 0.0001
(0.0017) 0.0002
(0.0008) 0.714 0.022
AG.NCH 0.0001
(0.0011) 0.0000
(0.0001) 0.143 0.112
0.0000 (0.0005)
0.0000 (0.0001)
0.791 0.029 0.0000
(0.0003) 0.0000
(0.0001) 0.775 0.017
CRE.CON 1.6829
(1.4585) 2.5894
(1.2235) <0.001 0.673
2.8189 (1.1580)
2.8297 (1.1197)
0.931 0.009 2.7929
(1.2595) 2.8222
(1.1268) 0.808 0.024
RRE.CON 1.2778
(0.9011) 1.6736
(1.1450) <0.001 0.384
1.5055 (0.9477)
1.5216 (0.9015)
0.873 0.017 1.5063
(0.9127) 1.5266
(0.8846) 0.821 0.023
CI.CON 0.8100
(0.5844) 1.0014
(0.7347) <0.001 0.288
0.9071 (0.6617)
0.9754 (0.7139)
0.364 0.099 0.9255
(0.6723) 0.9338
(0.6147) 0.899 0.013
CS.CON 0.3369
(0.3504) 0.4168
(0.8166) 0.002 0.127
0.3094 (0.6666)
0.2718 (0.3996)
0.531 0.068 0.2701
(0.5823) 0.2596
(0.3668) 0.830 0.021
FARM.CON 0.7219
(0.6796) 0.1072
(0.1911) <0.001 1.231
0.2008 (0.2926)
0.1627 (0.2474)
0.198 0.141 0.1950
(0.3019) 0.1909
(0.2644) 0.881 0.014
AG.CON 0.7994
(0.8907) 0.0689
(0.1731) <0.001 1.138
0.1438 (0.3096)
0.1087 (0.2313)
0.240 0.128 0.1352
(0.3282) 0.1301
(0.2508) 0.840 0.017
CRE.G 0.0323
(0.4263) 0.0211
(0.2779) 0.637 0.031
-0.0190 (0.1360)
-0.0086 (0.1339)
0.481 0.077 -0.0046 (0.3242)
-0.0031 (0.1502)
0.928 0.006
RRE.G 0.0112
(0.3961) 0.0242
(0.2655) 0.557 0.039
-0.0123 (0.1340)
0.0028 (0.2308)
0.465 0.080 0.0149
(0.4833) 0.0181
(0.2490) 0.905 0.008
CI.G 0.1137
(3.3490) 0.0964
(0.6946) 0.924 0.007
0.0086 (0.2828)
0.0442 (0.2364)
0.211 0.137 0.0456
(1.0610) 0.0525
(0.3240) 0.836 0.009
CS.G -0.0418 (0.4062)
-0.0095 (0.3842)
0.170 0.082 -0.0242 (0.7697)
-0.0126 (0.3251)
0.858 0.020 -0.0013 (0.9025)
-0.0263 (0.3192)
0.733 0.037
FARM.G 0.0902
(0.9726) 0.0958
(0.9533) 0.922 0.006
0.0143 (0.3084)
0.0330 (0.4961)
0.678 0.045 0.0349
(0.5099) 0.0407
(0.5361) 0.899 0.011
AG.G 0.0802
(2.0126) 0.7547
(10.3999) 0.008 0.090
0.5331 (6.8762)
0.2485 (1.4159)
0.600 0.057 0.2922
(4.7931) 0.3251
(3.6418) 0.911 0.008
PD30.G 1.5437
(21.2217) 0.0499
(0.9816) 0.193 0.099
-0.0307 (0.9112)
0.1040 (1.2881)
0.269 0.121 0.0834
(2.0114) 0.1149
(1.2568) 0.798 0.019
PD90.G 3.5780
(25.5167) 4.3573
(48.3914) 0.654 0.020
1.5117 (10.1944)
5.6875 (66.3861)
0.421 0.088 2.8478
(17.2582) 2.8773
(44.4809) 0.991 0.001
NAC.G 1.0762
(14.1548) 0.6190
(8.3162) 0.561 0.039
4.1095 (45.5916)
1.2863 (11.8214)
0.438 0.085 1.9297
(26.0927) 1.6409
(13.2044) 0.859 0.014
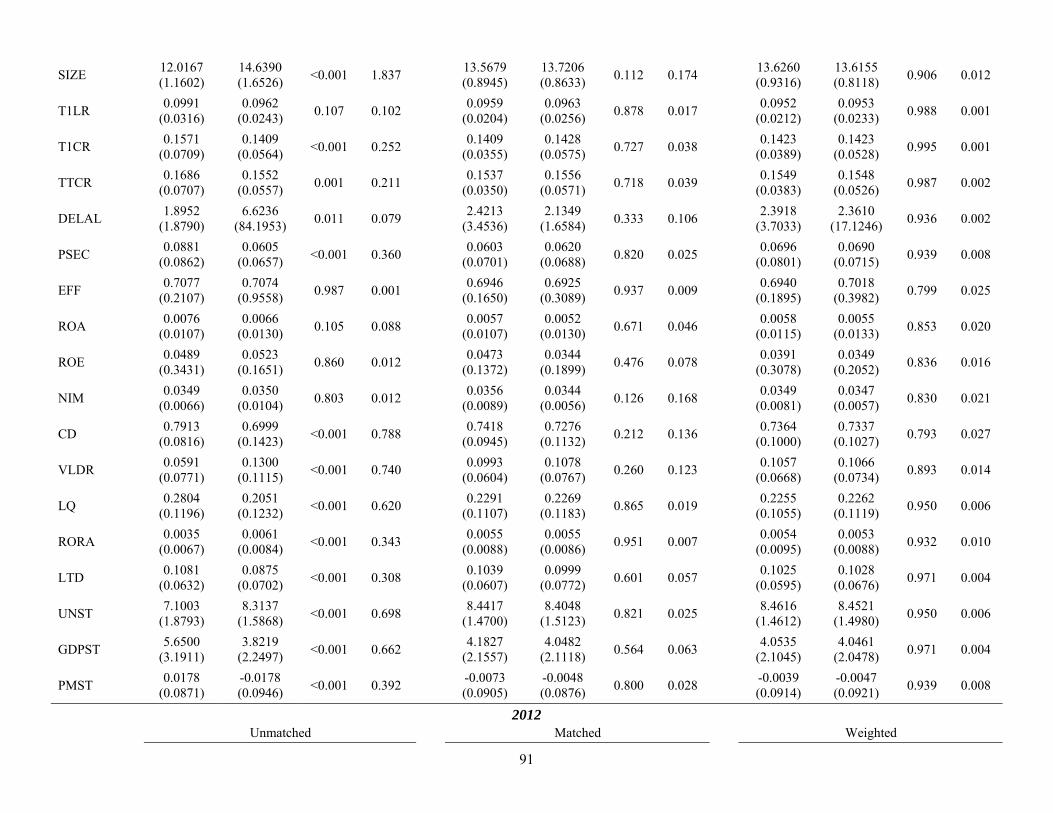
91
SIZE 12.0167 (1.1602)
14.6390 (1.6526)
<0.001 1.837 13.5679 (0.8945)
13.7206 (0.8633)
0.112 0.174 13.6260 (0.9316)
13.6155 (0.8118)
0.906 0.012
T1LR 0.0991
(0.0316) 0.0962
(0.0243) 0.107 0.102
0.0959 (0.0204)
0.0963 (0.0256)
0.878 0.017 0.0952
(0.0212) 0.0953
(0.0233) 0.988 0.001
T1CR 0.1571
(0.0709) 0.1409
(0.0564) <0.001 0.252
0.1409 (0.0355)
0.1428 (0.0575)
0.727 0.038 0.1423
(0.0389) 0.1423
(0.0528) 0.995 0.001
TTCR 0.1686
(0.0707) 0.1552
(0.0557) 0.001 0.211
0.1537 (0.0350)
0.1556 (0.0571)
0.718 0.039 0.1549
(0.0383) 0.1548
(0.0526) 0.987 0.002
DELAL 1.8952
(1.8790) 6.6236
(84.1953) 0.011 0.079
2.4213 (3.4536)
2.1349 (1.6584)
0.333 0.106 2.3918
(3.7033) 2.3610
(17.1246) 0.936 0.002
PSEC 0.0881
(0.0862) 0.0605
(0.0657) <0.001 0.360
0.0603 (0.0701)
0.0620 (0.0688)
0.820 0.025 0.0696
(0.0801) 0.0690
(0.0715) 0.939 0.008
EFF 0.7077
(0.2107) 0.7074
(0.9558) 0.987 0.001
0.6946 (0.1650)
0.6925 (0.3089)
0.937 0.009 0.6940
(0.1895) 0.7018
(0.3982) 0.799 0.025
ROA 0.0076
(0.0107) 0.0066
(0.0130) 0.105 0.088
0.0057 (0.0107)
0.0052 (0.0130)
0.671 0.046 0.0058
(0.0115) 0.0055
(0.0133) 0.853 0.020
ROE 0.0489
(0.3431) 0.0523
(0.1651) 0.860 0.012
0.0473 (0.1372)
0.0344 (0.1899)
0.476 0.078 0.0391
(0.3078) 0.0349
(0.2052) 0.836 0.016
NIM 0.0349
(0.0066) 0.0350
(0.0104) 0.803 0.012
0.0356 (0.0089)
0.0344 (0.0056)
0.126 0.168 0.0349
(0.0081) 0.0347
(0.0057) 0.830 0.021
CD 0.7913
(0.0816) 0.6999
(0.1423) <0.001 0.788
0.7418 (0.0945)
0.7276 (0.1132)
0.212 0.136 0.7364
(0.1000) 0.7337
(0.1027) 0.793 0.027
VLDR 0.0591
(0.0771) 0.1300
(0.1115) <0.001 0.740
0.0993 (0.0604)
0.1078 (0.0767)
0.260 0.123 0.1057
(0.0668) 0.1066
(0.0734) 0.893 0.014
LQ 0.2804
(0.1196) 0.2051
(0.1232) <0.001 0.620
0.2291 (0.1107)
0.2269 (0.1183)
0.865 0.019 0.2255
(0.1055) 0.2262
(0.1119) 0.950 0.006
RORA 0.0035
(0.0067) 0.0061
(0.0084) <0.001 0.343
0.0055 (0.0088)
0.0055 (0.0086)
0.951 0.007 0.0054
(0.0095) 0.0053
(0.0088) 0.932 0.010
LTD 0.1081
(0.0632) 0.0875
(0.0702) <0.001 0.308
0.1039 (0.0607)
0.0999 (0.0772)
0.601 0.057 0.1025
(0.0595) 0.1028
(0.0676) 0.971 0.004
UNST 7.1003
(1.8793) 8.3137
(1.5868) <0.001 0.698
8.4417 (1.4700)
8.4048 (1.5123)
0.821 0.025 8.4616
(1.4612) 8.4521
(1.4980) 0.950 0.006
GDPST 5.6500
(3.1911) 3.8219
(2.2497) <0.001 0.662
4.1827 (2.1557)
4.0482 (2.1118)
0.564 0.063 4.0535
(2.1045) 4.0461
(2.0478) 0.971 0.004
PMST 0.0178
(0.0871) -0.0178 (0.0946)
<0.001 0.392 -0.0073 (0.0905)
-0.0048 (0.0876)
0.800 0.028 -0.0039 (0.0914)
-0.0047 (0.0921)
0.939 0.008
2012 Unmatched Matched Weighted

92
Private Public p SMD Private Public p SMD Private Public p SMD
N 2016 316 155 155 114.7 116.1
TYPE = FHC (%)
178 (8.8)
132 (41.8)
<0.001 0.819 36
(23.2) 42
(27.1) 0.513 0.089
27.4 (23.9)
27.1 (23.4)
0.919 0.011
CRE.PD30 0.0027
(0.0060) 0.0035
(0.0057) 0.037 0.128
0.0033 (0.0078)
0.0044 (0.0072)
0.201 0.146 0.0041
(0.0090) 0.0042
(0.0065) 0.934 0.009
CRE.PD90 0.0006
(0.0041) 0.0016
(0.0067) <0.001 0.181
0.0012 (0.0048)
0.0016 (0.0081)
0.594 0.061 0.0013
(0.0058) 0.0013
(0.0064) 0.929 0.009
CRE.NAC 0.0091
(0.0188) 0.0116
(0.0138) 0.021 0.154
0.0143 (0.0215)
0.0139 (0.0151)
0.842 0.023 0.0156
(0.0242) 0.0153
(0.0169) 0.878 0.017
CRE.NCH 0.0019
(0.0051) 0.0037
(0.0068) <0.001 0.302
0.0036 (0.0067)
0.0039 (0.0058)
0.685 0.046 0.0041
(0.0077) 0.0038
(0.0060) 0.755 0.034
RRE.PD30 0.0041
(0.0054) 0.0038
(0.0047) 0.394 0.054
0.0034 (0.0041)
0.0035 (0.0043)
0.840 0.023 0.0036
(0.0045) 0.0035
(0.0043) 0.741 0.036
RRE.PD90 0.0007
(0.0023) 0.0014
(0.0046) <0.001 0.200
0.0006 (0.0017)
0.0008 (0.0027)
0.451 0.086 0.0007
(0.0024) 0.0006
(0.0026) 0.844 0.022
RRE.NAC 0.0033
(0.0059) 0.0062
(0.0102) <0.001 0.345
0.0047 (0.0070)
0.0052 (0.0057)
0.494 0.078 0.0054
(0.0076) 0.0054
(0.0059) 0.963 0.005
RRE.NCH 0.0009
(0.0020) 0.0020
(0.0030) <0.001 0.452
0.0015 (0.0021)
0.0016 (0.0021)
0.548 0.068 0.0017
(0.0024) 0.0016
(0.0022) 0.845 0.021
CI.PD30 0.0016
(0.0042) 0.0010
(0.0021) 0.007 0.196
0.0015 (0.0042)
0.0011 (0.0022)
0.400 0.096 0.0012
(0.0030) 0.0011
(0.0022) 0.794 0.027
CI.PD90 0.0003
(0.0016) 0.0003
(0.0007) 0.502 0.049
0.0002 (0.0006)
0.0003 (0.0008)
0.107 0.183 0.0003
(0.0012) 0.0003
(0.0008) 0.740 0.031
CI.NAC 0.0024
(0.0063) 0.0020
(0.0025) 0.225 0.091
0.0018 (0.0029)
0.0022 (0.0028)
0.228 0.137 0.0021
(0.0040) 0.0022
(0.0030) 0.806 0.025
CI.NCH 0.0010
(0.0041) 0.0010
(0.0018) 0.838 0.015
0.0011 (0.0028)
0.0009 (0.0017)
0.374 0.101 0.0010
(0.0030) 0.0010
(0.0017) 0.879 0.014
CS.PD30 0.0013
(0.0026) 0.0008
(0.0022) 0.006 0.177
0.0006 (0.0018)
0.0005 (0.0014)
0.740 0.038 0.0006
(0.0023) 0.0006
(0.0016) 0.838 0.018
CS.PD90 0.0002
(0.0018) 0.0003
(0.0014) 0.603 0.034
0.0000 (0.0001)
0.0001 (0.0008)
0.143 0.167 0.0001
(0.0023) 0.0001
(0.0009) 0.859 0.011
CS.NAC 0.0003
(0.0008) 0.0001
(0.0003) 0.008 0.199
0.0002 (0.0007)
0.0001 (0.0003)
0.887 0.016 0.0002
(0.0006) 0.0001
(0.0003) 0.868 0.016
CS.NCH 0.0003
(0.0013) 0.0010
(0.0042) <0.001 0.219
0.0006 (0.0033)
0.0005 (0.0021)
0.750 0.036 0.0006
(0.0030) 0.0005
(0.0024) 0.835 0.024
FARM.PD30 0.0007
(0.0024) 0.0000
(0.0002) <0.001 0.368
0.0001 (0.0002)
0.0001 (0.0002)
0.400 0.096 0.0001
(0.0002) 0.0001
(0.0002) 0.962 0.005
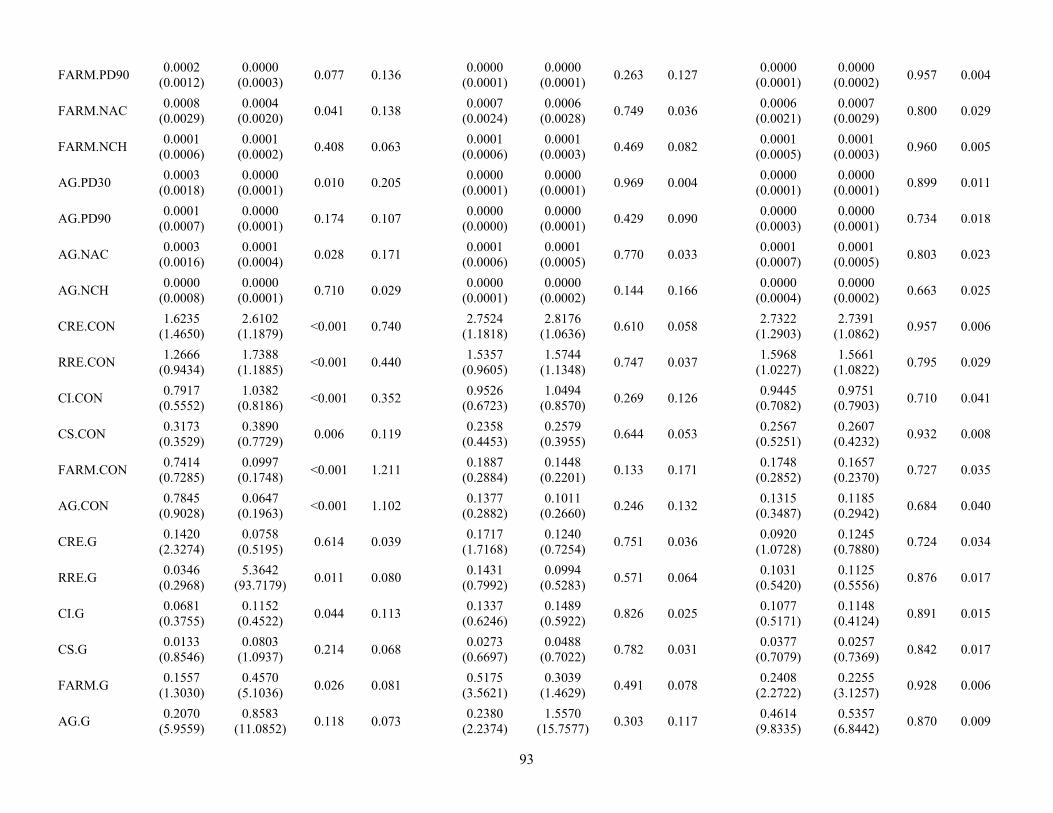
93
FARM.PD90 0.0002
(0.0012) 0.0000
(0.0003) 0.077 0.136
0.0000 (0.0001)
0.0000 (0.0001)
0.263 0.127 0.0000
(0.0001) 0.0000
(0.0002) 0.957 0.004
FARM.NAC 0.0008
(0.0029) 0.0004
(0.0020) 0.041 0.138
0.0007 (0.0024)
0.0006 (0.0028)
0.749 0.036 0.0006
(0.0021) 0.0007
(0.0029) 0.800 0.029
FARM.NCH 0.0001
(0.0006) 0.0001
(0.0002) 0.408 0.063
0.0001 (0.0006)
0.0001 (0.0003)
0.469 0.082 0.0001
(0.0005) 0.0001
(0.0003) 0.960 0.005
AG.PD30 0.0003
(0.0018) 0.0000
(0.0001) 0.010 0.205
0.0000 (0.0001)
0.0000 (0.0001)
0.969 0.004 0.0000
(0.0001) 0.0000
(0.0001) 0.899 0.011
AG.PD90 0.0001
(0.0007) 0.0000
(0.0001) 0.174 0.107
0.0000 (0.0000)
0.0000 (0.0001)
0.429 0.090 0.0000
(0.0003) 0.0000
(0.0001) 0.734 0.018
AG.NAC 0.0003
(0.0016) 0.0001
(0.0004) 0.028 0.171
0.0001 (0.0006)
0.0001 (0.0005)
0.770 0.033 0.0001
(0.0007) 0.0001
(0.0005) 0.803 0.023
AG.NCH 0.0000
(0.0008) 0.0000
(0.0001) 0.710 0.029
0.0000 (0.0001)
0.0000 (0.0002)
0.144 0.166 0.0000
(0.0004) 0.0000
(0.0002) 0.663 0.025
CRE.CON 1.6235
(1.4650) 2.6102
(1.1879) <0.001 0.740
2.7524 (1.1818)
2.8176 (1.0636)
0.610 0.058 2.7322
(1.2903) 2.7391
(1.0862) 0.957 0.006
RRE.CON 1.2666
(0.9434) 1.7388
(1.1885) <0.001 0.440
1.5357 (0.9605)
1.5744 (1.1348)
0.747 0.037 1.5968
(1.0227) 1.5661
(1.0822) 0.795 0.029
CI.CON 0.7917
(0.5552) 1.0382
(0.8186) <0.001 0.352
0.9526 (0.6723)
1.0494 (0.8570)
0.269 0.126 0.9445
(0.7082) 0.9751
(0.7903) 0.710 0.041
CS.CON 0.3173
(0.3529) 0.3890
(0.7729) 0.006 0.119
0.2358 (0.4453)
0.2579 (0.3955)
0.644 0.053 0.2567
(0.5251) 0.2607
(0.4232) 0.932 0.008
FARM.CON 0.7414
(0.7285) 0.0997
(0.1748) <0.001 1.211
0.1887 (0.2884)
0.1448 (0.2201)
0.133 0.171 0.1748
(0.2852) 0.1657
(0.2370) 0.727 0.035
AG.CON 0.7845
(0.9028) 0.0647
(0.1963) <0.001 1.102
0.1377 (0.2882)
0.1011 (0.2660)
0.246 0.132 0.1315
(0.3487) 0.1185
(0.2942) 0.684 0.040
CRE.G 0.1420
(2.3274) 0.0758
(0.5195) 0.614 0.039
0.1717 (1.7168)
0.1240 (0.7254)
0.751 0.036 0.0920
(1.0728) 0.1245
(0.7880) 0.724 0.034
RRE.G 0.0346
(0.2968) 5.3642
(93.7179) 0.011 0.080
0.1431 (0.7992)
0.0994 (0.5283)
0.571 0.064 0.1031
(0.5420) 0.1125
(0.5556) 0.876 0.017
CI.G 0.0681
(0.3755) 0.1152
(0.4522) 0.044 0.113
0.1337 (0.6246)
0.1489 (0.5922)
0.826 0.025 0.1077
(0.5171) 0.1148
(0.4124) 0.891 0.015
CS.G 0.0133
(0.8546) 0.0803
(1.0937) 0.214 0.068
0.0273 (0.6697)
0.0488 (0.7022)
0.782 0.031 0.0377
(0.7079) 0.0257
(0.7369) 0.842 0.017
FARM.G 0.1557
(1.3030) 0.4570
(5.1036) 0.026 0.081
0.5175 (3.5621)
0.3039 (1.4629)
0.491 0.078 0.2408
(2.2722) 0.2255
(3.1257) 0.928 0.006
AG.G 0.2070
(5.9559) 0.8583
(11.0852) 0.118 0.073
0.2380 (2.2374)
1.5570 (15.7577)
0.303 0.117 0.4614
(9.8335) 0.5357
(6.8442) 0.870 0.009
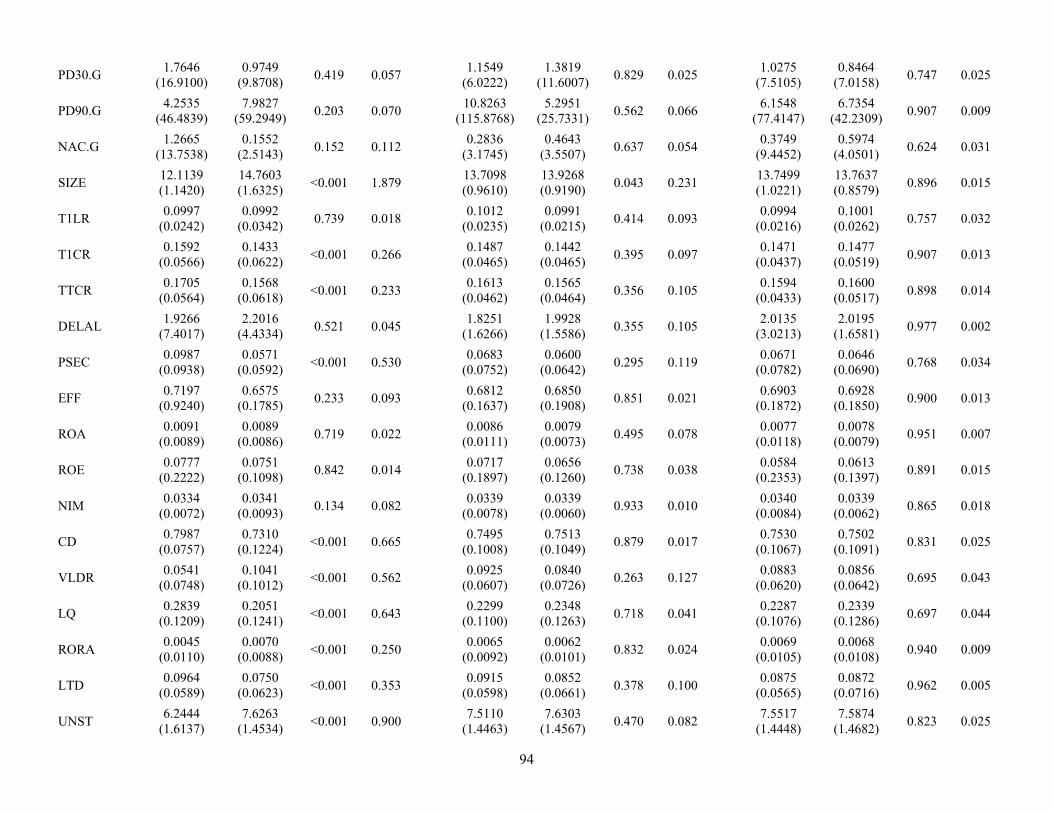
94
PD30.G 1.7646
(16.9100) 0.9749
(9.8708) 0.419 0.057
1.1549 (6.0222)
1.3819 (11.6007)
0.829 0.025 1.0275
(7.5105) 0.8464
(7.0158) 0.747 0.025
PD90.G 4.2535
(46.4839) 7.9827
(59.2949) 0.203 0.070
10.8263 (115.8768)
5.2951 (25.7331)
0.562 0.066 6.1548
(77.4147) 6.7354
(42.2309) 0.907 0.009
NAC.G 1.2665
(13.7538) 0.1552
(2.5143) 0.152 0.112
0.2836 (3.1745)
0.4643 (3.5507)
0.637 0.054 0.3749
(9.4452) 0.5974
(4.0501) 0.624 0.031
SIZE 12.1139 (1.1420)
14.7603 (1.6325)
<0.001 1.879 13.7098 (0.9610)
13.9268 (0.9190)
0.043 0.231 13.7499 (1.0221)
13.7637 (0.8579)
0.896 0.015
T1LR 0.0997
(0.0242) 0.0992
(0.0342) 0.739 0.018
0.1012 (0.0235)
0.0991 (0.0215)
0.414 0.093 0.0994
(0.0216) 0.1001
(0.0262) 0.757 0.032
T1CR 0.1592
(0.0566) 0.1433
(0.0622) <0.001 0.266
0.1487 (0.0465)
0.1442 (0.0465)
0.395 0.097 0.1471
(0.0437) 0.1477
(0.0519) 0.907 0.013
TTCR 0.1705
(0.0564) 0.1568
(0.0618) <0.001 0.233
0.1613 (0.0462)
0.1565 (0.0464)
0.356 0.105 0.1594
(0.0433) 0.1600
(0.0517) 0.898 0.014
DELAL 1.9266
(7.4017) 2.2016
(4.4334) 0.521 0.045
1.8251 (1.6266)
1.9928 (1.5586)
0.355 0.105 2.0135
(3.0213) 2.0195
(1.6581) 0.977 0.002
PSEC 0.0987
(0.0938) 0.0571
(0.0592) <0.001 0.530
0.0683 (0.0752)
0.0600 (0.0642)
0.295 0.119 0.0671
(0.0782) 0.0646
(0.0690) 0.768 0.034
EFF 0.7197
(0.9240) 0.6575
(0.1785) 0.233 0.093
0.6812 (0.1637)
0.6850 (0.1908)
0.851 0.021 0.6903
(0.1872) 0.6928
(0.1850) 0.900 0.013
ROA 0.0091
(0.0089) 0.0089
(0.0086) 0.719 0.022
0.0086 (0.0111)
0.0079 (0.0073)
0.495 0.078 0.0077
(0.0118) 0.0078
(0.0079) 0.951 0.007
ROE 0.0777
(0.2222) 0.0751
(0.1098) 0.842 0.014
0.0717 (0.1897)
0.0656 (0.1260)
0.738 0.038 0.0584
(0.2353) 0.0613
(0.1397) 0.891 0.015
NIM 0.0334
(0.0072) 0.0341
(0.0093) 0.134 0.082
0.0339 (0.0078)
0.0339 (0.0060)
0.933 0.010 0.0340
(0.0084) 0.0339
(0.0062) 0.865 0.018
CD 0.7987
(0.0757) 0.7310
(0.1224) <0.001 0.665
0.7495 (0.1008)
0.7513 (0.1049)
0.879 0.017 0.7530
(0.1067) 0.7502
(0.1091) 0.831 0.025
VLDR 0.0541
(0.0748) 0.1041
(0.1012) <0.001 0.562
0.0925 (0.0607)
0.0840 (0.0726)
0.263 0.127 0.0883
(0.0620) 0.0856
(0.0642) 0.695 0.043
LQ 0.2839
(0.1209) 0.2051
(0.1241) <0.001 0.643
0.2299 (0.1100)
0.2348 (0.1263)
0.718 0.041 0.2287
(0.1076) 0.2339
(0.1286) 0.697 0.044
RORA 0.0045
(0.0110) 0.0070
(0.0088) <0.001 0.250
0.0065 (0.0092)
0.0062 (0.0101)
0.832 0.024 0.0069
(0.0105) 0.0068
(0.0108) 0.940 0.009
LTD 0.0964
(0.0589) 0.0750
(0.0623) <0.001 0.353
0.0915 (0.0598)
0.0852 (0.0661)
0.378 0.100 0.0875
(0.0565) 0.0872
(0.0716) 0.962 0.005
UNST 6.2444
(1.6137) 7.6263
(1.4534) <0.001 0.900
7.5110 (1.4463)
7.6303 (1.4567)
0.470 0.082 7.5517
(1.4448) 7.5874
(1.4682) 0.823 0.025

95
GDPST 4.8015
(3.7971) 3.6696
(1.5368) <0.001 0.391
3.9548 (1.3969)
3.8903 (1.5404)
0.700 0.044 3.9579
(1.4089) 3.9530
(1.4033) 0.973 0.004
PMST 0.3604
(0.1709) 0.2848
(0.1153) <0.001 0.518
0.3003 (0.1155)
0.2982 (0.1151)
0.869 0.019 0.2976
(0.1093) 0.2987
(0.1099) 0.926 0.010
2013 Unmatched Matched Weighted
Private Public p SMD Private Public p SMD Private Public p SMD
N 2008 331 148 148 120.9 121.0
TYPE = FHC (%)
184 (9.2)
146 (44.1)
<0.001 0.861 36
(24.3) 45
(30.4) 0.297 0.137
32.8 (27.1)
34.1 (28.1)
0.828 0.024
CRE.PD30 0.0023
(0.0051) 0.0021
(0.0035) 0.412 0.054
0.0025 (0.0049)
0.0027 (0.0048)
0.722 0.041 0.0025
(0.0048) 0.0026
(0.0047) 0.795 0.028
CRE.PD90 0.0005
(0.0058) 0.0014
(0.0050) 0.009 0.164
0.0006 (0.0022)
0.0013 (0.0058)
0.160 0.164 0.0011
(0.0096) 0.0011
(0.0047) 0.923 0.006
CRE.NAC 0.0061
(0.0152) 0.0072
(0.0090) 0.225 0.083
0.0081 (0.0098)
0.0090 (0.0117)
0.472 0.084 0.0092
(0.0150) 0.0093
(0.0125) 0.957 0.005
CRE.NCH 0.0009
(0.0029) 0.0015
(0.0044) 0.003 0.151
0.0017 (0.0036)
0.0016 (0.0040)
0.962 0.006 0.0018
(0.0034) 0.0017
(0.0042) 0.895 0.015
RRE.PD30 0.0038
(0.0054) 0.0029
(0.0033) 0.007 0.186
0.0029 (0.0039)
0.0028 (0.0033)
0.855 0.021 0.0028
(0.0039) 0.0029
(0.0032) 0.793 0.026
RRE.PD90 0.0006
(0.0021) 0.0011
(0.0033) <0.001 0.186
0.0004 (0.0010)
0.0005 (0.0016)
0.623 0.057 0.0005
(0.0023) 0.0005
(0.0019) 0.914 0.010
RRE.NAC 0.0028
(0.0049) 0.0046
(0.0061) <0.001 0.317
0.0044 (0.0064)
0.0041 (0.0051)
0.651 0.053 0.0042
(0.0061) 0.0042
(0.0050) 0.991 0.001
RRE.NCH 0.0006
(0.0013) 0.0009
(0.0015) <0.001 0.267
0.0008 (0.0013)
0.0008 (0.0014)
0.945 0.008 0.0008
(0.0014) 0.0008
(0.0014) 0.831 0.023
CI.PD30 0.0013
(0.0033) 0.0008
(0.0014) 0.003 0.213
0.0008 (0.0024)
0.0010 (0.0018)
0.490 0.080 0.0009
(0.0023) 0.0009
(0.0016) 0.788 0.027
CI.PD90 0.0003
(0.0017) 0.0002
(0.0011) 0.533 0.042
0.0001 (0.0003)
0.0003 (0.0015)
0.152 0.167 0.0002
(0.0012) 0.0002
(0.0009) 0.665 0.026
CI.NAC 0.0022
(0.0091) 0.0016
(0.0020) 0.174 0.104
0.0017 (0.0031)
0.0017 (0.0024)
0.948 0.008 0.0017
(0.0029) 0.0017
(0.0024) 0.798 0.027
CI.NCH 0.0007
(0.0029) 0.0007
(0.0013) 0.962 0.003
0.0005 (0.0012)
0.0007 (0.0014)
0.149 0.168 0.0006
(0.0015) 0.0006
(0.0010) 0.990 0.001
CS.PD30 0.0013
(0.0033) 0.0010
(0.0049) 0.254 0.058
0.0010 (0.0038)
0.0011 (0.0068)
0.812 0.028 0.0010
(0.0043) 0.0009
(0.0056) 0.907 0.012
CS.PD90 0.0003
(0.0047) 0.0004
(0.0018) 0.746 0.024
0.0001 (0.0006)
0.0002 (0.0012)
0.467 0.085 0.0002
(0.0044) 0.0002
(0.0014) 0.998 <0.001

96
CS.NAC 0.0002
(0.0007) 0.0002
(0.0008) 0.050 0.111
0.0002 (0.0005)
0.0002 (0.0011)
0.756 0.036 0.0002
(0.0005) 0.0002
(0.0008) 0.963 0.004
CS.NCH 0.0004
(0.0015) 0.0009
(0.0040) <0.001 0.181
0.0006 (0.0028)
0.0006 (0.0027)
0.940 0.009 0.0006
(0.0031) 0.0004
(0.0021) 0.718 0.044
FARM.PD30 0.0007
(0.0031) 0.0001
(0.0002) <0.001 0.291
0.0001 (0.0004)
0.0001 (0.0002)
0.543 0.071 0.0001
(0.0004) 0.0001
(0.0002) 0.816 0.015
FARM.PD90 0.0001
(0.0010) 0.0000
(0.0002) 0.061 0.143
0.0000 (0.0001)
0.0000 (0.0003)
0.692 0.046 0.0000
(0.0003) 0.0000
(0.0003) 0.865 0.017
FARM.NAC 0.0008
(0.0038) 0.0002
(0.0009) 0.006 0.210
0.0004 (0.0013)
0.0003 (0.0013)
0.746 0.038 0.0004
(0.0014) 0.0003
(0.0014) 0.928 0.009
FARM.NCH 0.0000
(0.0009) 0.0000
(0.0002) 0.690 0.030
0.0000 (0.0001)
0.0000 (0.0003)
0.190 0.153 0.0000
(0.0006) 0.0000
(0.0002) 0.805 0.011
AG.PD30 0.0004
(0.0020) 0.0000
(0.0001) 0.002 0.244
0.0000 (0.0001)
0.0000 (0.0001)
0.941 0.009 0.0000
(0.0001) 0.0000
(0.0001) 0.789 0.030
AG.PD90 0.0001
(0.0005) 0.0000
(0.0000) 0.076 0.138
0.0000 (0.0000)
0.0000 (0.0001)
0.248 0.135 0.0000
(0.0000) 0.0000
(0.0000) 0.845 0.008
AG.NAC 0.0003
(0.0038) 0.0000
(0.0003) 0.142 0.114
0.0002 (0.0016)
0.0001 (0.0004)
0.502 0.078 0.0001
(0.0006) 0.0001
(0.0005) 0.702 0.033
AG.NCH 0.0000
(0.0006) 0.0000
(0.0000) 0.212 0.097
0.0001 (0.0005)
0.0000 (0.0001)
0.329 0.114 -0.0000 (0.0002)
0.0000 (0.0001)
0.603 0.045
CRE.CON 1.5914
(1.3088) 2.7078
(1.2291) <0.001 0.879
2.7223 (1.1954)
2.7960 (1.0970)
0.581 0.064 2.7627
(1.2269) 2.7659
(1.0609) 0.979 0.003
RRE.CON 1.2341
(0.8711) 1.6884
(1.0642) <0.001 0.467
1.5790 (1.0625)
1.4871 (1.0141)
0.447 0.089 1.5310
(1.0190) 1.5161
(0.9768) 0.889 0.015
CI.CON 0.7847
(0.5526) 1.1044
(0.8607) <0.001 0.442
0.9407 (0.7197)
1.1224 (0.9126)
0.058 0.221 1.0246
(0.7936) 1.0424
(0.8142) 0.839 0.022
CS.CON 0.3079
(0.3647) 0.4275
(0.8020) <0.001 0.192
0.3619 (0.8523)
0.3597 (0.6506)
0.980 0.003 0.3127
(0.7799) 0.3064
(0.5084) 0.932 0.010
FARM.CON 0.7421
(0.7256) 0.0943
(0.1724) <0.001 1.228
0.1642 (0.2561)
0.1379 (0.2258)
0.350 0.109 0.1620
(0.2681) 0.1575
(0.2390) 0.856 0.017
AG.CON 0.7966
(0.9197) 0.0630
(0.1886) <0.001 1.105
0.1182 (0.2891)
0.1041 (0.2679)
0.663 0.051 0.1219
(0.3162) 0.1148
(0.2843) 0.804 0.023
CRE.G 0.1205
(1.0148) 0.0925
(0.2375) 0.618 0.038
0.0998 (0.5705)
0.0960 (0.2343)
0.940 0.009 0.0961
(0.5037) 0.0993
(0.2479) 0.939 0.008
RRE.G 0.0384
(0.3394) 0.0605
(0.3287) 0.271 0.066
0.0305 (0.3524)
0.0348 (0.2798)
0.907 0.014 0.0466
(0.3881) 0.0435
(0.2916) 0.938 0.009
CI.G 0.0744
(0.3073) 0.0990
(0.2317) 0.165 0.090
0.0719 (0.2325)
0.1019 (0.2345)
0.271 0.128 0.0911
(0.2308) 0.0936
(0.2441) 0.921 0.011

97
CS.G 0.0287
(0.5860) 0.1337
(1.2076) 0.013 0.111
0.2001 (1.0779)
0.1664 (1.7334)
0.841 0.023 0.1020
(0.7285) 0.1167
(1.4304) 0.890 0.013
FARM.G 0.1917
(2.4310) 0.2709
(2.7917) 0.591 0.030
0.2502 (2.0611)
0.1601 (1.1077)
0.640 0.054 0.1781
(1.7053) 0.1760
(1.1504) 0.989 0.001
AG.G 0.2984
(5.2735) 1.0220
(10.5919) 0.053 0.086
0.3598 (3.3360)
0.2319 (1.5016)
0.671 0.049 0.3747
(6.0125) 0.4067
(5.4677) 0.908 0.006
PD30.G 1.7224
(18.0032) 0.5093
(4.4121) 0.223 0.093
0.2862 (2.0107)
1.0374 (6.3189)
0.169 0.160 0.8967
(12.1523) 1.0593
(6.4797) 0.827 0.017
PD90.G 4.2306
(40.1383) 3.3988
(32.2876) 0.720 0.023
0.3399 (2.5497)
3.2016 (24.1740)
0.153 0.166 2.0467
(35.0630) 2.4758
(21.0218) 0.748 0.015
NAC.G 1.1403
(11.5917) -0.0644 (1.9974)
0.059 0.145 0.1496
(1.5110) 0.0787
(2.9661) 0.796 0.030
0.1440 (4.3640)
0.1142 (3.2658)
0.925 0.008
SIZE 12.1180 (1.1573)
14.7857 (1.6357)
<0.001 1.883 13.7159 (1.0175)
13.8301 (0.8079)
0.286 0.124 13.7772 (1.0181)
13.7715 (0.8055)
0.952 0.006
T1LR 0.1026
(0.0254) 0.0986
(0.0199) 0.006 0.176
0.1006 (0.0189)
0.1008 (0.0198)
0.934 0.010 0.1003
(0.0197) 0.1007
(0.0199) 0.816 0.025
T1CR 0.1620
(0.0586) 0.1387
(0.0501) <0.001 0.428
0.1432 (0.0327)
0.1423 (0.0450)
0.845 0.023 0.1437
(0.0377) 0.1449
(0.0471) 0.807 0.027
TTCR 0.1731
(0.0585) 0.1513
(0.0500) <0.001 0.401
0.1551 (0.0328)
0.1541 (0.0446)
0.818 0.027 0.1556
(0.0375) 0.1567
(0.0466) 0.810 0.026
DELAL 2.1650
(17.4617) 2.1729
(8.1624) 0.994 0.001
3.5047 (23.3344)
1.8766 (1.5421)
0.398 0.098 1.9939
(10.1838) 2.1047
(6.4586) 0.816 0.013
PSEC 0.1046
(0.0983) 0.0577
(0.0595) <0.001 0.577
0.0670 (0.0748)
0.0607 (0.0585)
0.425 0.093 0.0667
(0.0765) 0.0647
(0.0618) 0.797 0.028
EFF 0.7022
(0.1746) 0.6632
(0.1508) <0.001 0.239
0.6879 (0.1616)
0.6809 (0.1458)
0.695 0.046 0.6890
(0.1665) 0.6905
(0.1454) 0.922 0.010
ROA 0.0095
(0.0075) 0.0098
(0.0061) 0.491 0.044
0.0099 (0.0073)
0.0100 (0.0068)
0.898 0.015 0.0095
(0.0078) 0.0095
(0.0059) 0.977 0.003
ROE 0.0783
(0.5930) 0.0902
(0.0560) 0.714 0.028
0.0943 (0.0733)
0.0920 (0.0585)
0.766 0.035 0.0894
(0.0899) 0.0889
(0.0546) 0.931 0.008
NIM 0.0329
(0.0067) 0.0335
(0.0106) 0.140 0.073
0.0335 (0.0102)
0.0340 (0.0102)
0.633 0.056 0.0335
(0.0102) 0.0333
(0.0084) 0.895 0.016
CD 0.7993
(0.0778) 0.7349
(0.1265) <0.001 0.614
0.7545 (0.1108)
0.7436 (0.1272)
0.431 0.092 0.7522
(0.1130) 0.7504
(0.1153) 0.895 0.015
VLDR 0.0616
(0.0727) 0.1052
(0.1066) <0.001 0.477
0.0857 (0.0645)
0.0928 (0.0945)
0.449 0.088 0.0898
(0.0640) 0.0883
(0.0747) 0.842 0.022
LQ 0.2643
(0.1174) 0.1838
(0.1282) <0.001 0.655
0.2018 (0.0987)
0.2132 (0.1445)
0.429 0.092 0.2108
(0.0990) 0.2122
(0.1386) 0.916 0.012

98
RORA 0.0045
(0.0095) 0.0064
(0.0076) <0.001 0.223
0.0070 (0.0094)
0.0064 (0.0087)
0.576 0.065 0.0063
(0.0085) 0.0063
(0.0091) 0.967 0.004
LTD 0.0925
(0.0571) 0.0670
(0.0553) <0.001 0.453
0.0806 (0.0528)
0.0763 (0.0572)
0.500 0.079 0.0818
(0.0565) 0.0801
(0.0613) 0.802 0.028
UNST 5.7870
(1.5983) 6.8553
(1.1636) <0.001 0.764
6.9081 (1.2790)
6.9520 (1.2662)
0.767 0.035 6.9058
(1.2630) 6.9100
(1.2490) 0.975 0.003
GDPST 3.2484
(1.7569) 2.7840
(1.3884) <0.001 0.293
2.8466 (1.4607)
2.8682 (1.5245)
0.901 0.014 2.8374
(1.5355) 2.9120
(1.5155) 0.650 0.049
PMST 0.2134
(0.0989) 0.2506
(0.1143) <0.001 0.348
0.2536 (0.1273)
0.2464 (0.1199)
0.618 0.058 0.2479
(0.1269) 0.2473
(0.1242) 0.971 0.004
2014 Unmatched Matched Weighted
Private Public p SMD Private Public p SMD Private Public p SMD
N 1972 283 143 143 101.7 103.4
TYPE = FHC (%)
180 (9.1)
119 (42.0)
<0.001 0.815 38
(26.6) 47
(32.9) 0.301 0.138
26.2 (25.7)
27.3 (26.4)
0.892 0.016
CRE.PD30 0.0017
(0.0041) 0.0016
(0.0028) 0.664 0.031
0.0017 (0.0034)
0.0018 (0.0032)
0.770 0.035 0.0017
(0.0034) 0.0018
(0.0029) 0.812 0.028
CRE.PD90 0.0004
(0.0034) 0.0007
(0.0024) 0.129 0.107
0.0010 (0.0077)
0.0007 (0.0021)
0.685 0.048 0.0007
(0.0057) 0.0007
(0.0023) 0.904 0.011
CRE.NAC 0.0043
(0.0098) 0.0052
(0.0075) 0.135 0.104
0.0069 (0.0090)
0.0067 (0.0099)
0.836 0.025 0.0067
(0.0111) 0.0068
(0.0097) 0.876 0.016
CRE.NCH 0.0003
(0.0018) 0.0003
(0.0010) 0.932 0.006
0.0002 (0.0018)
0.0003 (0.0012)
0.627 0.058 0.0004
(0.0018) 0.0003
(0.0012) 0.941 0.008
RRE.PD30 0.0032
(0.0046) 0.0024
(0.0035) 0.003 0.205
0.0023 (0.0032)
0.0023 (0.0029)
0.825 0.026 0.0022
(0.0031) 0.0023
(0.0031) 0.840 0.021
RRE.PD90 0.0005
(0.0020) 0.0005
(0.0012) 0.889 0.010
0.0005 (0.0029)
0.0005 (0.0013)
0.970 0.004 0.0004
(0.0022) 0.0004
(0.0011) 0.811 0.023
RRE.NAC 0.0024
(0.0045) 0.0033
(0.0040) 0.003 0.193
0.0030 (0.0041)
0.0031 (0.0033)
0.729 0.041 0.0031
(0.0045) 0.0031
(0.0034) 0.980 0.003
RRE.NCH 0.0004
(0.0009) 0.0005
(0.0009) 0.026 0.144
0.0005 (0.0009)
0.0005 (0.0011)
0.750 0.038 0.0005
(0.0009) 0.0005
(0.0010) 0.878 0.017
CI.PD30 0.0012
(0.0038) 0.0007
(0.0014) 0.020 0.186
0.0008 (0.0029)
0.0009 (0.0018)
0.594 0.063 0.0007
(0.0025) 0.0007
(0.0015) 0.841 0.021
CI.PD90 0.0003
(0.0015) 0.0001
(0.0004) 0.076 0.145
0.0001 (0.0009)
0.0001 (0.0005)
0.888 0.017 0.0001
(0.0006) 0.0001
(0.0005) 0.600 0.040
CI.NAC 0.0018
(0.0048) 0.0013
(0.0017) 0.093 0.134
0.0014 (0.0025)
0.0014 (0.0020)
0.892 0.016 0.0013
(0.0023) 0.0014
(0.0020) 0.689 0.043

99
CI.NCH 0.0006
(0.0036) 0.0005
(0.0015) 0.853 0.015
0.0007 (0.0026)
0.0007 (0.0020)
0.782 0.033 0.0007
(0.0043) 0.0007
(0.0017) 0.837 0.013
CS.PD30 0.0011
(0.0028) 0.0006
(0.0016) 0.002 0.231
0.0005 (0.0016)
0.0005 (0.0013)
0.972 0.004 0.0005
(0.0019) 0.0005
(0.0013) 0.934 0.007
CS.PD90 0.0003
(0.0029) 0.0002
(0.0010) 0.749 0.026
0.0001 (0.0003)
0.0002 (0.0012)
0.140 0.175 0.0002
(0.0035) 0.0002
(0.0012) 0.787 0.016
CS.NAC 0.0002
(0.0008) 0.0001
(0.0003) 0.007 0.212
0.0001 (0.0004)
0.0001 (0.0002)
0.787 0.032 0.0001
(0.0004) 0.0001
(0.0003) 0.981 0.002
CS.NCH 0.0003
(0.0018) 0.0006
(0.0023) 0.042 0.117
0.0004 (0.0027)
0.0004 (0.0020)
0.946 0.008 0.0004
(0.0024) 0.0003
(0.0016) 0.874 0.016
FARM.PD30 0.0005
(0.0020) 0.0001
(0.0002) <0.001 0.330
0.0002 (0.0006)
0.0001 (0.0003)
0.320 0.118 0.0001
(0.0005) 0.0001
(0.0004) 0.952 0.006
FARM.PD90 0.0002
(0.0011) 0.0000
(0.0001) 0.040 0.173
0.0000 (0.0001)
0.0000 (0.0001)
0.950 0.007 0.0000
(0.0001) 0.0000
(0.0001) 0.808 0.023
FARM.NAC 0.0007
(0.0035) 0.0002
(0.0007) 0.012 0.207
0.0003 (0.0009)
0.0002 (0.0009)
0.634 0.056 0.0003
(0.0010) 0.0003
(0.0010) 0.932 0.011
FARM.NCH 0.0000
(0.0004) 0.0000
(0.0001) 0.566 0.047
0.0000 (0.0002)
0.0000 (0.0001)
0.477 0.084 0.0000
(0.0003) 0.0000
(0.0001) 0.910 0.007
AG.PD30 0.0003
(0.0014) 0.0000
(0.0001) 0.004 0.242
0.0000 (0.0001)
0.0000 (0.0001)
0.384 0.103 0.0000
(0.0001) 0.0000
(0.0001) 0.965 0.005
AG.PD90 0.0001
(0.0005) 0.0000
(0.0000) 0.069 0.153
0.0000 (0.0000)
0.0000 (0.0000)
0.680 0.049 0.0000
(0.0000) 0.0000
(0.0000) 0.888 0.011
AG.NAC 0.0003
(0.0017) 0.0000
(0.0002) 0.025 0.187
0.0000 (0.0001)
0.0000 (0.0003)
0.286 0.126 0.0001
(0.0009) 0.0001
(0.0003) 0.889 0.009
AG.NCH 0.0001
(0.0022) 0.0000
(0.0000) 0.404 0.070
0.0000 (0.0001)
-0.0000 (0.0000)
0.226 0.144 0.0000
(0.0002) -0.0000 (0.0000)
0.910 0.004
CRE.CON 1.6383
(1.3510) 2.9077
(1.2302) <0.001 0.982
2.8297 (1.1331)
2.8894 (1.1252)
0.655 0.053 2.8648
(1.1674) 2.8611
(1.0883) 0.975 0.003
RRE.CON 1.2471
(0.8819) 1.6976
(0.9649) <0.001 0.487
1.5050 (0.9358)
1.5532 (0.9413)
0.665 0.051 1.5732
(1.0024) 1.5607
(0.8623) 0.906 0.013
CI.CON 0.8013
(0.5767) 1.1727
(0.8831) <0.001 0.498
1.0731 (0.8745)
1.1802 (0.9536)
0.323 0.117 1.0848
(0.8622) 1.0899
(0.8552) 0.960 0.006
CS.CON 0.3005
(0.3849) 0.3531
(0.5918) 0.047 0.105
0.2732 (0.5846)
0.2937 (0.4391)
0.737 0.040 0.2617
(0.5254) 0.2703
(0.4307) 0.865 0.018
FARM.CON 0.7536
(0.7250) 0.1093
(0.1903) <0.001 1.216
0.2247 (0.3476)
0.1457 (0.2332)
0.025 0.267 0.1886
(0.3072) 0.1786
(0.2579) 0.740 0.035
AG.CON 0.8565
(0.9829) 0.0688
(0.1968) <0.001 1.111
0.1404 (0.3097)
0.1027 (0.2645)
0.269 0.131 0.1346
(0.3316) 0.1235
(0.2954) 0.730 0.035

100
CRE.G 0.1172
(0.9815) 0.1299
(0.2455) 0.829 0.018
0.1135 (0.2474)
0.1131 (0.1909)
0.989 0.002 0.1205
(0.2603) 0.1176
(0.2040) 0.920 0.012
RRE.G 0.1168
(1.2608) 0.1232
(0.4011) 0.932 0.007
0.0807 (0.1618)
0.0921 (0.1903)
0.585 0.065 0.0895
(0.2033) 0.0939
(0.1892) 0.833 0.022
CI.G 0.0998
(0.3614) 0.1892
(0.4939) <0.001 0.207
0.1663 (0.2919)
0.1581 (0.2919)
0.814 0.028 0.1641
(0.2843) 0.1643
(0.3190) 0.996 0.001
CS.G 0.0385
(0.3732) 0.4124
(2.6445) <0.001 0.198
0.1242 (0.6770)
0.1667 (0.5561)
0.563 0.069 0.1922
(0.8000) 0.2137
(1.0180) 0.823 0.023
FARM.G 0.2798
(6.3642) 0.7323
(7.1231) 0.271 0.067
0.1115 (0.5826)
0.1757 (1.3900)
0.611 0.060 0.1295
(0.6590) 0.1021
(1.6382) 0.700 0.022
AG.G 2.4341
(100.8661) 2.5644
(37.5636) 0.983 0.002
0.2619 (1.4240)
0.2322 (1.8473)
0.879 0.018 0.2823
(1.4888) 0.2921
(2.1376) 0.967 0.005
PD30.G 1.1094
(9.7931) 0.4700
(6.4912) 0.287 0.077
0.1512 (1.9788)
0.8889 (9.0698)
0.343 0.112 0.2625
(3.0749) 0.2602
(4.9918) 0.994 0.001
PD90.G 3.6842
(42.1558) 2.1028
(17.9718) 0.533 0.049
2.1925 (10.3836)
2.2864 (21.7984)
0.963 0.006 1.8463
(10.2831) 2.7286
(22.8089) 0.679 0.050
NAC.G 0.7709
(7.1339) -0.0613 (0.5997)
0.050 0.164 -0.0650 (0.7675)
-0.0352 (0.6598)
0.725 0.042 -0.0757 (0.8621)
-0.0694 (0.6242)
0.944 0.008
SIZE 12.1900 (1.1417)
14.7108 (1.3485)
<0.001 2.018 13.7798 (0.9282)
14.0196 (0.9472)
0.031 0.256 13.8700 (0.9312)
13.8836 (0.8911)
0.895 0.015
T1LR 0.1041
(0.0262) 0.1003
(0.0343) 0.028 0.125
0.1025 (0.0219)
0.1004 (0.0183)
0.373 0.105 0.1012
(0.0211) 0.1016
(0.0276) 0.866 0.016
T1CR 0.1610
(0.0584) 0.1400
(0.0746) <0.001 0.313
0.1458 (0.0533)
0.1412 (0.0641)
0.507 0.079 0.1424
(0.0395) 0.1433
(0.0613) 0.864 0.017
TTCR 0.1720
(0.0583) 0.1514
(0.0741) <0.001 0.308
0.1572 (0.0535)
0.1523 (0.0634)
0.476 0.084 0.1538
(0.0396) 0.1546
(0.0606) 0.870 0.016
DELAL 1.4819
(2.3310) 1.5022
(1.3922) 0.886 0.011
1.6072 (3.5590)
1.5790 (1.3566)
0.929 0.010 1.4817
(3.1060) 1.5738
(1.4472) 0.673 0.038
PSEC 0.1006
(0.0958) 0.0555
(0.0564) <0.001 0.574
0.0643 (0.0704)
0.0577 (0.0573)
0.380 0.104 0.0646
(0.0653) 0.0609
(0.0595) 0.601 0.058
EFF 0.6898
(0.1458) 0.6841
(0.3302) 0.616 0.022
0.7031 (0.1432)
0.6783 (0.1362)
0.135 0.177 0.7016
(0.1466) 0.7028
(0.2408) 0.946 0.006
ROA 0.0102
(0.0070) 0.0088
(0.0078) 0.002 0.187
0.0089 (0.0059)
0.0090 (0.0065)
0.939 0.009 0.0091
(0.0058) 0.0089
(0.0081) 0.876 0.018
ROE 0.1115
(0.7470) 0.0818
(0.0531) 0.504 0.056
0.0829 (0.0550)
0.0822 (0.0529)
0.917 0.012 0.0836
(0.0855) 0.0814
(0.0598) 0.753 0.030
NIM 0.0332
(0.0067) 0.0320
(0.0062) 0.004 0.187
0.0328 (0.0069)
0.0323 (0.0052)
0.446 0.090 0.0326
(0.0066) 0.0326
(0.0049) 0.924 0.011
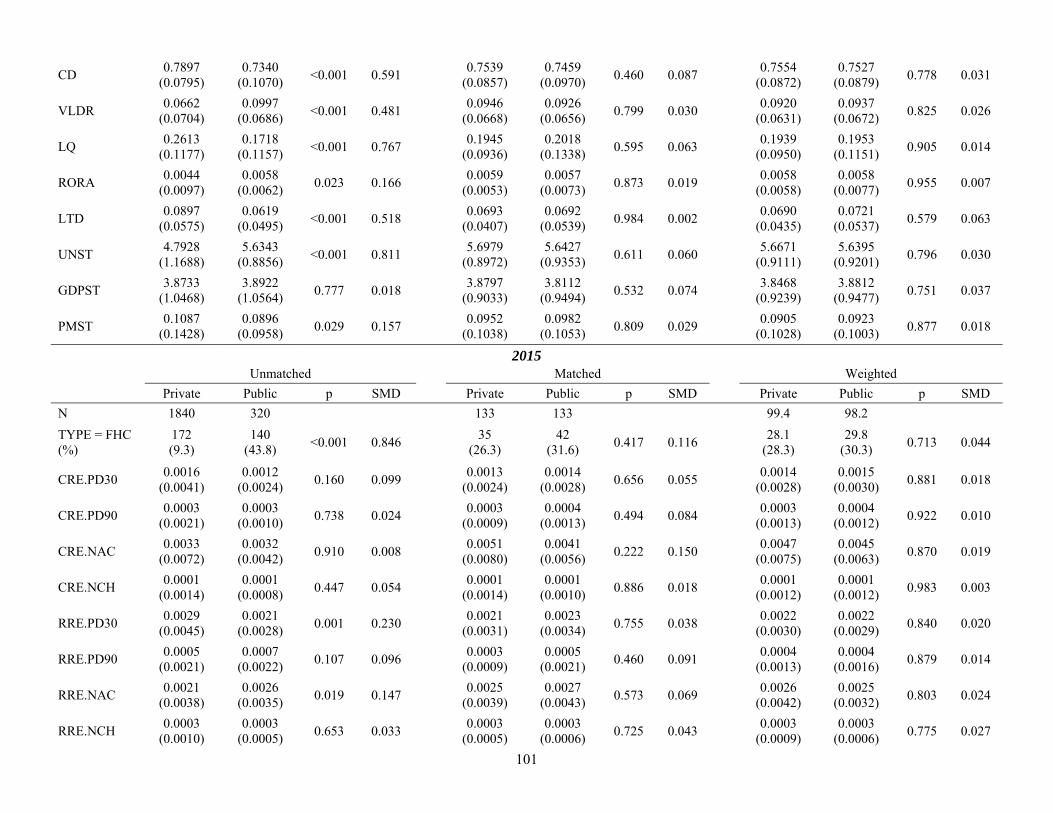
101
CD 0.7897
(0.0795) 0.7340
(0.1070) <0.001 0.591
0.7539 (0.0857)
0.7459 (0.0970)
0.460 0.087 0.7554
(0.0872) 0.7527
(0.0879) 0.778 0.031
VLDR 0.0662
(0.0704) 0.0997
(0.0686) <0.001 0.481
0.0946 (0.0668)
0.0926 (0.0656)
0.799 0.030 0.0920
(0.0631) 0.0937
(0.0672) 0.825 0.026
LQ 0.2613
(0.1177) 0.1718
(0.1157) <0.001 0.767
0.1945 (0.0936)
0.2018 (0.1338)
0.595 0.063 0.1939
(0.0950) 0.1953
(0.1151) 0.905 0.014
RORA 0.0044
(0.0097) 0.0058
(0.0062) 0.023 0.166
0.0059 (0.0053)
0.0057 (0.0073)
0.873 0.019 0.0058
(0.0058) 0.0058
(0.0077) 0.955 0.007
LTD 0.0897
(0.0575) 0.0619
(0.0495) <0.001 0.518
0.0693 (0.0407)
0.0692 (0.0539)
0.984 0.002 0.0690
(0.0435) 0.0721
(0.0537) 0.579 0.063
UNST 4.7928
(1.1688) 5.6343
(0.8856) <0.001 0.811
5.6979 (0.8972)
5.6427 (0.9353)
0.611 0.060 5.6671
(0.9111) 5.6395
(0.9201) 0.796 0.030
GDPST 3.8733
(1.0468) 3.8922
(1.0564) 0.777 0.018
3.8797 (0.9033)
3.8112 (0.9494)
0.532 0.074 3.8468
(0.9239) 3.8812
(0.9477) 0.751 0.037
PMST 0.1087
(0.1428) 0.0896
(0.0958) 0.029 0.157
0.0952 (0.1038)
0.0982 (0.1053)
0.809 0.029 0.0905
(0.1028) 0.0923
(0.1003) 0.877 0.018
2015 Unmatched Matched Weighted
Private Public p SMD Private Public p SMD Private Public p SMD
N 1840 320 133 133 99.4 98.2
TYPE = FHC (%)
172 (9.3)
140 (43.8)
<0.001 0.846 35
(26.3) 42
(31.6) 0.417 0.116
28.1 (28.3)
29.8 (30.3)
0.713 0.044
CRE.PD30 0.0016
(0.0041) 0.0012
(0.0024) 0.160 0.099
0.0013 (0.0024)
0.0014 (0.0028)
0.656 0.055 0.0014
(0.0028) 0.0015
(0.0030) 0.881 0.018
CRE.PD90 0.0003
(0.0021) 0.0003
(0.0010) 0.738 0.024
0.0003 (0.0009)
0.0004 (0.0013)
0.494 0.084 0.0003
(0.0013) 0.0004
(0.0012) 0.922 0.010
CRE.NAC 0.0033
(0.0072) 0.0032
(0.0042) 0.910 0.008
0.0051 (0.0080)
0.0041 (0.0056)
0.222 0.150 0.0047
(0.0075) 0.0045
(0.0063) 0.870 0.019
CRE.NCH 0.0001
(0.0014) 0.0001
(0.0008) 0.447 0.054
0.0001 (0.0014)
0.0001 (0.0010)
0.886 0.018 0.0001
(0.0012) 0.0001
(0.0012) 0.983 0.003
RRE.PD30 0.0029
(0.0045) 0.0021
(0.0028) 0.001 0.230
0.0021 (0.0031)
0.0023 (0.0034)
0.755 0.038 0.0022
(0.0030) 0.0022
(0.0029) 0.840 0.020
RRE.PD90 0.0005
(0.0021) 0.0007
(0.0022) 0.107 0.096
0.0003 (0.0009)
0.0005 (0.0021)
0.460 0.091 0.0004
(0.0013) 0.0004
(0.0016) 0.879 0.014
RRE.NAC 0.0021
(0.0038) 0.0026
(0.0035) 0.019 0.147
0.0025 (0.0039)
0.0027 (0.0043)
0.573 0.069 0.0026
(0.0042) 0.0025
(0.0032) 0.803 0.024
RRE.NCH 0.0003
(0.0010) 0.0003
(0.0005) 0.653 0.033
0.0003 (0.0005)
0.0003 (0.0006)
0.725 0.043 0.0003
(0.0009) 0.0003
(0.0006) 0.775 0.027

102
CI.PD30 0.0012
(0.0030) 0.0006
(0.0011) 0.001 0.258
0.0006 (0.0015)
0.0007 (0.0012)
0.838 0.025 0.0006
(0.0015) 0.0006
(0.0012) 0.830 0.021
CI.PD90 0.0002
(0.0013) 0.0001
(0.0003) 0.120 0.120
0.0001 (0.0002)
0.0001 (0.0004)
0.062 0.230 0.0001
(0.0010) 0.0001
(0.0004) 0.803 0.018
CI.NAC 0.0017
(0.0048) 0.0013
(0.0020) 0.116 0.117
0.0009 (0.0020)
0.0013 (0.0025)
0.197 0.159 0.0011
(0.0027) 0.0013
(0.0027) 0.678 0.048
CI.NCH 0.0005
(0.0018) 0.0004
(0.0012) 0.331 0.066
0.0003 (0.0010)
0.0004 (0.0017)
0.522 0.079 0.0003
(0.0012) 0.0003
(0.0015) 0.915 0.012
CS.PD30 0.0010
(0.0026) 0.0009
(0.0036) 0.708 0.020
0.0012 (0.0058)
0.0010 (0.0046)
0.794 0.032 0.0008
(0.0043) 0.0009
(0.0046) 0.781 0.032
CS.PD90 0.0002
(0.0014) 0.0004
(0.0022) 0.033 0.107
0.0004 (0.0036)
0.0005 (0.0028)
0.877 0.019 0.0003
(0.0029) 0.0003
(0.0022) 0.909 0.012
CS.NAC 0.0002
(0.0008) 0.0001
(0.0005) 0.110 0.112
0.0002 (0.0010)
0.0002 (0.0006)
0.475 0.088 0.0002
(0.0007) 0.0002
(0.0006) 0.886 0.015
CS.NCH 0.0003
(0.0019) 0.0007
(0.0031) 0.002 0.152
0.0006 (0.0043)
0.0005 (0.0025)
0.779 0.034 0.0004
(0.0029) 0.0004
(0.0019) 0.835 0.020
FARM.PD30 0.0007
(0.0022) 0.0001
(0.0007) <0.001 0.352
0.0001 (0.0004)
0.0002 (0.0010)
0.643 0.057 0.0001
(0.0006) 0.0001
(0.0009) 0.741 0.030
FARM.PD90 0.0001
(0.0009) 0.0000
(0.0000) 0.043 0.160
0.0000 (0.0000)
0.0000 (0.0000)
0.623 0.060 0.0000
(0.0000) 0.0000
(0.0000) 0.745 0.036
FARM.NAC 0.0006
(0.0029) 0.0002
(0.0009) 0.009 0.200
0.0003 (0.0008)
0.0003 (0.0013)
0.766 0.036 0.0003
(0.0014) 0.0003
(0.0012) 0.958 0.005
FARM.NCH 0.0000
(0.0008) -0.0000 (0.0000)
0.320 0.079 0.0000
(0.0001) -0.0000 (0.0000)
0.453 0.092 -0.0000 (0.0001)
-0.0000 (0.0000)
0.762 0.024
AG.PD30 0.0004
(0.0019) 0.0000
(0.0001) <0.001 0.277
0.0000 (0.0000)
0.0000 (0.0001)
0.860 0.022 0.0000
(0.0001) 0.0000
(0.0001) 0.648 0.044
AG.PD90 0.0001
(0.0012) 0.0000
(0.0000) 0.123 0.122
0.0000 (0.0000)
0.0000 (0.0000)
0.527 0.078 0.0000
(0.0000) 0.0000
(0.0000) 0.971 0.002
AG.NAC 0.0003
(0.0027) 0.0000
(0.0001) 0.034 0.168
0.0000 (0.0002)
0.0000 (0.0001)
0.448 0.093 0.0000
(0.0001) 0.0000
(0.0001) 0.954 0.005
AG.NCH 0.0001
(0.0009) 0.0000
(0.0001) 0.134 0.118
0.0000 (0.0001)
0.0000 (0.0002)
0.632 0.059 0.0000
(0.0002) 0.0000
(0.0002) 0.847 0.017
CRE.CON 1.6710
(1.3350) 2.8804
(1.3393) <0.001 0.905
2.8256 (1.2206)
2.8919 (1.1158)
0.644 0.057 2.9052
(1.2210) 2.8585
(1.0623) 0.725 0.041
RRE.CON 1.2662
(0.9064) 1.7219
(1.0287) <0.001 0.470
1.5866 (1.0047)
1.6294 (1.0142)
0.730 0.042 1.6095
(1.0009) 1.5944
(0.9115) 0.887 0.016
CI.CON 0.7890
(0.5726) 1.2199
(0.9040) <0.001 0.569
1.0058 (0.7961)
1.1065 (0.9032)
0.336 0.118 1.0540
(0.8094) 1.0497
(0.8298) 0.965 0.005
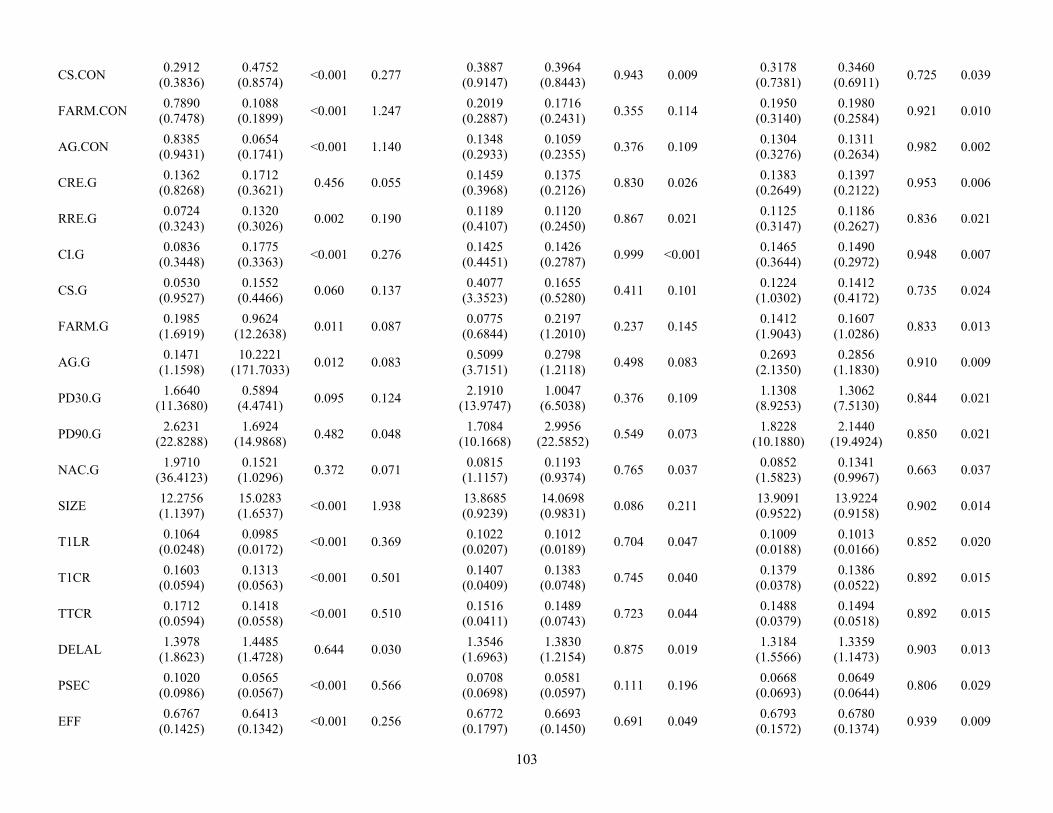
103
CS.CON 0.2912
(0.3836) 0.4752
(0.8574) <0.001 0.277
0.3887 (0.9147)
0.3964 (0.8443)
0.943 0.009 0.3178
(0.7381) 0.3460
(0.6911) 0.725 0.039
FARM.CON 0.7890
(0.7478) 0.1088
(0.1899) <0.001 1.247
0.2019 (0.2887)
0.1716 (0.2431)
0.355 0.114 0.1950
(0.3140) 0.1980
(0.2584) 0.921 0.010
AG.CON 0.8385
(0.9431) 0.0654
(0.1741) <0.001 1.140
0.1348 (0.2933)
0.1059 (0.2355)
0.376 0.109 0.1304
(0.3276) 0.1311
(0.2634) 0.982 0.002
CRE.G 0.1362
(0.8268) 0.1712
(0.3621) 0.456 0.055
0.1459 (0.3968)
0.1375 (0.2126)
0.830 0.026 0.1383
(0.2649) 0.1397
(0.2122) 0.953 0.006
RRE.G 0.0724
(0.3243) 0.1320
(0.3026) 0.002 0.190
0.1189 (0.4107)
0.1120 (0.2450)
0.867 0.021 0.1125
(0.3147) 0.1186
(0.2627) 0.836 0.021
CI.G 0.0836
(0.3448) 0.1775
(0.3363) <0.001 0.276
0.1425 (0.4451)
0.1426 (0.2787)
0.999 <0.001 0.1465
(0.3644) 0.1490
(0.2972) 0.948 0.007
CS.G 0.0530
(0.9527) 0.1552
(0.4466) 0.060 0.137
0.4077 (3.3523)
0.1655 (0.5280)
0.411 0.101 0.1224
(1.0302) 0.1412
(0.4172) 0.735 0.024
FARM.G 0.1985
(1.6919) 0.9624
(12.2638) 0.011 0.087
0.0775 (0.6844)
0.2197 (1.2010)
0.237 0.145 0.1412
(1.9043) 0.1607
(1.0286) 0.833 0.013
AG.G 0.1471
(1.1598) 10.2221
(171.7033) 0.012 0.083
0.5099 (3.7151)
0.2798 (1.2118)
0.498 0.083 0.2693
(2.1350) 0.2856
(1.1830) 0.910 0.009
PD30.G 1.6640
(11.3680) 0.5894
(4.4741) 0.095 0.124
2.1910 (13.9747)
1.0047 (6.5038)
0.376 0.109 1.1308
(8.9253) 1.3062
(7.5130) 0.844 0.021
PD90.G 2.6231
(22.8288) 1.6924
(14.9868) 0.482 0.048
1.7084 (10.1668)
2.9956 (22.5852)
0.549 0.073 1.8228
(10.1880) 2.1440
(19.4924) 0.850 0.021
NAC.G 1.9710
(36.4123) 0.1521
(1.0296) 0.372 0.071
0.0815 (1.1157)
0.1193 (0.9374)
0.765 0.037 0.0852
(1.5823) 0.1341
(0.9967) 0.663 0.037
SIZE 12.2756 (1.1397)
15.0283 (1.6537)
<0.001 1.938 13.8685 (0.9239)
14.0698 (0.9831)
0.086 0.211 13.9091 (0.9522)
13.9224 (0.9158)
0.902 0.014
T1LR 0.1064
(0.0248) 0.0985
(0.0172) <0.001 0.369
0.1022 (0.0207)
0.1012 (0.0189)
0.704 0.047 0.1009
(0.0188) 0.1013
(0.0166) 0.852 0.020
T1CR 0.1603
(0.0594) 0.1313
(0.0563) <0.001 0.501
0.1407 (0.0409)
0.1383 (0.0748)
0.745 0.040 0.1379
(0.0378) 0.1386
(0.0522) 0.892 0.015
TTCR 0.1712
(0.0594) 0.1418
(0.0558) <0.001 0.510
0.1516 (0.0411)
0.1489 (0.0743)
0.723 0.044 0.1488
(0.0379) 0.1494
(0.0518) 0.892 0.015
DELAL 1.3978
(1.8623) 1.4485
(1.4728) 0.644 0.030
1.3546 (1.6963)
1.3830 (1.2154)
0.875 0.019 1.3184
(1.5566) 1.3359
(1.1473) 0.903 0.013
PSEC 0.1020
(0.0986) 0.0565
(0.0567) <0.001 0.566
0.0708 (0.0698)
0.0581 (0.0597)
0.111 0.196 0.0668
(0.0693) 0.0649
(0.0644) 0.806 0.029
EFF 0.6767
(0.1425) 0.6413
(0.1342) <0.001 0.256
0.6772 (0.1797)
0.6693 (0.1450)
0.691 0.049 0.6793
(0.1572) 0.6780
(0.1374) 0.939 0.009

104
ROA 0.0107
(0.0061) 0.0097
(0.0044) 0.004 0.193
0.0097 (0.0059)
0.0095 (0.0052)
0.752 0.039 0.0095
(0.0056) 0.0093
(0.0049) 0.768 0.033
ROE 0.0983
(0.0588) 0.0880
(0.0374) 0.002 0.210
0.0900 (0.0673)
0.0876 (0.0434)
0.727 0.043 0.0886
(0.0583) 0.0866
(0.0419) 0.701 0.041
NIM 0.0335
(0.0064) 0.0316
(0.0093) <0.001 0.229
0.0327 (0.0098)
0.0324 (0.0079)
0.759 0.038 0.0322
(0.0077) 0.0322
(0.0057) 0.982 0.002
CD 0.7835
(0.0826) 0.7177
(0.1147) <0.001 0.658
0.7453 (0.0950)
0.7478 (0.0976)
0.835 0.026 0.7461
(0.0952) 0.7479
(0.1065) 0.888 0.018
VLDR 0.0702
(0.0676) 0.1123
(0.0937) <0.001 0.516
0.0919 (0.0651)
0.0875 (0.0677)
0.592 0.066 0.0918
(0.0642) 0.0885
(0.0645) 0.667 0.051
LQ 0.2565
(0.1142) 0.1776
(0.1181) <0.001 0.679
0.1956 (0.0957)
0.1995 (0.1282)
0.779 0.034 0.1975
(0.0987) 0.1978
(0.1201) 0.981 0.003
RORA 0.0047
(0.0112) 0.0065
(0.0071) 0.006 0.191
0.0059 (0.0084)
0.0067 (0.0093)
0.474 0.088 0.0062
(0.0086) 0.0059
(0.0071) 0.821 0.026
LTD 0.0888
(0.0618) 0.0625
(0.0562) <0.001 0.446
0.0708 (0.0554)
0.0668 (0.0524)
0.547 0.074 0.0677
(0.0450) 0.0683
(0.0546) 0.924 0.011
UNST 4.4222
(1.0381) 4.9928
(0.7648) <0.001 0.626
4.9977 (0.8481)
5.0617 (0.8421)
0.538 0.076 5.0068
(0.8389) 4.9957
(0.8557) 0.913 0.013
GDPST 2.0130
(2.8789) 3.4394
(1.9503) <0.001 0.580
3.0233 (2.4478)
3.1248 (2.3794)
0.732 0.042 3.2209
(2.1845) 3.1695
(2.2717) 0.842 0.023
PMST 0.0888
(0.1499) 0.1541
(0.2513) <0.001 0.316
0.1413 (0.1792)
0.1253 (0.1560)
0.438 0.095 0.1449
(0.1831) 0.1392
(0.1715) 0.784 0.033
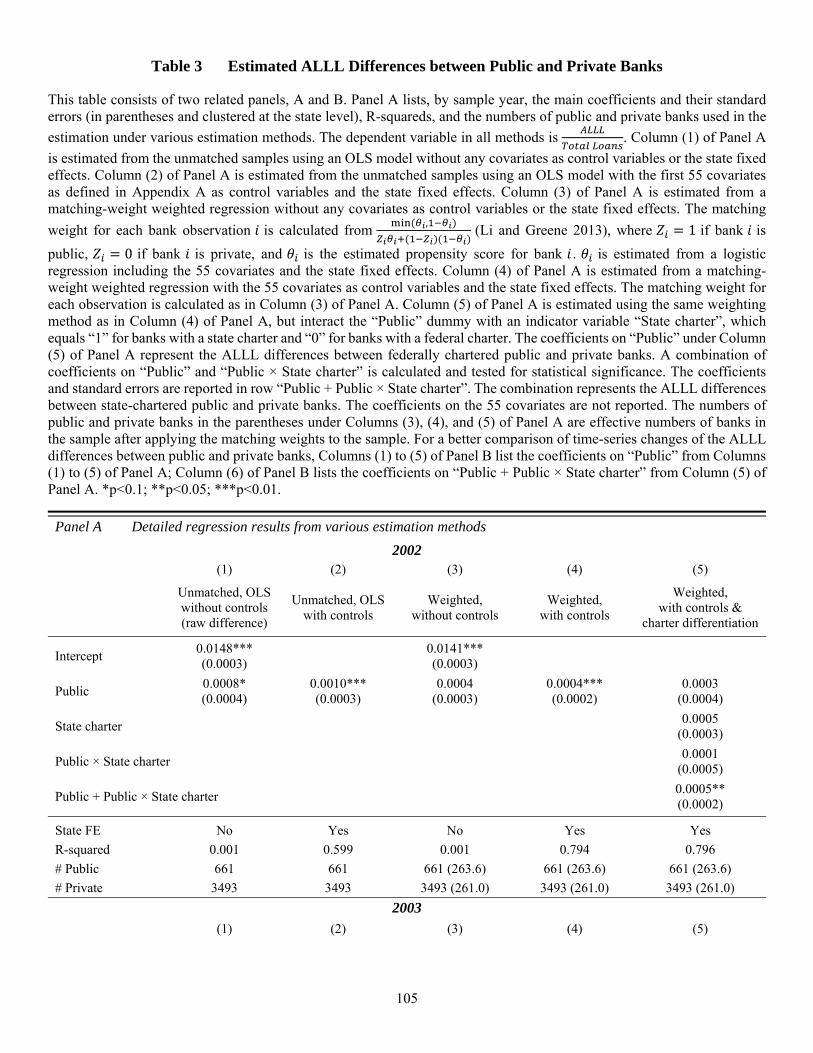
105
Table 3 Estimated ALLL Differences between Public and Private Banks
This table consists of two related panels, A and B. Panel A lists, by sample year, the main coefficients and their standard errors (in parentheses and clustered at the state level), R-squareds, and the numbers of public and private banks used in the
estimation under various estimation methods. The dependent variable in all methods is
. Column (1) of Panel A
is estimated from the unmatched samples using an OLS model without any covariates as control variables or the state fixed effects. Column (2) of Panel A is estimated from the unmatched samples using an OLS model with the first 55 covariates as defined in Appendix A as control variables and the state fixed effects. Column (3) of Panel A is estimated from a matching-weight weighted regression without any covariates as control variables or the state fixed effects. The matching
weight for each bank observation is calculated from ,
(Li and Greene 2013), where 1 if bank is
public, 0 if bank is private, and is the estimated propensity score for bank . is estimated from a logistic regression including the 55 covariates and the state fixed effects. Column (4) of Panel A is estimated from a matching-weight weighted regression with the 55 covariates as control variables and the state fixed effects. The matching weight for each observation is calculated as in Column (3) of Panel A. Column (5) of Panel A is estimated using the same weighting method as in Column (4) of Panel A, but interact the “Public” dummy with an indicator variable “State charter”, which equals “1” for banks with a state charter and “0” for banks with a federal charter. The coefficients on “Public” under Column (5) of Panel A represent the ALLL differences between federally chartered public and private banks. A combination of coefficients on “Public” and “Public × State charter” is calculated and tested for statistical significance. The coefficients and standard errors are reported in row “Public + Public × State charter”. The combination represents the ALLL differences between state-chartered public and private banks. The coefficients on the 55 covariates are not reported. The numbers of public and private banks in the parentheses under Columns (3), (4), and (5) of Panel A are effective numbers of banks in the sample after applying the matching weights to the sample. For a better comparison of time-series changes of the ALLL differences between public and private banks, Columns (1) to (5) of Panel B list the coefficients on “Public” from Columns (1) to (5) of Panel A; Column (6) of Panel B lists the coefficients on “Public + Public × State charter” from Column (5) of Panel A. *p<0.1; **p<0.05; ***p<0.01.
Panel A Detailed regression results from various estimation methods
2002
(1) (2) (3) (4) (5)
Unmatched, OLS without controls (raw difference)
Unmatched, OLS with controls
Weighted, without controls
Weighted, with controls
Weighted, with controls &
charter differentiation
Intercept 0.0148*** (0.0003)
0.0141*** (0.0003)
Public 0.0008* (0.0004)
0.0010*** (0.0003)
0.0004 (0.0003)
0.0004*** (0.0002)
0.0003 (0.0004)
State charter 0.0005
(0.0003)
Public × State charter 0.0001
(0.0005)
Public + Public × State charter 0.0005** (0.0002)
State FE No Yes No Yes Yes
R-squared 0.001 0.599 0.001 0.794 0.796
# Public 661 661 661 (263.6) 661 (263.6) 661 (263.6)
# Private 3493 3493 3493 (261.0) 3493 (261.0) 3493 (261.0)
2003 (1) (2) (3) (4) (5)
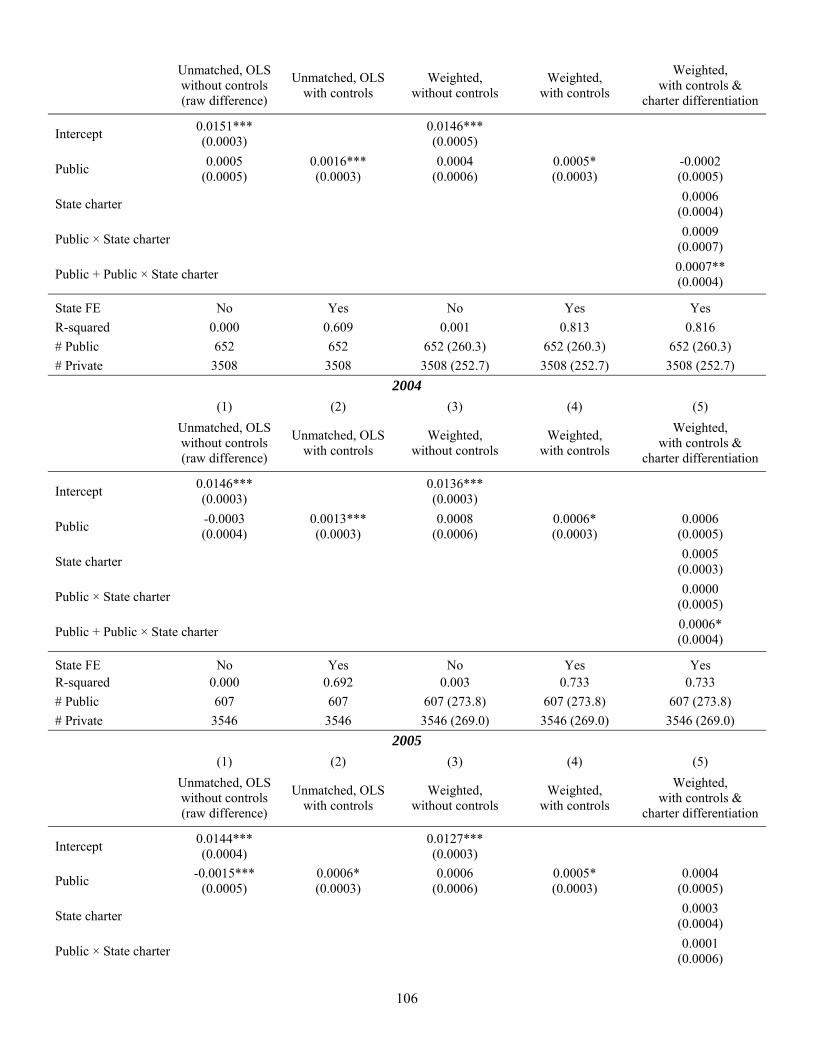
106
Unmatched, OLS without controls (raw difference)
Unmatched, OLS with controls
Weighted, without controls
Weighted, with controls
Weighted, with controls &
charter differentiation
Intercept 0.0151*** (0.0003)
0.0146*** (0.0005)
Public 0.0005
(0.0005) 0.0016*** (0.0003)
0.0004 (0.0006)
0.0005* (0.0003)
-0.0002 (0.0005)
State charter 0.0006
(0.0004)
Public × State charter 0.0009
(0.0007)
Public + Public × State charter 0.0007** (0.0004)
State FE No Yes No Yes Yes
R-squared 0.000 0.609 0.001 0.813 0.816
# Public 652 652 652 (260.3) 652 (260.3) 652 (260.3)
# Private 3508 3508 3508 (252.7) 3508 (252.7) 3508 (252.7)
2004
(1) (2) (3) (4) (5)
Unmatched, OLS without controls (raw difference)
Unmatched, OLS with controls
Weighted, without controls
Weighted, with controls
Weighted, with controls &
charter differentiation
Intercept 0.0146*** (0.0003)
0.0136*** (0.0003)
Public -0.0003 (0.0004)
0.0013*** (0.0003)
0.0008 (0.0006)
0.0006* (0.0003)
0.0006 (0.0005)
State charter 0.0005
(0.0003)
Public × State charter 0.0000
(0.0005)
Public + Public × State charter 0.0006* (0.0004)
State FE No Yes No Yes Yes R-squared 0.000 0.692 0.003 0.733 0.733
# Public 607 607 607 (273.8) 607 (273.8) 607 (273.8)
# Private 3546 3546 3546 (269.0) 3546 (269.0) 3546 (269.0)
2005
(1) (2) (3) (4) (5)
Unmatched, OLS without controls (raw difference)
Unmatched, OLS with controls
Weighted, without controls
Weighted, with controls
Weighted, with controls &
charter differentiation
Intercept 0.0144*** (0.0004)
0.0127*** (0.0003)
Public -0.0015***
(0.0005) 0.0006* (0.0003)
0.0006 (0.0006)
0.0005* (0.0003)
0.0004 (0.0005)
State charter 0.0003
(0.0004)
Public × State charter 0.0001
(0.0006)

107
Public + Public × State charter 0.0005
(0.0003)
State FE No Yes No Yes Yes
R-squared 0.007 0.618 0.004 0.816 0.817
# Public 467 467 467 (146.3) 467 (146.3) 467 (146.3)
# Private 2060 2060 2060 (141.4) 2060 (141.4) 2060 (141.4)
2006
(1) (2) (3) (4) (5)
Unmatched, OLS without controls (raw difference)
Unmatched, OLS with controls
Weighted, without controls
Weighted, with controls
Weighted, with controls &
charter differentiation
Intercept 0.0140*** (0.0004)
0.0121*** (0.0002)
Public -0.0020***
(0.0005) 0.0008** (0.0003)
0.0004 (0.0006)
0.0004 (0.0003)
0.0003 (0.0006)
State charter -0.0005 (0.0004)
Public × State charter 0.0001
(0.0005)
Public + Public × State charter 0.0004
(0.0003)
State FE No Yes No Yes Yes
R-squared 0.014 0.492 0.002 0.736 0.737
# Public 460 460 460 (147.0) 460 (147.0) 460 (147.0)
# Private 2032 2032 2032 (147.2) 2032 (147.2) 2032 (147.2)
2007
(1) (2) (3) (4) (5)
Unmatched, OLS without controls (raw difference)
Unmatched, OLS with controls
Weighted, without controls
Weighted, with controls
Weighted, with controls &
charter differentiation
Intercept 0.0137*** (0.0004)
0.0125*** (0.0005)
Public -0.0008* (0.0005)
0.0007** (0.0003)
0.0002 (0.0005)
0.0003 (0.0002)
0.0005 (0.0003)
State charter 0.0006** (0.0003)
Public × State charter -0.0003 (0.0003)
Public + Public × State charter 0.0002
(0.0002)
State FE No Yes No Yes Yes
R-squared 0.002 0.648 0.000 0.830 0.831
# Public 426 426 426 (149.9) 426 (149.9) 426 (149.9)
# Private 1949 1949 1949 (147.0) 1949 (147.0) 1949 (147.0)
2008
(1) (2) (3) (4) (5)
Unmatched, OLS without controls (raw difference)
Unmatched, OLS with controls
Weighted, without controls
Weighted, with controls
Weighted, with controls &
charter differentiation
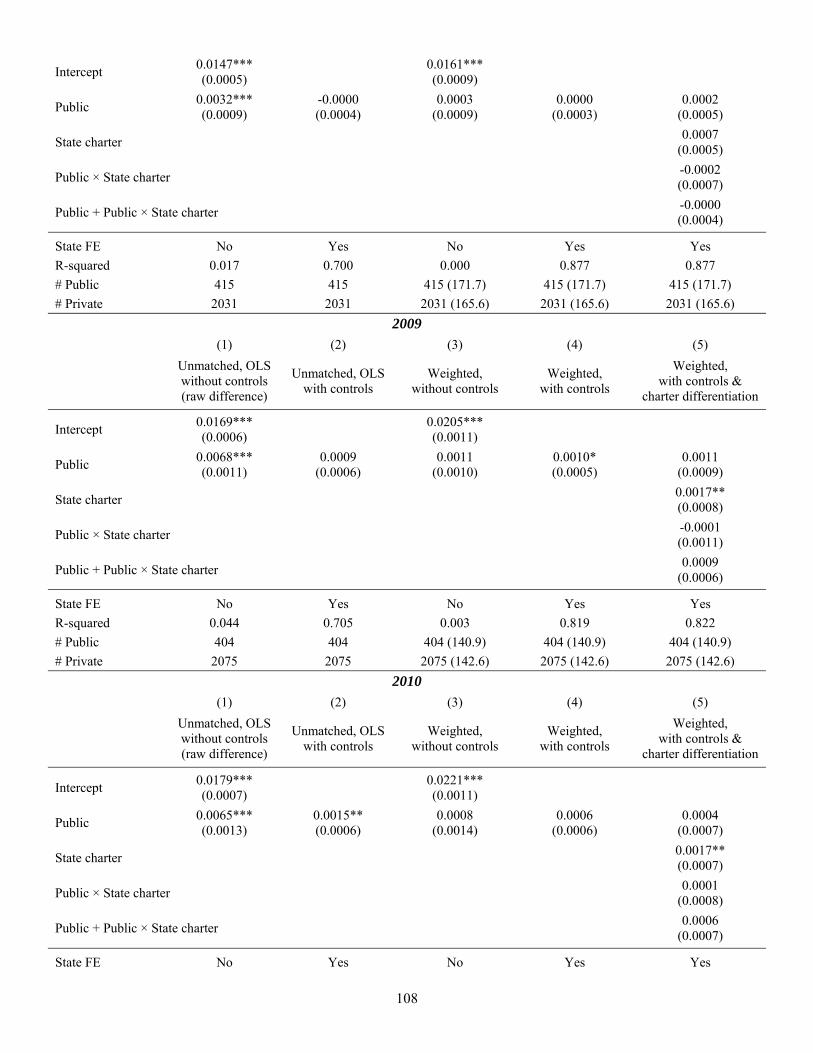
108
Intercept 0.0147*** (0.0005)
0.0161*** (0.0009)
Public 0.0032*** (0.0009)
-0.0000 (0.0004)
0.0003 (0.0009)
0.0000 (0.0003)
0.0002 (0.0005)
State charter 0.0007
(0.0005)
Public × State charter -0.0002 (0.0007)
Public + Public × State charter -0.0000 (0.0004)
State FE No Yes No Yes Yes
R-squared 0.017 0.700 0.000 0.877 0.877
# Public 415 415 415 (171.7) 415 (171.7) 415 (171.7)
# Private 2031 2031 2031 (165.6) 2031 (165.6) 2031 (165.6)
2009
(1) (2) (3) (4) (5)
Unmatched, OLS without controls (raw difference)
Unmatched, OLS with controls
Weighted, without controls
Weighted, with controls
Weighted, with controls &
charter differentiation
Intercept 0.0169*** (0.0006)
0.0205*** (0.0011)
Public 0.0068*** (0.0011)
0.0009 (0.0006)
0.0011 (0.0010)
0.0010* (0.0005)
0.0011 (0.0009)
State charter 0.0017** (0.0008)
Public × State charter -0.0001 (0.0011)
Public + Public × State charter 0.0009
(0.0006)
State FE No Yes No Yes Yes
R-squared 0.044 0.705 0.003 0.819 0.822
# Public 404 404 404 (140.9) 404 (140.9) 404 (140.9)
# Private 2075 2075 2075 (142.6) 2075 (142.6) 2075 (142.6)
2010
(1) (2) (3) (4) (5)
Unmatched, OLS without controls (raw difference)
Unmatched, OLS with controls
Weighted, without controls
Weighted, with controls
Weighted, with controls &
charter differentiation
Intercept 0.0179*** (0.0007)
0.0221*** (0.0011)
Public 0.0065*** (0.0013)
0.0015** (0.0006)
0.0008 (0.0014)
0.0006 (0.0006)
0.0004 (0.0007)
State charter 0.0017** (0.0007)
Public × State charter 0.0001
(0.0008)
Public + Public × State charter 0.0006
(0.0007)
State FE No Yes No Yes Yes

109
R-squared 0.043 0.712 0.001 0.824 0.826
# Public 366 366 366 (146.5) 366 (146.5) 366 (146.5)
# Private 2070 2070 2070 (145.5) 2070 (145.5) 2070 (145.5)
2011
(1) (2) (3) (4) (5)
Unmatched, OLS without controls (raw difference)
Unmatched, OLS with controls
Weighted, without controls
Weighted, with controls
Weighted, with controls &
charter differentiation
Intercept 0.0185*** (0.0006)
0.0209*** (0.0008)
Public 0.0028*** (0.0008)
0.0004 (0.0008)
0.0004 (0.0011)
0.0005 (0.0007)
0.0008 (0.0011)
State charter 0.0025** (0.0011)
Public × State charter -0.0003 (0.0013)
Public + Public × State charter 0.0006
(0.0008)
State FE No Yes No Yes Yes
R-squared 0.008 0.579 0.000 0.653 0.660
# Public 342 342 342 (133.8) 342 (133.8) 342 (133.8)
# Private 2080 2080 2080 (134.3) 2080 (134.3) 2080 (134.3)
2012
(1) (2) (3) (4) (5)
Unmatched, OLS without controls (raw difference)
Unmatched, OLS with controls
Weighted, without controls
Weighted, with controls
Weighted, with controls &
charter differentiation
Intercept 0.0176*** (0.0005)
0.0192*** (0.0010)
Public 0.0010
(0.0007) -0.0004 (0.0007)
-0.0000 (0.0016)
0.0001 (0.0005)
0.0010 (0.0011)
State charter 0.0019** (0.0007)
Public × State charter -0.0013 (0.0012)
Public + Public × State charter -0.0003 (0.0006)
State FE No Yes No Yes Yes
R-squared 0.001 0.523 0.000 0.748 0.751
# Public 316 316 316 (116.1) 316 (116.1) 316 (116.1)
# Private 2016 2016 2016 (114.7) 2016 (114.7) 2016 (114.7)
2013
(1) (2) (3) (4) (5)
Unmatched, OLS without controls (raw difference)
Unmatched, OLS with controls
Weighted, without controls
Weighted, with controls
Weighted, with controls &
charter differentiation
Intercept 0.0165*** (0.0004)
0.0168*** (0.0006)
Public -0.0012** -0.0012* -0.0017* -0.0016*** 0.0001
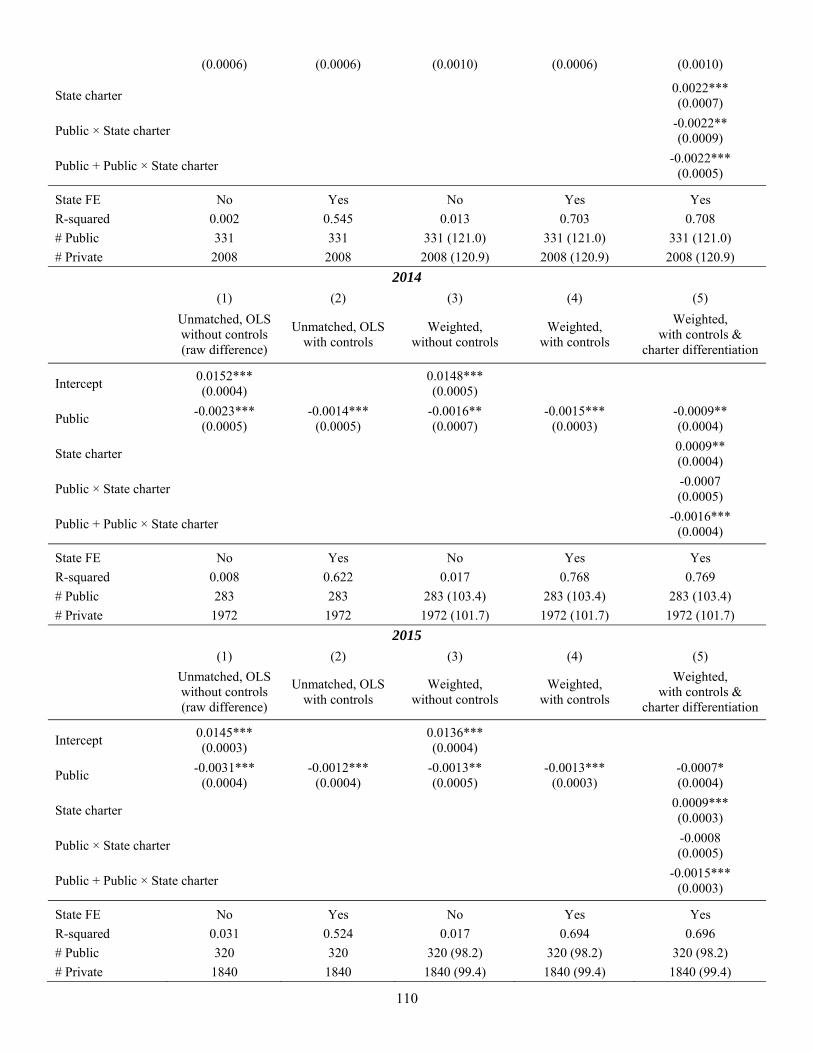
110
(0.0006) (0.0006) (0.0010) (0.0006) (0.0010)
State charter 0.0022*** (0.0007)
Public × State charter -0.0022** (0.0009)
Public + Public × State charter -0.0022***
(0.0005)
State FE No Yes No Yes Yes
R-squared 0.002 0.545 0.013 0.703 0.708
# Public 331 331 331 (121.0) 331 (121.0) 331 (121.0)
# Private 2008 2008 2008 (120.9) 2008 (120.9) 2008 (120.9)
2014
(1) (2) (3) (4) (5)
Unmatched, OLS without controls (raw difference)
Unmatched, OLS with controls
Weighted, without controls
Weighted, with controls
Weighted, with controls &
charter differentiation
Intercept 0.0152*** (0.0004)
0.0148*** (0.0005)
Public -0.0023***
(0.0005) -0.0014***
(0.0005) -0.0016** (0.0007)
-0.0015*** (0.0003)
-0.0009** (0.0004)
State charter 0.0009** (0.0004)
Public × State charter -0.0007 (0.0005)
Public + Public × State charter -0.0016***
(0.0004)
State FE No Yes No Yes Yes
R-squared 0.008 0.622 0.017 0.768 0.769
# Public 283 283 283 (103.4) 283 (103.4) 283 (103.4)
# Private 1972 1972 1972 (101.7) 1972 (101.7) 1972 (101.7)
2015
(1) (2) (3) (4) (5)
Unmatched, OLS without controls (raw difference)
Unmatched, OLS with controls
Weighted, without controls
Weighted, with controls
Weighted, with controls &
charter differentiation
Intercept 0.0145*** (0.0003)
0.0136*** (0.0004)
Public -0.0031***
(0.0004) -0.0012***
(0.0004) -0.0013** (0.0005)
-0.0013*** (0.0003)
-0.0007* (0.0004)
State charter 0.0009*** (0.0003)
Public × State charter -0.0008 (0.0005)
Public + Public × State charter -0.0015***
(0.0003)
State FE No Yes No Yes Yes
R-squared 0.031 0.524 0.017 0.694 0.696
# Public 320 320 320 (98.2) 320 (98.2) 320 (98.2)
# Private 1840 1840 1840 (99.4) 1840 (99.4) 1840 (99.4)
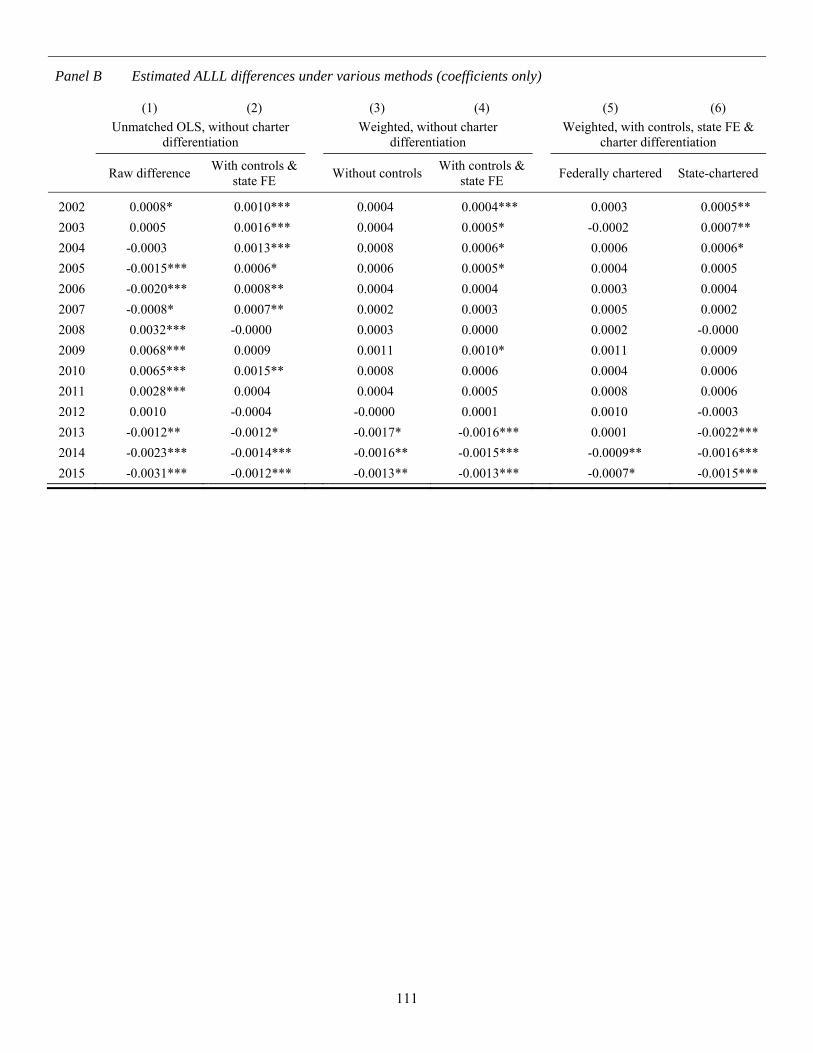
111
Panel B Estimated ALLL differences under various methods (coefficients only)
(1) (2) (3) (4) (5) (6)
Unmatched OLS, without charter
differentiation
Weighted, without charter differentiation
Weighted, with controls, state FE & charter differentiation
Raw difference With controls &
state FE
Without controls
With controls & state FE
Federally chartered State-chartered
2002 0.0008* 0.0010*** 0.0004 0.0004*** 0.0003 0.0005**
2003 0.0005 0.0016*** 0.0004 0.0005* -0.0002 0.0007**
2004 -0.0003 0.0013*** 0.0008 0.0006* 0.0006 0.0006*
2005 -0.0015*** 0.0006* 0.0006 0.0005* 0.0004 0.0005
2006 -0.0020*** 0.0008** 0.0004 0.0004 0.0003 0.0004
2007 -0.0008* 0.0007** 0.0002 0.0003 0.0005 0.0002
2008 0.0032*** -0.0000 0.0003 0.0000 0.0002 -0.0000
2009 0.0068*** 0.0009 0.0011 0.0010* 0.0011 0.0009
2010 0.0065*** 0.0015** 0.0008 0.0006 0.0004 0.0006
2011 0.0028*** 0.0004 0.0004 0.0005 0.0008 0.0006
2012 0.0010 -0.0004 -0.0000 0.0001 0.0010 -0.0003
2013 -0.0012** -0.0012* -0.0017* -0.0016*** 0.0001 -0.0022***
2014 -0.0023*** -0.0014*** -0.0016** -0.0015*** -0.0009** -0.0016***
2015 -0.0031*** -0.0012*** -0.0013** -0.0013*** -0.0007* -0.0015***
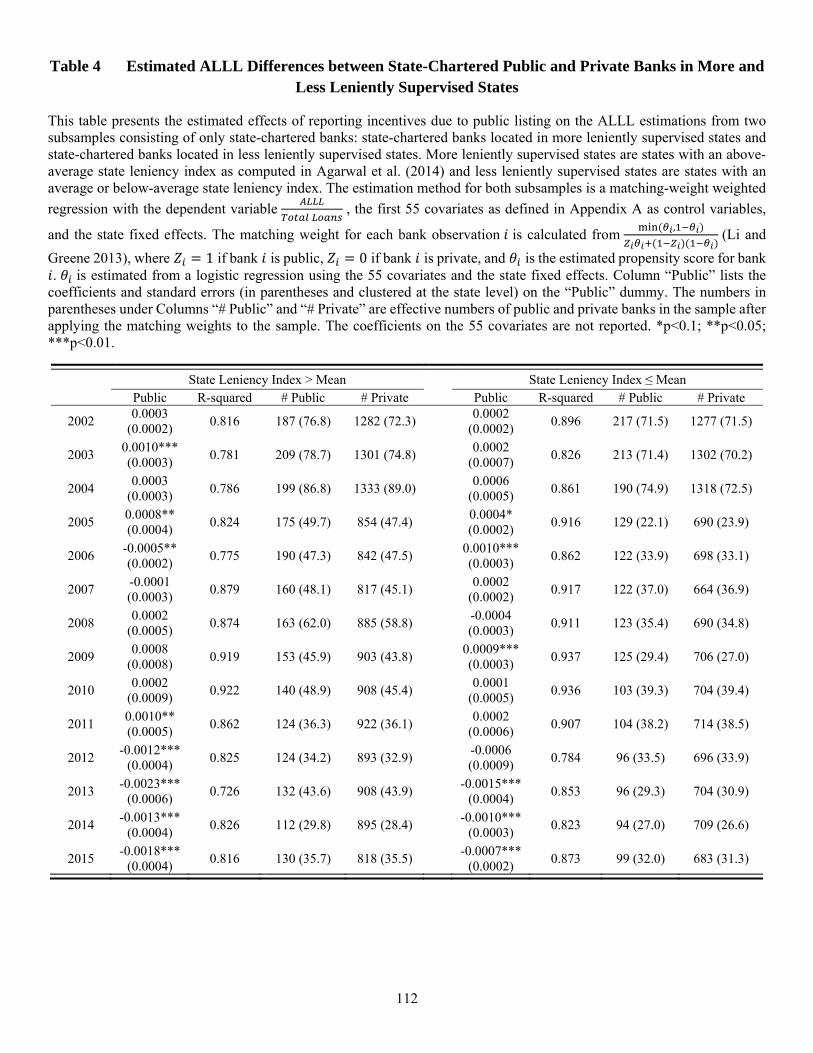
112
Table 4 Estimated ALLL Differences between State-Chartered Public and Private Banks in More and Less Leniently Supervised States
This table presents the estimated effects of reporting incentives due to public listing on the ALLL estimations from two subsamples consisting of only state-chartered banks: state-chartered banks located in more leniently supervised states and state-chartered banks located in less leniently supervised states. More leniently supervised states are states with an above-average state leniency index as computed in Agarwal et al. (2014) and less leniently supervised states are states with an average or below-average state leniency index. The estimation method for both subsamples is a matching-weight weighted
regression with the dependent variable
, the first 55 covariates as defined in Appendix A as control variables,
and the state fixed effects. The matching weight for each bank observation is calculated from ,
(Li and
Greene 2013), where 1 if bank is public, 0 if bank is private, and is the estimated propensity score for bank . is estimated from a logistic regression using the 55 covariates and the state fixed effects. Column “Public” lists the
coefficients and standard errors (in parentheses and clustered at the state level) on the “Public” dummy. The numbers in parentheses under Columns “# Public” and “# Private” are effective numbers of public and private banks in the sample after applying the matching weights to the sample. The coefficients on the 55 covariates are not reported. *p<0.1; **p<0.05; ***p<0.01.
State Leniency Index > Mean State Leniency Index ≤ Mean Public R-squared # Public # Private Public R-squared # Public # Private
2002 0.0003
(0.0002) 0.816 187 (76.8) 1282 (72.3)
0.0002 (0.0002)
0.896 217 (71.5) 1277 (71.5)
2003 0.0010*** (0.0003)
0.781 209 (78.7) 1301 (74.8) 0.0002
(0.0007) 0.826 213 (71.4) 1302 (70.2)
2004 0.0003
(0.0003) 0.786 199 (86.8) 1333 (89.0)
0.0006 (0.0005)
0.861 190 (74.9) 1318 (72.5)
2005 0.0008** (0.0004)
0.824 175 (49.7) 854 (47.4) 0.0004*
(0.0002) 0.916 129 (22.1) 690 (23.9)
2006 -0.0005** (0.0002)
0.775 190 (47.3) 842 (47.5) 0.0010***
(0.0003) 0.862 122 (33.9) 698 (33.1)
2007 -0.0001 (0.0003)
0.879 160 (48.1) 817 (45.1) 0.0002
(0.0002) 0.917 122 (37.0) 664 (36.9)
2008 0.0002
(0.0005) 0.874 163 (62.0) 885 (58.8)
-0.0004 (0.0003)
0.911 123 (35.4) 690 (34.8)
2009 0.0008
(0.0008) 0.919 153 (45.9) 903 (43.8)
0.0009*** (0.0003)
0.937 125 (29.4) 706 (27.0)
2010 0.0002
(0.0009) 0.922 140 (48.9) 908 (45.4)
0.0001 (0.0005)
0.936 103 (39.3) 704 (39.4)
2011 0.0010** (0.0005)
0.862 124 (36.3) 922 (36.1) 0.0002
(0.0006) 0.907 104 (38.2) 714 (38.5)
2012 -0.0012***
(0.0004) 0.825 124 (34.2) 893 (32.9)
-0.0006 (0.0009)
0.784 96 (33.5) 696 (33.9)
2013 -0.0023***
(0.0006) 0.726 132 (43.6) 908 (43.9)
-0.0015*** (0.0004)
0.853 96 (29.3) 704 (30.9)
2014 -0.0013***
(0.0004) 0.826 112 (29.8) 895 (28.4)
-0.0010*** (0.0003)
0.823 94 (27.0) 709 (26.6)
2015 -0.0018***
(0.0004) 0.816 130 (35.7) 818 (35.5)
-0.0007*** (0.0002)
0.873 99 (32.0) 683 (31.3)

113
Table 5 Tests for the Existence of Stock Market Discipline
This table presents the estimated effects of reporting incentives due to public listing on the ALLL estimations under three sample splits. Panel A splits the sample of public banks by the average percentage of institutional ownership. Panel B splits the sample of public banks by the average institutional ownership Herfindahl–Hirschman Index (HHI). Panel C splits the sample of public banks by the average number of institutional block owners. All private banks are retained as the comparison group for each split sample. The estimation method for all split samples is a matching-weight weighted regression with the
dependent variable
, the first 55 covariates as defined in Appendix A as control variables, and the state fixed
effects. The matching weight for each bank observation is calculated from ,
(Li and Greene 2013), where
1 if bank is public, 0 if bank is private, and is the estimated propensity score for bank . is estimated from a logistic regression including the 55 covariates and the state fixed effects. Column “Public” lists the coefficients and standard errors (in parentheses and clustered at the state level) on the “Public” dummy. The numbers in parentheses under Columns “# Public” and “# Private” are effective numbers of public and private banks in the sample after applying the matching weights to the sample. The coefficients on the 55 covariates are not reported. *p<0.1; **p<0.05; ***p<0.01.
Panel A Split of Public Banks by Percentage of Institutional Ownership
Percentage of Institutional Ownership > Mean Percentage of Institutional Ownership ≤ Mean Public R-squared # Public # Private Public R-squared # Public # Private
2002 0.0007** (0.0003)
0.923 225 (42.0) 3493 (43.0) 0.0003*
(0.0002) 0.759 320 (184.8) 3493 (186.2)
2003 0.0007
(0.0006) 0.879 224 (54.2) 3508 (53.5)
0.0001 (0.0002)
0.775 314 (181.1) 3508 (179.5)
2004 0.0015*** (0.0004)
0.874 204 (64.9) 3546 (67.7) -0.0001
(0.0002) 0.804 302 (192.3) 3546 (191.0)
2005 0.0002
(0.0003) 0.892 169 (35.0) 2060 (36.5)
0.0002 (0.0002)
0.776 225 (100.2) 2060 (97.4)
2006 0.0000
(0.0004) 0.782 174 (41.0) 2032 (41.4)
0.0003 (0.0002)
0.821 211 (99.6) 2032 (100.6)
2007 0.0007
(0.0005) 0.864 155 (34.0) 1949 (35.5)
0.0001 (0.0002)
0.851 207 (102.7) 1949 (101.1)
2008 -0.0005 (0.0004)
0.937 141 (27.7) 2031 (27.7) -0.0001
(0.0003) 0.812 212 (125.7) 2031 (124.1)
2009 0.0015
(0.0009) 0.922 145 (30.0) 2075 (28.8)
-0.0000 (0.0003)
0.830 194 (93.4) 2075 (93.6)
2010 0.0004
(0.0006) 0.933 156 (27.4) 2070 (27.1)
-0.0002 (0.0006)
0.858 180 (97.5) 2070 (97.8)
2011 -0.0003 (0.0009)
0.793 160 (31.3) 2080 (32.1) 0.0000
(0.0007) 0.819 162 (90.4) 2080 (90.4)
2012 -0.0020***
(0.0007) 0.836 146 (22.0) 2016 (20.7)
-0.0007 (0.0006)
0.800 151 (74.8) 2016 (73.0)
2013 -0.0024***
(0.0008) 0.901 153 (14.6) 2008 (15.8)
-0.0015*** (0.0003)
0.708 163 (85.3) 2008 (86.8)
2014 -0.0007***
(0.0004) 0.920 143 (17.0) 1972 (15.2)
-0.0015*** (0.0003)
0.786 134 (64.6) 1972 (62.8)
2015 -0.0014***
(0.0005) 0.784 156 (17.9) 1840 (17.4)
-0.0008*** (0.0003)
0.754 161 (72.4) 1840 (74.9)
Panel B Split of Public Banks by Institutional Ownership HHI
Institutional Ownership HHI > Mean Institutional Ownership HHI ≤ Mean Public R-squared # Public # Private Public R-squared # Public # Private
2002 0.0001
(0.0002) 0.790 168 (118.8) 3493 (119.6)
0.0002 (0.0002)
0.804 377 (129.3) 3493 (124.7)

114
2003 0.0004
(0.0003) 0.824 158 (105.6) 3508 (105.6)
0.0004 (0.0003)
0.754 380 (145.6) 3508 (140.8)
2004 0.0001
(0.0003) 0.836 157 (110.9) 3546 (113.2)
0.0007 (0.0004)
0.738 349 (153.9) 3546 (150.1)
2005 0.0002
(0.0002) 0.786 128 (66.1) 2060 (65.8)
0.0007* (0.0003)
0.843 266 (78.0) 2060 (79.9)
2006 0.0006*** (0.0002)
0.854 122 (65.6) 2032 (64.3) -0.0001
(0.0003) 0.685 263 (74.8) 2032 (75.8)
2007 -0.0000 (0.0003)
0.893 119 (67.3) 1949 (68.2) 0.0005
(0.0003) 0.830 243 (71.9) 1949 (71.4)
2008 0.0002
(0.0003) 0.882 120 (75.6) 2031 (73.4)
-0.0000 (0.0004)
0.830 233 (88.2) 2031 (89.1)
2009 0.0007** (0.0003)
0.942 114 (57.2) 2075 (57.9) 0.0012**
(0.0006) 0.843 225 (70.2) 2075 (69.7)
2010 0.0003
(0.0007) 0.884 114 (71.0) 2070 (72.0)
0.0005 (0.0007)
0.864 223 (69.8) 2070 (71.9)
2011 -0.0001 (0.0006)
0.843 113 (70.6) 2080 (67.8) -0.0005
(0.0007) 0.777 209 (56.6) 2080 (58.8)
2012 -0.0007 (0.0006)
0.837 92 (55.9) 2016 (54.5) 0.0006
(0.0007) 0.780 205 (50.3) 2016 (49.3)
2013 -0.0013***
(0.0003) 0.744 102 (59.2) 2008 (60.8)
-0.0019*** (0.0006)
0.780 214 (49.9) 2008 (50.3)
2014 -0.0015***
(0.0003) 0.808 88 (58.5) 1972 (55.2)
-0.0012*** (0.0003)
0.894 189 (34.0) 1972 (34.4)
2015 -0.0009***
(0.0003) 0.796 92 (47.4) 1840 (49.4)
-0.0013*** (0.0003)
0.755 225 (50.7) 1840 (50.6)
Panel C Split of Public Banks by Number of Institutional Block Owners
Number of Institutional Block Owners > Mean Number of Institutional Block Owners ≤ Mean Public R-squared # Public # Private Public R-squared # Public # Private
2002 -0.0000 (0.0003)
0.839 180 (79.4) 3493 (80.8) 0.0005**
(0.0002) 0.829 365 (165.8) 3493 (167.5)
2003 0.0004
(0.0004) 0.743 240 (99.5) 3508 (101.5)
0.0002 (0.0003)
0.794 298 (160.2) 3508 (154.0)
2004 0.0009* (0.0005)
0.847 235 (113.2) 3546 (116.5) 0.0000
(0.0002) 0.727 271 (157.6) 3546 (155.1)
2005 -0.0001 (0.0002)
0.897 199 (66.6) 2060 (65.9) 0.0007**
(0.0003) 0.795 195 (84.0) 2060 (81.7)
2006 0.0003
(0.0003) 0.802 195 (63.4) 2032 (62.4)
0.0000 (0.0001)
0.700 190 (83.9) 2032 (84.0)
2007 0.0005
(0.0003) 0.903 98 (39.4) 1949 (38.1)
0.0002 (0.0002)
0.865 264 (107.9) 1949 (107.4)
2008 0.0000
(0.0004) 0.915 105 (34.2) 2031 (34.5)
-0.0001 (0.0003)
0.825 248 (128.4) 2031 (126.7)
2009 0.0004
(0.0008) 0.930 118 (26.7) 2075 (24.2)
0.0010** (0.0004)
0.881 221 (98.8) 2075 (100.3)
2010 -0.0012 (0.0007)
0.907 136 (40.4) 2070 (40.5) 0.0005
(0.0006) 0.865 201 (98.6) 2070 (96.5)
2011 -0.0000 (0.0007)
0.772 147 (55.7) 2080 (55.9) 0.0002
(0.0007) 0.811 175 (77.6) 2080 (76.3)
2012 -0.0007 (0.0006)
0.766 166 (49.6) 2016 (47.8) -0.0005
(0.0006) 0.818 131 (63.4) 2016 (62.3)
2013 -0.0014** (0.0006)
0.817 152 (43.8) 2008 (42.6) -0.0015***
(0.0004) 0.756 164 (78.7) 2008 (78.8)
2014 -0.0012*** 0.822 145 (33.9) 1972 (32.3) -0.0011*** 0.844 132 (65.9) 1972 (65.4)
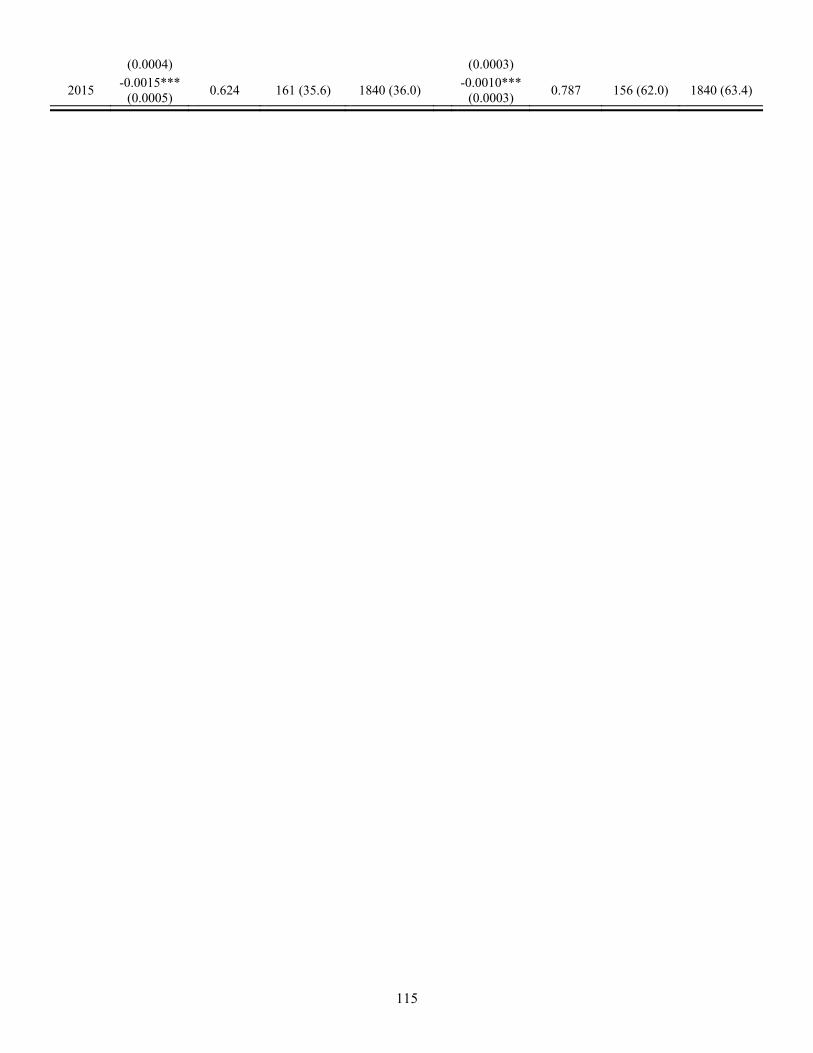
115
(0.0004) (0.0003)
2015 -0.0015***
(0.0005) 0.624 161 (35.6) 1840 (36.0)
-0.0010*** (0.0003)
0.787 156 (62.0) 1840 (63.4)
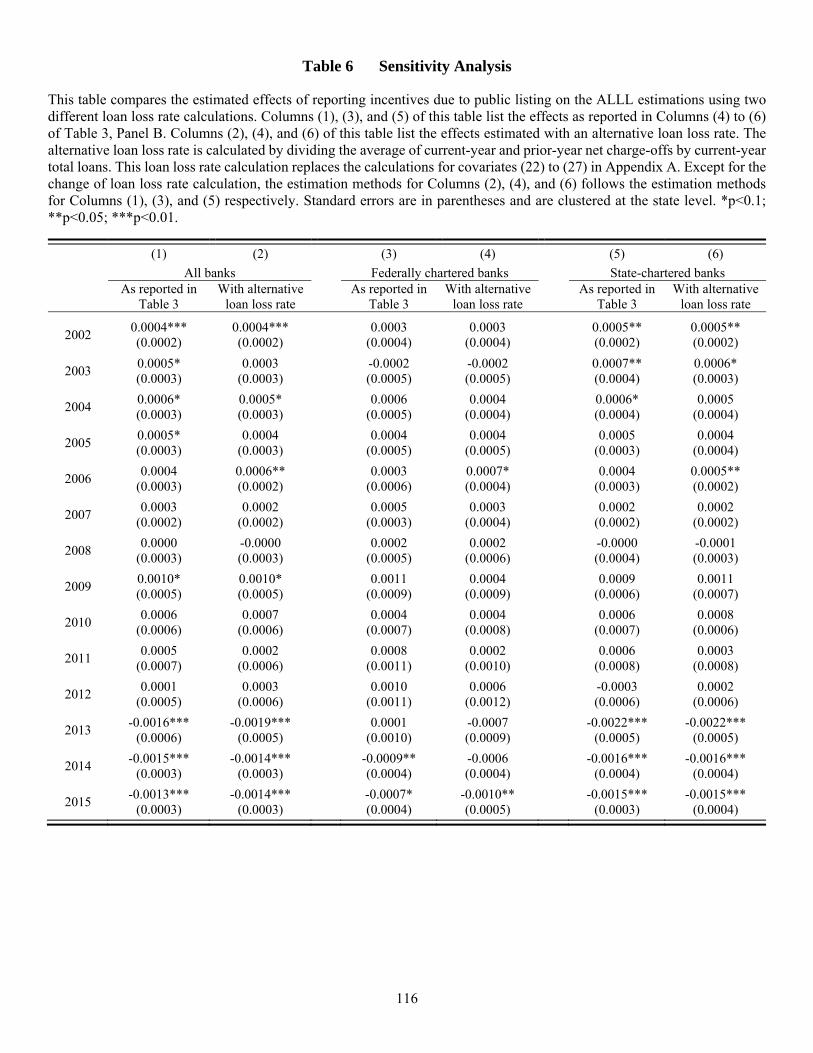
116
Table 6 Sensitivity Analysis
This table compares the estimated effects of reporting incentives due to public listing on the ALLL estimations using two different loan loss rate calculations. Columns (1), (3), and (5) of this table list the effects as reported in Columns (4) to (6) of Table 3, Panel B. Columns (2), (4), and (6) of this table list the effects estimated with an alternative loan loss rate. The alternative loan loss rate is calculated by dividing the average of current-year and prior-year net charge-offs by current-year total loans. This loan loss rate calculation replaces the calculations for covariates (22) to (27) in Appendix A. Except for the change of loan loss rate calculation, the estimation methods for Columns (2), (4), and (6) follows the estimation methods for Columns (1), (3), and (5) respectively. Standard errors are in parentheses and are clustered at the state level. *p<0.1; **p<0.05; ***p<0.01.
(1) (2) (3) (4) (5) (6) All banks Federally chartered banks State-chartered banks
As reported in
Table 3 With alternative
loan loss rate As reported in
Table 3 With alternative
loan loss rate As reported in
Table 3 With alternative
loan loss rate
2002 0.0004*** (0.0002)
0.0004*** (0.0002)
0.0003
(0.0004) 0.0003
(0.0004)
0.0005** (0.0002)
0.0005** (0.0002)
2003 0.0005* (0.0003)
0.0003 (0.0003)
-0.0002 (0.0005)
-0.0002 (0.0005)
0.0007** (0.0004)
0.0006* (0.0003)
2004 0.0006* (0.0003)
0.0005* (0.0003)
0.0006
(0.0005) 0.0004
(0.0004)
0.0006* (0.0004)
0.0005 (0.0004)
2005 0.0005* (0.0003)
0.0004 (0.0003)
0.0004
(0.0005) 0.0004
(0.0005)
0.0005 (0.0003)
0.0004 (0.0004)
2006 0.0004
(0.0003) 0.0006** (0.0002)
0.0003
(0.0006) 0.0007* (0.0004)
0.0004
(0.0003) 0.0005** (0.0002)
2007 0.0003
(0.0002) 0.0002
(0.0002)
0.0005 (0.0003)
0.0003 (0.0004)
0.0002
(0.0002) 0.0002
(0.0002)
2008 0.0000
(0.0003) -0.0000 (0.0003)
0.0002
(0.0005) 0.0002
(0.0006)
-0.0000 (0.0004)
-0.0001 (0.0003)
2009 0.0010* (0.0005)
0.0010* (0.0005)
0.0011
(0.0009) 0.0004
(0.0009)
0.0009 (0.0006)
0.0011 (0.0007)
2010 0.0006
(0.0006) 0.0007
(0.0006)
0.0004 (0.0007)
0.0004 (0.0008)
0.0006
(0.0007) 0.0008
(0.0006)
2011 0.0005
(0.0007) 0.0002
(0.0006)
0.0008 (0.0011)
0.0002 (0.0010)
0.0006
(0.0008) 0.0003
(0.0008)
2012 0.0001
(0.0005) 0.0003
(0.0006)
0.0010 (0.0011)
0.0006 (0.0012)
-0.0003 (0.0006)
0.0002 (0.0006)
2013 -0.0016***
(0.0006) -0.0019***
(0.0005)
0.0001 (0.0010)
-0.0007 (0.0009)
-0.0022***
(0.0005) -0.0022***
(0.0005)
2014 -0.0015***
(0.0003) -0.0014***
(0.0003)
-0.0009** (0.0004)
-0.0006 (0.0004)
-0.0016***
(0.0004) -0.0016***
(0.0004)
2015 -0.0013***
(0.0003) -0.0014***
(0.0003)
-0.0007* (0.0004)
-0.0010** (0.0005)
-0.0015***
(0.0003) -0.0015***
(0.0004)

117
Table 7 Impact of ALLL Underestimations in 2013, 2014 and 2015 on Performance Measures of State-Chartered Public Banks
This table presents the dollar amounts of the ALLL underestimations by state-chartered public banks between 2013 and 2015 and the impact of the underestimations on the banks’ performance measures. Column (1) lists the per-dollar-of-total-loan ALLL underestimations reported in Column (6) of Table 3, Panel B. Column (2) lists the average dollar amount of total loans reported by state-chartered public banks as of December 31 of each sample year. Column (3) converts the per-dollar-of-total-loan ALLL underestimations to dollar amounts. Columns (4) to (7) list the average ALLL, income before taxes and extraordinary items, equity capital, and total risk-weighted assets reported by state-chartered public banks as of December 31 of each sample year respectively. Columns (8) to (11) calculate the percentage of dollar-amount ALLL underestimations to the reported ALLL, income before taxes and extraordinary items, equity capital, and total risk-weighted assets respectively. All dollar amounts are in thousands.
(1) (2) (3) (4) (5) (6) (7) (8) (9) (10) (11)
As reported ALLL underestimation as a % of reported
ALLL underestimation (scaled by total
loans) Total loans
ALLL underestimation (dollar amount)
ALLL
Income before taxes
and extraordinary
items Equity capital
Total risk-weighted
assets
ALLL
Income before taxes
and extraordinary
items Equity capital
Total risk-
weighted assets
2013 -0.0022 4,725,987.10 10,397.17 72,400.82 122,482.07 881,567.19 5,824,877.20 14.4% 8.5% 1.2% 0.2%
2014 -0.0016 5,220,139.60 8,352.22 70,289.27 122,074.84 919,869.67 6,059,285.30 11.9% 6.8% 0.9% 0.1%
2015 -0.0015 5,893,455.60 8,840.18 68,001.22 153,240.54 1,162,645.04 7,683,280.20 13.0% 5.8% 0.8% 0.1%