supervisor declaration “i hereby declare that i have read ...eprints.utem.edu.my/16339/1/finite...
TRANSCRIPT

SUPERVISOR DECLARATION
“I hereby declare that I have read this thesis and in my opinion this report is
sufficient in terms of scope and quality for the award of the degree of Bachelor of
Mechanical Engineering (Structure and Materials)”
Signature :
Supervisor : DR. MOHD BASRI BIN ALI
Date : JUNE 2015
FINITE ELEMENT ANALYSIS OF STRAIN SIGNAL FROM CHARPY
IMPACT
NABIHA BINTI PATHIL
This report submitted
in partial fulfilment of the requirements for
Degree of Bachelor in Mechanical Engineering (Structure and Materials)
Faculty of Mechanical Engineering
Universiti Teknikal Malaysia Melaka
JUNE 2015
ii
DECLARATION
“I hereby declare that the work in this thesis is my own except for summaries and
quotations which have been duly acknowledged.”
Signature :
Author : NABIHA BINTI PATHIL
Date : JUNE 2015

iii
Special for
Abah and Emak
iv
ACKNOWLEDGEMENT
Bismillahhi-rahmani-rahim…
All praises and thanks to Allah S.W.T for giving me the strength and
guidance to complete this thesis. Special appreciation goes to my supervisor, Dr
Mohd Basri Bin Ali, for his supervision and constant support. By his constructive
comments and suggestion throughout the software and thesis works contributes to the
success of this research.
Special thanks to my parents and family because of their support and
encouragement for me to further my education. I really appreciate what they have
done to me throughout my life. I also would like to express my highest gratitude to
the Universiti Teknikal Malaysia Melaka, particularly in the department of
Mechanical Engineering who has given the opportunity to undergo Projek Sarjana
Muda (PSM).
Last but not least, thanks to all of my friends especially from under the same
supervisors for their constant support and encouragement.

v
ABSTRACT
Charpy impact test are inexpensive impact testing that can be used in order to
measure the energy absorbed of the material. Previous studies have shown that the
energy absorbed measured using the instrumented Charpy impact test is not accurate.
So, new way to determine the strain energy with three different velocities by using
signal processing approach need to be studied. This project uses numerical analysis
based on Finite Element Analysis to simulate the Charpy impact test and the strain
from the striker is obtained from the modeling of Charpy impact test. The material
for the specimen is the same as standard ASTM E-23 specimen and three different
velocities is used which is 5.18 m/s, 3.35 m/s and 7.00 m/s. The strain signal from
these three different velocities will be compared with the experimental strain signal
Charpy impact test. For the analysis purpose, the signals obtained will be converted
using the Fast Fourier Time (FFT) to convert the time domain to the frequency
domain. After that Power Spectrum Density (PSD) method will be used to calculate
the strain energy based on the area under the graph. It was found that both the impact
strain signal and strain energy are influenced by the velocity of the impact. The PSD
values also influenced by the velocity of impact since the strain signal are varied
with different velocities.

vi
ABSTRAK
Ujian Charpy impak merupakan ujian impak yang murah dan digunakan
untuk mengukur tenaga yang diserap oleh sesuatu bahan. Kajian lepas menunjukkan
bahawa tenaga yang diserap yang diukur melalui instrumen ujian Charpy impak tidak
begitu tepat. Jadi, kaedah baru untuk menentukan tenaga terikan menggunakan tiga
halaju yang berbeza dengan mengunakan pendekatan pemprosesan isyarat perlu
dikaji. Projek ini mengunakan analisis berangka berdasarkan Analisis Unsur
Terhingga (FEA) untuk simulasi ujian Charpy impak dan juga terikan daripada
hentaman yang diperolehi dari permodelan ujian Charpy impak. Bahan yang akan
digunakan untuk spesimen adalah sama seperti piawaian yang ditetapkan iaitu
ASTM E-23 spesimen dan tiga halaju yang berbeza yang digunakan adalah 5.18 m/s,
3.35 m/s dan 7.00 m/s. Isyarat terikan yang diperolehi dari tiga halaju ini akan
dibandingkan dengan uji kaji isyarat terikan ujian Charpy impak. Untuk tujuan
analisis, isyarat ini akan ditukarkan dari domain masa dan domain frekuensi
mengunakan Fast Fourier Time (FFT). Selepas itu, kaedah Power Spectrum Density
(PSD) digunakan untuk mengira tenaga terikan berdasarkan luas kawasan di bawah
graf yang diperolehi. Hasil kajian mendapati bahawa kedua-dua isyarat tarikan dan
tenaga terikan dipengaruhi oleh impak halaju. Nilai PSD juga didapati berubah
apabila berlakunya perubahan impak terikan terhadap halaju yang berbeza.
vii
CONTENTS
CHAPTER TITLE PAGES
DECLARATION ii
DEDICATION iii
ACKNOWLEDGEMENT iv
ABSTRACT v
ABSTRAK vi
CONTENTS ix
LIST OF FIGURES xi
LIST OF TABLES xiv
APPENDICES xv
CHAPTER 1 INTRODUCTION 1
1.0 Background 1
viii
1.1 Problem Statement 2
1.2 Objective 5
1.4 Scopes 4
1.5 Advantages of This Project 4
CHAPTER 2 LITTERATURE REVIEWS 6
2.1 Impact test 6
2.2 Charpy Impact Test 7
2.3 Charpy Specimen 8
2.4 Striker 9
2.5 Velocity 10
2.6 Finite Element Analysis (FEA) 12
2.7 Impact signal 12
2.8 Energy Absorbed 14
2.9 Strain Energy 15
2.10 Signal Analysis 17
2.10.1 Introduction 17
2.10.2 Frequency Domain Analysis 17
2.10.3 Fast Fourier Transform (FFT) 18
2.10.4 Power Spectrum Density (PSD) 18

ix
CHAPTER 3 METHODOLOGY 20
3.0 Project Overview 20
3.1 Modeling of Charpy Specimen & Striker
of Charpy Impact
3.1.1 Modeling of Charpy Specimen 22
3.1.2 Modeling of Striker 24
3.2 Material Properties of Charpy Specimen
& Striker of Charpy Impact test. 25
3.3 Contact Boundary/Surface to the
Model
3.3.1 Contact Boundary/surface for
Specimen 27
3.3.2 Contact Boundary/surface for
Striker 28
3.4 Assembly 29
3.5 Boundary condition and Velocity 31
3.6 Mesh 35
3.7 Simulation of Charpy Impact 36
3.8 MATLAB 38
CHAPTER 4 RESULT AND DISCUSSION 40

x
4.0 Introduction 40
4.1 Simulation & Strain Energy 40
4.2 Strain Rate 42
4.3 FFT and PSD 45
4.4 Research Validation
4.4.1 Impact Strain signal Vs Velocity 49
4.4.2 Strain Energy & Experimental
Absorbed Energy 51
4.4.3 FEA Strain Energy Vs Absorbed
Energy 53
CHAPTER 4 CONCLUSION 56
REFERENCES 57
APPENDICES 62
xi
LIST OF FIGURES
NO TITLE PAGE
2.1 Charpy impact test. 6
2.2 The standard Charpy test specimen for v-notch and
u-notch respectively. 7
2.3 The 2mm and 8mm striker dimension. 9
2.4 Typical CRT record for aluminium alloy 6061-T651
Charpy V-notch test. 12
2.5 The highest strain energy distribution at the fillet edge
of the spoke. 15
2.6 Power Spectrum Density plot for steel and aluminium at
3.35 m/s velocity. 18
3.1 Flow chart of Finite element analysis on Charpy impact test 20
3.2 Step to create part. 21
3.3 Drawing and dimension of standard ASTM-E23 specimen. 22
3.4 Depth of extrusion of specimen. 22
3.5 Final Charpy v-notch specimen modeling using ABAQUS 23
3.6 2 mm radius striker for Charpy test. 23
xii
3.7 Depth of extrusion of 2mm striker. 24
3.8 Final modeling of 2 mm striker. 24
3.9 Step to create material properties of the specimen. 25
3.10 Step to create surcface for specimen. 27
3.11 Surface to be select for the specimen. 27
3.12 Step for create surface for striker. 28
3.13 Surface to be select for the striker. 29
3.14 Step to create instance. 30
3.15 Striker and specimen on the same window of ABAQUS. 30
3.16 Final assembly of the striker and specimen of Charpy impact. 31
3.17 Step to create boundary condition for the specimen. 31
3.18 Step to choose for boundary condition and its type. 32
3.19 Step for create the velocity for the striker. 33
3.20 Selected region for the velocities and value of the velocity. 33
3.21 Final boundary condition and velocities for striker & specimen. 34
3.22 Create mesh and seed part for the specimen. 35
3.23 Step to assign element type for the specimen. 35
3.24 Step to create a job for simulates Charpy impact. 36
3.25 Step to complete the job. 37
3.26 Analysis of Charpy impact test using ABAQUS. 37
3.27 MATLAB coding for FFT and PSD. 38
xiii
4.1 Simulation of Charpy impact test for 3.35 m/s. 40
4.2 Simulation of Charpy impact test for 5.18 m/s. 40
4.3 Simulation of Charpy impact test for 7.00 m/s. 40
4.4 Strain energy versus time for three different velocities. 41
4.5 Strain rate versus time for three different velocities. 42
4.6 The maximum strain value versus velocity. 43
4.7 The graph of (a) FFT and (b) PSD for 3.35 m/s. 44
4.8 The graph of (a) FFT and (b) PSD for 5.18 m/s. 45
4.9 The graph of (a) FFT and (b) PSD for 7.00 m/s. 46
4.10 Highest PSD strain energy distribution. 47
4.11 Comparison of impact duration from different velocities. 48
4.12 Distribution of strain energy. 52
4.13 Distribution of absorbed energy. 52
4.14 Strain energy versus absorbed energy. 53
xiv
LIST OF TABLES
NO TITLE PAGE
3.1 Properties of material Charpy specimen and
Charpy striker. 25
4.1 Comparison of Impact Duration from Different
velocities of Impact. 48
4.2 Strain Energy by using Power Spectrum Density (PSD). 49
4.3 The Experimental Result of Absorbed Energy. 51
xv
LIST OF APPENDICES
APPENDIX PAGE
APPENDIX A 63
APPENDIX B 64
APPENDIX C 65
APPENDIX D 66
APPENDIX E 67
1
CHAPTER 1
INTRODUCTION
1.0 BACKGROUND
The Charpy impact tests have been used to determine the material toughness.
This Charpy impact test are simpler testing that can be used to analyze the material
toughness. The Charpy impact test is inexpensive testing, easy to conduct and the
faster results are obtained based on this test. Holt M. J., 1990 state that the material
toughness are obtained by measured the energy absorbed during the Charpy impact
test. While Aberate,S., 2011 state that the difference between height of the pendulum
release and height of the pendulum strike the specimen will consider as the energy
absorbed by the specimen during the impact. The differences between the energy of
the striker at the impact and the energy remaining in the striker after striking the
specimen indicate the energy absorbed in the breaking specimen. (P.K. Mallick, 1993)
Even Charpy impact test have been used in the industries, during the impact
the energy absorbed are assumed as estimation and not same as the calculation energy
during the impact (Mahatan M. P., 2000). Based on the ISO 148, Charpy impact test
machine used velocity of the striker between 3 m/s to 6 m/s for impact test. (ISO 148-

2
2, 2006) differenct velocity of the impact will influenced the energy absorbed of the
specimen. (Chandavale R.G., 1995)
Then, many researchers focus more on using numerical analysis using Finite
Element Analysis (FEA) to study more about the Charpy impact test based on the
modeling of the Charpy impact test such as Chia-Lung Chang, 2009 study wheel
impact test using Finite Element Analysis, the simulation of wheel impact test has
been used to predict the impact failure of a wheel. Based on the numerical analysis
using FEA found that the strain energy is higher than total plastic work that can lead to
the failure of a wheel.
Then, the energy comes from the dial or encoder of Charpy impact test have
been compared with strain energy from different velocities and thickness by signal
processing approach via experimental and calculated using Power Spectrum Density
(PSD). The results found that the energy absorbed influenced by the velocities of the
striker and the thickness of the specimen (M B Ali, 2013)
For overall, this case study are using finite element analysis to obtained impact
strain signal from Charpy impact by using three different velocities. Abaqus software
are used to obtained impact strain signal from simulation of Charpy impact and using
Fast Fourier Transfer (FFT) and Power Spectrum Density (PSD) as signal processing
approach to convert the impact strain signal to frequency domain and get the strain
energy.
1.1 PROBLEM STATEMENT
Most common method for measuring the energy absorbed for the specimen is
by using Charpy impact test and Izod test. The specimen will absorbed the energy
until the specimen yields and the specimen will begin to undergo plastic deformation
at the notch during the impact test. This process will continuously undergo until no
more energy can be absorbed by the specimen. Energy absorbed during the Charpy
3
impact are measured by the difference between height of pendulum before the impact
and height of the pendulum after the Charpy impact test. (Abarate, 2011)
Charpy impact test give more advantages for to analyze material toughness
since the material specimen used during the impact test are small, easy to conduct and
also inexpensive way to determine the material toughness. But, Charpy impact has
some disadvantages even these tests are widely used to determine the material
toughness in the industries. The energy absorbed during the Charpy impact test have
been found that are not accurate during the experimental and assume as the estimation
which cannot determine precisely the material toughness for the materials. (Xu et al,
2006)
Other than that, the specimen used for the Charpy impact test are small so there
will be limited constraint development inside the specimen and the energy absorbed or
the strain energy during the impact test for the materials are still not accurate.Both
strain energy gets during Charpy impact test is not same as the theoretical calculation
of strain energy. So, in order to get more accurate results a new method to obtain strain
energy based on the signal are need to be studied by using signal processing approach
via Finite Element Analysis (FEA). By using finite element the load-displacement
oscillation of Charpy impact test can be clearly explained for the full dynamic
analysis. ( Rossoll, A., 1999)
This project will use three different velocities for simulated the Charpy impact
test to study the impact strain signal from FEA. Then based on the signal obtained
from the Charpy impact test simulation from FEA, the Fast Fourier Time (FFT) will
transform the signal into simpler form. Based on the signal obtained from FFT, the
PSD will be used to convert the signal to determine their strain energy. This strain
energy will be compared with the experimental results from the Charpy impact test.
If this method can be approve, in the future this new method can be used to
determine the strain energy by using signal processing via FEA as another alternatives
to find or determined the strain energy in Charpy impact test.
4
1.2 OBJECTIVES
Objectives for this project are:
1. To determine the impact strain signal with different velocity.
2. To calculate the energy using signals processing approach.
3. To compare the result of signal processing approach from previous studies.
1.3 SCOPES
For this project, computer software are mainly used in order to get the signal obtain by using
signal processing approach via Finite Element Analysis (FEA). The specific scopes are as
below:
1. Modeling of Charpy impact test by using ABAQUS software.
2. (50×10×10) mm ASTM E23 standard specimens are used for the Charpy impact test
modeling.
3. Three different velocities are used 5.18m/s, 3.35 m/s and 4.27m/s respectively used for
calculating impact strain signal.
4. Used Fast Fourier Time (FFT) to convert the signal obtains from the Abaqus to time
domain to frequency domain signal.
5. Power Spectrum Density (PSD) method used to calculate strain energy based on the
area under that get from signal converted by the FFT.
5
1.4 ADVANTAGES OF THIS PROJECT
These projects are focused on the Charpy impact test. So, the importance will be on the:
1. As a beginner by using signal pattern to define the characteristic of impact for
different parameters such as velocity, material properties or thickness of the specimen.
2. Purpose new method to calculate the energy absorbed based on signal processing
approach.
3. Using signal processing approach to calculate the energy from Charpy impact test
other than used the instrumented Charpy impact test to measure the absorbed energy.
6
CHAPTER 2
LITERATURE REVIEW
2.1 IMPACT TEST
Impact test are important in order to know the material toughness. Impact test
separates into two categories which is pendulum impact test and drop weight impact
test. Based on Westmorland Mechanical Testing websites states that the most
commonly testing used for the impact test are Charpy impact test and Izod test.
Charpy impact test and Izod test are commonly same based on swingging of
the pendulum or striker and hit the specimen. Abrate, 2011 explained that the
difference between height of the pendulum release and height of pendulum strike the
specimen will be consider as the energy absorb by the specimen during the impact.
While Agrawal, 1988 states that the diferences between Charpy test and Izod test are
the test specimen design, method of supporting and striking the specimen
Generally, impact test are used to measure the response of a material to
dynamic loading and the results obtained from a standard impact test are usually a
single value of impact energy or energy spent on a single experiment. (Perez N.,
2004).
Impact test yield information on the impact forces, impact velocities,
displacement and also strain energy of the striker at any time during the impact test.
7
2.2 CHARPY IMPACT TEST
In many years, Charpy impact test have been used to test the toughness of a
material. Charpy impact test was developed by S. B. Russel on 1989. On 1901, G.
Charpy improved charpy test by standardize the method by giving precise
specification. Because of good and reliable dynamic fracture toughness can be
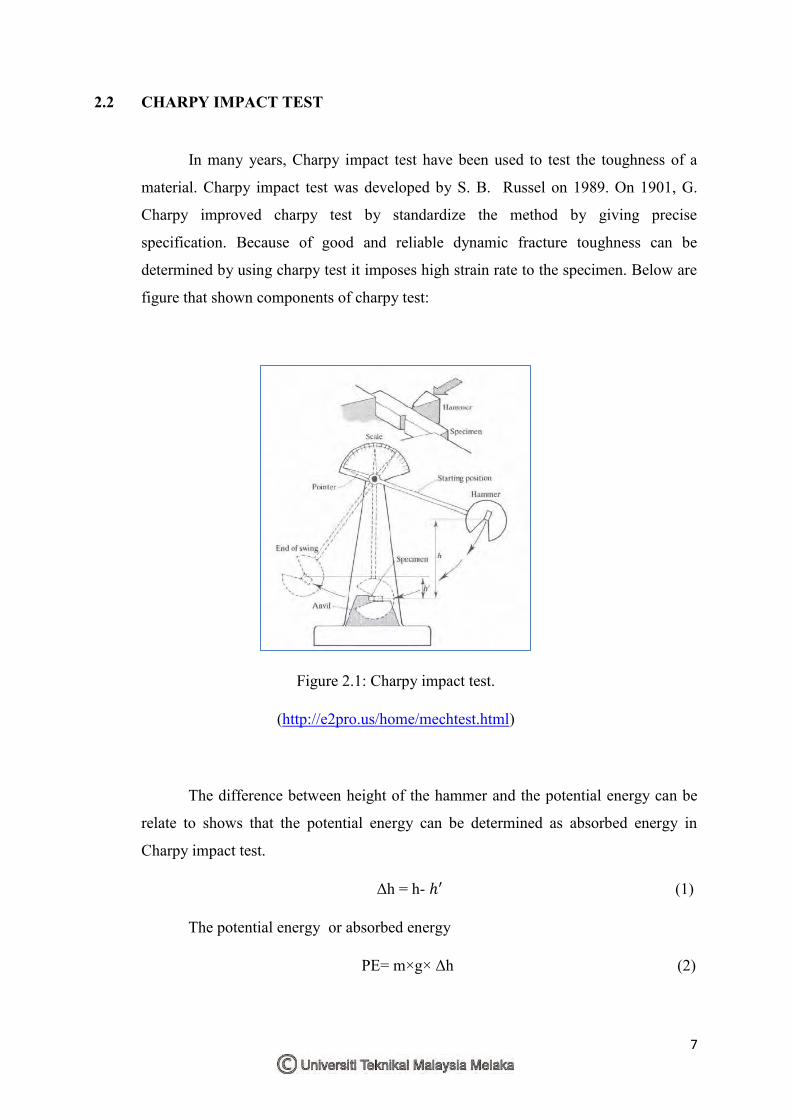
determined by using charpy test it imposes high strain rate to the specimen. Below are
figure that shown components of charpy test:
Figure 2.1: Charpy impact test.
(http://e2pro.us/home/mechtest.html)
The difference between height of the hammer and the potential energy can be
relate to shows that the potential energy can be determined as absorbed energy in
Charpy impact test.
Δh = h- (1)
The potential energy or absorbed energy
PE= m×g× Δh (2)
8
Where,
g is the gravitational acceleration
The potential energy are used to break the specimen during the impact
(Roebben & Lamberty, 2007).
Charpy impact test have been used to measure the amount of energy absorbed
during the impact. Based on the energy absorbed during the specimen break, it can
determine the material toughness of the specimen.
Charpy impact test are commonly used in various industries to studies the
material toughness since this test are the standardize high strain rate test and also due
to the cheapest testing machine and easy to conduct. In terms of energy, during Charpy
impact test as the velocity and kinetic energy of a striking mass are varied, energy is
transferred and work is done on the specimen. (Abrate, S., 2011)
2.3 CHARPY SPECIMEN
Charpy impact test not only can be used for testing the metal material but it
also can be used for testing the composite, polymer and ceramics materials. The are
two types of the specimen can be used for Charpy impact test which is V-notch
specimen or U-notch specimen. Based on standard dimension state in ISO 148-1 :
2006 (E), the dimension of Standard Charpy impact specimen used for the test are
55×10×10 mm. V-notch specimen has centre of the length 2 mm depth with 45 angle
and 0.25 mm root radius. While, U-notch have 5 mm depth and 1mm root radius.
Figure 2.2 below shows the standard Charpy impact test specimen that widely used in
the industries: