supp-rangevalued capital disclosure reg... · premises and equipment 2,006 of which not deducted...
TRANSCRIPT

Q4 13Supplementary Regulatory Capital Disclosure For the Quarter Ended –October 31, 2013
ANDREW CHINDirector, Investor Relations [email protected]
SHARON HAWARD-LAIRDHead, Investor [email protected]
TOM FLYNNChief Financial [email protected]
www.bmo.com/investorrelations

INDEX
Page
Basel Regulatory Capital, Risk-Weighted Assets and Capital Ratios 1-6
Basel Equity Securities Exposures 7
Basel Credit Risk schedules 8-14 - Credit Exposures Covered by Risk Mitigants, by Geographic Region and by Industry 8 - Credit Exposures by Asset Class, by Contractual Maturity, by Basel Approaches 9 - Credit Exposures by Risk Weight - Standardized 10 - Credit Exposure by Portfolio And Risk Ratings - AIRB 11-12 - AIRB Credit Risk Exposure: Loss Experience 13 - Estimated and Actual Loss Parameters Under AIRB Approach 14
Basel Securitization and Re-Securitization Exposures 15-17
Securitization and Re-Securitization Exposures 18-19
Derivative Instruments - Basel 20
Basel Glossary 21
This report is unaudited and all amounts are in millions of Canadian dollars, unless otherwise indicated.

BASEL III REGULATORY CAPITAL (All-in basis) (1) (2)
2013 2013($ millions except as noted) Q4 Q3
Common Equity Tier 1 capital: instruments and reserves1 Directly issued qualifying common share capital plus related stock surplus a+b 12,318 12,320 (1) "All-in" regulatory capital assumes that all Basel III regulatory adjustments are applied 2 Retained earnings c 15,224 14,780 effective January 1, 2013 and that the capital value of instruments which no longer qualify 3 Accumulated other comprehensive income (and other reserves) d 602 274 as regulatory capital under Basel III rules will be phased out at a rate of 10% per year from 6 Common Equity Tier 1 capital before regulatory adjustments 28,144 27,374 January 1, 2013 and continuing to January 1, 2022.
Common Equity Tier 1 capital: regulatory adjustments (2) Row numbering, as per OSFI July 2013 advisory, is provided for consistency and comparability 8 Goodwill (net of related tax liability) e-f 3,757 3,708 in the disclosure of elements of capital among banks and across jurisdiction. Banks are required to 9 Other intangibles other than mortgage-servicing rights (net of related tax liability) g-h 1,153 1,183 maintain the same row numbering per OSFI advisory, however certain rows are removed because
10 Deferred tax assets excluding those arising from temporary differences (net of related tax liability) i-j 1,578 1,600 there are no values in such rows.12 Cash flow hedge reserve k (8) (122) (3) Cross reference to Consolidated Balance Sheet under regulatory scope (page 2).15 Gains and losses due to changes in own credit risk on fair valued liabilities (4) 17 29 (4) For regulatory purposes only. Not included in consolidated balance sheet.15 Defined benefit pension fund net assets (net of related tax liability) (5) l-m 328 322 (5) Net amount after deducting defined benefit pension assets to which the bank has unrestricted16 Investments in own shares (if not already netted off paid-in capital on reported balance sheet) n - o 19 27 and unfettered access.22 Amount exceeding the 15% threshold23 of which: significant investments in the common stock financials h1 30 - 24 of which: mortgage servicing rights j1 1 - 25 of which: deferred tax assets arising from temporary differences i1 42 - 28 Total regulatory adjustments to Common Equity Tier 1 6,917 6,747 29 Common Equity Tier 1 capital (CET1) 21,227 20,627
Additional Tier 1 capital: instruments33 Directly issued capital instruments subject to phase out from Additional Tier 1 p + q + r 3,770 3,758 34 Additional Tier 1 instruments (and CET1 instruments not otherwise included) issued by subsidiaries and held by third
parties (amount allowed in group AT1) s 11 11 35 of which: instruments issued by subsidiaries subject to phase out 11 11 36 Additional Tier 1 capital before regulatory adjustments 3,781 3,769
Additional Tier 1 capital: regulatory adjustments40 Significant investments in the capital of banking, financial and insurance entities that are
outside the scope of regulatory consolidation, net of eligible short positions t 358 358 41 Other deductions from Tier 1 capital as determined by OSFI 51 52
41b of which: Valuation adjustment for less liquid positions (4) 51 52 43 Total regulatory adjustments applied to Additional Tier 1 capital 409 410 44 Additional Tier 1 capital (AT1) 3,372 3,359 45 Tier 1 capital (T1 = CET1 + AT1) 24,599 23,986
Tier 2 capital: instruments and provisions47 Directly issued capital instruments subject to phase out from Tier 2 u 4,444 4,448 48 Tier 2 instruments (and CET1 and AT1 instruments not included) issued by subsidiaries and held by third parties
(amount allowed in group Tier 2) v 176 172 49 of which: instruments issued by subsidiaries subject to phase out 176 172 50 Collective allowances w 331 282 51 Tier 2 capital before regulatory adjustments 4,951 4,902
Tier 2 capital: regulatory adjustments55 Significant investments in the capital of banking, financial and insurance entities that are
outside the scope of regulatory consolidation, net of eligible short positions x 50 50 57 Total regulatory adjustments to Tier 2 capital 50 50 58 Tier 2 capital (T2) 4,901 4,852 59 Total capital (TC = T1 + T2) 29,500 28,838 60 Total risk weighted assets 215,094 214,233
Capital Ratios61 Common Equity Tier 1 ratio 9.9% 9.6%62 Tier 1 ratio 11.4% 11.2%63 Total capital ratio 13.7% 13.5%64 Institution-specific buffer requirement (minimum CET1 requirement plus capital conservation buffer plus G-SIB buffer
requirement plus D-SIB buffer requirement expressed as a percentage of risk-weighted assets) 7.0% 7.0%65 of which: capital conservation buffer requirement 2.5% 2.5%68 Common Equity Tier 1 available to meet buffers (as a % of risk weighted assets) 9.9% 9.6%
OSFI all-in target69 Common Equity Tier 1 all-in target ratio 7.0% 7.0%
Amounts below the thresholds for deduction72 Non-significant investments in the capital of other financials y - z 288 268 73 Significant investments in the common stock of financials a1 1,312 1,022 74 Mortgage servicing rights (net of related tax liability) b1 37 37 75 Deferred tax assets arising from temporary differences (net of related tax liability) c1 - d1 1,835 1,736
Applicable caps on the inclusion of provisions in Tier 276 Provisions eligible for inclusion in Tier 2 in respect of exposures subject to standardised approach (prior to application
of cap) 214 238 77 Cap on inclusion of provisions in Tier 2 under standardised approach 214 238 78 Provisions eligible for inclusion in Tier 2 in respect of exposures subject to internal ratings based approach (prior to
application of cap) 1,383 1,344 79 Cap on inclusion of provisions in Tier 2 under internal ratings-based approach 116 44
Capital instruments subject to phase-out arrangements (only applicable between 1 Jan 2013 and 1 Jan 2022)82 Current cap on AT1 instruments subject to phase out arrangements 3,890 3,890 83 Amounts excluded from AT1 due to cap (excess over cap after redemptions and maturities) e1 + f1 +g1 - - 84 Current cap on T2 instruments subject to phase out arrangements 4,620 4,620 85 Amounts excluded from T2 due to cap (excess over cap after redemptions and maturities) 324 340
Cross reference (3)
October 31, 2013 Supplementary Regulatory Capital Disclosure Page 1

CONSOLIDATED BALANCE SHEET
Balance sheet as in Report to Shareholders
Under regulatory scope of consolidation (1)
Cross Reference (2)
Balance sheet as in Report to Shareholders
Under regulatory scope of consolidation (1)
Cross Reference (2)
($ millions except as noted) Q4 2013 Q4 2013 ($ millions except as noted) Q4 2013 Q4 2013Assets Liabilities and EquityCash and Cash Equivalents 26,083 26,092 DepositsInterest Bearing Deposits with Banks 6,518 6,505 Banks 20,591 20,591Securities 134,981 129,611 Business and governments 220,798 220,798 Investment in own shares Individuals 125,432 125,432 Investments in own shares CET1 (if not already netted off paid-in capital on reported balance sheet) 28 n Total deposits 366,821 366,821 Non-significant investments in the capital of other financials below threshold (3) 6,067 y Other Liabilities Significant investments in deconsolidated subsidiaries and other financial institutions 1,720 t+x+a1 Derivative instruments 31,974 31,919 Significant investments in capital of other financial institutions reflected in regulatory capital Amount exceeding the 15% threshold 30 h1 Acceptances 8,472 8,472Securities Borrowed or Purchased Under Resale Agreements 39,799 39,799 Securities sold but not yet purchased 22,446 22,446Loans Investments in own shares not derecognized for accounting purposes 9 o Residential mortgages 99,328 99,328 Non-significant investments in common equity of other financials 5,779 z Consumer installment and other personal 63,640 63,640 Other Securities sold but not yet purchased Credit cards 7,870 7,870 Securities lent or sold under repurchase agreement 28,884 28,884 Business and governments 101,450 101,450 Current tax liabilities 443 443 Customers' liability under acceptances 8,472 8,472 Deferred tax liabilities (4) 107 107 Allowance for credit losses (1,665) (1,665) related to goodwill 136 f Allowance reflected in Tier 2 regulatory capital 331 w related to intangibles 377 hTotal net loans and acceptances 279,095 279,095 related to deferred tax assets excluding those arising from temporary differences 125 jOther Assets related to defined-benefit pension fund net assets 121 Derivative instruments 30,259 30,259 of which deducted from regulatory capital 121 m Premises and equipment 2,191 2,006 of which not deducted from regulatory capital Goodwill 3,893 3,893 e
g p y , excluding those realizable through net operating loss carryback 149 d1
Intangible assets 1,530 1,530 g Other 42,212 35,999 Current tax assets 1,065 1,065 of which: liabilities of subsidiaries, other than deposits 176 v Deferred tax assets (4) 2,914 2,920 Total other liabilities 134,538 128,270
Deferred tax assets excluding those arising from temporary differences 1,703 i Subordinated DebtDeferred tax assets arising from temporary differences 2,026 c1 Non qualifying subordinated debt 3,996 3,996
of which Deferred tax assets arising from temporary differences under the threshold 1,984 of which redemption has been announced (in the last month of the quarter) of which amount exceeding 15% threshold 42 i1 Less: regulatory amortization 40Other 8,971 8,256 Non qualifying subordinated debt subject to phase out 0
Defined-benefit pension fund net assets 522 Trust subordinated note [eliminated on consolidation] 800 of which Defined-benefit pension fund net assets as per regulatory capital (5) 449 l Less: amount (of subordinated debt and trust subordinated notes) phased out of which the bank has unrestricted and unfettered access 73 Non qualifying subordinated debt and trust subordinated notes after phase out 4,444 u
Mortgage servicing rights 38 Capital Trust Securities of which Mortgage servicing rights under the threshold 37 b1 Innovative instruments issued in Canada 463 463 of which amount exceeding the 15% threshold 1 j1 Less amount phased out 0 g1
Total Assets 537,299 531,031 instruments after phase out 463 qEquity Share capital 14,268
(1) Balance sheet under regulatory scope does not include the following entities: BMO Life Insurance Company and BMO Reinsurance Limited. Preferred shares BMO Life Insurance Company ($6,168 million assets, $2 million equity) covers the development and marketing of individual and group life, accident and health Non-qualifying preferred shares for accounting purposes 2,265 insurance and annuity products in Canada. BMO Reinsurance Limited ($100 million assets, nominal equity) covers the reinsurance of life, health and disability insurance Less amount (of preferred shares) phased out e1 risks as well as property & casualty insurance risks, including catastrophe risks. The business reinsured is written by insurers and reinsurers principally in Non qualifying preferred shares after phase out 2,265 p North America and Europe. Common shares
(2) Cross Reference to Basel III Regulatory Capital (All-in basis) (page 1). Directly issued qualifying CET1 12,003 a(3) Includes synthetic holdings of non-significant capital investments in banking, financial and insurance entities Contributed surplus 315 315 b(4) Deferred tax assets and liabilities are presented on the balance sheet net by legal jurisdiction Retained earnings 15,224 15,224 c(5) Net amount after deducting defined benefit pension assets to which the bank has unrestricted and unfettered access. Accumulated other comprehensive income 602 602 d
Cash flow hedges (8) k Other AOCI 610Total shareholders' equity 30,409 30,409 Non-controlling interests in subsidiaries 1,072 1,072 of which portion allowed for inclusion into Tier 1 capital 1,053 less amount phased out f1 Innovative instruments after phase out 1,042 r Other additional Tier 1 issued by subs after phase out 11 sTotal equity 31,481 31,481Total Liabilities and Equity 537,299 531,031
October 31, 2013 Supplementary Regulatory Capital Disclosure Page 2

Q3 2013 Q2 2013 Q1 2013 Q4 2012 Q3 2012 Q2 2012 Q1 2012 Q4 2011RWA RWA RWA RWA RWA RWA RWA RWA RWA
Standardized Advanced Standardized Advanced ($ millions except as noted) approach approach Total approach approach (7) Total Total Total Total Total Total Total Total TotalCredit Risk Wholesale
Corporate including specialized lending 15,501 141,345 156,846 16,559 62,112 78,671 75,411 74,172 75,164 70,841 70,394 67,213 68,360 67,650 Corporate small and medium enterprises (SMEs) - 57,406 57,406 - 26,594 26,594 24,870 23,829 23,725 22,120 22,332 23,213 22,794 24,410 Sovereign 67 67,810 67,877 - 904 904 849 732 685 645 773 737 685 668 Bank 219 29,825 30,044 44 4,404 4,448 3,945 4,383 4,973 4,853 4,856 4,031 4,713 4,980
Retail Residential mortgages excluding home equity line of credits (HELOCs) 4,163 84,434 88,597 2,225 6,486 8,711 9,111 9,019 8,755 8,578 9,355 8,984 9,271 8,898 HELOCs 1,532 41,291 42,823 841 5,738 6,579 8,201 7,704 7,057 7,725 7,866 7,846 8,330 8,481 Qualifying revolving retail (QRR) - 33,314 33,314 - 4,580 4,580 4,741 4,623 5,562 5,622 6,293 6,418 7,913 5,410 Other retail (excl. SMEs) 3,206 23,962 27,168 2,097 10,313 12,410 12,260 11,950 12,066 11,513 12,045 11,742 11,031 11,404 Retail SMEs 337 3,220 3,557 266 1,269 1,535 1,541 1,232 1,160 1,135 1,182 1,074 937 936
Equity - 1,887 1,887 - 1,366 1,366 1,352 1,270 1,356 1,359 1,322 1,100 1,101 1,098 Trading book 58 72,239 72,297 50 6,087 6,137 6,376 7,182 7,881 6,332 6,451 6,693 6,637 6,859 Securitization - 22,407 22,407 - 4,598 4,598 4,820 5,446 6,245 6,796 7,739 8,714 9,241 13,565 Other credit risk assets - non-counterparty managed assets - 73,229 73,229 - 14,822 14,822 15,828 15,546 14,153 17,596 14,497 19,512 17,299 17,742 Scaling factor for credit risk assets under AIRB (2) - - - - 7,934 7,934 7,621 7,391 7,611 6,840 6,945 6,736 6,761 6,991 Total Credit Risk 25,083 652,369 677,452 22,082 157,207 179,289 176,926 174,479 176,393 171,955 172,050 174,013 175,073 179,092 Market Risk (3) - - - 2,358 6,796 9,154 10,758 7,252 8,292 7,598 7,320 7,546 8,719 4,971 Operational Risk - - - 26,651 - 26,651 26,549 26,243 25,986 25,677 25,417 25,294 24,958 24,609 Total Risk-Weighted Assets (4) (5) 25,083 652,369 677,452 51,091 164,003 215,094 214,233 207,974 210,671 205,230 204,787 206,853 208,750 208,672
2013 2013 2013 2013 CAPITAL RATIOS FOR SIGNIFICANT BANK SUBSIDIARIES 2013 2013 2013 2013Q4 Q3 Q2 Q1 Q4 Q3 Q2 Q1
Transitional Basis - Basel III (6) Bank of Montreal Mortgage Corporation - Basel IIICommon Equity Tier 1 capital (CET1) 28,153 27,524 26,967 26,610 Transitional Basis - Basel III (6)Tier 1 capital (T1 = CET1 + AT1) 28,153 27,533 27,041 26,689 Common Equity Tier 1 ratio 17.8% 14.5% 15.5% 14.9%Total capital (TC = T1 + T2) 33,091 32,436 31,960 31,549 Tier 1 ratio 17.8% 14.5% 15.5% 14.9%Total risk-weighted assets (4) 232,501 229,792 215,863 214,298 Total capital ratio 18.5% 15.1% 16.1% 15.6%Common Equity Tier 1 ratio (as percentage of risk weighted assets) 12.1% 12.0% 12.5% 12.4% All-in Basis - Basel III (8)Tier 1 ratio (as percentage of risk weighted assets) 12.1% 12.0% 12.5% 12.5% Common Equity Tier 1 ratio 17.6% 14.4% 15.3% 14.8%Total capital ratio (as percentage of risk weighted assets) 14.2% 14.1% 14.8% 14.7% Tier 1 ratio 17.6% 14.4% 15.3% 14.8%Assets-to-Capital Multiple (7) 15.6x 16.2x 16.3x 16.1x Total capital ratio 18.5% 15.1% 16.1% 15.6%
BMO Harris Bank N.A. - Basel I (9)Tier 1 ratio 15.2% 15.0% 15.2% 14.9%Total capital ratio 16.8% 16.6% 17.0% 16.8%
(1) 2011 figures have not been restated to reflect the adoption of IFRS, which is, for regulatory capital purposes, being phased in over five quarters commencing Q1, 2012. This table is, for Basel III information, provided on an "all-in" basis.(2) The scaling factor is applied to the risk-weighted asset amounts for credit risk under the AIRB approach.(3) Standardized market risk is comprised of interest rate issuer risk. (4) Under Capital Adequacy Requirements, which governs advanced approaches, the bank calculates a transitional Capital Floor based on Basel I as required by OSFI rules and may be required to increase its risk weighted assets if the Capital Floor or any other
minimum Basel III transitional requirements apply. The Capital Floor did not apply in any quarter shown above on an "all-in" basis but did apply to transitional RWA in Q4 2013, Q3 2013 and Q2 2013.(5) To calculate the AIRB credit risk RWA for BMO Financial Corp, OSFI requires the bank to calculate a transitional floor based on Harris Bankcorp credit risk RWA determined under the Standardized Approach. The floor has been applicable since Q4 12.(6) Transitional capital ratios assume that all Basel III regulatory capital adjustments are phased in from January 1, 2014 to January 1, 2018 and that the capital value of instruments which no longer qualify as regulatory capital under Basel III rules will be phased out at a rate of
10% per year from January 1, 2013 and continuing to January 1, 2022.(7) The Assets-to-Capital Multiple is calculated by dividing the institution's total assets, including specified off-balance sheet items, by total capital calculated on a transitional basis, as set out in CAR.(8) "All-in" capital ratios assume that all Basel III regulatory adjustments are applied effective January 1, 2013 and that the capital value of instruments which no longer qualify as regulatory capital under Basel III rules will be phased out at a rate of 10% per year from January 1, 2013
and continuing to January 1, 2022. OSFI expects all institutions to attain an "all-in" target Common Equity Tier 1 ratio of 7% by the first quarter of 2013, and "all-in" target Tier 1 and Total Capital ratios of 8.5% and 10.5%, respectively, by the first quarter of 2014.(9) Calculated using Basel I guidelines currently in effect for U.S. regulatory purposes and based on Harris N. A.'s calendar quarter-ends.
TRANSITIONAL CAPITAL DISCLOSURE
RISK-WEIGHTED ASSETS (RWA)
Exposure at Default (EAD)
Basel II (1)Basel IIIBasel IIIQ4 2013
October 31, 2013 Supplementary Regulatory Capital Disclosure Page 3

BASEL II REGULATORY CAPITAL (1)2012 2012 2012 2012 2011 2011
Q4 Q3 Q2 Q1 Q4 Q3Qualifying Regulatory CapitalGross regulatory common shareholders' equity 26,060 25,605 25,060 24,709 24,455 23,580 Non-cumulative preferred shares 2,465 2,465 2,465 2,464 2,861 2,861 Innovative Tier 1 Capital Instruments 1,859 1,847 1,866 1,857 2,156 2,126 Non-controlling interest in subsidiaries 16 16 21 26 38 33 Goodwill and excess intangible assets (3,717) (3,732) (3,702) (3,656) (3,585) (3,374) Net Tier 1 Capital 26,683 26,201 25,710 25,400 25,925 25,226 Securitization-related deductions (31) (31) (35) (34) (168) (167) Expected loss in excess of allowance - AIRB approach (2) (65) (75) (164) (233) (205) (270) Substantial investments and investments in insurance subsidiaries (3) (634) (607) (673) (659) (481) (445) Other deductions (57) (86) (80) (75) - - Adjusted Tier 1 Capital 25,896 25,402 24,758 24,399 25,071 24,344 Subordinated debt 4,351 4,386 5,721 5,813 5,896 5,858 Trust subordinated notes 800 800 800 800 800 800 Accumulated net after tax unrealized gains on Available-For-Sale Equity Securities 34 68 65 1 7 12 Eligible portion of Collective allowance for credit losses 318 331 335 359 309 292 Total Tier 2 Capital 5,503 5,585 6,921 6,973 7,012 6,962 Securitization-related deductions (31) (31) (35) (34) (31) (29) Expected loss in excess of allowance - AIRB approach (2) (65) (75) (164) (233) (205) (270) Investments in non-consolidated subsidiaries and substantial investments (3) (634) (607) (673) (659) (855) (875) Adjusted Tier 2 Capital 4,773 4,872 6,049 6,047 5,921 5,788 Total Capital 30,669 30,274 30,807 30,446 30,992 30,132
CAPITAL RATIOS 2012 2012 2012 2012 2011 2011Q4 Q3 Q2 Q1 Q4 Q3
Common equity ratio - Basel II basis (4) 10.5% 10.3% 9.9% 9.7% 9.6% 9.1%Total capital ratio 14.9% 14.8% 14.9% 14.6% 14.9% 14.2%Tier 1 ratio 12.6% 12.4% 12.0% 11.7% 12.0% 11.5%Assets-to-Capital Multiple 15.2x 15.8x 15.1x 15.4x 13.7x 14.3x
Capital Ratios for Significant Bank SubsidiariesBank of Montreal Mortgage Corporation - Basel II basis
Tier 1 ratio 15.9% 18.3% 22.5% 21.1% 24.2% 22.1%Total capital ratio 16.7% 19.3% 23.7% 22.3% 25.5% 23.3%
BMO Harris Bank N.A. - Basel I basis (5)Tier 1 ratio 15.6% 14.8% 14.5% 14.3% 13.8% 16.0%Total capital ratio 17.5% 17.0% 16.8% 16.7% 16.2% 17.8%
(1) 2011 figures have not been restated to reflect the adoption of IFRS, which is, for regulatory capital purposes, being phased in over five quarters commencing Q1, 2012.
(5) Calculated using Basel I guidelines currently in effect for U.S. regulatory purposes and based on Harris N.A.'s calendar quarter-ends.
(2) Under Basel II, the collective allowance is attributed to Standardized and AIRB portfolios based on their respective proportion of RWA. When expected losses as calculated under the AIRB approach exceed total provisions attributed to the AIRB portfolio, 50% of the difference is deducted from Tier 1 capital and 50% is deducted from Tier 2 Capital. When the expected losses as calculated under the AIRB approach are below total provisions attributed to the AIRB portfolio, the difference is added to Tier 2 up to a limit equal to the lower of 0.6% AIRB risk weighted assets or the amount of the collective allowances. The collective allowance attributed to the Standardized portfolio is included in Tier 2 capital up to 1.25% of credit risk-weighted assets subject to the Standardized Approach.
(3) Under Basel II, substantial investments are deducted 50% from Tier 1 capital and 50% from Tier 2 capital except that investments in insurance subsidiaries held prior to January 1, 2007 are deducted from Tier 2 capital until the end of 2011. Effective 2012, these investments in insurance subsidiaries are deducted 50% from Tier 1 capital and 50% from Tier 2 capital. Under Basel III, significant investments in financial services entities that are outside the scope of regulatory consolidation are deducted from a bank's capital using the corresponding deduction approach (e.g. investments in non-common Tier 1 are deducted from a bank's non-common Tier 1 capital) except that investments in common equity capital of a significant investment which represents less than 10% of the bank's CET1 are risk weighted at 250% and are not deducted provided the sum of such investments, deferred tax assets related to timing differences and mortgage servicing rights are less than 15% of the bank's CET1.
(4) The Common equity ratio - Basel II basis is not a prescribed regulatory capital ratio and has been calculated by BMO as gross regulatory common equity less Basel II capital deductions divided by RWA. Sometimes this ratio is also referred to as the Basel II Tier 1 common ratio.
October 31, 2013 Supplementary Regulatory Capital Disclosure Page 4

FLOW STATEMENT OF REGULATORY CAPITAL
2013($ millions except as noted) Q4
Common Equity Tier 1Opening Balance 20,626
New capital issues 55 Redeemed capital (177)
Gross dividends (deduction) (505) Shares issued in lieu of dividends (add back)
Reported net income attributable to BMO shareholders 1,075 Accumulated net after-tax fair value gain/(loss) arising from changes in own credit risk including DVA on derivatives 13 Movements in other comprehensive income
– Translation on net foreign operations 152 – Available-for-sale securities 62 – Other -
Goodwill and other intangible assets (deduction, net of related tax liability) (19) Other, including regulatory adjustments and transitional arrangements
– Deferred tax assets excluding those arising from temporary differences (net of eligible deferred tax liability) 21 – Other (1) (76)
Closing Balance 21,227
Additional Tier 1 CapitalOpening Balance 3,359
New Additional Tier 1 eligible capital issues - Redeemed capital - Other, including regulatory adjustments and transitional arrangements (2) 13
Closing Balance 3,372 Total Tier 1 Capital 24,599
Tier 2 CapitalOpening Balance 4,853
New Tier 2 eligible capital issues - Redeemed capital - Amortization adjustments - Other, including regulatory adjustments and transitional arrangements (3) 48
Closing Balance 4,901 Total Regulatory Capital 29,500 (1) Includes: Expected Loss in excess of allowances, defined benefit pension assets (net of related deferred tax liability) deductions,
changes in contributed surplus, threshold deductions and etc.(2) Includes: Valuation adjustments for Less Liquid Positions, corresponding deductions from Additional Tier 1 Capital.(3) Includes: Eligible allowances, transitional arrangements (phased-out amount) and corresponding deductions from Tier 2
October 31, 2013 Supplementary Regulatory Capital Disclosure Page 5

CREDIT RISK RISK-WEIGHTED ASSETS (RWA) MOVEMENT BY KEY DRIVERS2013
($ millions except as noted) Q4
Opening Credit RWA, beginning of quarter 176,926 Book size (1) 162 Book quality (2) (2,219) Model Updates (3) 3,154 Methodology and Policy (4) - Acquisitions and disposals n.a.Foreign exchange movements 1,266 Other n.a.
Closing Credit RWA, end of quarter 179,289 (1) Book size includes organic changes in book size and composition (including new business and maturing loans).(2) Book quality captures the quality of book changes caused by experience such as underlying customer behaviour or demographics, including
changes through model calibrations/realignments.(3) Model updates includes model implementation, change in model scope or any change to address model malfunctions.(4) Methodology and policy includes methodology changes to the calculations driven by regulatory policy changes, such as new regulation.
MARKET RISK RISK-WEIGHTED ASSETS (RWA) MOVEMENT BY KEY DRIVERS 2013
($ millions except as noted) Q4
Market Risk RWA, beginning of quarter 10,758 Movement in risk levels (1) 490 Model updates (2) (2,094) Methodology and policy (3) - Acquisition and disposals - Foreign exchange movement and others -
Market Risk RWA, end of quarter 9,154 (1) Movement in risks levels includes changes in risk due to position changes and market movements.(2) Model updates includes updates to the model to reflect recent experience, change in model scope.(3) Methodology and policy includes methodology changes to the calculations driven by regulatory policy changes.
October 31, 2013 Supplementary Regulatory Capital Disclosure Page 6

EQUITY SECURITIES EXPOSURE AMOUNT($ millions except as noted) 2013 2013 2013 2013 2012 2012
Q4 Q3 Q2 Q1 Q4 Q3 Equity investments used for capital gains (Merchant Banking) 537 536 534 638 644 638 Equity investments used for mutual fund seed capital 37 40 40 40 37 37 Equity used for other (including strategic investments) 1,313 1,290 1,233 1,250 1,261 1,243 Total Equity Exposure 1,887 1,866 1,807 1,928 1,942 1,918
EQUITY INVESTMENT SECURITIES (1)($ millions except as noted) Q4 2013 Q3 2013 Q2 2013 Q1 2013
Book Market Unrealized Book Market Unrealized Book Market Unrealized Book Market Unrealized Value Value Gain (Loss) Value Value Gain (Loss) Value Value Gain (Loss) Value Value Gain (Loss)
Grandfathered Public 37 37 - 38 38 - 39 39 - 39 39 - Private Direct funds 135 135 - 136 136 - 137 137 - 137 137 - Indirect funds 76 76 - 80 80 - 86 86 - 86 86 - Total Grandfathered 248 248 - 254 254 - 262 262 - 262 262 - Non-grandfathered Public 58 58 - 61 61 - 58 58 - 56 56 - Private Direct funds 385 385 - 369 369 - 316 316 - 303 303 - Indirect funds 375 375 - 378 378 - 375 375 - 473 473 -
Other 821 547 (274) 804 534 (270) 796 563 (233) 834 613 (221) Total Non-grandfathered 1,639 1,365 (274) 1,612 1,342 (270) 1,545 1,312 (233) 1,666 1,445 (221) Total Equities 1,887 1,613 (274) 1,866 1,596 (270) 1,807 1,574 (233) 1,928 1,707 (221)
1 4 - - (1) The schedule consists of corporate equity securities in the banking book only. Excluded are investments in deconsolidated subsidiaries and substantial investments, which are deducted (voluntarily in the case of merchant banking specialized financing entity investments) from capital for Basel II regulatory capital calculation purposes.
Total realized gains or losses arising from sales or liquidations in the reporting period
October 31, 2013 Supplementary Regulatory Capital Disclosure Page 7
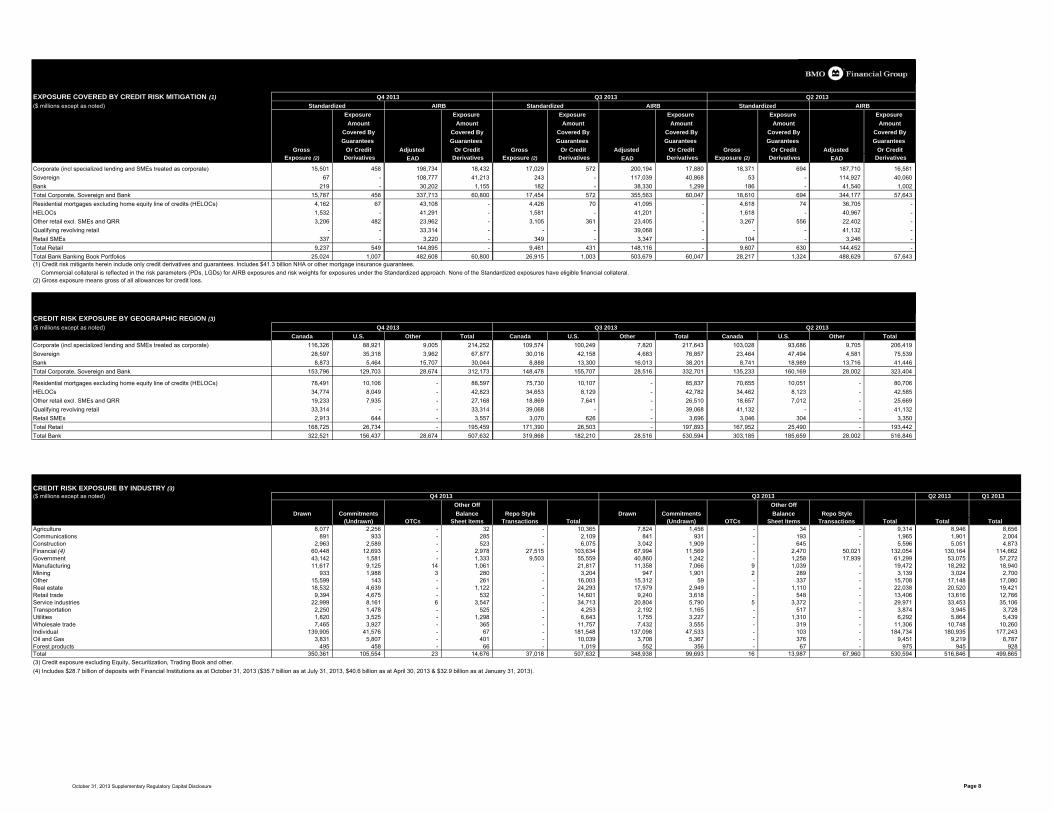
EXPOSURE COVERED BY CREDIT RISK MITIGATION (1)($ millions except as noted) Standardized AIRB Standardized AIRB Standardized AIRB
Exposure Exposure Exposure Exposure Exposure Exposure Amount Amount Amount Amount Amount Amount
Covered By Covered By Covered By Covered By Covered By Covered ByGuarantees Guarantees Guarantees Guarantees Guarantees Guarantees
Gross Or Credit Adjusted Or Credit Gross Or Credit Adjusted Or Credit Gross Or Credit Adjusted Or CreditExposure (2) Derivatives EAD Derivatives Exposure (2) Derivatives EAD Derivatives Exposure (2) Derivatives EAD Derivatives
Corporate (incl specialized lending and SMEs treated as corporate) 15,501 458 198,734 18,432 17,029 572 200,194 17,880 18,371 694 187,710 16,581 Sovereign 67 - 108,777 41,213 243 - 117,039 40,868 53 - 114,927 40,060 Bank 219 - 30,202 1,155 182 - 38,330 1,299 186 - 41,540 1,002 Total Corporate, Sovereign and Bank 15,787 458 337,713 60,800 17,454 572 355,563 60,047 18,610 694 344,177 57,643 Residential mortgages excluding home equity line of credits (HELOCs) 4,162 67 43,108 - 4,426 70 41,095 - 4,618 74 36,705 - HELOCs 1,532 - 41,291 - 1,581 - 41,201 - 1,618 - 40,967 - Other retail excl. SMEs and QRR 3,206 482 23,962 - 3,105 361 23,405 - 3,267 556 22,402 - Qualifying revolving retail - - 33,314 - - - 39,068 - - - 41,132 - Retail SMEs 337 - 3,220 - 349 - 3,347 - 104 - 3,246 - Total Retail 9,237 549 144,895 - 9,461 431 148,116 - 9,607 630 144,452 - Total Bank Banking Book Portfolios 25,024 1,007 482,608 60,800 26,915 1,003 503,679 60,047 28,217 1,324 488,629 57,643 (1) Credit risk mitigants herein include only credit derivatives and guarantees. Includes $41.3 billion NHA or other mortgage insurance guarantees. Commercial collateral is reflected in the risk parameters (PDs, LGDs) for AIRB exposures and risk weights for exposures under the Standardized approach. None of the Standardized exposures have eligible financial collateral.(2) Gross exposure means gross of all allowances for credit loss.
CREDIT RISK EXPOSURE BY GEOGRAPHIC REGION (3)($ millions except as noted) Q4 2013 Q3 2013 Q2 2013
Canada U.S. Other Total Canada U.S. Other Total Canada U.S. Other TotalCorporate (incl specialized lending and SMEs treated as corporate) 116,326 88,921 9,005 214,252 109,574 100,249 7,820 217,643 103,028 93,686 9,705 206,419 Sovereign 28,597 35,318 3,962 67,877 30,016 42,158 4,683 76,857 23,464 47,494 4,581 75,539 Bank 8,873 5,464 15,707 30,044 8,888 13,300 16,013 38,201 8,741 18,989 13,716 41,446 Total Corporate, Sovereign and Bank 153,796 129,703 28,674 312,173 148,478 155,707 28,516 332,701 135,233 160,169 28,002 323,404
Residential mortgages excluding home equity line of credits (HELOCs) 78,491 10,106 - 88,597 75,730 10,107 - 85,837 70,655 10,051 - 80,706 HELOCs 34,774 8,049 - 42,823 34,653 8,129 - 42,782 34,462 8,123 - 42,585 Other retail excl. SMEs and QRR 19,233 7,935 - 27,168 18,869 7,641 - 26,510 18,657 7,012 - 25,669 Qualifying revolving retail 33,314 - - 33,314 39,068 - - 39,068 41,132 - - 41,132 Retail SMEs 2,913 644 - 3,557 3,070 626 - 3,696 3,046 304 - 3,350 Total Retail 168,725 26,734 - 195,459 171,390 26,503 - 197,893 167,952 25,490 - 193,442 Total Bank 322,521 156,437 28,674 507,632 319,868 182,210 28,516 530,594 303,185 185,659 28,002 516,846
CREDIT RISK EXPOSURE BY INDUSTRY (3)($ millions except as noted) Q4 2013 Q3 2013 Q2 2013 Q1 2013
Other Off Other OffDrawn Commitments Balance Repo Style Drawn Commitments Balance Repo Style
(Undrawn) OTCs Sheet Items Transactions Total (Undrawn) OTCs Sheet Items Transactions Total Total TotalAgriculture 8,077 2,256 - 32 - 10,365 7,824 1,456 - 34 - 9,314 8,946 8,656 Communications 891 933 - 285 - 2,109 841 931 - 193 - 1,965 1,901 2,004 Construction 2,963 2,589 - 523 - 6,075 3,042 1,909 - 645 - 5,596 5,051 4,873 Financial (4) 60,448 12,693 - 2,978 27,515 103,634 67,994 11,569 - 2,470 50,021 132,054 130,164 114,662 Government 43,142 1,581 - 1,333 9,503 55,559 40,860 1,242 - 1,258 17,939 61,299 53,075 57,272 Manufacturing 11,617 9,125 14 1,061 - 21,817 11,358 7,066 9 1,039 - 19,472 18,292 18,940 Mining 933 1,988 3 280 - 3,204 947 1,901 2 289 - 3,139 3,024 2,700 Other 15,599 143 - 261 - 16,003 15,312 59 - 337 - 15,708 17,148 17,080 Real estate 18,532 4,639 - 1,122 - 24,293 17,979 2,949 - 1,110 - 22,038 20,520 19,421 Retail trade 9,394 4,675 - 532 - 14,601 9,240 3,618 - 548 - 13,406 13,616 12,766 Service industries 22,999 8,161 6 3,547 - 34,713 20,804 5,790 5 3,372 - 29,971 33,453 35,106 Transportation 2,250 1,478 - 525 - 4,253 2,192 1,165 - 517 - 3,874 3,945 3,728 Utilities 1,820 3,525 - 1,298 - 6,643 1,755 3,227 - 1,310 - 6,292 5,864 5,439 Wholesale trade 7,465 3,927 - 365 - 11,757 7,432 3,555 - 319 - 11,306 10,748 10,260 Individual 139,905 41,576 - 67 - 181,548 137,098 47,533 - 103 - 184,734 180,935 177,243 Oil and Gas 3,831 5,807 - 401 - 10,039 3,708 5,367 - 376 - 9,451 9,219 8,787 Forest products 495 458 - 66 - 1,019 552 356 - 67 - 975 945 928 Total 350,361 105,554 23 14,676 37,018 507,632 348,938 99,693 16 13,987 67,960 530,594 516,846 499,865 (3) Credit exposure excluding Equity, Securitization, Trading Book and other.(4) Includes $28.7 billion of deposits with Financial Institutions as at October 31, 2013 ($35.7 billion as at July 31, 2013, $40.6 billion as at April 30, 2013 & $32.9 billion as at January 31, 2013).
Q2 2013 Q4 2013 Q3 2013
October 31, 2013 Supplementary Regulatory Capital Disclosure Page 8

CREDIT RISK EXPOSURE BY MAJOR ASSET CLASS (1)($ millions except as noted)
Q4 2013 Q3 2013 Q2 2013 Q1 2013Other Off Other Off
Drawn Commitments Balance Repo Style Drawn Commitments Balance Repo Style(Undrawn) OTCs Sheet Items Transactions Total (Undrawn) OTCs Sheet Items Transactions Total Total Total
Basel III Asset ClassesCorporate (incl specialized lending and SMEs treated as corporate) 122,036 60,177 23 12,279 19,737 214,252 121,865 48,583 16 11,791 35,388 217,643 206,419 193,990 Sovereign 50,547 1,578 - 1,311 14,441 67,877 55,250 1,370 - 1,191 19,046 76,857 75,539 66,864 Bank 23,901 2,235 - 1,068 2,840 30,044 21,472 2,217 - 986 13,526 38,201 41,446 46,556 Total Corporate, Sovereign and Bank Exposure 196,484 63,990 23 14,658 37,018 312,173 198,587 52,170 16 13,968 67,960 332,701 323,404 307,410 Residential mortgages excluding home equity line of credits (HELOCs) 88,366 231 - - - 88,597 85,618 219 - - - 85,837 80,706 78,742 HELOCs 31,735 11,088 - - - 42,823 31,757 11,025 - - - 42,782 42,585 42,380 Other retail excl. SMEs and QRR 25,061 2,107 - - - 27,168 24,489 2,021 - - - 26,510 25,669 25,426 Qualifying revolving retail 7,011 26,303 - - - 33,314 6,821 32,247 - - - 39,068 41,132 42,666 Retail SMEs 1,704 1,835 - 18 - 3,557 1,666 2,011 - 19 - 3,696 3,350 3,241 Total Retail Exposures 153,877 41,564 - 18 - 195,459 150,351 47,523 - 19 - 197,893 193,442 192,455 Total Gross Credit Exposures 350,361 105,554 23 14,676 37,018 507,632 348,938 99,693 16 13,987 67,960 530,594 516,846 499,865
CREDIT RISK BY RESIDUAL CONTRACT MATURITY BREAKDOWN($ millions except as noted) Q4 2013 Q3 2013 Q2 2013 Q1 2013
Other Off Other OffDrawn Commitments Balance Repo Style Drawn Commitments Balance Repo Style
(Undrawn) OTCs Sheet Items Transactions Total (Undrawn) OTCs Sheet Items Transactions Total Total TotalUp to 1 year 140,232 67,355 18 9,473 37,018 254,096 157,027 67,696 13 9,434 67,960 302,130 304,058 284,077 1 to 5 years 173,821 35,692 5 5,141 - 214,659 157,031 29,635 3 4,456 - 191,125 179,199 182,838 Greater than 5 years 36,308 2,507 - 62 - 38,877 34,880 2,362 - 97 - 37,339 33,589 32,950 Total 350,361 105,554 23 14,676 37,018 507,632 348,938 99,693 16 13,987 67,960 530,594 516,846 499,865
PORTFOLIO BREAKDOWN BY Basel APPROACHES($ millions except as noted) Q4 2013 Q3 2013 Q2 2013
Standardized AIRB Standardized AIRB Standardized AIRBCredit Credit Credit Credit Credit Credit
Equivalent Equivalent Equivalent Equivalent Equivalent Equivalent Drawn Amount Drawn Amount Drawn Amount Drawn Amount Drawn Amount Drawn Amount
on Undrawn on Undrawn on Undrawn on Undrawn on Undrawn on UndrawnCorporate (incl specialized lending and SMEs treated as corporate) 12,621 2,034 109,415 58,143 13,794 2,357 108,071 46,226 14,943 2,505 102,706 42,604 Sovereign 16 50 50,531 1,528 176 63 55,074 1,307 14 33 56,449 1,279 Bank 189 19 23,712 2,216 145 27 21,327 2,190 152 30 19,362 2,309 Total Corporate, Sovereign & Bank 12,826 2,103 183,658 61,887 14,115 2,447 184,472 49,723 15,109 2,568 178,517 46,192 Residential mortgages excluding home equity line of credits (HELOCs) 4,163 - 84,203 231 4,426 - 81,192 219 4,618 - 75,879 209 HELOCs 1,532 - 30,203 11,088 1,581 - 30,176 11,025 1,618 - 30,124 10,843 Other retail excl. SMEs and QRR 3,206 - 21,855 2,107 3,105 - 21,384 2,021 3,267 - 20,433 1,969 Qualifying revolving retail - - 7,011 26,303 - - 6,821 32,247 - - 6,576 34,556 Retail SMEs 337 - 1,367 1,835 349 - 1,317 2,011 104 - 1,252 1,976 Total Retail 9,238 - 144,639 41,564 9,461 - 140,890 47,523 9,607 - 134,264 49,553 Total Bank 22,064 2,103 328,297 103,451 23,576 2,447 325,362 97,246 24,716 2,568 312,781 95,745 (1) Credit exposure excluding Equity, Securitization, Trading Book and other.
October 31, 2013 Supplementary Regulatory Capital Disclosure Page 9
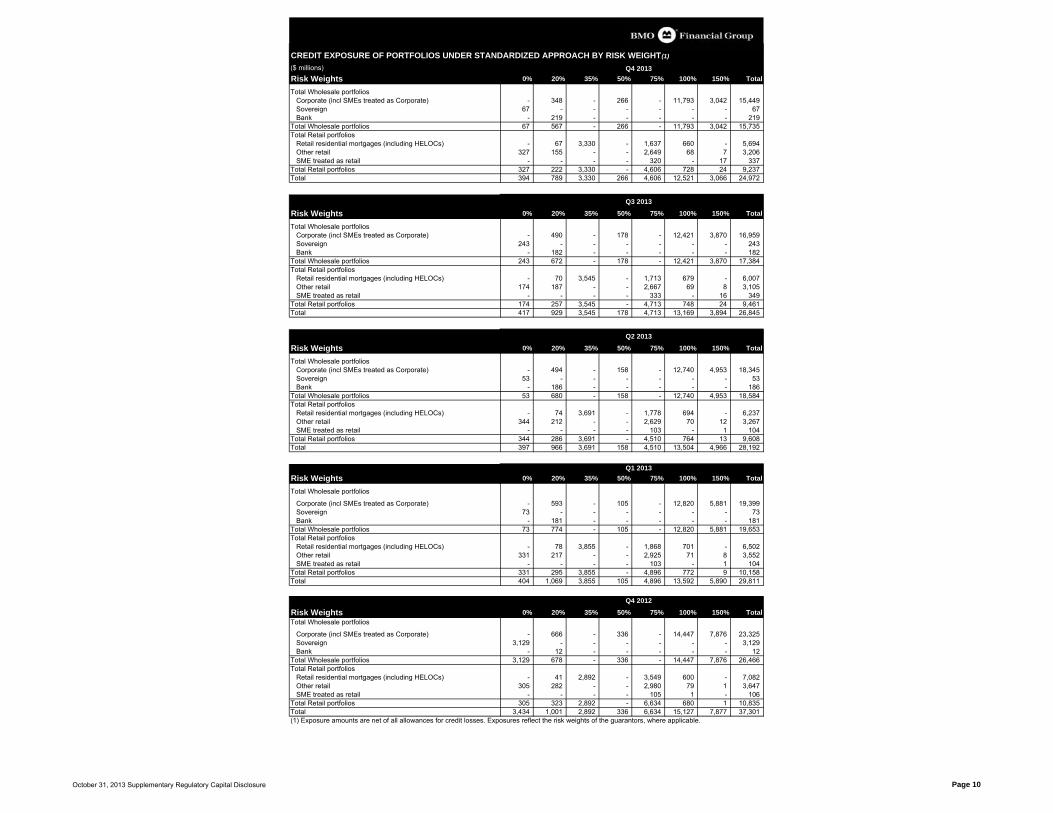
($ millions) Q4 2013Risk Weights 0% 20% 35% 50% 75% 100% 150% Total
Total Wholesale portfoliosCorporate (incl SMEs treated as Corporate) - 348 - 266 - 11,793 3,042 15,449 Sovereign 67 - - - - - - 67 Bank - 219 - - - - - 219
Total Wholesale portfolios 67 567 - 266 - 11,793 3,042 15,735 Total Retail portfolios
Retail residential mortgages (including HELOCs) - 67 3,330 - 1,637 660 - 5,694 Other retail 327 155 - - 2,649 68 7 3,206 SME treated as retail - - - - 320 - 17 337
Total Retail portfolios 327 222 3,330 - 4,606 728 24 9,237 Total 394 789 3,330 266 4,606 12,521 3,066 24,972
Q3 2013
Risk Weights 0% 20% 35% 50% 75% 100% 150% Total
Total Wholesale portfoliosCorporate (incl SMEs treated as Corporate) - 490 - 178 - 12,421 3,870 16,959 Sovereign 243 - - - - - - 243 Bank - 182 - - - - - 182
Total Wholesale portfolios 243 672 - 178 - 12,421 3,870 17,384 Total Retail portfolios
Retail residential mortgages (including HELOCs) - 70 3,545 - 1,713 679 - 6,007 Other retail 174 187 - - 2,667 69 8 3,105 SME treated as retail - - - - 333 - 16 349
Total Retail portfolios 174 257 3,545 - 4,713 748 24 9,461 Total 417 929 3,545 178 4,713 13,169 3,894 26,845
Q2 2013
Risk Weights 0% 20% 35% 50% 75% 100% 150% Total
Total Wholesale portfoliosCorporate (incl SMEs treated as Corporate) - 494 - 158 - 12,740 4,953 18,345 Sovereign 53 - - - - - - 53 Bank - 186 - - - - - 186
Total Wholesale portfolios 53 680 - 158 - 12,740 4,953 18,584 Total Retail portfolios
Retail residential mortgages (including HELOCs) - 74 3,691 - 1,778 694 - 6,237 Other retail 344 212 - - 2,629 70 12 3,267 SME treated as retail - - - - 103 - 1 104
Total Retail portfolios 344 286 3,691 - 4,510 764 13 9,608 Total 397 966 3,691 158 4,510 13,504 4,966 28,192
Q1 2013Risk Weights 0% 20% 35% 50% 75% 100% 150% Total
Total Wholesale portfolios
Corporate (incl SMEs treated as Corporate) - 593 - 105 - 12,820 5,881 19,399 Sovereign 73 - - - - - - 73 Bank - 181 - - - - - 181
Total Wholesale portfolios 73 774 - 105 - 12,820 5,881 19,653 Total Retail portfolios
Retail residential mortgages (including HELOCs) - 78 3,855 - 1,868 701 - 6,502 Other retail 331 217 - - 2,925 71 8 3,552 SME treated as retail - - - - 103 - 1 104
Total Retail portfolios 331 295 3,855 - 4,896 772 9 10,158 Total 404 1,069 3,855 105 4,896 13,592 5,890 29,811
Q4 2012
Risk Weights 0% 20% 35% 50% 75% 100% 150% TotalTotal Wholesale portfolios
Corporate (incl SMEs treated as Corporate) - 666 - 336 - 14,447 7,876 23,325 Sovereign 3,129 - - - - - - 3,129 Bank - 12 - - - - - 12
Total Wholesale portfolios 3,129 678 - 336 - 14,447 7,876 26,466 Total Retail portfolios
Retail residential mortgages (including HELOCs) - 41 2,892 - 3,549 600 - 7,082 Other retail 305 282 - - 2,980 79 1 3,647 SME treated as retail - - - - 105 1 - 106
Total Retail portfolios 305 323 2,892 - 6,634 680 1 10,835 Total 3,434 1,001 2,892 336 6,634 15,127 7,877 37,301 (1) Exposure amounts are net of all allowances for credit losses. Exposures reflect the risk weights of the guarantors, where applicable.
CREDIT EXPOSURE OF PORTFOLIOS UNDER STANDARDIZED APPROACH BY RISK WEIGHT (1)
October 31, 2013 Supplementary Regulatory Capital Disclosure Page 10

CORPORATE, SOVEREIGN AND BANK CREDIT EXPOSURE BY RISK CATEGORY UNDER AIRB APPROACH(1)
Corporate Sovereign Bank Exposures($ millions) Total Total Total Total Total Total Total Total
Risk Profile Drawn UndrawnTotal
Exposure (1)
Exposure Weighted Average LGD%
Exposure Weighted
Average Risk weight Drawn Undrawn
Total Exposure (1)
Exposure Weighted Average LGD%
Exposure Weighted
Average Risk weight Drawn Undrawn
Total Exposure (1)
Exposure Weighted Average LGD%
Exposure Weighted
Average Risk weight Drawn Undrawn
Total Exposure (1)
Exposure Weighted Average LGD%
Exposure Weighted
Average Risk weight
Total investment grade 184,205 46,453 230,658 20.47% 15.34% 185,241 38,092 223,333 19.29% 14.21% 182,218 35,812 218,030 19.40% 14.23% 174,943 34,986 209,929 19.96% 14.67%Non-investment grade 36,779 14,880 51,659 36.60% 74.66% 35,565 11,096 46,661 35.91% 73.63% 32,047 9,930 41,977 37.26% 76.62% 31,170 9,484 40,654 38.68% 79.80%Watchlist 2,021 449 2,470 38.02% 151.07% 2,300 444 2,744 37.97% 150.93% 2,271 358 2,629 38.49% 152.60% 2,462 414 2,876 39.51% 159.91%Default 1,981 105 2,086 104.70% 501.62% 1,682 91 1,773 98.54% 575.75% 1,362 92 1,454 79.56% 592.72% 1,437 115 1,552 72.04% 514.52%
224,986 61,887 286,873 224,788 49,723 274,511 217,898 46,192 264,090 210,012 44,999 255,011
RETAIL CREDIT EXPOSURE BY PORTFOLIO AND RISK CATEGORY UNDER AIRB APPROACH (1)
Q4 2013 Q3 2013 Q2 2013 Q1 2013Total Total Total Total Total Total Total Total
Risk Profile Drawn UndrawnTotal
Exposure (1)
Exposure Weighted Average LGD%
Exposure Weighted
Average Risk weight Drawn Undrawn
Total Exposure (1)
Exposure Weighted Average LGD%
Exposure Weighted
Average Risk weight Drawn Undrawn
Total Exposure (1)
Exposure Weighted Average LGD%
Exposure Weighted
Average Risk weight Drawn Undrawn
Total Exposure (1)
Exposure Weighted Average LGD%
Exposure Weighted
Average Risk weight
Residential Mortgages and HELOCs($ millions)
Exceptionally low 983 4,198 5,181 56.78% 5.24% 984 4,169 5,153 67.52% 6.23% 974 4,061 5,035 65.71% 6.06% 982 3,880 4,862 66.33% 6.12%Very low 47,622 6,294 53,916 14.20% 3.33% 46,027 6,193 52,220 18.55% 4.20% 40,905 6,095 47,000 14.33% 3.38% 41,994 6,133 48,127 14.23% 3.29%Low 11,216 512 11,728 23.34% 16.70% 10,512 508 11,020 27.54% 19.63% 11,617 568 12,185 25.15% 17.92% 9,209 501 9,710 27.35% 18.52%Medium 8,925 296 9,221 31.95% 57.92% 9,360 355 9,715 34.39% 65.51% 8,998 307 9,305 34.96% 66.63% 9,224 280 9,504 32.72% 60.32%High 3,503 15 3,518 17.64% 76.38% 3,374 15 3,389 18.85% 82.37% 3,328 17 3,345 19.59% 85.95% 3,160 17 3,177 20.45% 89.85%Default 829 4 833 46.98% 20.16% 795 4 799 47.46% 32.79% 800 4 804 48.47% 29.68% 800 3 803 49.37% 9.50%
73,078 11,319 84,397 71,052 11,244 82,296 66,622 11,052 77,674 65,369 10,814 76,183 Qualifying Revolving Retail($ millions) Exceptionally low 320 11,472 11,792 80.03% 1.81% 316 17,423 17,739 87.10% 1.93% 281 17,541 17,822 87.37% 1.93% 573 17,323 17,896 87.63% 1.94%Very low 1,711 9,904 11,615 74.41% 3.94% 1,713 9,621 11,334 74.84% 4.01% 1,651 12,048 13,699 79.09% 3.89% 1,837 12,503 14,340 79.98% 3.92%Low 2,578 3,165 5,743 87.30% 16.47% 2,496 3,341 5,837 87.78% 16.34% 2,466 3,214 5,680 86.90% 16.46% 2,587 3,060 5,647 86.84% 16.69%Medium 2,073 1,593 3,666 88.81% 58.88% 1,967 1,677 3,644 89.48% 59.20% 1,872 1,562 3,434 89.05% 58.61% 2,528 1,559 4,087 90.57% 61.21%High 293 160 453 80.88% 177.79% 290 177 467 81.86% 178.56% 268 183 451 82.87% 177.34% 453 197 650 86.40% 186.12%Default 36 9 45 61.66% 0.00% 39 8 47 64.79% 0.00% 38 8 46 62.12% 0.00% 38 9 47 63.61% 0.00%
7,011 26,303 33,314 6,821 32,247 39,068 6,576 34,556 41,132 8,016 34,651 42,667 Other Retail and Retail SME($ millions)
Exceptionally low 71 585 656 74.46% 7.55% 67 738 805 80.83% 8.15% 69 724 793 81.25% 8.19% 59 677 736 80.46% 8.11%Very low 7,521 1,926 9,447 62.24% 19.76% 7,308 1,886 9,194 63.25% 19.85% 6,821 1,843 8,664 64.18% 20.10% 6,506 1,857 8,363 64.42% 20.12%Low 7,995 979 8,974 62.41% 41.29% 7,883 953 8,836 62.54% 40.51% 7,684 937 8,621 62.55% 40.47% 7,506 929 8,435 62.28% 40.27%Medium 7,255 371 7,626 59.46% 71.98% 6,985 374 7,359 60.27% 72.35% 6,633 359 6,992 60.38% 72.26% 6,453 352 6,805 60.25% 72.03%High 294 79 373 64.76% 125.54% 381 79 460 71.18% 132.32% 403 80 483 73.45% 134.54% 494 80 574 76.13% 136.54%Default 86 2 88 59.29% 0.87% 77 2 79 63.20% 1.19% 75 2 77 61.99% 0.50% 80 2 82 61.81% 0.56%
23,222 3,942 27,164 22,701 4,032 26,733 21,685 3,945 25,630 21,098 3,897 24,995
Recap of AIRB and Standardized Portfolios($ millions)Total AIRB wholesale credit exposure by risk ratings 224,986 61,887 224,788 49,723 217,898 46,192 210,012 44,999 Retail AIRB credit exposure by portfolio and risk ratings Residential mortgages 73,078 11,319 71,052 11,244 66,622 11,052 65,369 10,815 Qualifying revolving retail 7,011 26,303 6,821 32,247 6,576 34,556 8,016 34,650 Other retail and Retail SME 23,222 3,942 22,701 4,032 21,685 3,945 21,097 3,897 Total Standardized portfolio 22,064 2,103 23,576 2,447 24,716 2,568 26,253 2,522 Total Portfolio 350,361 105,554 348,938 99,693 337,497 98,313 330,747 96,883 (1) Figures are adjusted exposure at default amounts (Post Credit Risk Mitigation).
Q2 2013 Q1 2013 Q3 2013 Q4 2013
October 31, 2013 Supplementary Regulatory Capital Disclosure Page 11
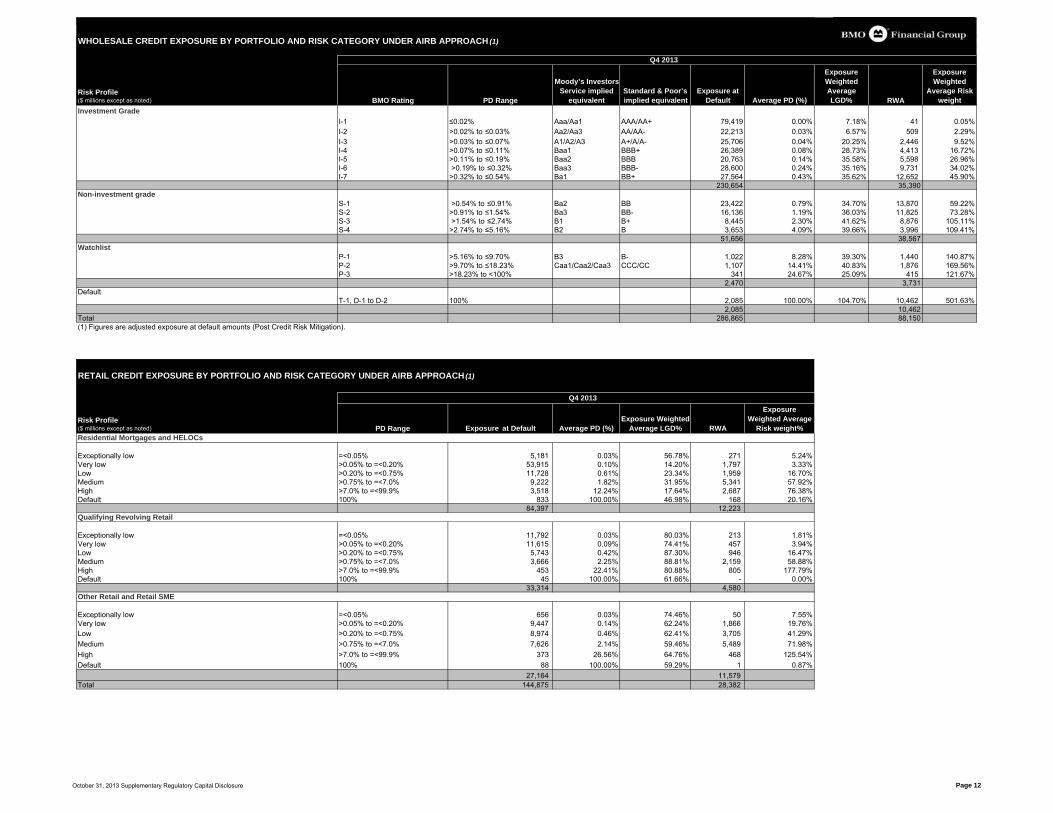
WHOLESALE CREDIT EXPOSURE BY PORTFOLIO AND RISK CATEGORY UNDER AIRB APPROACH (1)
Q4 2013
Risk Profile($ millions except as noted) BMO Rating PD Range
Moody’s Investors Service implied
equivalentStandard & Poor’s implied equivalent
Exposure at Default Average PD (%)
Exposure Weighted Average LGD% RWA
Exposure Weighted
Average Risk weight
Investment GradeI-1 ≤0.02% Aaa/Aa1 AAA/AA+ 79,419 0.00% 7.18% 41 0.05%I-2 >0.02% to ≤0.03% Aa2/Aa3 AA/AA- 22,213 0.03% 6.57% 509 2.29%I-3 >0.03% to ≤0.07% A1/A2/A3 A+/A/A- 25,706 0.04% 20.25% 2,446 9.52%I-4 >0.07% to ≤0.11% Baa1 BBB+ 26,389 0.08% 28.73% 4,413 16.72%I-5 >0.11% to ≤0.19% Baa2 BBB 20,763 0.14% 35.58% 5,598 26.96%I-6 >0.19% to ≤0.32% Baa3 BBB- 28,600 0.24% 35.16% 9,731 34.02%I-7 >0.32% to ≤0.54% Ba1 BB+ 27,564 0.43% 35.62% 12,652 45.90%
230,654 35,390Non-investment grade
S-1 >0.54% to ≤0.91% Ba2 BB 23,422 0.79% 34.70% 13,870 59.22%S-2 >0.91% to ≤1.54% Ba3 BB- 16,136 1.19% 36.03% 11,825 73.28%S-3 >1.54% to ≤2.74% B1 B+ 8,445 2.30% 41.62% 8,876 105.11%S-4 >2.74% to ≤5.16% B2 B 3,653 4.09% 39.66% 3,996 109.41%
51,656 38,567Watchlist
P-1 >5.16% to ≤9.70% B3 B- 1,022 8.28% 39.30% 1,440 140.87%P-2 >9.70% to ≤18.23% Caa1/Caa2/Caa3 CCC/CC 1,107 14.41% 40.83% 1,876 169.56%P-3 >18.23% to <100% 341 24.67% 25.09% 415 121.67%
2,470 3,731Default
T-1, D-1 to D-2 100% 2,085 100.00% 104.70% 10,462 501.63%2,085 10,462
Total 286,865 88,150(1) Figures are adjusted exposure at default amounts (Post Credit Risk Mitigation).
RETAIL CREDIT EXPOSURE BY PORTFOLIO AND RISK CATEGORY UNDER AIRB APPROACH (1)
Risk Profile($ millions except as noted) PD Range Exposure at Default Average PD (%)
Exposure Weighted Average LGD% RWA
Exposure Weighted Average
Risk weight%Residential Mortgages and HELOCs
Exceptionally low =<0.05% 5,181 0.03% 56.78% 271 5.24%Very low >0.05% to =<0.20% 53,915 0.10% 14.20% 1,797 3.33%Low >0.20% to =<0.75% 11,728 0.61% 23.34% 1,959 16.70%Medium >0.75% to =<7.0% 9,222 1.82% 31.95% 5,341 57.92%High >7.0% to =<99.9% 3,518 12.24% 17.64% 2,687 76.38%Default 100% 833 100.00% 46.98% 168 20.16%
84,397 12,223 Qualifying Revolving Retail Exceptionally low =<0.05% 11,792 0.03% 80.03% 213 1.81%Very low >0.05% to =<0.20% 11,615 0.09% 74.41% 457 3.94%Low >0.20% to =<0.75% 5,743 0.42% 87.30% 946 16.47%Medium >0.75% to =<7.0% 3,666 2.25% 88.81% 2,159 58.88%High >7.0% to =<99.9% 453 22.41% 80.88% 805 177.79%Default 100% 45 100.00% 61.66% - 0.00%
33,314 4,580 Other Retail and Retail SME
Exceptionally low =<0.05% 656 0.03% 74.46% 50 7.55%Very low >0.05% to =<0.20% 9,447 0.14% 62.24% 1,866 19.76%Low >0.20% to =<0.75% 8,974 0.46% 62.41% 3,705 41.29%Medium >0.75% to =<7.0% 7,626 2.14% 59.46% 5,489 71.98%High >7.0% to =<99.9% 373 26.56% 64.76% 468 125.54%Default 100% 88 100.00% 59.29% 1 0.87%
27,164 11,579 Total 144,875 28,382
Q4 2013
October 31, 2013 Supplementary Regulatory Capital Disclosure Page 12

AIRB CREDIT RISK EXPOSURE: LOSS EXPERIENCE
Basel III Asset Classes Actual loss rate (1)(2)
Expected loss rate (1)(2)
Actual loss rate (1)(2)
Expected loss rate (1)(2)
Actual loss rate (1)(2)
Expected loss rate (1)(2)
Actual loss rate (1)(2)
Expected loss rate (1)(2)
Non-retailTotal Corporate (incl specialized lending and corporate SMEs) 0.06% 1.00% 0.08% 1.03% 0.13% 1.21% 0.17% 1.35%Sovereign 0.00% 0.01% 0.00% 0.00% 0.00% 0.00% 0.00% 0.00%Bank 0.00% 0.09% 0.00% 0.10% 0.00% 0.12% 0.00% 0.13%
RetailResidential retail incl. HELOCs 0.19% 0.62% 0.21% 0.61% 0.24% 0.60% 0.25% 0.71%Other retail incl. SBE 0.49% 1.05% 0.47% 1.10% 0.47% 1.13% 0.45% 1.12%Qualifying revolving retail 1.97% 3.29% 1.95% 3.45% 1.86% 3.15% 1.55% 3.73%
General
Expected Loss rates which represent the loss rate predicted at the beginning of the most recent four quarter period are calculated using "through the cycle" risk parameters while actual loss rates are determined at a "point in time" and reflect more current economic conditions. "Through the cycle" parameters are conservatively estimated to include a long time horizon and as a result, actual losses mayexceed expected losses during an economic downturn and may fall below expected losses during times of economic growth.
1. Non-retail actual and expected loss rates are measured as follows:Actual loss rate represents the 'point in time' credit losses (change in specific allowance plus write-offs) less recoveries for the current and last three quarters divided by the quarterly average of outstandings for the same period beginning 15 months ago.
Expected loss rate is calculated using Basel III 'through the business cycle' parameters (PDxLGDxEAD) plus Best Estimate of Expected Loss for defaulted assets (BEEL), divided by outstanding balances at the beginning of the applicable four-quarter period.
2. Retail actual and expected loss rates are measured as follows:Actual loss rate represents write-offs net of recoveries for the current and prior three quarters divided by the quarterly average of outstanding balances for the same period beginning 15 months ago.
Expected loss rate is calculated using Basel III parameters PDxLGDxEAD plus Best Estimate of Expected Losses for defaulted assets (BEEL) divided by outstanding balances at the beginning of the applicable four-quarter period.
• For residential mortgages, actual loss rate also includes changes in specific allowances for the applicable four-quarter period.
Commentary
Non RetailCorporate Portfolios – Actual Losses for Q4 F2013 continued to be low and trending downwards. Specific Allowances have reduced during the trailing 4 quarter periods and write-offs remained
relatively low. These results align with expectations as default rates have reduced and are at or near pre-recession levels. Reduction in EL is attributed to favourable migration of default risk as well as implementation of recalibrated LGDs.
Bank and Sovereign – Actual Losses continued to be nil. Moreover, there have been no new defaults observed in the Bank asset class in over a year. EL measures have remained stable throughout the year.
RetailOverall, the Actual Loss rates for all retail asset classes are well below Expected Loss rates. Quarter over Quarter, actual loss rates are stable for Residential retail portfolio, Qualifying revolving retail (QRR), and Other retail asset classes. Expected losses (EL) for Q4, 2013 are based on newly calibrated risk parameters, and as expected, EL have marginally decreased in view of the consistently low actual loss rates for Residential retail and Other retail asset classes. The larger decrease in EL for QRR asset class is a combined effect of new calibration and change in portfolio mix - due to credit card securitization transactions during the quarter.
Q4 2013 Q3 2013 Q2 2013 Q1 2013
October 31, 2013 Supplementary Regulatory Capital Disclosure Page 13

ESTIMATED AND ACTUAL LOSS PARAMETERS UNDER AIRB APPROACH
Risk Profile($ millions except as noted) Average estimated % Actual % Average estimated % Actual % Estimated $ Actual $
WholesaleCorporate including specialized lending (7) 1.34% 0.50% 39.70% 40.87% 178 118Corporate small and medium enterprises (SMEs) 1.56% 0.79% 37.26% 28.24% 95 69Sovereign 0.15% 0.00% 9.42% 0.00% - - Bank 0.72% 0.00% 18.70% 11.92% - -
Retail Residential mortgages excluding home equity line of credits (HELOCs) - Uninsured only (8) 1.14% 1.47% 52.15% 50.04% 346 346HELOCs 0.60% 0.71% 71.06% 63.10% 242 231Qualifying revolving retail (QRR) 1.29% 1.23% 95.82% 84.34% 437 416Other retail (excl. SMEs) 4.40% 4.42% 91.29% 85.78% 206 207Retail SMEs 1.19% 0.92% 98.48% 92.43% 15 15
(1) Wholesale PDs are based on an borrower weighted average. There have been no Bank or Sovereign defaults in the past 12 months.(2) Retail PD is based on account weighted average.(3) Wholesale LGDs are expressed as an exposure weighted average. (4) Retail LGD is based on weighted average of LGD eligible accounts.(5) Wholesale EAD represented predicted vs. realized comparison for defaults in the previous 12 months. Term products are not included. No defaults in the Bank and Sovereign asset classes within the past 12 months.(6) Retail EAD represents predicted vs. realized comparison for defaults in the previous 12 months.(7) F2013 realized LGD was slightly higher than predicted LGD as a result of a small number of resolved Corporate facilities during the year. This has immaterial effect on the overall LGD calibration that is based on more than 10 years of data. (8) Mortgages insured by Canada Mortgage And Housing Corporation and private mortgage insurers are primarily included in Sovereign.
Q4 2013
PD (1) (2) LGD (3) (4) EAD (5) (6)
October 31, 2013 Supplementary Regulatory Capital Disclosure Page 14

REGULATORY CAPITAL CHARGES FOR SECURITIZATION EXPOSURES RETAINED OR PURCHASED BY RISK WEIGHTS (4)
($ millions)Traditional Securitizations Exposure Capital Exposure Capital Exposure Capital Exposure Capital Exposure CapitalRisk Weights Amount (1) Required Amount (1) Required Amount (1) Required Amount (1) Required Amount (1) RequiredBank Assets7% 1,448 8 1,448 8 1,448 8 - - - - 7.01% - 25% 37 - 36 - 49 1 49 1 49 1 25.01% - 50% - - - - - - - - - - Greater than 50% - - - - - - - - - - Less amount excluded from capital requirements for exceeding maximum KIRB capital (2) - - - - - - - - - - Total Exposures, net of deductions 1,485 8 1,484 8 1,497 9 49 1 49 1 Exposures Deducted: From Tier 1 Capital: Credit Card Receivables (3) - - - - - - - - - - Residential Mortgages - - - - - - - - - - From Total Capital: Residential Mortgages - - - - - - - - - - Total Exposures Deducted - - - - - - - - - - Bank Assets Total Exposures 1,485 8 1,484 8 1,497 9 49 1 49 1 Third Party Assets7% 8,147 46 7,975 45 5,714 32 5,567 31 5,562 31 7.01% - 25% 11,824 77 13,681 88 19,613 122 21,284 137 21,046 136 25.01% - 50% 110 4 101 3 99 3 99 3 4 - 50.01% - 100% 55 3 71 3 75 4 13 1 13 1 Greater than 100% - - 124 42 133 45 165 54 287 95 Default 177 177 182 182 179 179 153 153 Total Exposures, net of deductions 20,313 307 22,134 363 25,813 385 27,281 379 26,912 263 Exposures Deducted: From Total Capital: Collateralized Debt Obligations (AAA/R-1 (High) Securities) - - - - - - - - 46 - Montreal Accord Assets - - - - - - - - - - Residential Mortgages (Uninsured) - - - - - - - - - -
Other Pool Type - - - - - - - - - - Trading Securities Reclassified to AFS - - - - - - - - - -
Total Exposures Deducted - - - - - - - - 46 - Third Party Assets Total Exposures 20,313 307 22,134 363 25,813 385 27,281 379 26,958 263 Total Exposures 21,798 315 23,618 371 27,310 394 27,330 380 27,007 264
(1) Exposure amounts are on balance sheet values and the credit equivalent amount for off-balance sheet exposures.(2) KIRB - IRB capital of underlying assets as though they had not been securitized.(3) Since inception, no capital has been assessed for the Bank's early amortization provisions associated with the investors' interest in Master Credit Card Trust because the excess spread of the underlying portfolio has remained above the threshold at which capital charges would be incurred. (4) The comparative figures have not been restated to reflect Basel III, effective Q1 2013.
Q4 2012 Q4 2013 Q2 2013 Q1 2013 Q3 2013
October 31, 2013 Supplementary Regulatory Capital Disclosure Page 15

REGULATORY CAPITAL CHARGES FOR RESECURITIZATION EXPOSURES RETAINED OR PURCHASED BY RISK WEIGHTS
($ millions)Traditional Securitizations
Risk WeightsExposure Amount (1) Capital Required Exposure Amount (1) Capital Required Exposure Amount (1) Capital Required Exposure Amount (1) Capital Required
Bank Assets
7% - - - - - - - - 7.01% - 25% - - - - - - - - 25.01% - 50% - - - - - - - - Greater than 50% - - - - - - - - Less amount excluded from capital requirements for exceeding maximum KIRB capital (2) - - - - - - - - Total Exposures, net of deductions - - - - - - - - Exposures Deducted: From Tier 1 Capital: Credit Card Receivables (3) - - - - - - - - Residential Mortgages - - - - - - - - From Total Capital: Residential Mortgages - - - - - - - - Total Exposures Deducted - - - - - - - - Bank Assets Total Exposures - - - - - - - -
Third Party Assets7% - - - - - - - - 7.01% - 25% 464 9 335 6 365 7 438 8 25.01% - 50% 21 1 43 1 763 21 98 3 50.01% - 100% 19 2 - - - - - - Greater than 100% 105 42 - - - - 1,158 95 Default - - 6 6 14 14 14 14 Total Exposures, net of deductions 609 54 384 13 1,142 42 1,708 120 Exposures Deducted: From Total Capital: Collateralized Debt Obligations (AAA/R-1 (High) Securities) - - - - - - - - Commerical Mortgages - - - - - - - - Montreal Accord Assets - - - - - - - - Residential Mortgages (Uninsured) - - - - - - - -
Other Pool Type - - - - - - - - Equipment Loans/Leases - - - - - - - - Total Exposures Deducted - - - - - - - - Third Party Assets Total Exposures 609 54 384 13 1,142 42 1,708 120 Total Exposures 609 54 384 13 1,142 42 1,708 120
(1) Exposure amounts are on balance sheet values and the credit equivalent amount for off-balance sheet exposures. Unrated positions and positions with ratings below investment-grade are deducted from capital.(2) KIRB - IRB capital of underlying assets as though they had not been securitized.(3) Since inception, no capital has been assessed for the Bank's early amortization provisions associated with the investors' interest in Master Credit Card Trust because the excess spread of the underlying portfolio has remained above the threshold at which capital charges would be incurred.
Q1 2013 Q4 2013 Q3 2013 Q2 2013
October 31, 2013 Supplementary Regulatory Capital Disclosure Page 16
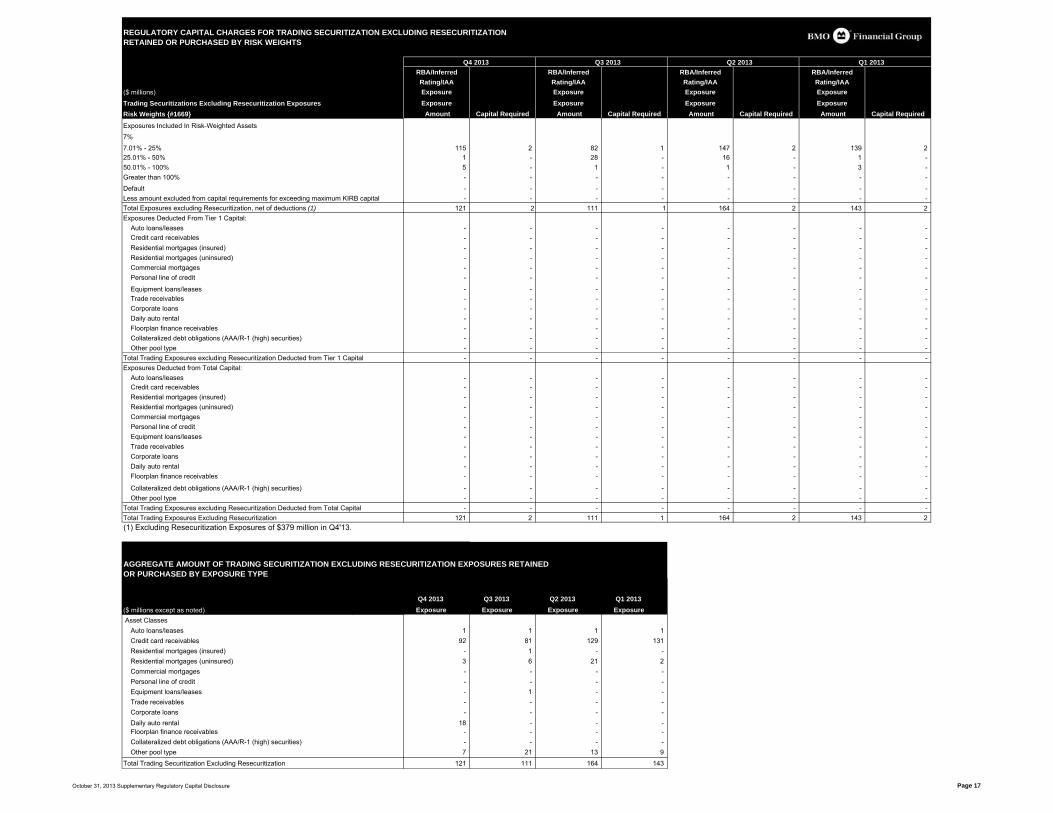
RETAINED OR PURCHASED BY RISK WEIGHTS
Q4 2013 Q3 2013 Q2 2013 Q1 2013RBA/Inferred RBA/Inferred RBA/Inferred RBA/Inferred Rating/IAA Rating/IAA Rating/IAA Rating/IAA
($ millions) Exposure Exposure Exposure ExposureTrading Securitizations Excluding Resecuritization Exposures Exposure Exposure Exposure ExposureRisk Weights {#1669} Amount Capital Required Amount Capital Required Amount Capital Required Amount Capital Required
Exposures Included In Risk-Weighted Assets
7%
7.01% - 25% 115 2 82 1 147 2 139 2 25.01% - 50% 1 - 28 - 16 - 1 - 50.01% - 100% 5 - 1 - 1 - 3 - Greater than 100% - - - - - - - -
Default - - - - - - - - Less amount excluded from capital requirements for exceeding maximum KIRB capital - - - - - - - - Total Exposures excluding Resecuritization, net of deductions (1) 121 2 111 1 164 2 143 2 Exposures Deducted From Tier 1 Capital: Auto loans/leases - - - - - - - - Credit card receivables - - - - - - - - Residential mortgages (insured) - - - - - - - - Residential mortgages (uninsured) - - - - - - - - Commercial mortgages - - - - - - - - Personal line of credit - - - - - - - -
Equipment loans/leases - - - - - - - - Trade receivables - - - - - - - - Corporate loans - - - - - - - - Daily auto rental - - - - - - - - Floorplan finance receivables - - - - - - - - Collateralized debt obligations (AAA/R-1 (high) securities) - - - - - - - - Other pool type - - - - - - - - Total Trading Exposures excluding Resecuritization Deducted from Tier 1 Capital - - - - - - - - Exposures Deducted from Total Capital: Auto loans/leases - - - - - - - - Credit card receivables - - - - - - - - Residential mortgages (insured) - - - - - - - - Residential mortgages (uninsured) - - - - - - - - Commercial mortgages - - - - - - - - Personal line of credit - - - - - - - - Equipment loans/leases - - - - - - - - Trade receivables - - - - - - - - Corporate loans - - - - - - - - Daily auto rental - - - - - - - - Floorplan finance receivables - - - - - - - -
Collateralized debt obligations (AAA/R-1 (high) securities) - - - - - - - - Other pool type - - - - - - - - Total Trading Exposures excluding Resecuritization Deducted from Total Capital - - - - - - - - Total Trading Exposures Excluding Resecuritization 121 2 111 1 164 2 143 2 (1) Excluding Resecuritization Exposures of $379 million in Q4'13.
AGGREGATE AMOUNT OF TRADING SECURITIZATION EXCLUDING RESECURITIZATION EXPOSURES RETAINED OR PURCHASED BY EXPOSURE TYPE
Q4 2013 Q3 2013 Q2 2013 Q1 2013($ millions except as noted) Exposure Exposure Exposure Exposure Asset Classes Auto loans/leases 1 1 1 1 Credit card receivables 92 81 129 131 Residential mortgages (insured) - 1 - - Residential mortgages (uninsured) 3 6 21 2 Commercial mortgages - - - - Personal line of credit - - - - Equipment loans/leases - 1 - - Trade receivables - - - - Corporate loans - - - - Daily auto rental 18 - - - Floorplan finance receivables - - - - Collateralized debt obligations (AAA/R-1 (high) securities) - - - - Other pool type 7 21 13 9
Total Trading Securitization Excluding Resecuritization 121 111 164 143
REGULATORY CAPITAL CHARGES FOR TRADING SECURITIZATION EXCLUDING RESECURITIZATION
October 31, 2013 Supplementary Regulatory Capital Disclosure Page 17

DEBT ISSUED BY BANK SPONSORED VEHICLES FOR THIRD PARTY ASSETS
Q4 2013 Q3 2013 Q2 2013 Q1 2013SIVs/Credit SIVs/Credit SIVs/Credit SIVs/Credit
Canadian US Protection Canadian US Protection Canadian US Protection Canadian US Protection($ millions except as noted) Conduits (1) Conduit (2) Vehicles Total Conduits (1) Conduit (2) Vehicles Total Conduits (1) Conduit (2) Vehicles Total Conduits (1) Conduit (2) Vehicles Total Auto loans/leases 1,061 291 - 1,352 1,231 327 - 1,558 1,104 313 - 1,417 1,531 597 - 2,128 Credit card receivables - - - - - - - - - - - - - - - - Residential mortgages (insured) 1,214 - - 1,214 1,235 - - 1,235 855 - - 855 582 - - 582 Residential mortgages (uninsured) 12 6 - 18 43 6 - 49 80 11 - 91 122 18 - 140 Commercial mortgages (uninsured) - 137 - 137 - 152 - 152 - 165 - 165 - 193 - 193 Commercial mortgages (insured) 88 - - 88 94 - - 94 63 - - 63 73 - - 73 Personal line of credit - - - - - - - - - - - - - - - - Equipment loans/leases 363 212 - 575 255 187 - 442 155 149 - 304 337 177 - 514 Trade receivables - 245 - 245 - 137 - 137 - 134 - 134 - 133 - 133 Corporate loans - 516 - 516 - 544 - 544 - 594 - 594 - 680 - 680 Daily auto rental 154 83 - 237 332 86 - 418 135 89 - 224 93 57 - 150 Floorplan finance receivables 202 244 - 446 223 256 - 479 178 241 - 419 420 246 - 666 Collateralized debt obligations - 275 - 275 - 300 - 300 - 316 - 316 - 319 - 319 Other pool type 250 1,487 - 1,737 250 858 - 1,108 250 884 - 1,134 250 717 - 967 SIV assets (financial institutions debt and securitized assets) - - - - - - - - - - 496 496 - - 894 894 Credit protection vehicle - - 2,187 2,187 - - 2,187 2,187 - - 2,187 2,187 - - 2,187 2,187 Total 3,344 3,496 2,187 9,027 3,663 2,853 2,187 8,703 2,820 2,896 2,683 8,399 3,408 3,137 3,081 9,626 (1) Canadian Conduit totals include amounts pertaining to conduits that have been directly funded by the Bank ($722.4 million as at Q4, 2013, $858.5 million as at Q3, 2013, $677.0 million as at Q2, 2013 and $687.8 million as at Q1, 2013).(2) US Conduit totals include amounts pertaining to conduits that have been funded by the Bank through liquidity draws ($326.0 million as at Q4, 2013,96.7 million as at Q3, 2013, $105.0 million as at Q2, 2013 and $131 million as at Q1, 2013).
AGGREGATE AMOUNT OF SECURITIZATION EXPOSURES RETAINED OR PURCHASED BY EXPOSURE TYPE
Q4 2013 Q3 2013 Q2 2013 Q1 2013Undrawn Undrawn Undrawn Undrawn
Committed Drawn Loan Committed Drawn Loan Committed Drawn Loan Committed Drawn Loan Facilities and Facilities and Facilities and Facilities and Facilities and Facilities and Facilities and Facilities and
Notional Securities First Loss Notional Securities First Loss Notional Securities First Loss Notional Securities First Loss ($ millions except as noted) Amounts (3) Held (4) Positions (5) Total Amounts (3) Held (4) Positions (5) Total Amounts (3) Held (4) Positions (5) Total Amounts (3) Held (4) Positions (5) TotalBank Assets (6) Credit card receivables (7) - 1,485 - 1,485 - 1,484 - 1,484 - 1,497 - 1,497 - 49 - 49 Residential mortgages (uninsured) - - - - - - - - - - - - - - - - Total Bank Assets - 1,485 - 1,485 - 1,484 - 1,484 - 1,497 - 1,497 - 49 - 49 Third Party Assets (8) Auto loans/leases 2,137 2,567 - 4,704 2,419 2,598 - 5,017 1,465 2,133 - 3,598 1,719 2,482 - 4,201 Credit card receivables - 479 - 479 - 451 - 451 - 331 - 331 - 374 - 374 Residential mortgages (insured) 1,530 - - 1,530 1,530 - - 1,530 1,275 - - 1,275 913 - - 913 Residential mortgages (uninsured) - 6 - 6 33 7 - 40 72 13 - 85 127 26 - 153 Commercial mortgages (uninsured) - - - - 2 121 - 123 3 130 - 133 5 261 - 266 Commercial mortgages (insured) - - - - - - - - - - - - 82 - - 82 Personal line of credit - - - - - - - - - - - - - - - - Equipment loans/leases 523 806 - 1,329 567 677 - 1,244 577 697 - 1,274 594 676 - 1,270 Trade receivables 72 252 - 324 26 137 - 163 25 134 - 159 25 133 - 158 Corporate loans 69 505 - 574 77 867 - 944 116 607 - 723 88 692 - 780 Daily auto rental 511 90 - 601 507 92 - 599 521 77 - 598 505 91 - 596 Floorplan finance receivables 396 329 - 725 395 428 - 823 251 310 - 561 620 345 - 965 Collateralized debt obligations 68 241 - 309 75 279 - 354 81 272 - 353 77 348 - 425 Other pool type 681 1,289 - 1,970 907 630 - 1,537 1,094 838 - 1,932 913 705 - 1,618 SIV assets (financial institutions debt and securitized assets) - - - - - - - - - - - - - - - - Credit protection vehicle (9) 7,749 - - 7,749 9,292 - - 9,292 14,771 - - 14,771 15,672 - - 15,672 Trading securities reclassified to AFS - 13 - 13 - 17 - 17 - 20 - 20 - 23 - 23 Montreal Accord Assets - - - - - - - - - - - - - - - - Total Third Party Assets 13,736 6,577 - 20,313 15,830 6,304 - 22,134 20,251 5,562 - 25,813 21,340 6,156 - 27,496 Total 13,736 8,062 - 21,798 15,830 7,788 - 23,618 20,251 7,059 - 27,310 21,340 6,205 - 27,545 (3) External Credit Assessment Institutions (ECAIs) used for securitizations liquidity facility ratings are S&P, Moody's and Fitch. (4) ECAIs used for securitization notes are S&P & Moody's. (5) First Loss Positions reflect deferred purchase price amounts for securitization of the Bank's own credit cards and conventional mortgages net of servicing liabilities and tax impacts.(6) The exposures for the Residential Mortgages (uninsured) are treated under the lending AIRB Framework as if the securitized assets remained on the Bank's balance sheet. (7) The credit card receivable securities held from Bank asset securitizations represent the Bank's seller's interest in investment grade subordinated notes issued by Master Credit Card Trust and Master Credit Card Trust II. The Securitization Framework is applied. (8) Third party asset securitizations that are externally rated and Montreal Accord assets are assessed under the RBA, with unrated and below BB- positions being deducted from capital. The Supervisory Formula (SF) has been applied for all other positions.(9) Amounts reported for credit protection vehicle assets under Undrawn Committed Facilities and Notional Amounts represent aggregate notional amounts of the credit default swap exposures and do not represent committed funding obligations.
October 31, 2013 Supplementary Regulatory Capital Disclosure Page 18

AGGREGATE AMOUNT OF RESECURITIZATION EXPOSURES RETAINED OR PURCHASED BY EXPOSURE TYPE
Q4 2013 Q3 2013 Q2 2013 Q1 2013Undrawn Undrawn Undrawn Undrawn
Committed Drawn Loan Committed Drawn Loan Committed Drawn Loan Committed Drawn Loan Facilities and Facilities and Facilities and Facilities and Facilities and Facilities and Facilities and Facilities and
Notional Securities First Loss Notional Securities First Loss Notional Securities First Loss Notional Securities First Loss ($ millions except as noted) Amounts (1) Held (2) Positions (3) Total Amounts (1) Held (2) Positions (3) Total Amounts (1) Held (2) Positions (3) Total Amounts (1) Held (2) Positions (3) TotalBank Assets (4) Credit card receivables (5) - - - - - - - - - - - - - - - - Residential mortgages (uninsured) - - - - - - - - - - - - - - - - Total Bank Assets - - - - - - - - - - - - - - - - Third Party Assets (6) Auto loans/leases - - - - - - - - - - - - - - - - Credit card receivables - - - - - - - - - - - - - - - - Residential mortgages (insured) - - - - - - - - - - - - - - - - Residential mortgages (uninsured) - - - - - - - - - - - - - - - - Commercial mortgages - 105 - 105 - 6 - 6 - 14 - 14 - 14 - 14 Personal line of credit - - - - - - - - - - - - - - - - Equipment loans/leases - - - - - - - - - - - - - - - - Trade receivables - - - - - - - - - - - - - - - - Corporate loans 12 169 - 181 1 45 - 46 1 63 - 64 2 79 - 81 Daily auto rental - - - - - - - - - - - - - - - - Floorplan finance receivables - - - - - - - - - - - - - - - - Collateralized debt obligations (AAA/R-1 (high) securities) 2 89 - 91 1 71 - 72 2 82 - 84 2 96 - 98 Other pool type - - - - - - - - - - - - - - - - SIV assets (financial institutions debt and securitized assets) - - - - - - - - 20 696 - 716 30 1,127 - 1,157 Credit protection vehicle (7) - - - - - - - - - - - - - - - - Trading securities reclassified to AFS - - - - - - - - - - - - - - - - Montreal Accord Assets 232 - - 232 238 22 - 260 238 26 - 264 295 63 - 358 Total Third Party Assets 246 363 - 609 240 144 - 384 261 881 - 1,142 329 1,379 - 1,708 Total 246 363 - 609 240 144 - 384 261 881 - 1,142 329 1,379 - 1,708
(1) External Credit Assessment Institutions (ECAIs) used for securitizations liquidity facility ratings are S&P, Moody's and Fitch.
(2) ECAIs used for securitization notes are S&P & Moody's.
(3) First Loss Positions reflect deferred purchase price amounts for securitization of the Bank's own credit cards and conventional mortgages net of servicing liabilities and tax impacts.
(4) The exposures for the Residential Mortgages (uninsured) are treated under the lending AIRB Framework as if the securitized assets remained on the Bank's balance sheet.
(5) The credit card receivable securities held from Bank asset securitizations represent the Bank's seller's interest in investment grade subordinated notes issued by Master Credit Card Trust and Master Credit Card Trust II. The Securitization Framework is applied.
(6) Third party asset securitizations that are externally rated and Montreal Accord assets are assessed under the RBA, with unrated and below BB- positions being deducted from capital. The Supervisory Formula (SF) has been applied for all other positions.
(7) Amounts reported for credit protection vehicle assets under Undrawn Committed Facilities and Notional Amounts represent aggregate notional amounts of the credit default swap exposures and do not represent committed funding obligations.
October 31, 2013 Supplementary Regulatory Capital Disclosure Page 19

Basel Basel Basel BaselDERIVATIVE INSTRUMENTS (2) Notional Replacement Credit risk Risk-weighted Notional Replacement Credit risk Risk-weighted Notional Replacement Credit risk Risk-weighted Notional Replacement Credit risk Risk-weighted($ millions) Amount Cost Equivalent Assets (1) Amount Cost Equivalent Assets (1) Amount Cost Equivalent Assets (1) Amount Cost Equivalent Assets (1)
Interest Rate ContractsOver-the-counter Swaps 2,224,786 21,621 26,813 2,141,804 21,616 27,120 2,006,098 32,579 38,440 1,887,529 32,014 36,437 Forward rate agreements 399,751 5 40 466,560 4 27 509,317 45 27 401,015 48 22 Purchased options 18,283 589 657 18,289 603 677 18,349 864 924 16,159 802 856 Written options 23,020 - - 22,284 - - 22,745 - - 22,372 - -
2,665,840 22,215 27,510 1,758 2,648,937 22,223 27,824 1,769 2,556,509 33,488 39,391 2,845 2,327,075 32,864 37,315 2,774 Exchange traded Futures 111,913 - - 107,989 - - 84,808 - - 84,299 - - Purchased options 16,534 - - 15,125 - - 17,135 - - 29,239 - - Written options 15,429 - - 13,344 - - 15,773 - - 17,349 - -
143,876 - - 136,458 - - 117,716 - - 130,887 - - Total Interest Rate Contracts 2,809,716 22,215 27,510 1,758 2,785,395 22,223 27,824 1,769 2,674,225 33,488 39,391 2,845 2,457,962 32,864 37,315 2,774 Foreign Exchange Contracts
Over-the-counter Cross-currency swaps 44,834 1,156 4,091 44,560 1,167 4,022 43,293 1,169 3,897 28,460 1,165 2,903 Cross-currency interest rate swaps 255,337 3,459 15,671 244,292 4,142 15,905 242,791 4,417 15,873 232,587 3,833 14,765 Forward foreign exchange contracts 263,607 1,957 3,854 232,211 2,363 3,948 246,325 2,302 3,853 220,670 2,780 4,674 Purchased options 10,923 90 227 12,567 128 258 10,871 146 264 10,525 128 231 Written options 13,530 - - 15,520 - - 14,871 - - 13,604 - -
588,231 6,662 23,843 2,448 549,150 7,800 24,133 2,469 558,151 8,034 23,887 2,453 505,846 7,906 22,573 2,247 Exchange tradedFutures 621 - - 550 - - 367 - - 851 - - Purchased options 2,608 - - 3,800 - - 2,314 - - 4,427 - - Written options 616 - - 1,436 - - 1,573 - - 1,460 - -
3,845 - - 5,786 - - 4,254 - - 6,738 - - Total Foreign Exchange Contracts 592,076 6,662 23,843 2,448 554,936 7,800 24,133 2,469 562,405 8,034 23,887 2,453 512,584 7,906 22,573 2,247 Commodity Contracts
Over-the-counter Swaps 15,122 501 2,289 16,001 637 2,568 15,396 493 2,317 15,272 887 2,457 Purchased options 8,081 66 1,045 8,413 111 1,122 8,405 131 1,141 8,563 38 1,168 Written options 4,285 - - 4,446 - - 4,502 - - 4,798 - -
27,488 567 3,334 621 28,860 748 3,690 660 28,303 624 3,458 515 28,633 925 3,625 1,284 Exchange traded Futures 24,037 - - 24,155 - - 22,361 - - 21,900 - - Purchased options 8,044 - - 7,487 - - 7,607 - - 8,488 - - Written options 9,894 - - 9,307 - - 9,257 - - 9,851 - -
41,975 - - 40,949 - - 39,225 - - 40,239 - -
Total Commodity Contracts 69,463 567 3,334 621 69,809 748 3,690 660 67,528 624 3,458 515 68,872 925 3,625 1,284 Equity Contracts
Over-the-counter 39,360 520 3,054 37,113 454 2,772 34,703 491 2,654 31,442 335 2,258 Exchange traded 5,851 - - 4,850 - - 3,710 - - 3,974 - -
Total Equity Contracts 45,211 520 3,054 113 41,963 454 2,772 132 38,413 491 2,654 82 35,416 335 2,258 128 Credit Default Swaps
Over-the-counter Purchased 8,835 90 448 8,819 185 505 10,532 197 574 11,266 221 701 Written 13,288 - - 14,974 - - 21,221 - - 22,475 - -
Total Credit Default Swaps 22,123 90 448 310 23,793 185 505 394 31,753 197 574 433 33,741 221 701 582 Sub-total 3,538,589 30,054 58,189 5,250 3,475,896 31,410 58,924 5,424 3,374,324 42,834 69,964 6,328 3,108,575 42,251 66,472 7,015 Impact of master netting agreements n.a. (27,493) (38,607) n.a. (24,415) (39,346) n.a. (30,706) (48,854) n.a. (31,291) (46,362) Total 3,538,589 2,561 19,582 5,250 3,475,896 6,995 19,578 5,424 3,374,324 12,128 21,110 6,328 3,108,575 10,960 20,110 7,015 (1) Risk-weighted Assets are reported after the impact of master netting agreements. (2) Certain comparative figures have been reclassified to conform to the current period's presentation.
As at October 31, 2013 As at April 30, 2013As at July 31, 2013 As at January 31, 2013
October 31, 2013 Supplementary Regulatory Capital Disclosure Page 20

2
BASEL GLOSSARY
Adjusted EAD: Represents EAD that has been redistributed to a more favourable PD band or a different Basel Asset Class as a result of collateral (Credit Risk Mitigation - CRM). All AIRB disclosures aggregated into PD (probability of default) bands use Adjusted EAD values.
AIRB (Advanced Internal Ratings Based approach): The AIRB approach is the most advanced of the range of options for determining the capital requirements for credit risk. This option allows banks to use their own internal model to measure credit risk capital requirements, subject to regulatory approval. OSFI has indicated that it expects the largest Canadian Banksto adopt the AIRB approach.
Capital Adequency Requirements (CAR): OSFI's Capital Adequency Requirements guideline dated December 2012.
Capital Floor: A capital floor based on Basel I is calculated by banks which use the AIRB approach to credit risk, as required by our regulator.
Commitments (Undrawn): The EAD on the difference between the authorized and drawn amounts (e.g., the unused portion of a line of credit) before adjustments for credit risk mitigation.
Credit Equivalent Amount (CEA) on Undrawn: An estimate of the amount of credit risk exposure on off-balance items under the Standardized Approach for credit risk.
Drawn: The amount of funds invested or advanced to a customer. Does not include adjustments for credit risk mitigation.
Exposure at Default (EAD): EAD for on-balance sheet amounts represents outstandings, grossed up by specific provisions and write-offs. EAD for Off balance sheet and Undrawn areestimates.
Exposure at Default OTC Derivatives: Represent the net gross positive replacement costs plus the potential credit exposure amount.
Exposure Weighted Average LGD represents the (Σ (Adjusted EAD of each exposure x its LGD)) divided by the total Adjusted EAD.
Exposure Weighted Average Risk Weight is the (Σ pre-scaled RWA for each exposure/Total Adjusted EAD).
Grandfathered Equity Securities in the Banking Book: Under Basel II OSFI exempts equity investments held as of October 31, 2007 from the AIRB approach for a period of 10 years starting November 1, 2007 to October 31, 2017. During that time, these "grandfathered" holdings will be risk weighted at 100%.
HELOCs: Home Equity Lines of Credit comprise lines of credit secured by equity in a residential property.
OSFI: Office of the Superintendent of Financial Institutions.
Other Off Balance Sheet Items: All off-balance sheet arrangements other than derivatives and undrawn commitments such as Standby Letters of Credit and Documentary Credits.
QRR (Qualifying Revolving Retail): Includes exposures that are revolving, unsecured and uncommitted to individuals up to a maximum amount of $125,000 to a single individual.
Repo Style Transactions: Includes repurchase and reverse repurchase agreements and securities lending and borrowing.
Scaling Factor: The scaling factor is applied to the risk weighted assets amount for credit risk assessed under the AIRB approach. The objective of the scaling factor is to broadlymaintain the aggregate level of Basel I minimum capital requirements, while also providing incentives to adopt the more advanced risk-sensitive approaches.
Standardized Approach: This approach is the least complicated of the range of options available to banks to measure credit risk capital requirements. This option allows banks tomeasure credit risk capital requirements by multiplying exposures by defined percentages based on the exposures product type and external credit rating (if applicable).
October 31, 2013 Supplementary Regulatory Capital Disclosure Page 21