supplemental data ‘normocalcemia is maintained in mice...
TRANSCRIPT
Supplemental data Lieben et al.
1
SUPPLEMENTAL DATA: ‘NORMOCALCEMIA IS MAINTAINED IN MICE UNDER CONDITIONS OF CALCIUM
MALABSORPTION BY VITAMIN D-INDUCED INHIBITION OF BONE MINERALIZATION’ BY LIEBEN ET AL.
SUPPLEMENTAL FIGURES
SUPPLEMENTAL FIGURE 1
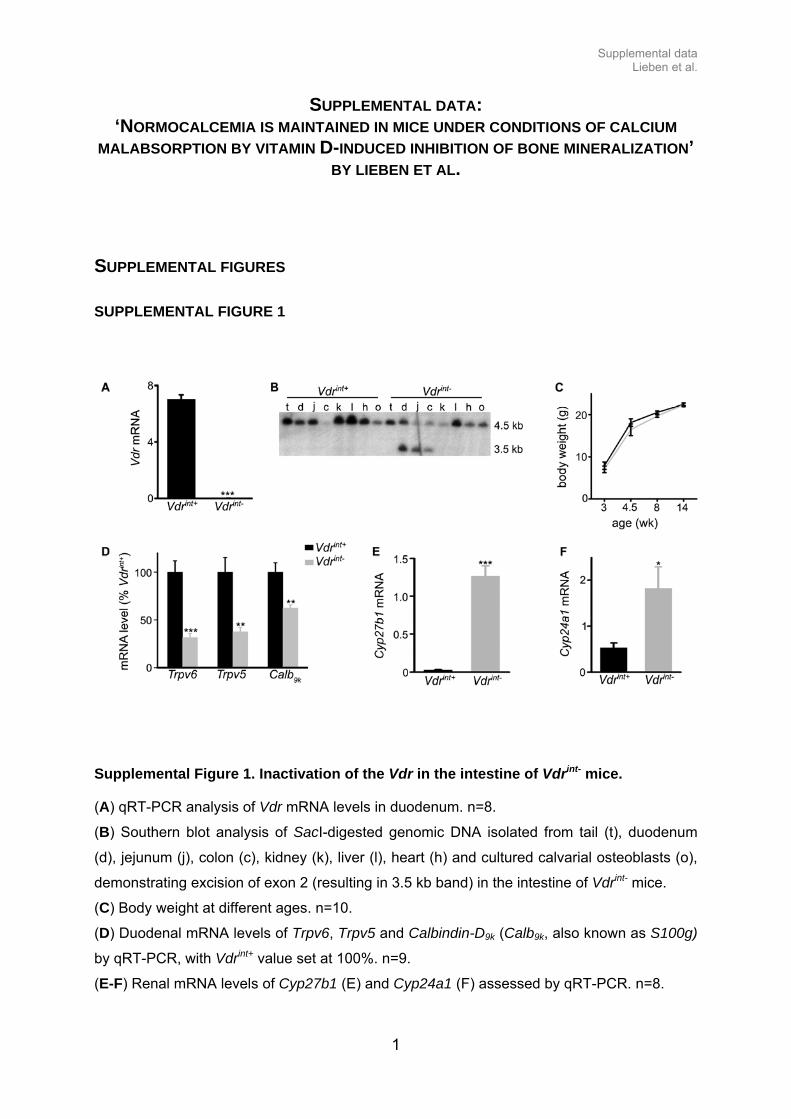
Supplemental Figure 1. Inactivation of the Vdr in the intestine of Vdrint- mice.
(A) qRT-PCR analysis of Vdr mRNA levels in duodenum. n=8.
(B) Southern blot analysis of SacI-digested genomic DNA isolated from tail (t), duodenum
(d), jejunum (j), colon (c), kidney (k), liver (l), heart (h) and cultured calvarial osteoblasts (o),
demonstrating excision of exon 2 (resulting in 3.5 kb band) in the intestine of Vdrint- mice.
(C) Body weight at different ages. n=10.
(D) Duodenal mRNA levels of Trpv6, Trpv5 and Calbindin-D9k (Calb9k, also known as S100g)
by qRT-PCR, with Vdrint+ value set at 100%. n=9.
(E-F) Renal mRNA levels of Cyp27b1 (E) and Cyp24a1 (F) assessed by qRT-PCR. n=8.
Supplemental data Lieben et al.
2
SUPPLEMENTAL FIGURE 2
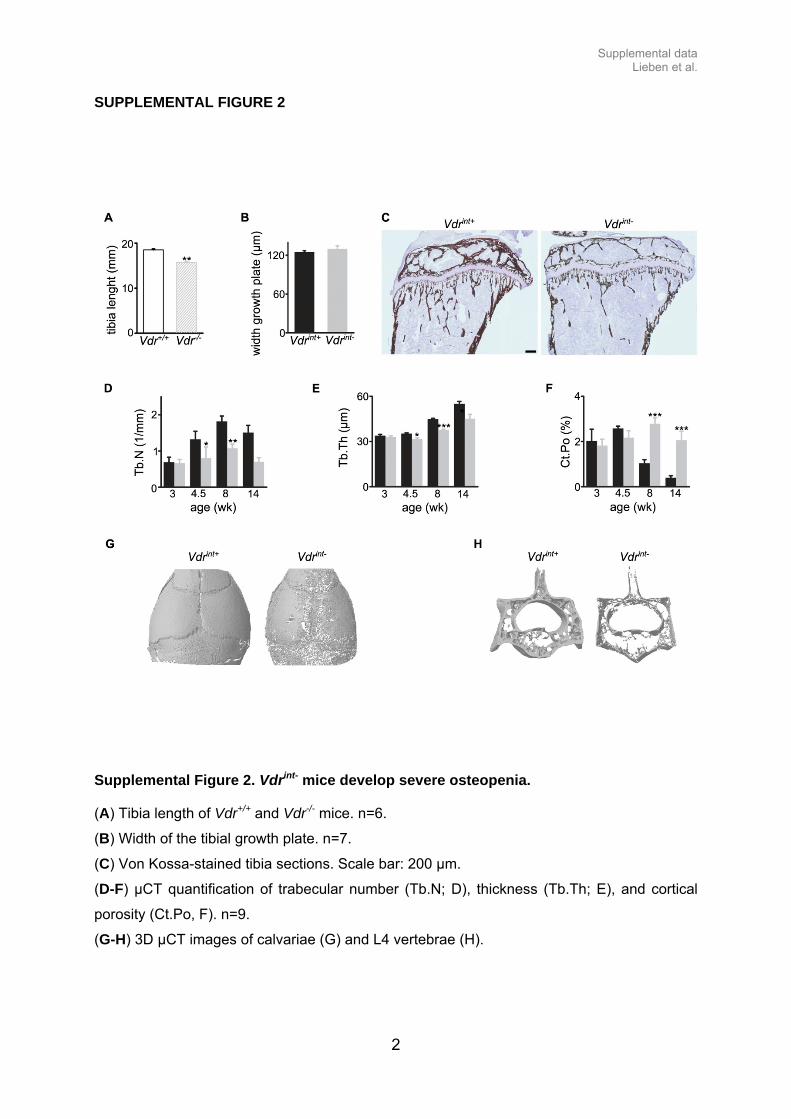
Supplemental Figure 2. Vdrint- mice develop severe osteopenia.
(A) Tibia length of Vdr+/+ and Vdr-/- mice. n=6.
(B) Width of the tibial growth plate. n=7.
(C) Von Kossa-stained tibia sections. Scale bar: 200 µm.
(D-F) µCT quantification of trabecular number (Tb.N; D), thickness (Tb.Th; E), and cortical
porosity (Ct.Po, F). n=9.
(G-H) 3D µCT images of calvariae (G) and L4 vertebrae (H).
Supplemental data Lieben et al.
3
SUPPLEMENTAL FIGURE 3
Supplemental data Lieben et al.
4
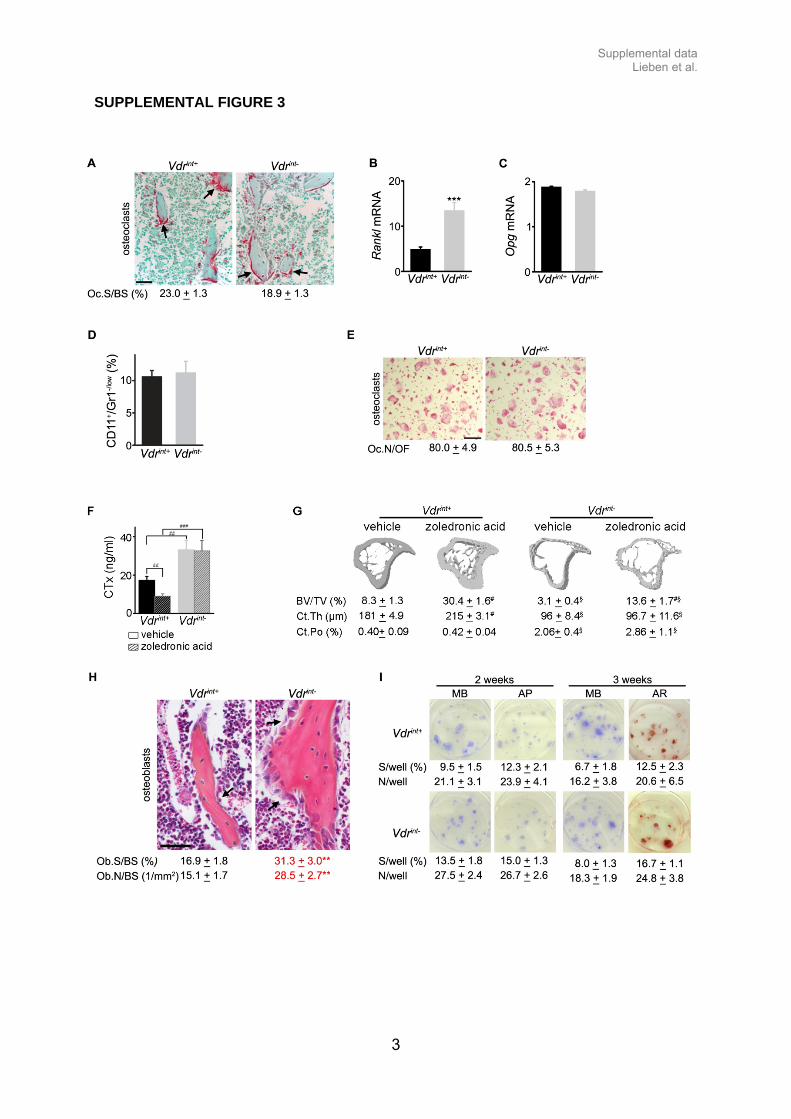
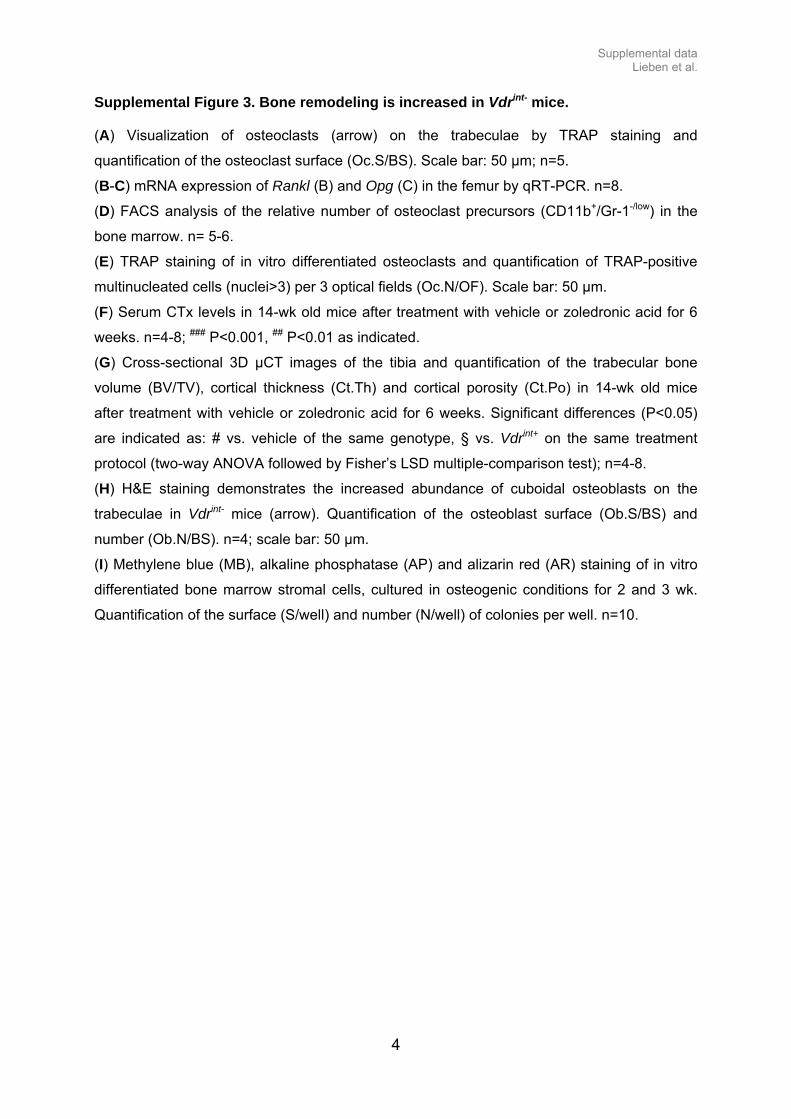
Supplemental Figure 3. Bone remodeling is increased in Vdrint- mice.
(A) Visualization of osteoclasts (arrow) on the trabeculae by TRAP staining and
quantification of the osteoclast surface (Oc.S/BS). Scale bar: 50 µm; n=5.
(B-C) mRNA expression of Rankl (B) and Opg (C) in the femur by qRT-PCR. n=8.
(D) FACS analysis of the relative number of osteoclast precursors (CD11b+/Gr-1-/low) in the
bone marrow. n= 5-6.
(E) TRAP staining of in vitro differentiated osteoclasts and quantification of TRAP-positive
multinucleated cells (nuclei>3) per 3 optical fields (Oc.N/OF). Scale bar: 50 µm.
(F) Serum CTx levels in 14-wk old mice after treatment with vehicle or zoledronic acid for 6
weeks. n=4-8; ### P<0.001, ## P<0.01 as indicated.
(G) Cross-sectional 3D µCT images of the tibia and quantification of the trabecular bone
volume (BV/TV), cortical thickness (Ct.Th) and cortical porosity (Ct.Po) in 14-wk old mice
after treatment with vehicle or zoledronic acid for 6 weeks. Significant differences (P<0.05)
are indicated as: # vs. vehicle of the same genotype, § vs. Vdrint+ on the same treatment
protocol (two-way ANOVA followed by Fisher’s LSD multiple-comparison test); n=4-8.
(H) H&E staining demonstrates the increased abundance of cuboidal osteoblasts on the
trabeculae in Vdrint- mice (arrow). Quantification of the osteoblast surface (Ob.S/BS) and
number (Ob.N/BS). n=4; scale bar: 50 µm.
(I) Methylene blue (MB), alkaline phosphatase (AP) and alizarin red (AR) staining of in vitro
differentiated bone marrow stromal cells, cultured in osteogenic conditions for 2 and 3 wk.
Quantification of the surface (S/well) and number (N/well) of colonies per well. n=10.
Supplemental data Lieben et al.
5
SUPPLEMENTAL FIGURE 4
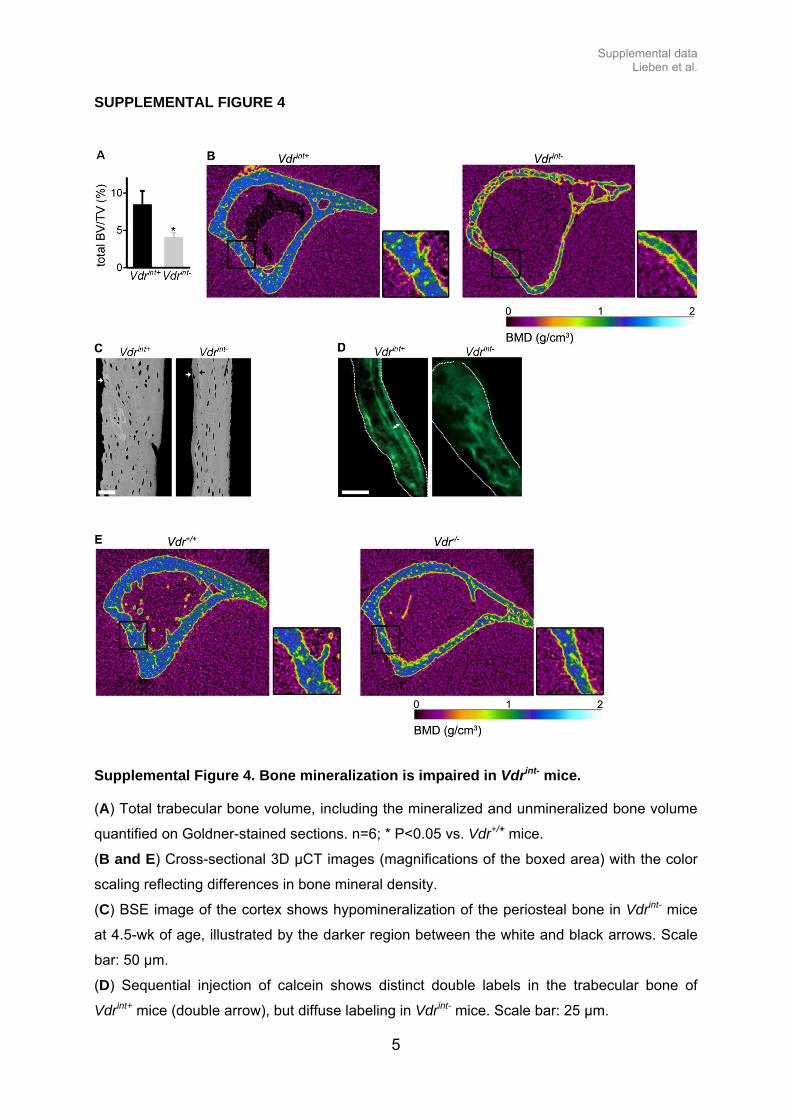
Supplemental Figure 4. Bone mineralization is impaired in Vdrint- mice.
(A) Total trabecular bone volume, including the mineralized and unmineralized bone volume
quantified on Goldner-stained sections. n=6; * P<0.05 vs. Vdr+/+ mice.
(B and E) Cross-sectional 3D µCT images (magnifications of the boxed area) with the color
scaling reflecting differences in bone mineral density.
(C) BSE image of the cortex shows hypomineralization of the periosteal bone in Vdrint- mice
at 4.5-wk of age, illustrated by the darker region between the white and black arrows. Scale
bar: 50 µm.
(D) Sequential injection of calcein shows distinct double labels in the trabecular bone of
Vdrint+ mice (double arrow), but diffuse labeling in Vdrint- mice. Scale bar: 25 µm.
Supplemental data Lieben et al.
6
SUPPLEMENTAL FIGURE 5

Supplemental data Lieben et al.
7
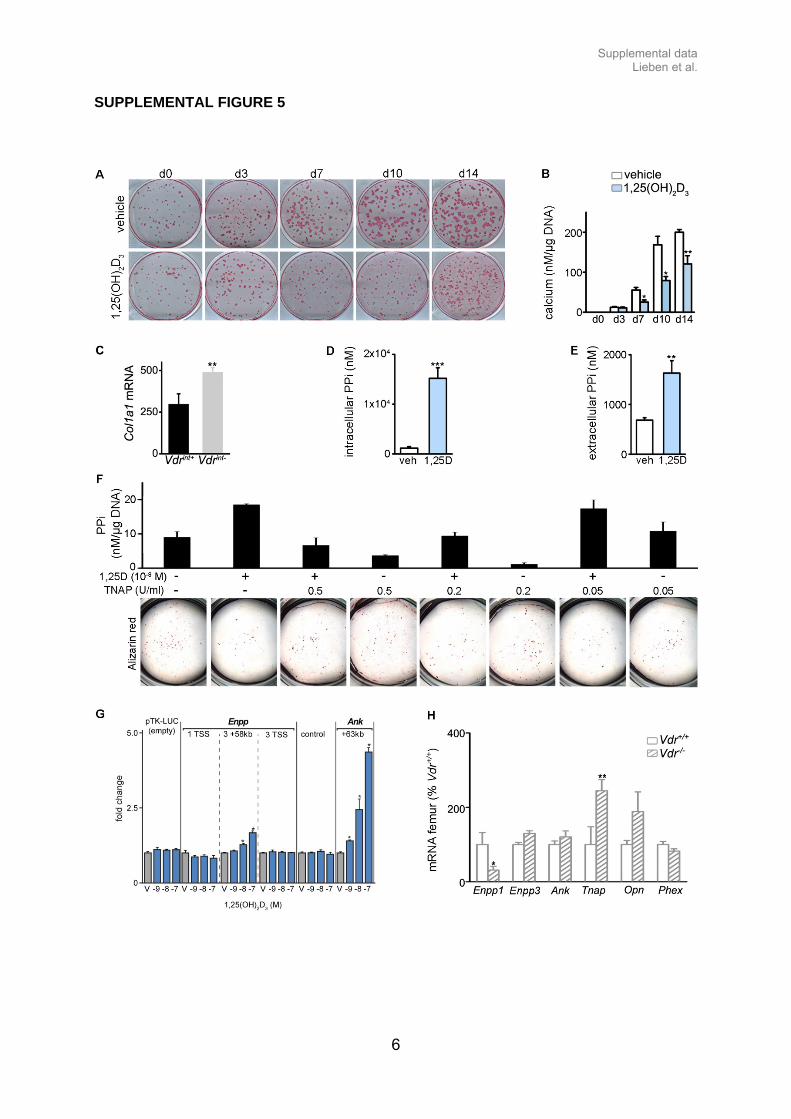
Supplemental Figure 5. 1,25(OH)2D3 suppresses matrix mineralization in MC3T3-E1
cultures.
(A-B) Mineralization of MC3T3-E1 cultures after osteogenic differentiation for 3 wk followed
by treatment with vehicle or 10-8 M 1,25(OH)2D3 for 0, 3, 7, 10 or 14 days (d), assessed by
Alizarin red staining (A) and quantification of calcium deposition corrected for DNA content
(B, n=3).
(C) mRNA expression in the femur by qRT-PCR. n=8.
(D-E) PPi levels in MC3T3-E1 cell lysates (intracellular, D) and conditioned medium
(extracellular, E) after treatment with vehicle (veh) or 10-8 M 1,25(OH)2D3 (D3) for 72 hours,
and corrected for DNA content. n=5.
(F) Quantification of PPi levels in conditioned medium, corrected for DNA content, and
visualization of mineralization by Alizarin red staining in differentiated Vdr+/+ osteoblasts
following treatment for 4 days with vehicle (veh) or 10-8 M 1,25(OH)2D3 (D3) in combination
with different concentrations of TNAP as depicted. n=3.
(G) The luciferase activity, corrected for β-galactosidase, in vehicle- or 1,25(OH)2D3-treated
(16h) MC3T3-E1 cells transfected with a luciferase-reporter including the TSS of Enpp1 (1
TSS), the +58 kb peak and the 3 TSS of/in Enpp3, a control sequence or the +63 kb peak of
Ank. n=6; * P<0.05 vs. vehicle-treatment within each construct.
(H) Femoral mRNA levels analyzed by qRT-PCR. n=8.
Supplemental data Lieben et al.
8
SUPPLEMENTAL FIGURE 6
Supplemental data Lieben et al.
9
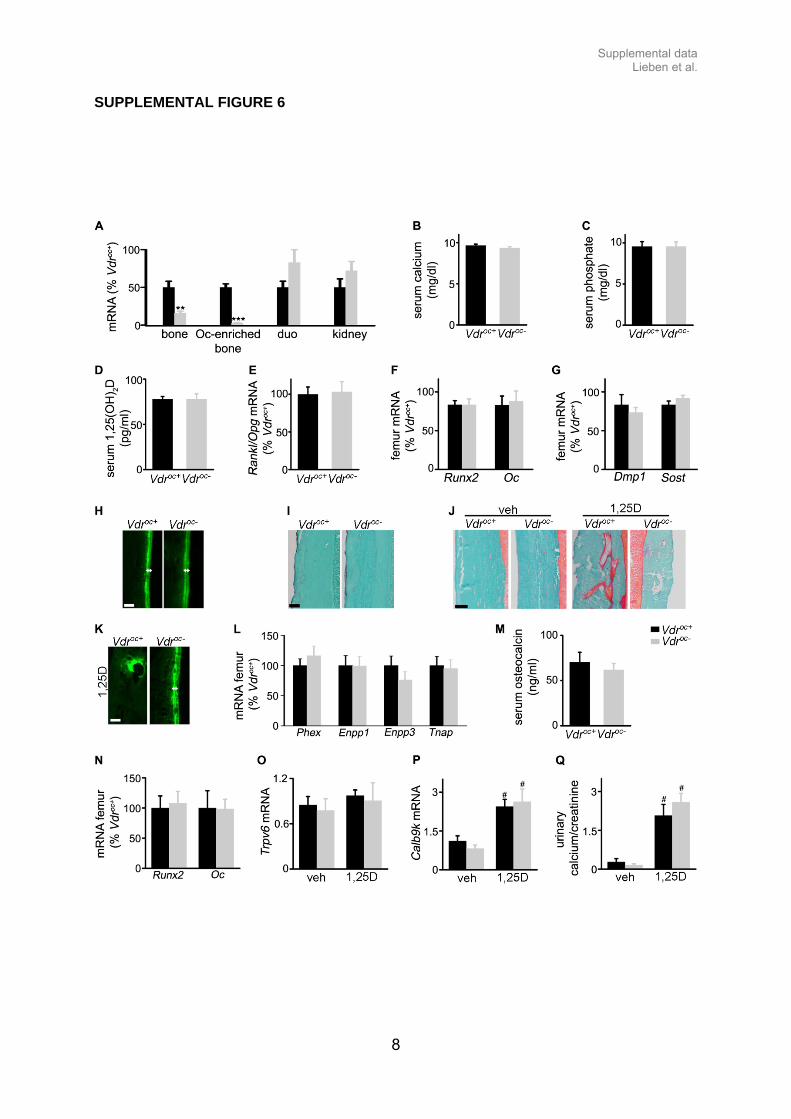
Supplemental Figure 6: Phenotype of non-treated and 1,25(OH)2D3-treated Vdroc- mice.
(A) Vdr mRNA expression, analyzed by qRT-PCR, in different tissues of Vdroc+ and Vdroc-
mice. Oc, osteocyte; duo, duodenum; n=4.
(B-D) Serum calcium (B, n=8), phosphate (C, n=8) and 1,25(OH)2D (D, n=5) levels of Vdroc+
and Vdroc- mice.
(E-G) qRT-PCR analysis of the mRNA expression in the femur of Vdroc+ and Vdroc- mice,
showing the Rankl/Opg ratio (E), osteoblastic (F), and osteocytic (G) differentiation markers.
n=8.
(H and K) Calcein labeling in non-treated (H) and 1,25(OH)2D3-treated (K) mice, showing
defective mineral incorporation in the cortex of 1,25(OH)2D3-treated Vdroc+ mice.
(I) TRAP staining of the cortex of Vdroc+ and Vdroc- mice.
(J) Goldner staining of the cortex of vehicle- and 1,25(OH)2D3-treated mice, showing
excessive osteoid in Vdroc+ mice.
(L and N) qRT-PCR analysis of the mRNA expression in the femur of 1,25(OH)2D3-treated
Vdroc+ and Vdroc- mice, showing mineralization inhibitors (L) and osteoblastic differentiation
markers (N). n=6.
(M) Serum osteocalcin levels in 1,25(OH)2D3-treated Vdroc+ and Vdroc- mice. n=5.
(O-P) mRNA expression in the duodenum of vehicle and 1,25(OH)2D3-treated Vdroc+ and
Vdroc- mice, analyzed by qRT-PCR. n=6.
(Q) Urinary calcium levels of vehicle and 1,25(OH)2D3-treated Vdroc+ and Vdroc- mice,
corrected for creatinine. n=5.
Significant differences (P<0.05) are indicated as # vs. vehicle of the same genotype (two-way
ANOVA followed by Fisher’s LSD multiple-comparison test); scale bar: 50µm; 1,25D,
1,25(OH)2D3.
Supplemental data Lieben et al.
10
SUPPLEMENTAL FIGURE 7
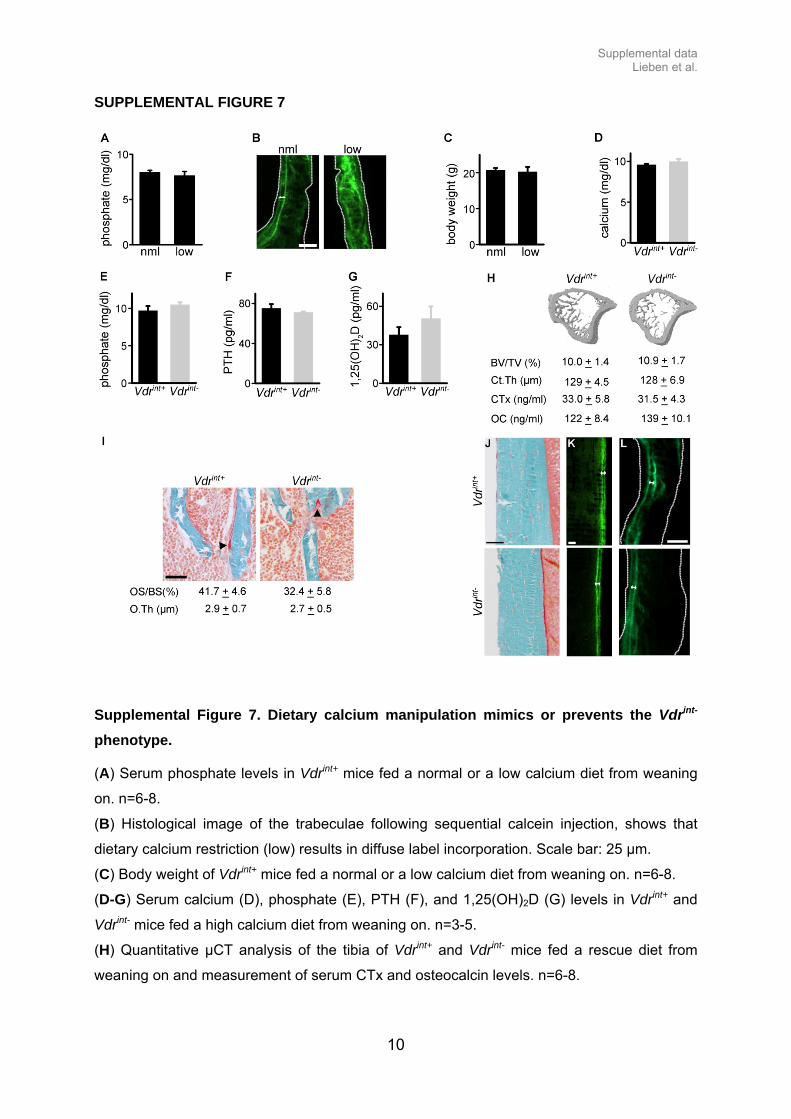
Supplemental Figure 7. Dietary calcium manipulation mimics or prevents the Vdrint-
phenotype.
(A) Serum phosphate levels in Vdrint+ mice fed a normal or a low calcium diet from weaning
on. n=6-8.
(B) Histological image of the trabeculae following sequential calcein injection, shows that
dietary calcium restriction (low) results in diffuse label incorporation. Scale bar: 25 µm.
(C) Body weight of Vdrint+ mice fed a normal or a low calcium diet from weaning on. n=6-8.
(D-G) Serum calcium (D), phosphate (E), PTH (F), and 1,25(OH)2D (G) levels in Vdrint+ and
Vdrint- mice fed a high calcium diet from weaning on. n=3-5.
(H) Quantitative µCT analysis of the tibia of Vdrint+ and Vdrint- mice fed a rescue diet from
weaning on and measurement of serum CTx and osteocalcin levels. n=6-8.

Supplemental data Lieben et al.
11
(I-J) Goldner staining of the trabeculae (I) and cortex (J) of Vdrint+ and Vdrint- mice fed a
rescue diet from weaning on. Quantification of the osteoid surface (OS/BS) and width (O.Th).
n=6; scale bar: 50 µm.
(K-L) Histological images of the cortex (K, scale bar: 10 µm) and trabeculae (L, scale bar: 25
µm) following sequential calcein injection in Vdrint+ and Vdrint- mice fed a rescue diet from
weaning on.
nml, normal calcium diet; low, low calcium diet.
Supplemental data Lieben et al.
12
SUPPLEMENTAL TABLES
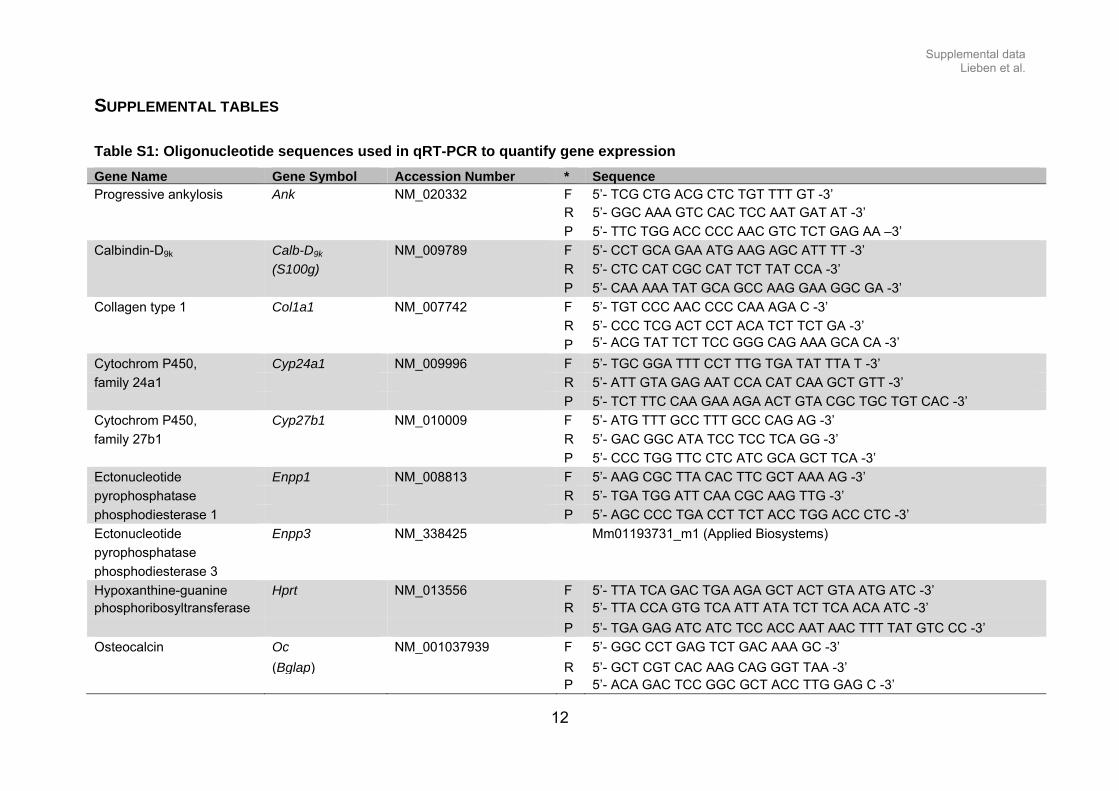
Table S1: Oligonucleotide sequences used in qRT-PCR to quantify gene expression
Gene Name Gene Symbol Accession Number * SequenceProgressive ankylosis Ank NM_020332 F 5’- TCG CTG ACG CTC TGT TTT GT -3’ R 5’- GGC AAA GTC CAC TCC AAT GAT AT -3’
P 5’- TTC TGG ACC CCC AAC GTC TCT GAG AA –3’
Calbindin-D9k Calb-D9k NM_009789 F 5’- CCT GCA GAA ATG AAG AGC ATT TT -3’
(S100g) R 5’- CTC CAT CGC CAT TCT TAT CCA -3’
P 5’- CAA AAA TAT GCA GCC AAG GAA GGC GA -3’
Collagen type 1 Col1a1 NM_007742 F 5’- TGT CCC AAC CCC CAA AGA C -3’
R 5’- CCC TCG ACT CCT ACA TCT TCT GA -3’
P 5’- ACG TAT TCT TCC GGG CAG AAA GCA CA -3’
Cytochrom P450, Cyp24a1 NM_009996 F 5’- TGC GGA TTT CCT TTG TGA TAT TTA T -3’
family 24a1 R 5’- ATT GTA GAG AAT CCA CAT CAA GCT GTT -3’
P 5’- TCT TTC CAA GAA AGA ACT GTA CGC TGC TGT CAC -3’
Cytochrom P450, Cyp27b1 NM_010009 F 5’- ATG TTT GCC TTT GCC CAG AG -3’
family 27b1 R 5’- GAC GGC ATA TCC TCC TCA GG -3’
P 5’- CCC TGG TTC CTC ATC GCA GCT TCA -3’
Ectonucleotide Enpp1 NM_008813 F 5’- AAG CGC TTA CAC TTC GCT AAA AG -3’
pyrophosphatase R 5’- TGA TGG ATT CAA CGC AAG TTG -3’
phosphodiesterase 1 P 5’- AGC CCC TGA CCT TCT ACC TGG ACC CTC -3’
Ectonucleotide Enpp3 NM_338425 Mm01193731_m1 (Applied Biosystems)
pyrophosphatase
phosphodiesterase 3
Hypoxanthine-guanine Hprt NM_013556 F 5’- TTA TCA GAC TGA AGA GCT ACT GTA ATG ATC -3’ phosphoribosyltransferase R 5’- TTA CCA GTG TCA ATT ATA TCT TCA ACA ATC -3’
P 5’- TGA GAG ATC ATC TCC ACC AAT AAC TTT TAT GTC CC -3’
Osteocalcin Oc NM_001037939 F 5’- GGC CCT GAG TCT GAC AAA GC -3’
(Bglap) R 5’- GCT CGT CAC AAG CAG GGT TAA -3’ P 5’- ACA GAC TCC GGC GCT ACC TTG GAG C -3’
Supplemental data Lieben et al.
13
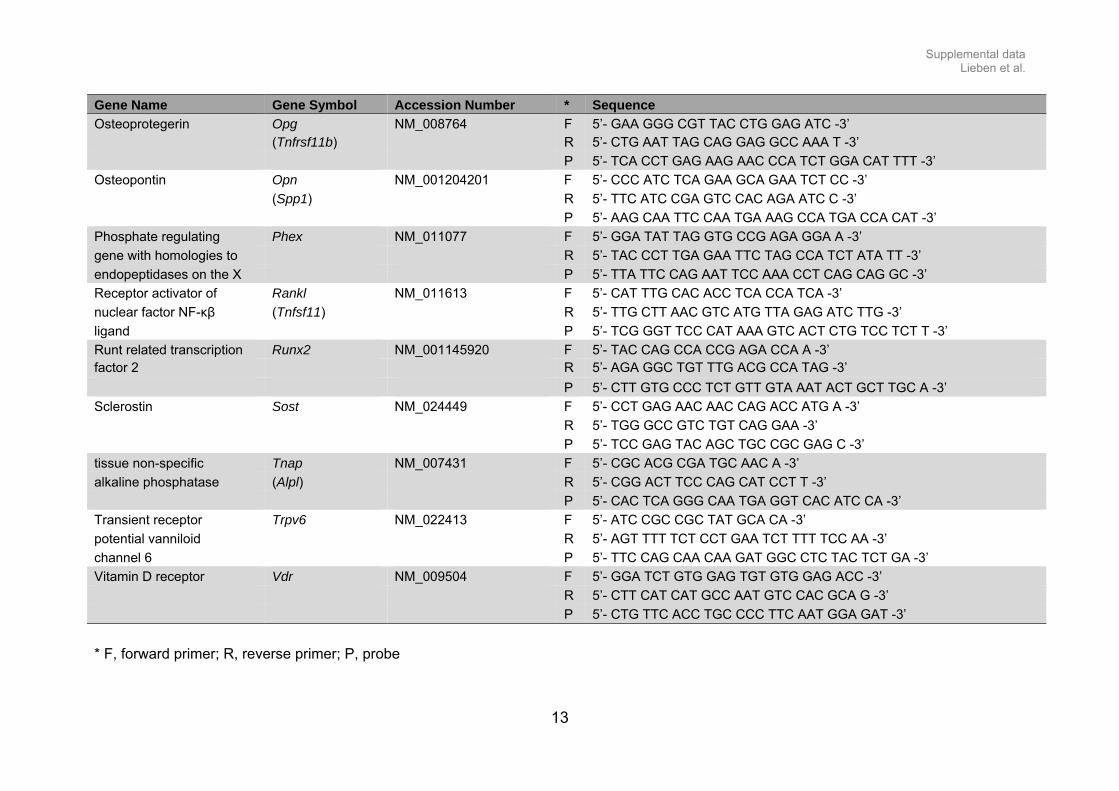
Gene Name Gene Symbol Accession Number * Sequence
Osteoprotegerin Opg NM_008764 F 5’- GAA GGG CGT TAC CTG GAG ATC -3’ (Tnfrsf11b) R 5’- CTG AAT TAG CAG GAG GCC AAA T -3’
P 5’- TCA CCT GAG AAG AAC CCA TCT GGA CAT TTT -3’
Osteopontin Opn NM_001204201 F 5’- CCC ATC TCA GAA GCA GAA TCT CC -3’
(Spp1) R 5’- TTC ATC CGA GTC CAC AGA ATC C -3’
P 5’- AAG CAA TTC CAA TGA AAG CCA TGA CCA CAT -3’
Phosphate regulating Phex NM_011077 F 5’- GGA TAT TAG GTG CCG AGA GGA A -3’
gene with homologies to R 5’- TAC CCT TGA GAA TTC TAG CCA TCT ATA TT -3’
endopeptidases on the X P 5’- TTA TTC CAG AAT TCC AAA CCT CAG CAG GC -3’
Receptor activator of Rankl NM_011613 F 5’- CAT TTG CAC ACC TCA CCA TCA -3’
nuclear factor NF-κβ (Tnfsf11) R 5’- TTG CTT AAC GTC ATG TTA GAG ATC TTG -3’
ligand P 5’- TCG GGT TCC CAT AAA GTC ACT CTG TCC TCT T -3’
Runt related transcription Runx2 NM_001145920 F 5’- TAC CAG CCA CCG AGA CCA A -3’ factor 2 R 5’- AGA GGC TGT TTG ACG CCA TAG -3’
P 5’- CTT GTG CCC TCT GTT GTA AAT ACT GCT TGC A -3’
Sclerostin Sost NM_024449 F 5’- CCT GAG AAC AAC CAG ACC ATG A -3’
R 5’- TGG GCC GTC TGT CAG GAA -3’
P 5’- TCC GAG TAC AGC TGC CGC GAG C -3’
tissue non-specific Tnap NM_007431 F 5’- CGC ACG CGA TGC AAC A -3’
alkaline phosphatase (Alpl) R 5’- CGG ACT TCC CAG CAT CCT T -3’
P 5’- CAC TCA GGG CAA TGA GGT CAC ATC CA -3’
Transient receptor Trpv6 NM_022413 F 5’- ATC CGC CGC TAT GCA CA -3’
potential vanniloid R 5’- AGT TTT TCT CCT GAA TCT TTT TCC AA -3’
channel 6 P 5’- TTC CAG CAA CAA GAT GGC CTC TAC TCT GA -3’
Vitamin D receptor Vdr NM_009504 F 5’- GGA TCT GTG GAG TGT GTG GAG ACC -3’
R 5’- CTT CAT CAT GCC AAT GTC CAC GCA G -3’
P 5’- CTG TTC ACC TGC CCC TTC AAT GGA GAT -3’
* F, forward primer; R, reverse primer; P, probe
Supplemental data Lieben et al.
14
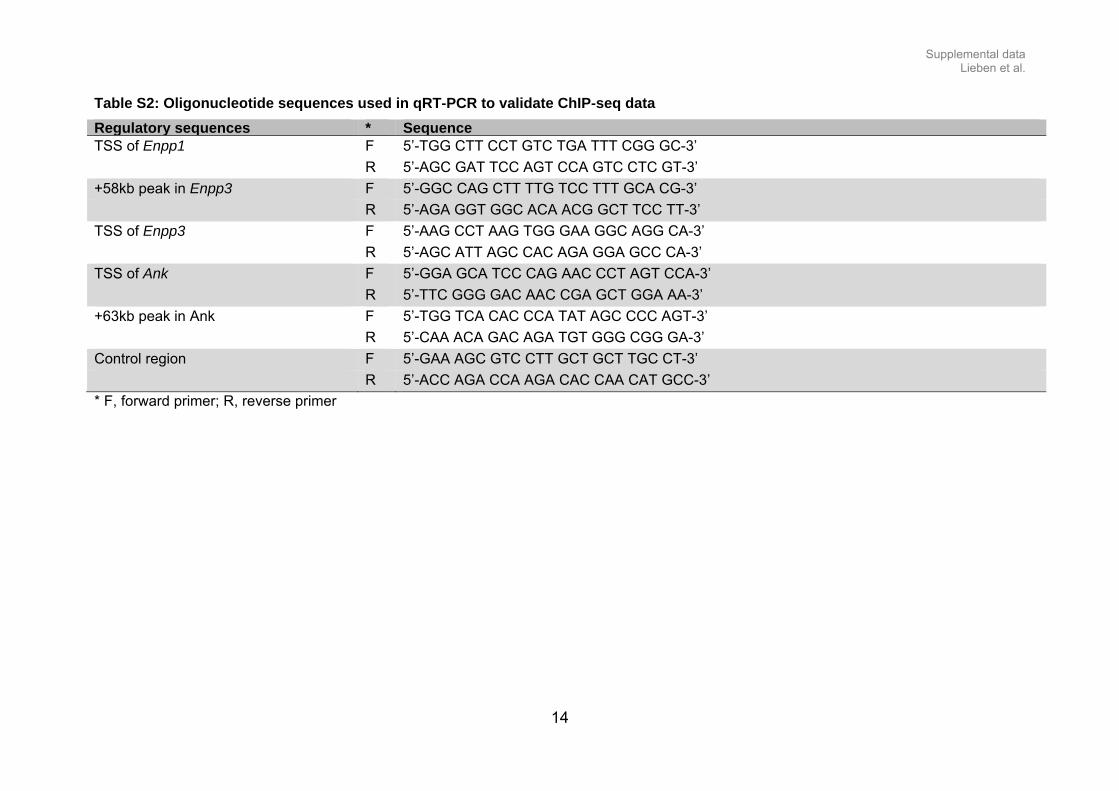
Table S2: Oligonucleotide sequences used in qRT-PCR to validate ChIP-seq data
Regulatory sequences * SequenceTSS of Enpp1 F 5’-TGG CTT CCT GTC TGA TTT CGG GC-3’ R 5’-AGC GAT TCC AGT CCA GTC CTC GT-3’ +58kb peak in Enpp3 F 5’-GGC CAG CTT TTG TCC TTT GCA CG-3’ R 5’-AGA GGT GGC ACA ACG GCT TCC TT-3’ TSS of Enpp3 F 5’-AAG CCT AAG TGG GAA GGC AGG CA-3’ R 5’-AGC ATT AGC CAC AGA GGA GCC CA-3’ TSS of Ank F 5’-GGA GCA TCC CAG AAC CCT AGT CCA-3’ R 5’-TTC GGG GAC AAC CGA GCT GGA AA-3’ +63kb peak in Ank F 5’-TGG TCA CAC CCA TAT AGC CCC AGT-3’ R 5’-CAA ACA GAC AGA TGT GGG CGG GA-3’ Control region F 5’-GAA AGC GTC CTT GCT GCT TGC CT-3’ R 5’-ACC AGA CCA AGA CAC CAA CAT GCC-3’ * F, forward primer; R, reverse primer
Supplemental data Lieben et al.
15
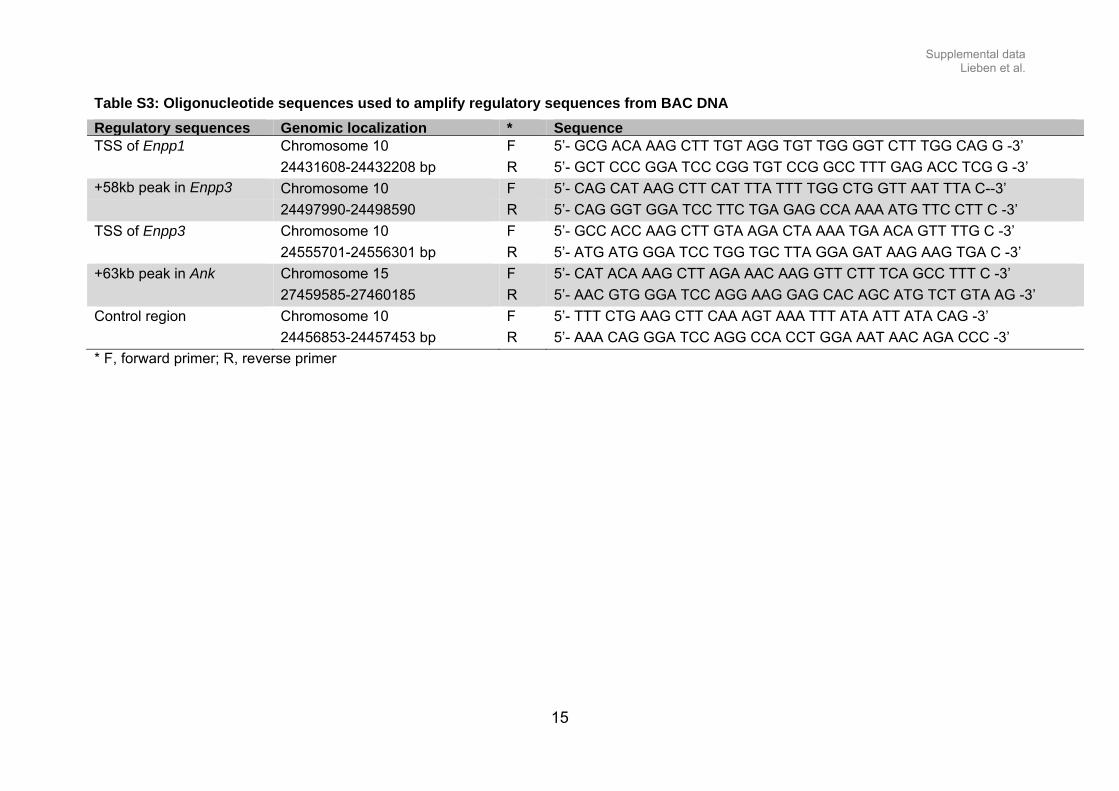
Table S3: Oligonucleotide sequences used to amplify regulatory sequences from BAC DNA
Regulatory sequences Genomic localization * Sequence TSS of Enpp1 Chromosome 10 F 5’- GCG ACA AAG CTT TGT AGG TGT TGG GGT CTT TGG CAG G -3’ 24431608-24432208 bp R 5’- GCT CCC GGA TCC CGG TGT CCG GCC TTT GAG ACC TCG G -3’ +58kb peak in Enpp3 Chromosome 10 F 5’- CAG CAT AAG CTT CAT TTA TTT TGG CTG GTT AAT TTA C--3’ 24497990-24498590 R 5’- CAG GGT GGA TCC TTC TGA GAG CCA AAA ATG TTC CTT C -3’ TSS of Enpp3 Chromosome 10 F 5’- GCC ACC AAG CTT GTA AGA CTA AAA TGA ACA GTT TTG C -3’ 24555701-24556301 bp R 5’- ATG ATG GGA TCC TGG TGC TTA GGA GAT AAG AAG TGA C -3’ +63kb peak in Ank Chromosome 15 F 5’- CAT ACA AAG CTT AGA AAC AAG GTT CTT TCA GCC TTT C -3’ 27459585-27460185 R 5’- AAC GTG GGA TCC AGG AAG GAG CAC AGC ATG TCT GTA AG -3’ Control region Chromosome 10 F 5’- TTT CTG AAG CTT CAA AGT AAA TTT ATA ATT ATA CAG -3’ 24456853-24457453 bp R 5’- AAA CAG GGA TCC AGG CCA CCT GGA AAT AAC AGA CCC -3’ * F, forward primer; R, reverse primer
Supplemental data Lieben et al.
16
SUPPLEMENTAL METHODS
Serum, urine and bone biochemistry
Calcium and phosphate levels in serum, incinerated bone and cell lysates were analyzed by
SYNCHRON Clinical Systems (Beckman Coulter) and corrected for dry weight (bone), or
DNA (cell lysates). Ionized calcium levels were assessed on the ABL725 blood gas analyzer
(Radiometer Medical ApS) directly after sampling of heparinized arterial blood (PICO50
radiometer, Radiometer Medical). Levels of osteocalcin and 1,25(OH)2D were measured
using an in house (1) and 125I 1,25(OH)2D (Diasorin) RIA kit respectively. Serum PTH
(Immutopics), FGF23 (Kainos Laboratories Inc.) and CTx (Nordic Bioscience Diagnosics A/S)
levels were determined by ELISA.
Bone mass measurement and histological analysis
Left tibiae were fixed in Burkhardt’s solution and embedded undecalcified in methyl
methacrylate (MMA). MMA sections (10 µm) were stained according to the von Kossa and
Goldner method or left unstained for dynamic histomorphometry. Right tibiae were fixed in
2% paraformaldehyde, decalcified in 0.5 M EDTA (pH 7.4)/PBS prior to dehydration,
embedded in paraffin, and sectioned at 5 µm. Osteoclasts were visualized on paraffin
sections reacted for tartrate resistant acid phosphatase (TRAP) activity (2), and osteoblast
parameters were quantified on H&E stained sections. To analyze dynamic bone parameters,
calcein (16 mg/kg BW; Sigma-Aldrich) was i.p. injected 4 days and 1 day prior to sacrifice.
Histomorphometric analysis was done as previously described (3,4), and expressed
according to the American Society for Bone and Mineral Research standardized
histomorphometry nomenclature (5).
Micro-computed tomography (µCT) analysis of the tibiae was performed ex vivo using the
high resolution SkyScan 1172 system (50 kV, 200 µA, 0.5 mm Al filter). Serial tomographs,
reconstructed from raw data using the cone-beam reconstruction software (NRecon,
v.1.4.4.0; Skyscan), were used to compute trabecular and cortical parameters, respectively
from the metaphyseal and mid-diaphyseal area. A bone standard was used for the calibration
of bone density measurements. Measurements are performed according to the guidelines of
the American Society for Bone and Mineral Research (6).
The concentration of calcium and phosphate surrounding the osteocytes and the mineral
content of the mid-diaphyseal cortices was visualized and semi-quantified on polished, gold-
coated MMA-embedded tibia sections using an environmental scanning electron microscope
(Philips XL30 ESEM FEG) (7). Backscattered electron (BSE) images were used to visualize
bone mineral content variations and energy dispersive X-ray micro-analysis (EDAX) was
used to measure elemental calcium and phosphor (the latter as representative element for
phosphate) by point analyses and line scans.
Supplemental data Lieben et al.
17
RNA extraction
Total RNA of tissues and cell cultures was extracted as previously described (4). The
osteocyte-enriched bone fraction was generated by removal of the bone marrow, and
sequential collagenase A and EDTA digestions of the long bones.
In vitro osteoblast and osteoclast cultures
To assess in vitro osteoblast differentiation and mineralization, CFU fibroblast (CFU-F) and
CFU osteoblast (CFU-OB) in isolated bone marrow cells cultures were quantified following 14
and 21 days culture period in osteogenic conditions (50 µg/ml ascorbic acid, 10 mM ß-
glycerophosphate, 10-8 M dexamethasone) and staining for methyleen blue, alkaline
phosphatase and Alizarin red. To address cell autonomous defects in osteoclastogenesis,
non-adhesive hematopoietic cells, isolated from bone marrow, were cultured in α-MEM
containing 20 ng/ml M-CSF and 100 ng/ml RANKL (Peprotech EC) (day 1) and TRAP
staining was performed at day 6. To investigate the effect of 1,25(OH)2D3 on mineralization,
the osteoblastic MC3T3-E1 cells (Riken Cell Bank, Tsukuba, Japan) were first differentiated
in osteogenic medium for 21 days. After this period, differentiated cells were treated with 10-8
M 1,25(OH)2D3 for 72 hours when pyrophosphate (PPi) levels were determined, or for the
indicated time points when mineralization was analyzed by Alizarin red staining or by
quantification of total calcium levels. All quantifications were performed on 2-3 wells per
group, and repeated 2 to 4 times (4).
ChIP, Chip-seq and analysis of enhancer activity
ChIP using VDR, RXR and non-specific IgG antibodies was performed as described
previously (8). The isolated DNA (Input) and the precipitated DNA (ChIP-DNA) was then
subjected to qRT-PCR with the primers listed in Supplemental Table 2.
ChIP-seq analysis was performed as described (9). The tag density for each factor was
normalized to 1x10⁷ tags and displayed using the UCSC genome browser.
To confirm the responsiveness of the regulatory sequences to 1,25(OH)2D3, luciferase-
reporter construct were generated by cloning the appropriate mouse DNA fragments (400-
600bp) obtained through DNA amplification of BAC DNA with the primers listed in
Supplemental Table 3, into the pTK-LUC+ vector. MC3T3-E1 cells were transfected as
described (10) and analyzed for luciferase and β-galactosidase activity 16 hours after
treatment with vehicle or 1,25(OH)2D3. Luciferase activity was normalized to β-galactosidase
activity.
Supplemental data Lieben et al.
18
Flow cytometry
The number of osteoclast precursors in the bone marrow of 8-wk old mice was determined
by flow cytometry using R-PE-conjugated anti-CD11b and FITC-conjugated anti-Gr-1
antibodies as described (11). Osteoclast precursors were identified as the CD11b+/Gr1-/low
cell population.
Supplemental data Lieben et al.
19
SUPPLEMENTAL REFERENCES
1. Verhaeghe J, Van Herck E, van Bree R, Van Assche FA, Bouillon R. Osteocalcin during
the reproductive cycle in normal and diabetic rats. J Endocrinol.
1989;120(1):143-151.
2. Maes C et al. Impaired angiogenesis and endochondral bone formation in mice lacking the
vascular endothelial growth factor isoforms VEGF164 and VEGF188. Mech
Dev. 2002;111(1-2):61-73.
3. Lieben L et al. Trpv6 mediates intestinal calcium absorption during calcium restriction and
contributes to bone homeostasis. Bone. 2010;47(2):301-308.
4. Masuyama R et al. TRPV4-mediated calcium influx regulates terminal differentiation of
osteoclasts. Cell Metab. 2008;8(3):257-265.
5. Parfitt AM et al. Bone histomorphometry: standardization of nomenclature, symbols, and
units. Report of the ASBMR Histomorphometry Nomenclature Committee. J
Bone Miner Res. 1987;2(6):595-610.
6. Bouxsein ML et al. Guidelines for assessment of bone microstructure in rodents using
micro-computed tomography. J Bone Miner Res. 2010;25(7):1468-1486.
7. Bloebaum RD, Skedros JG, Vajda EG, Bachus KN, Constantz BR. Determining mineral
content variations in bone using backscattered electron imaging. Bone.
1997;20(5):485-490.
8. Kim S, Yamazaki M, Zella LA, Shevde NK, Pike JW. Activation of receptor activator of NF-
kappaB ligand gene expression by 1,25-dihydroxyvitamin D3 is mediated
through multiple long-range enhancers. Mol Cell Biol. 2006;26(17):6469-6486.
9. Meyer MB, Goetsch PD, Pike JW. VDR/RXR and TCF4/beta-Catenin Cistromes in Colonic
Cells of Colorectal Tumor Origin: Impact on c-FOS and c-MYC Gene
Expression. Mol Endocrinol. 2012;26(1):37-51.
10. Meyer MB, Goetsch PD, Pike JW. A downstream intergenic cluster of regulatory
enhancers contributes to the induction of CYP24A1 expression by 1alpha,25-
dihydroxyvitamin D3. J Biol Chem. 2010;285(20):15599-15610.
11. Maes C et al. Placental growth factor mediates mesenchymal cell development,
cartilage turnover, and bone remodeling during fracture repair. J Clin Invest.
2006;116(5):1230-1242.