supplemental feasibility study ken’s auto wash ellensburg
TRANSCRIPT

Supplemental Feasibility Study Ken’s Auto Wash Ellensburg, Washington Prepared for Ken’s Auto Wash June 13, 2013 7168-11


Hart Crowser Page i 7168-11 June 13, 2013
CONTENTS Page
1.0 INTRODUCTION 1
1.1 Updated Site Description and Use 1 1.2 Previous Preferred RI/FS Cleanup Alternative 1 1.3 Interim Action Plan Summary 2
2.0 CURRENT NATURE AND EXTENT OF CONTAMINATION 2
2.1 Natural Attenuation Assessment 3 2.2 IAP Performance Assessment Summary 4
3.0 UPDATED IDENTIFICATION OF CLEANUP TECHNOLOGIES 5
3.1 Technology Screening 5 3.2 Remedial Alternative Descriptions 6 3.3 Evaluation of Alternatives 11
4.0 PREFERRED REMEDIAL ALTERNATIVE IDENTIFICATION 12
5.0 REFERENCES 13
TABLES 1 Groundwater Monitoring Schedule Since 2006 RI/FS 2 Summary of Groundwater Analytical Data – TPH-G, BTEX, and Lead 3 Measured Product Thickness in Wells MW-1/MW-14 4 Summary of Groundwater Natural Attenuation and Interim Action Data 5 September 2003 – November 2010 Averaged Data 6 Natural Attenuation Electron Acceptor/Demand Calculations 7 Updated Remedial Alternative Evaluation – Compliance with WAC 173-340-360 8 Monitoring Schedule for Preferred Alternative FIGURES 1 Vicinity Map 2 Site and Exploration Plan

Hart Crowser Page 1 7168-11 June 13, 2013
SUPPLEMENTAL FEASIBILITY STUDY KEN’S AUTO WASH ELLENSBURG, WASHINGTON
1.0 INTRODUCTION
This Supplemental Feasibility Study (SFS) presents an updated review of key technical considerations for addressing petroleum hydrocarbon impacts at the Ken’s Auto Wash site in Ellensburg, Washington (Figure 1). This review includes an expanded evaluation of remedial alternatives identified in Hart Crowser’s November 14, 2006, Remedial Investigation and Feasibility Study (RI/FS).
The 2006 RI/FS presented detailed results of the sampling and analysis program and detailed evaluations of a range of potential cleanup actions at the site. This SFS builds upon, but does not duplicate, the RI/FS. Please refer to the RI/FS for a more complete discussion of site characterization, data, analysis, and previous engineering evaluations.
1.1 Updated Site Description and Use
Ken’s Auto Wash (the site) is located at 1013 East University Way in Ellensburg, Washington (Figure 2), at the northwest corner of East University Way and Alder Street. The property, a former gas and service station, covers approximately 15,000 square feet (0.35 acre). The site is currently occupied by Ken’s Auto Wash (a three-stall car wash) and Winegar’s, (a retail ice cream and coffee shop). The site is paved with concrete beneath the car wash on the southern half of the site and with asphalt to the north and east of the car wash and retail shop. Properties to the west and south are unpaved and are commonly used for parking.
1.2 Previous Preferred RI/FS Cleanup Alternative
When the RI/FS was submitted to the Washington State Department of Ecology (Ecology) in 2006, monitored natural attenuation (MNA) with passive product recovery was identified as the most practicable option for addressing historical petroleum hydrocarbon releases at the site. While the submitted RI/FS did not complete the formal Ecology review process, the preferred RI/FS cleanup action was implemented. MNA performance has been assessed through periodic groundwater monitoring that includes ongoing

Hart Crowser Page 2 7168-11 June 13, 2013
assessment of plume stability, monitoring for free product, and evaluating natural petroleum degradation.
1.3 Interim Action Plan Summary
During 2010, Hart Crowser reviewed MNA progress since 2006. The review determined that the flux of native electron acceptors (e.g., dissolved oxygen, nitrate, and sulfate) may not be sufficient to achieve remediation within a reasonable time frame, altering conclusions related to remedy cost and effectiveness. A summary of this review is provided in Section 2.1. Since the RI/FS was submitted, several enhanced attenuation technologies have increased the applicability of more aggressive techniques to address residual contamination at the site.
During 2011, an Interim Action was conducted to evaluate applicability of a new bioremediation technology: enhanced anaerobic oxidation (EAO). As part of this evaluation, groundwater concentrations of natural oxidants (nitrate and sulfate) were increased. Additional petroleum-degrading microbes, nutrients, and conservative tracers were introduced, and surfactant was injected at strategic locations along the petroleum plume axis. Based on the results of the Interim Action, EAO has been additionally identified as a viable cleanup technology for the site. This SFS incorporates the new EAO approach and reevaluates these technologies to select a final remedy.
2.0 CURRENT NATURE AND EXTENT OF CONTAMINATION
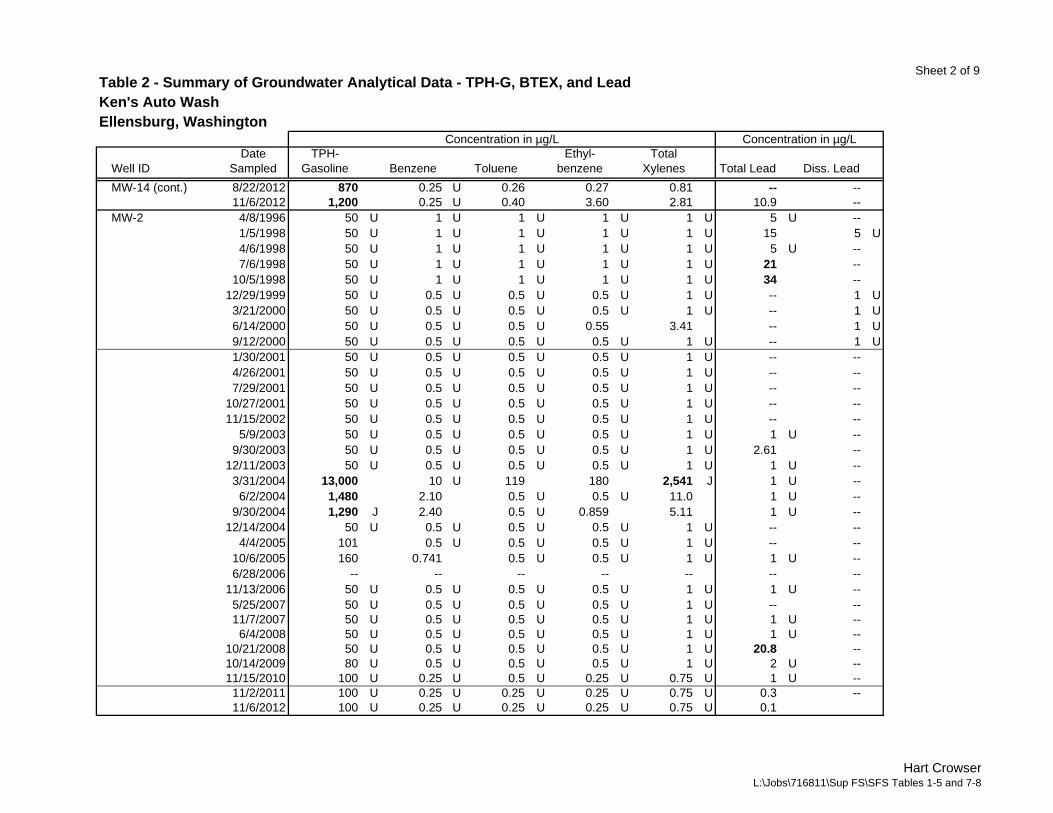
Groundwater monitoring has been conducted since submittal of the RI/FS in accordance with the schedule in Table 1. The focus of the monitoring program was to assess natural attenuation performance as it relates to the RI/FS list of potential chemicals of concern. These include gasoline-range total petroleum hydrocarbons (TPH-G), benzene, toluene, ethylbenzene, xylene (BTEX), and lead. No additional soil data have been collected since the RI/FS.
Based on groundwater elevation and TPH-G concentration data trends, most of the residual contamination remains in two areas, in unexcavated soil between MW-4R and MW-14 and near the top of the smear zone under the street and sidewalk north of MW-6 (Figure 2 and Table 2). This remaining source material is likely contributing to periodic exceedances of Model Toxics Control Act (MTCA) Method A groundwater cleanup levels for TPH-G near wells MW-14 and MW-6. Benzene has not been detected in groundwater at the site since October 2008, including during surfactant application that was

Hart Crowser Page 3 7168-11 June 13, 2013
implemented as part of the 2011 EAO Interim Action. Measurable free product has not been identified at the site since 2004 (Table 3), making free product recovery unnecessary.
2.1 Natural Attenuation Assessment
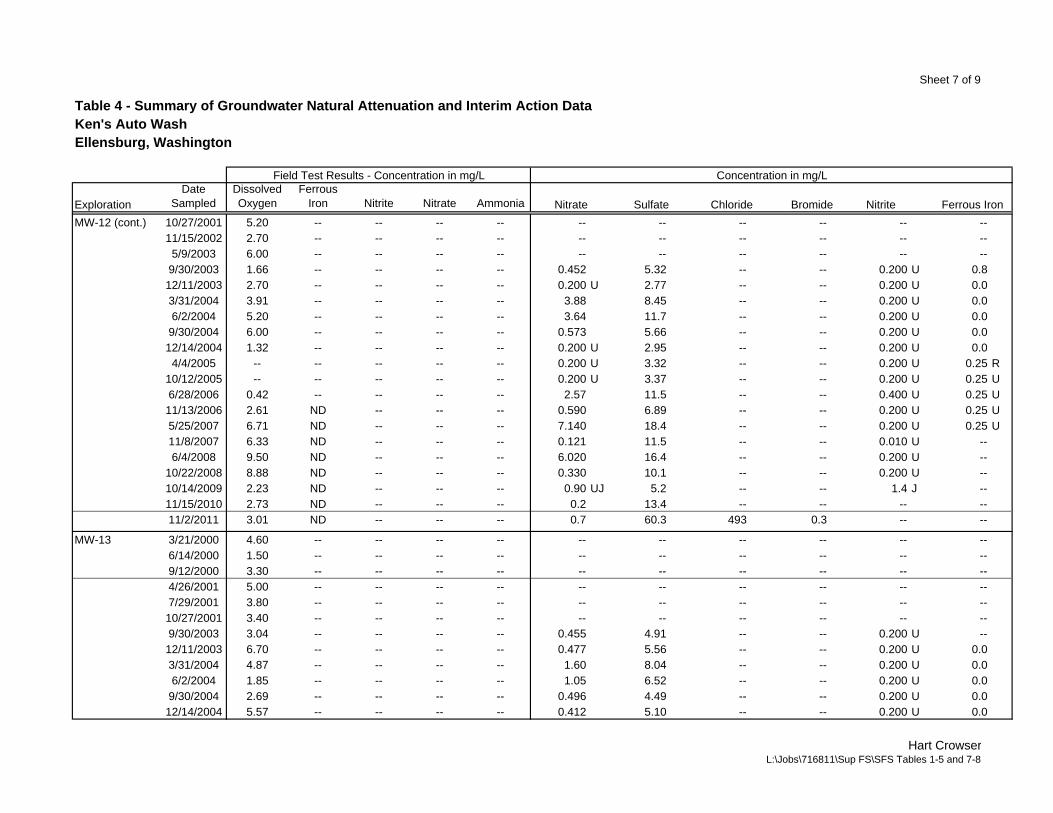
A comprehensive summary of data related to natural attenuation parameters are presented in Table 4, including dissolved oxygen (DO), nitrate, nitrite, sulfate, and ferrous iron concentrations. The groundwater concentration of key natural attenuation oxidants were averaged from September 2003 through November 2010 and presented in Table 5. This data aided in evaluating natural oxidant flux through on to the site, oxidant utilization across the site, and more accurately predict project-specific attenuation time frames. For averaging purposes, non-detect results used the detection limit. Ferrous iron data was not assessed. The migration of oxidized iron into contaminated areas is not likely to be a significant source of petroleum oxidation.
Complete attenuation calculations are presented in Table 6. In general, the concentrations presented in Table 5 represent a very low mass of available natural electron acceptors moving onto the site. Therefore, the ability of native microbes to generate appreciable natural attenuation activity is very limited. Ideal background oxidant concentrations would be 9 mg/L of DO, 10 mg/L of nitrate, and 100-200 mg/L of sulfate. These higher concentrations of electron acceptors would support more aggressive petroleum oxidation.
In addition to poor natural electron acceptor availability, the small concentration declines indicate that use of available oxidants across the petroleum plume is incomplete. Ideally, DO would be 0 mg/L, nitrate would be non-detect (0.1 mg/L), and sulfate would be non-detect (0.4 mg/L). Incomplete oxidant use can indicate poor microbial activity or poor petroleum bioavailability. As a result of low acceptor availability and poor oxidant use, the more comprehensive assessment of natural attenuation time frames suggests it may be as long as 30 years before concentrations consistently meet cleanup levels.
Calculation Assumptions. Natural electron acceptor data and estimated petroleum concentrations were converted to hydrogen equivalents in order to compare influences equally. Hydrogen equivalent data was then coupled with previous seepage velocity estimates for the site (1.2 feet/day) to more accurately estimate the flux of used oxidants through the estimated residual petroleum mass. During this microbial respiration process, we assumed that 50 percent of natural electron acceptor flux would be used for complete
Hart Crowser Page 4 7168-11 June 13, 2013
petroleum respiration (destruction) while the energy present in the remainder of the petroleum would be used for cellular maintenance, division, or released as volatile fatty acids (VFAs) for downgradient oxidation.
Although the mixed monitoring well interval may have concentrations of only 1.0 to 2.0 mg/L, calculations assumed that a discrete, 3-foot interval of the upper smear zone would exhibit a higher seasonal TPH-G pore volume concentration. Diffusion and dispersion reduces this discrete concentration on an aquifer-wide basis, but degradation rates are dictated by the flux of oxidants through this contaminated zone. To reliably achieve cleanup goals, calculations assumed an effective reduction of 3.0 mg/L in the top 3 feet of smear zone across an estimated 5,500 square feet of impacted soil. Calculations were not adjusted to account for seasonal contact of natural oxidants with the top of the smear zone.
2.2 IAP Performance Assessment Summary
Interim Action-related parameters are also presented in Table 4, including bromide and chloride tracers, and pre-injection screening for ferrous iron, nitrate, nitrite, and ammonia via colorimetric field kits. This data was used to assess petroleum response, amendment distribution, groundwater travel times, and amendment consumption across the treatment zone. The data suggest that methods deployed during the Interim Action did not result in mobilization of petroleum or migration of amendment outside of the existing plume footprint.
Groundwater data (Table 2) suggest that significant petroleum destruction was achieved because of the EAO remediation technique. This conclusion is based on the following observations.
Decreasing petroleum concentrations during seasonal high water table levels (late spring) while under the influence of surfactants and microbially mediated desorption. Lower maximum concentrations under these conditions are an indirect indicator of lower petroleum mass adsorbed to the soil matrix.
Field observations of significant bicarbonate formation. Under neutral pH conditions, carbon dioxide produced from petroleum oxidation can spontaneously form bicarbonate anions. These observations were made during attempts to preserve some samples collected in petroleum-impacted areas after EAO amendment injections. The addition of acid preservative to bicarbonate-rich groundwater caused carbon dioxide bubbling in the samples.

Hart Crowser Page 5 7168-11 June 13, 2013
Note that petroleum concentrations observed in monitoring well MW-14 are believed to be biased high through November 2012 because the source area is still under the influence of amendment injections into MW-4R and MW-3. Under more normal two-phase equilibrium (i.e., adsorbed versus dissolved), petroleum concentrations are likely to be much lower and more directly indicative of reduced petroleum mass. We would expect to see a more normal equilibrium once oxidant concentrations and conductivity return to baseline (pre-injection) conditions. While oxidant loading is a more direct measure of inferred biological activity/desorption, conductivity is an indirect measure of amendment movement due to nutritive salts, iron-cycling, and VFA formation. We typically assume this amended/altered groundwater may still contain some concentration of introduced surfactant.
3.0 UPDATED IDENTIFICATION OF CLEANUP TECHNOLOGIES
The 2006 RI/FS developed a range of cleanup alternatives for possible application at the site. Since the 2006 RI/FS preparation, additional technologies have been developed or refined, potentially making them applicable to the site. An updated assessment of these technologies is provided below.
3.1 Technology Screening
We identified the following remediation technologies to be potentially applicable for addressing remaining petroleum contamination.
Natural Attenuation. Natural attenuation relies on the natural flux of electron acceptors such as molecular oxygen, nitrate, sulfate, and carbon dioxide to biologically degrade remaining petroleum hydrocarbons. This process relies on native bacteria to use these electron acceptors over time without any intervention.
Enhanced In Situ Bioremediation. This technology relies primarily on the addition of electron acceptors (oxidants) into soil and/or groundwater to biologically degrade residual petroleum hydrocarbons. Surfactants, nutrients, or specialized microbes may also be added and introduced via periodic slug injections or continuous recirculation. Oxygen could be added to groundwater using air or ozone sparging, direct oxygen infusion, or oxygen release compound (ORC) injection. Nitrate and sulfate could also be added as lower-energy electron acceptors, as was completed during the EAO interim action.

Hart Crowser Page 6 7168-11 June 13, 2013
In Situ Chemical Oxidation. This technology relies on the introduction of strong chemical oxidants such as ozone, persulfate, or peroxides, to chemically react and destroy residual petroleum hydrocarbons. As part of this process, the oxidation byproducts (e.g., molecular oxygen, sulfate) can provide secondary degradation via enhanced bioremediation.
Soil Vapor Extraction. Soil vapor is physically removed from the subsurface. Volatile contaminants in soil evaporate, and the vapor is treated above ground. An increased flow of oxygen that is induced by a vacuum into the subsurface stimulates secondary biodegradation of petroleum hydrocarbons.
Air Sparging. Atmospheric air or air that is enriched with oxygen or ozone is bubbled into the groundwater. Oxygen in the introduced air dissolves into the groundwater and stimulates biodegradation of remaining petroleum hydrocarbons. Ozone provides some level of chemical oxidation, which produces oxygen as a byproduct. Some volatile contaminants in groundwater evaporate into the injected air and are transported into the vadose zone.
While in situ chemical oxidation is a potentially applicable technology, this alternative was screened from further consideration due to uncertain reliability and the cost-effectiveness of the technology to treat the small mass of residual contamination. Chemical oxidation requires direct physical contact between the reactive amendment and petroleum hydrocarbons to be effective. Given that the most recent soil data is from 2005, updated and detailed soil sampling would be required to accurately assess the current distribution of residual petroleum mass to provide cost-effective treatment. This additional cost, along with the high cost of implementation and potential risk to utilities within the treatment zone, eliminated chemical oxidation from further evaluation.
3.2 Remedial Alternative Descriptions
In this section, we reiterate remedial action objectives presented in the 2006 RI/FS and compare updated estimated project costs and preliminary remediation time frames for the four remedial alternatives that could achieve these objectives. MTCA requires, at a minimum, that cleanup actions protect human health and the environment, comply with cleanup standards, comply with applicable state and federal laws, and provide for compliance monitoring. Using the updated technologies identified in Section 3.1, we refined our assessment of remedial alternatives that meet these

Hart Crowser Page 7 7168-11 June 13, 2013
requirements. These alternatives are listed below and are compared in Table 7.
Alternative 1 – Monitored Natural Attenuation;
Alternative 2 – Monitored Natural Attenuation with Passive Product Recovery;
Alternative 3 – Enhanced Biodegradation with Monitored Attenuation; and
Alternative 4 – Air Sparging and Soil Vapor Extraction.
Table 7 also provides updated cost estimates for each of the evaluated alternatives. The level of accuracy of these estimated costs is “order of magnitude,” as defined by the American Association of Cost Engineers. The target accuracy of an order of magnitude estimate is plus 50 percent and minus 30 percent. Construction cost estimates at this level may be used to compare alternatives, but should not be used to plan, finance, or develop projects. Estimated alternative costs were calculated using a present worth analysis assuming a discount rate of 1.1 percent for 5-year returns or less, 2.0 percent for returns between 5 and 10 years, and 2.7 percent for returns greater than 10 years. These discount rates are based on rates from December 2012 listed in the Office of Management and Budget Circular A-94. Nominal estimated Ecology oversight costs are included for each alternative. Costs include a contingency for replacing up to three monitoring wells over the lifetime of each alternative.
Note that estimated costs are for comparing alternatives and do not include costs for preparation and review of deliverables associated with a second Agreed Order, if issued by Ecology, to complete remediation. Tasks may include preparation of a Cleanup Action Plan, interaction with Ecology, and related project management. Costs are expected to be comparable for Alternatives 1 and 2, which are estimated to be in the $15,000 to $30,000 range. Costs for Alternatives 3 and 4 may also be comparable and are estimated to be in the $25,000 to $50,000 range.
Alternative 1 - Monitored Natural Attenuation
Monitored natural attenuation consists of allowing naturally occurring processes such as dilution, dispersion, adsorption, and subsequent biodegradation to destroy petroleum mass and reduce concentrations. As discussed above, this process is currently occurring at the site under extended time frames due to low natural oxidant flux and incomplete use of
Hart Crowser Page 8 7168-11 June 13, 2013
available oxidants. However, this approach is potentially effective at the site under extended time frames.
Continued periodic groundwater monitoring would be required to verify the destruction of contaminants and to confirm that the contaminant plume in groundwater does not expand. Continued monitoring for DO, nitrate, and sulfate constituents would indicate the degree of microbial use of these natural oxidants for ongoing biodegradation.
This approach provides minimal site or area impacts. Note that for comparison with Alternative 2, Alternative 1 does not include removal of residual free product that may appear near the source area. As a MTCA requirement, removal of residual free product was included in Alternative 2, as discussed below. A free product monitoring program would continue to ensure that free product does not reappear at well MW-14 and confirm that any potential product is not migrating to downgradient wells. Free product has not been detected in well MW-14 since 2004, which was immediately followed by the UST removal and ORC injection in 2005. There is no indication that free product is present or migrating in the subsurface.
Assuming there are no pockets of free product within the soil matrix at the site, the projected remediation time frame could range between 20 and 30 years. While a current assessment of remaining petroleum mass following the Interim Action is difficult because of stimulated conditions, the 30-year time frame is accurate based on pre-interim action concentrations and natural oxidant use. Estimated costs range from $468,000 to $595,000.
Alternative 2 - Monitored Natural Attenuation with Passive Free Product Recovery
This alternative is similar to Alternative 1 except that a sorbent sock or similar passive recovery device would be placed in any well where free product was observed. If free product remains in the subsurface, natural attenuation time frames to meet MTCA Method A groundwater cleanup levels would likely be much longer. Free product represents a substantial petroleum mass to be degraded under site-specific conditions. Although not observed since 2004, free product may still be present near the southern border of the UST excavation or may have migrated over time to locations under University Way. Active free product recovery is not viable, nor is it expected to be necessary because only a small amount of free product has been historically observed at the site. Passive free product recovery would minimize the potential for petroleum product migration and would reduce

Hart Crowser Page 9 7168-11 June 13, 2013
natural attenuation time frames compared to not removing measurable product.
Assuming no product is present, a 20-year minimum was used for cost estimating purposes, consistent with Alternative 1. If free product is still present, for cost estimating purposes, a 50-year period would be required for reaching target groundwater cleanup levels. Estimated costs range from about $468,000 (assuming no free product is present) to $808,000 (assuming free product is present).
Alternative 3 - Enhanced Biodegradation and Monitored Attenuation
Several treatment strategies were initially considered as part of this alternative. These include direct injection of amendments into areas of suspected contamination; closed-loop groundwater recirculation of soluble amendments; and a series of amendment injections. These technologies were all considered as potentially viable approaches to enhancing biodegradation. However, because of the extensive gravel fill material in key areas of contamination at the site, amendment injections into existing infrastructure was selected as the preferred approach for accelerating petroleum biodegradation. Based on the apparent success of the EAO interim action, alternative 3 is modeled after lessons learned during implementation.
The preferred enhanced biodegradation approach complements anaerobic processes already occurring at the site, including denitrification and sulfate reduction. The preferred approach includes introduction of high-solubility nitrate and sulfate salts into groundwater to improve oxidant availability; introducing non-pathogenic microbes and nutrients to rapidly populate the subsurface with microbes capable of using natural and injected oxidants; and surfactants to improve bioavailability of weathered petroleum hydrocarbons. Amendments would be dosed into the aquifer using existing infrastructure and based upon anticipated changes in groundwater elevations over the subsequent quarter. Passive migration of oxidants along the plume axis and through gravel backfill areas would rapidly degrade remaining petroleum hydrocarbons in groundwater and on soil.
This approach has a couple of advantages over oxygen delivery methods such as ORC, direct oxygen introduction via recirculation, or oxygen infusion. First, nitrate and sulfate have saturation limits that are orders of magnitude higher than dissolved oxygen, resulting in greater potential treatment effectiveness per injection. Second, native microbes are more likely to use

Hart Crowser Page 10 7168-11 June 13, 2013
dissolved oxygen for shifting geochemistry back to aerobic conditions, including re-oxidation of sulfides, mineralized ferrous iron, manganese (II), or ammonium/nitrite within the treatment zone. All these processes compete with petroleum oxidation and increase treatment effort/duration. While nitrate can re-oxidize iron and manganese, once nitrate is consumed and sulfate dominates as the most abundant oxidant, these minerals are reduced again to help oxidize petroleum. This process is known as metals cycling and engages a broader group of microbes than relying on sulfate alone.
Because the preferred nitrate/sulfate approach has minimal impact on site geochemistry, there is greater risk of overtreatment and subsequent migration of amendment beyond the plume boundary and in to the redox recovery zone south of University Way. Once in this area, there is increased risk that the oxidants won’t be consumed and will dilute out into the broader aquifer. To address this risk, this alternative assumes wet season amendment injections and includes the option of monitored natural attenuation polishing. With microbes more active, natural oxidant use is likely to be enhanced.
To assess performance, quarterly groundwater monitoring would be conducted during periods of amendment application or while nitrate and/or sulfate concentrations are high enough that they could pose a risk of off-site migration. Any incidental amendment mass that does migrate off the site poses minimal risk to the public based on our review of well logs in the area. During preparation of the underground injection permit required to perform the interim action, we found the nearest groundwater supply was approximately 1,500 feet west of the site and was used for irrigation. No surface water impacts are anticipated.
If the site entered monitored attenuation and the risk of off-site migration no longer exists, semiannual seasonal monitoring would resume. The active injection monitoring scope is comparable to that of monitored natural attenuation except the field kit sampling would be discontinued.
For cost-comparison purposes, we estimate that amendment application would be completed within 5 years, 200 pounds of free product is present, five injection wells would be redeveloped, and monitored attenuation could continue for another 5 years after active treatment. Under this alternative, the presence of free product has a reduced influence on total alternative costs and duration as the introduced surfactants and microbial activity would quickly dissolve the product and make it more bioavailable for oxidation/destruction. Small increases in amendment dosing could successfully address this additional mass. Amendment applications may be

Hart Crowser Page 11 7168-11 June 13, 2013
limited to high-water periods of the year to maximize contact with upper reaches of the smear zone. The full estimated cost of this alternative is up to $490,000. If post-interim action data suggests only 5 years of natural attenuation and no well replacements are required, the low end of anticipated costs is $194,000.
Alternative 4 - Air Sparging and Soil Vapor Extraction
Two aggressive technologies were identified in the Focused Feasibility Study and detailed in the 2006 RI/FS: (1) air sparging; and (2) air sparging combined with soil vapor extraction (SVE). These technologies remain applicable for the site and no substantive updates in 2006 RI/FS Alternative 4 scope or effort were identified. However, during implementation of the Interim Action, changes at the site obscured the location of the previously installed air sparging pipe, potentially burying the pipe under new asphalt and concrete. We assume that another set of sparge lines would need to be installed, if necessary.
Implementing this alternative would require installing four vapor extraction wells, five sparging wells, piping, and a secure equipment compound containing a sparging blower, SVE blower, knockout drum, 500-gallon condensate collection tank, and control panel. Sound enclosures would be placed around the blowers, but the blowers would still be audible when running.
The updated estimated cost for this alternative, based on an operating lifetime of 5 to 7 years for comparative purposes including 1 year of monitoring, ranges from about $448,000 to $530,000. The estimated operating lifetime is based on our experience at similar sites with comparable conditions, and is intended for cost comparison and planning purposes only.
3.3 Evaluation of Alternatives
These four proposed alternatives would meet the threshold requirements for cleanup actions outlined in WAC 173-340-360 (2)(a): they protect human health and the environment, comply with cleanup standards, comply with applicable state and federal laws, and provide for compliance monitoring. In Table 7, we evaluate each of the four alternatives described in Section 7.2 based on their use of permanent solutions to the maximum extent practicable and on the ability of each alternative to provide for restoration in a reasonable time frame following the criteria described in WAC 173-340-360.

Hart Crowser Page 12 7168-11 June 13, 2013
Alternative 1 meets the criteria described in WAC 173-340-360, except if free product is discovered in the future. Alternative 2 provides additional control and removal of free product, but the presence of free product may result in a substantially elongated project lifetimes due to slow attenuation rates. Alternatives 3 and 4 would provide significantly faster source removal than Alternative 1 or 2, but Alternative 4 has disproportionately higher costs and resource utilization.
It should be noted that Alternatives 3 or 4 could achieve cleanup goals faster than the conservatively estimated time projections. While there have been significant advancements in in situ treatments, there is no assurance of this outcome.
4.0 PREFERRED REMEDIAL ALTERNATIVE IDENTIFICATION
Alternative 3 - Enhanced Biodegradation and Monitored Natural Attenuation was identified as the preferred remedial alternative. This alternative provides for a more reasonable restoration time frame in accordance with WAC 173-340-360(4).
Recent monitoring data indicates that the Interim Action mobilized a substantial petroleum mass from the source area soil matrix and was successful in stimulating more aggressive oxidation. Injected oxidants have not been detected at MW-13, the downgradient compliance monitoring well, through 2012. While above-baseline levels of sulfate persist in the former source area, additional treatments may be desired to further accelerate attenuation.
This alternative meets site RAOs: it prevents direct contact with contaminated soil by maintaining the existing asphalt and concrete surfaces; eliminates free product to the extent practicable using surfactants and microbial activity; and in relatively short time frames, reduces soil and groundwater concentrations below cleanup levels by natural degradation processes.
Alternative 3 would be sufficiently protective of human health and the environment and is the most cost-effective alternative. It is highly unlikely that injected amendments would migrate to beneficially used groundwater wells, exit to surface water, or pose a risk due to incidental groundwater contact by future construction workers. Contaminants will be completely destroyed in situ while using a minimum of energy and natural resources.

Hart Crowser Page 13 7168-11 June 13, 2013
Monitoring would be conducted to ensure that this alternative remains protective of human health and the environment.
A preliminary monitoring schedule is included in Table 8. This schedule includes the continuation of periodic monitoring for natural attenuation parameters to demonstrate that introduced oxidants are being consumed and contaminants are degraded in situ. Monitoring frequency for wells along the treated plume axis will continue on a quarterly basis while amendments persist above background levels (i.e., historical pre-interim plan concentration ranges). For wells demonstrated to not be influenced by amendment injections along the axis plume, monitoring would be performed annually. Following sufficient oxidant treatment, monitored attenuation of residual concentrations will be conducted on a biannual basis, during wet and dry season conditions.
Every 5 years, in accordance with Ecology policy, we assume that the site data would be reviewed by Ecology to ensure the alternative is still protective of human health and the environment, that the contaminant plume is still contained, that injected amendments have not migrated outside the historical plume boundary, and that groundwater concentration trends show constituent concentrations are decreasing.
5.0 REFERENCES
AFCEE 2004. Principles and Practices of Enhanced Anaerobic Bioremediation of Chlorinated Solvents. Prepared by Air Force Center for Engineering.
DEQ 2006. Risk-Based Concentrations for Individual Chemicals. August 16, 2006.
Hart Crowser 2006. Remedial Investigation and Feasibility Study, Ken’s Auto Wash, 1013 East University Way, Ellensburg, Washington. November 14.
Hart Crowser 2013. Draft Interim Action Plan, In Situ Enhanced Attenuation of Petroleum Hydrocarbons, Ken’s Auto Wash, Ellensburg, Washington. March 1, 2013.
L:\Jobs\716811\Sup FS\Final Supplemental FS.doc

Table 1 - Groundwater Monitoring Schedule Since 2006 RI/FSKen's Auto WashEllensburg, Washington
Well Purpose 2007 2008 2009 2010 2011 2012
MW-2 Bound Plume - East Biannual Biannual a Annual Annual b Annual
MW-3 Background Biannual Biannual a Annual Quarterly b Annual
MW-4/4R Source Area (Upgradient Edge) Biannual Biannual Annual Annual Quarterly b Quarterly
MW-5 Bound Plume - West Biannual Biannual Annual Annual Annual b Annual
MW-6 Plume Extent Biannual Biannual a Annual Quarterly b Quarterly
MW-12 Bound Plume - Southwest Biannual Biannual Annual Annual Annual b Annual
MW-13 Bound Plume - South Biannual Biannual a Annual Annual b Quarterly
MW-14 Source Area Biannual Biannual Annual Annual Quarterly b Quarterly
MW-15 Bound Plume - Southeast Biannual Biannual a Annual Annual b Annual
Notes:Biannual refers to twice yearly events targeted during spring (Q2) and fall (Q4). Annual refers to the fall (Q4) event. Biannual and annual monitoring
schedules were based on estimated seasonal high and low groundwater elevations.Monitoring includes measurement of groundwater elevation and dissolved oxygen and collection of a groundwater sample for analysis by NWTPH-G/BTEX
and total lead.Monitoring also includes field and/or laboratory analysis for natural attenuation parameters nitrate/nitrite, sulfate, and/or ferrous iron.
a Although not required, wells MW-2, MW-3, MW-6, MW-13, and MW-15 were monitored during the fall of 2006 and 2009.
b Quarterly monitoring conducted May 2011 through February 2012 as part of the Interim Action Plan evaluating enhanced anaerobic oxidation. Additional
laboratory analysis included nitrate, sulfate, chloride, and bromide.
Hart CrowserL:\Jobs\716811\Sup FS\SFS Tables 1-5 and 7-8

Sheet 1 of 9Table 2 - Summary of Groundwater Analytical Data - TPH-G, BTEX, and LeadKen's Auto WashEllensburg, Washington
Well IDDate
SampledTPH-
Gasoline Benzene TolueneEthyl-
benzeneTotal
Xylenes Total Lead Diss. Lead
MW-1 4/8/1996 160,000 2,500 19,000 3,000 21,000 65 --1/5/1998 -- -- -- -- -- -- --4/6/1998 100,000 180 260 940 9,800 180 --7/6/1998 93,000 110 200 760 8,800 220 --
10/5/1998 -- -- -- -- -- -- --12/29/1999 21,600 87.4 47.7 657 3,900 -- 21.3
3/21/2000 19,800 94.1 59.6 479 2,710 -- 16.56/14/2000 18,800 94.9 26.4 471 2,870 -- 89/12/2000 21,400 111 35.1 496 2,930 -- 6.54
MW-14 1/30/2001 7,450 19.3 14 424 673 -- --(Replaces MW-1) 4/26/2001 26,100 37.2 29.7 580 2,680 -- --
7/29/2001 14,200 10.3 14.2 318 1,480 -- --10/27/2001 9,970 46.4 4.55 187 707 -- --11/15/2002 8,380 11 2.5 U 122 357 -- --
5/9/2003 4,520 2.62 0.5 U 0.775 172 5.33 --9/30/2003 6,230 J 11.7 J 1.61 J 151 J 369 J 4.56 --
12/11/2003 5,890 12.6 5.0 U 5.0 U 271 12.4 --3/31/2004 6,270 12.6 5 U 80.4 168.4 4.85 --
6/2/2004 3,790 J 2.36 J 0.5 U 26.9 J 88.1 J 4.12 --9/30/2004 5,700 J 5.52 2.5 U 82.1 256 4.29 --
12/14/2004 5,500 J 4.36 0.643 66.1 178 -- --4/4/2005 8,100 J 6.89 0.746 75.8 221 -- --
10/6/2005 4,070 J 7.85 0.5 U 43.1 62.8 3.7 --6/28/2006 533 0.545 0.5 U 0.593 5.34 3.41 --
11/13/2006 496 0.933 0.5 U 6.89 5.99 3.03 --5/25/2007 54 0.5 U 0.5 U 0.5 U 1 U -- --11/7/2007 3,050 7.6 2.58 28.1 20 2.31 --
6/4/2008 50 U 0.5 U 0.5 U 0.5 U 1 U 1 U --10/21/2008 2,040 4.76 0.5 U 16.6 15.1 1.85 --10/14/2009 2,030 12.2 U 0.844 U 18.9 33.8 2 U --11/15/2010 2,500 0.25 U 1.0 UJ 7.6 10.7 1 --
5/2/2011 3,100 1.0 U 1.7 1.4 1.3 -- --7/27/2011 3,700 1.0 U 1.2 3.0 2.8 -- --11/2/2011 1,200 0.25 U 0.3 U 3.4 1.8 2.0 --2/13/2012 2,200 0.25 U 0.25 U 1.8 8.6 -- --5/23/2012 250 U 1.00 U 1.00 U 1.00 U 2.00 U -- --
Concentration in µg/L Concentration in µg/L
Hart CrowserL:\Jobs\716811\Sup FS\SFS Tables 1-5 and 7-8
Sheet 2 of 9Table 2 - Summary of Groundwater Analytical Data - TPH-G, BTEX, and LeadKen's Auto WashEllensburg, Washington
Well IDDate
SampledTPH-
Gasoline Benzene TolueneEthyl-
benzeneTotal
Xylenes Total Lead Diss. Lead
Concentration in µg/L Concentration in µg/L
MW-14 (cont.) 8/22/2012 870 0.25 U 0.26 0.27 0.81 -- --11/6/2012 1,200 0.25 U 0.40 3.60 2.81 10.9 --
MW-2 4/8/1996 50 U 1 U 1 U 1 U 1 U 5 U --1/5/1998 50 U 1 U 1 U 1 U 1 U 15 5 U4/6/1998 50 U 1 U 1 U 1 U 1 U 5 U --7/6/1998 50 U 1 U 1 U 1 U 1 U 21 --
10/5/1998 50 U 1 U 1 U 1 U 1 U 34 --12/29/1999 50 U 0.5 U 0.5 U 0.5 U 1 U -- 1 U
3/21/2000 50 U 0.5 U 0.5 U 0.5 U 1 U -- 1 U6/14/2000 50 U 0.5 U 0.5 U 0.55 3.41 -- 1 U9/12/2000 50 U 0.5 U 0.5 U 0.5 U 1 U -- 1 U1/30/2001 50 U 0.5 U 0.5 U 0.5 U 1 U -- --4/26/2001 50 U 0.5 U 0.5 U 0.5 U 1 U -- --7/29/2001 50 U 0.5 U 0.5 U 0.5 U 1 U -- --
10/27/2001 50 U 0.5 U 0.5 U 0.5 U 1 U -- --11/15/2002 50 U 0.5 U 0.5 U 0.5 U 1 U -- --
5/9/2003 50 U 0.5 U 0.5 U 0.5 U 1 U 1 U --9/30/2003 50 U 0.5 U 0.5 U 0.5 U 1 U 2.61 --
12/11/2003 50 U 0.5 U 0.5 U 0.5 U 1 U 1 U --3/31/2004 13,000 10 U 119 180 2,541 J 1 U --
6/2/2004 1,480 2.10 0.5 U 0.5 U 11.0 1 U --9/30/2004 1,290 J 2.40 0.5 U 0.859 5.11 1 U --
12/14/2004 50 U 0.5 U 0.5 U 0.5 U 1 U -- --4/4/2005 101 0.5 U 0.5 U 0.5 U 1 U -- --
10/6/2005 160 0.741 0.5 U 0.5 U 1 U 1 U --6/28/2006 -- -- -- -- -- -- --
11/13/2006 50 U 0.5 U 0.5 U 0.5 U 1 U 1 U --5/25/2007 50 U 0.5 U 0.5 U 0.5 U 1 U -- --11/7/2007 50 U 0.5 U 0.5 U 0.5 U 1 U 1 U --
6/4/2008 50 U 0.5 U 0.5 U 0.5 U 1 U 1 U --10/21/2008 50 U 0.5 U 0.5 U 0.5 U 1 U 20.8 --10/14/2009 80 U 0.5 U 0.5 U 0.5 U 1 U 2 U --11/15/2010 100 U 0.25 U 0.5 U 0.25 U 0.75 U 1 U --
11/2/2011 100 U 0.25 U 0.25 U 0.25 U 0.75 U 0.3 --11/6/2012 100 U 0.25 U 0.25 U 0.25 U 0.75 U 0.1
Hart CrowserL:\Jobs\716811\Sup FS\SFS Tables 1-5 and 7-8

Sheet 3 of 9Table 2 - Summary of Groundwater Analytical Data - TPH-G, BTEX, and LeadKen's Auto WashEllensburg, Washington
Well IDDate
SampledTPH-
Gasoline Benzene TolueneEthyl-
benzeneTotal
Xylenes Total Lead Diss. Lead
Concentration in µg/L Concentration in µg/L
MW-3 4/8/1996 50 U 1 U 1 U 1 U 1 U 5 U --1/5/1998 50 U 1 U 1 U 1 U 1 U 5 U --4/6/1998 50 U 1 U 1 U 1 U 1 U 5 U --7/6/1998 50 U 1 U 1 U 1 U 1 U 5 U --
10/5/1998 50 U 1 U 1 U 1 U 1 U 3.8 --12/29/1999 50 U 0.5 U 0.5 U 0.5 U 1 U -- 1 U
3/21/2000 50 U 0.5 U 0.5 U 0.5 U 1 U -- 1 U6/14/2000 50 U 0.5 U 0.85 0.5 U 1 U -- 1 U9/12/2000 50 U 0.5 U 0.5 U 0.5 U 1 U -- 1 U1/30/2001 50 U 0.5 U 0.5 U 0.5 U 1 U -- --4/26/2001 50 U 0.5 U 0.5 U 0.5 U 1 U -- --7/29/2001 50 U 0.5 U 0.5 U 0.5 U 1 U -- --
10/27/2001 50 U 0.5 U 0.5 U 0.5 U 1 U -- --11/15/2002 50 U 0.5 U 0.5 U 0.5 U 1 U -- --
5/9/2003 50 U 0.5 U 0.5 U 0.5 U 1 U 1 U --9/30/2003 50 U 0.5 U 0.5 U 0.5 U 1 U 1 U --
12/11/2003 50 U 0.5 U 0.5 U 0.5 U 1 U 1 U --3/31/2004 50 U 0.2 U 0.2 U 0.2 U 0.5 U 1 U --
6/2/2004 50 U 0.5 U 0.5 U 0.5 U 1 U 1 U --9/30/2004 50 UJ 0.5 U 0.5 U 0.5 U 1 U 1 U --
12/14/2004 50 U 0.5 U 0.5 U 0.5 U 1 U -- --4/4/2005 50 U 0.5 U 0.5 U 0.5 U 1 U -- --
10/6/2005 50 U 0.5 U 0.5 U 0.5 U 1 U 1 U --6/28/2006 -- -- -- -- -- -- --
11/13/2006 50 U 0.5 U 0.5 U 0.5 U 1 U 1 U --5/25/2007 50 U 0.5 U 0.5 U 0.5 U 1 U -- --11/8/2007 50 U 0.5 U 0.5 U 0.5 U 1 U 1 U --
6/4/2008 50 U 0.5 U 0.5 U 0.5 U 1 U 1 U --10/21/2008 50 U 0.5 U 0.5 U 0.5 U 1 U 1 U --10/14/2009 80 U 0.5 U 0.5 U 0.5 U 1 U 2 U --11/15/2010 100 U 0.25 U 0.5 U 0.25 U 0.75 U 1 U --
5/2/2011 250 U 1.0 U 1.0 U 1.0 U 2.0 U -- --7/27/2011 250 U 1.0 U 1.0 U 1.0 U 2.0 U -- --11/2/2011 100 U 0.25 U 0.25 U 0.25 U 0.75 U 0.1 U --2/13/2012 100 U 0.25 U 0.25 U 0.25 U 0.75 U -- --11/6/2012 100 U 0.25 U 0.25 U 0.25 U 0.75 U 0.1 U --
Hart CrowserL:\Jobs\716811\Sup FS\SFS Tables 1-5 and 7-8

Sheet 4 of 9Table 2 - Summary of Groundwater Analytical Data - TPH-G, BTEX, and LeadKen's Auto WashEllensburg, Washington
Well IDDate
SampledTPH-
Gasoline Benzene TolueneEthyl-
benzeneTotal
Xylenes Total Lead Diss. Lead
Concentration in µg/L Concentration in µg/L
MW-4 1/5/1998 200 1 U 27 1 3 10 5 U4/6/1998 400 3 14 1 6 5 U --7/6/1998 50 U 1 U 3 1 U 1 U 5 U --
10/5/1998 150 1 U 7 1 U 1 U 2 --12/29/1999 301 51.4 32.5 0.5 U 6.08 -- 1 U
3/21/2000 414 44.8 28.2 1.92 3.2 U -- 1 U6/14/2000 439 69.7 4.91 2.01 6.8 -- 1 U9/12/2000 101 4.49 0.5 U 0.5 U 0.5 U -- 1 U1/31/2001 182 2.22 1.17 U 0.5 U 1.33 U -- --4/26/2001 673 8.79 4.73 4.28 28.6 -- --7/29/2001 402 24.3 16.3 2.84 14.8 -- --
10/27/2001 200 24.9 2.62 1.15 6.57 -- --11/15/2002 75.6 0.858 0.5 U 0.5 U 1 U -- --
5/9/2003 61.8 0.5 U 0.5 U 0.5 U 1 U 1 U --9/30/2003 161 0.730 0.5 U 2.59 2.59 1 U --
12/11/2003 50 U 0.5 U 0.5 U 0.5 U 1 U 3.22 --3/31/2004 267 29.0 1.43 1 U 2.94 1 U --
6/2/2004 140 46.4 4.2 0.5 U 1 U 1 U --9/30/2004 88.7 J 0.5 U 0.5 U 1.83 1 U 1 U --
12/14/2004 50 U 0.5 U 0.5 U 0.5 U 1 U -- --MW-4R 4/4/2005 112 1.93 0.5 U 0.5 U 1 U -- --(Replaces MW-4) 10/6/2005 744 0.929 0.5 U 9.31 3.57 19 --
6/28/2006 50 U 0.5 U 0.5 U 0.5 U 1 U 1 U --11/13/2006 107 0.5 U 0.5 U 0.5 U 1 U 5.82 --
5/25/2007 50 U 0.5 U 0.5 U 0.5 U 1 U -- --11/7/2007 75.2 0.5 U 0.5 U 0.5 U 1 U 0.325 --
6/4/2008 50 U 0.5 U 0.5 U 0.5 U 1 U 1 U --10/21/2008 50 U 0.5 U 0.5 U 0.5 U 1 U 6.98 --10/14/2009 80 U 0.5 U 0.5 U 0.5 U 1 U 2 U --11/15/2010 100 U 0.25 U 0.5 U 0.25 U 0.75 U 1 U --
5/2/2011 250 U 1.0 U 1.6 1.0 U 2.0 U -- --7/27/2011 980 1.0 U 250 1.0 U 2.0 U -- --11/2/2011 100 U 0.25 U 14 0.25 U 0.75 U 0.1 --2/13/2012 100 U 0.25 U 0.25 U 0.25 U 0.75 U -- --5/23/2012 250 U 1.00 U 1.00 U 1.00 U 2.00 U -- --8/22/2012 100 U 0.25 U 0.25 U 0.25 U 0.75 U -- --
Hart CrowserL:\Jobs\716811\Sup FS\SFS Tables 1-5 and 7-8

Sheet 5 of 9Table 2 - Summary of Groundwater Analytical Data - TPH-G, BTEX, and LeadKen's Auto WashEllensburg, Washington
Well IDDate
SampledTPH-
Gasoline Benzene TolueneEthyl-
benzeneTotal
Xylenes Total Lead Diss. Lead
Concentration in µg/L Concentration in µg/L
MW-4R (cont.) 11/6/2012 100 U 0.25 U 0.25 U 0.25 U 0.75 U 0.1 U --MW-5 1/5/1998 6200 1 57 3 160 5 U --
4/6/1998 2800 2 30 2 27 5 U --7/6/1998 50 U 1 U 1 U 1 U 1 U 10 --
10/5/1998 4700 2 39 16 94 7.4 --12/29/1999 779 2.96 0.69 9.03 27.4 -- 1 U
3/21/2000 519 0.5 U 13.9 4.95 3.6 -- 1 U6/14/2000 708 3.45 U 1.17 U 1.08 1 U -- 1 U9/12/2000 50 U 0.5 U 0.5 U 0.5 U 1 U -- 1 U4/26/2001 831 7.35 0.516 15.3 1 U -- --7/29/2001 53.8 0.5 U 0.5 U 0.5 U 1 U -- --
10/27/2001 552 3.29 0.5 U 1.28 1.58 -- --11/15/2002 108 0.5 U 0.5 U 0.5 U 0.5 U -- --
5/9/2003 78.7 0.5 U 0.5 U 0.5 U 1 U 1 U --9/30/2003 229 0.5 U 0.5 U 0.5 U 1.61 1 U --
12/11/2003 50 U 0.5 U 0.5 U 0.5 U 1 U 1 U --3/31/2004 53 0.2 U 0.2 U 0.2 U 0.5 U 1 U --
6/2/2004 92.8 0.5 U 0.5 U 0.5 U 1 U 1 U --12/14/2004 308 0.5 U 0.5 U 0.5 U 1 U -- --
4/4/2005 620 1.45 0.5 U 0.5 U 1.07 -- --10/6/2005 114 0.5 U 0.5 U 0.5 U 1 U 1 U --6/28/2006 50 U 0.5 U 0.5 U 0.5 U 1 U 1 U --
11/13/2006 50 U 0.5 U 0.5 U 0.5 U 1 U 1 U --5/25/2007 50 U 0.5 U 0.5 U 0.5 U 1 U -- --11/7/2007 50 U 0.5 U 0.5 U 0.5 U 1 U 1 U --
6/4/2008 50 U 0.5 U 0.5 U 0.5 U 1 U 1 U --10/22/2008 50 U 0.5 U 0.5 U 0.5 U 1 U 1 U --10/15/2009 80 U 0.5 U 0.5 U 0.5 U 1 U 2 U --11/15/2010 170 0.25 U 0.5 U 0.25 U 0.75 U 1 U --
11/2/2011 100 U 0.25 U 0.25 U 0.25 U 0.75 U 2.1 --11/6/2012 100 U 0.25 U 0.25 U 0.25 U 0.75 U 0.1
MW-6 1/5/1998 2,200 53 17 9 93 5 U --4/6/1998 4,200 51 16 25 110 5 U --7/6/1998 6,900 11 19 1 510 11 --
10/5/1998 5,800 43 22 48 240 12 --12/29/1999 2,090 11.5 2 35.1 65.1 -- 1 U
Hart CrowserL:\Jobs\716811\Sup FS\SFS Tables 1-5 and 7-8

Sheet 6 of 9Table 2 - Summary of Groundwater Analytical Data - TPH-G, BTEX, and LeadKen's Auto WashEllensburg, Washington
Well IDDate
SampledTPH-
Gasoline Benzene TolueneEthyl-
benzeneTotal
Xylenes Total Lead Diss. Lead
Concentration in µg/L Concentration in µg/L
MW-6 (cont.) 3/21/2000 1,580 0.75 U 14.3 28.7 61 -- 1 U6/14/2000 2,170 9.78 1.03 U 33.1 101 -- 1 U9/12/2000 1,630 12.8 1.2 U 27.9 75.7 -- 1 U4/26/2001 1,320 11.3 0.906 1.41 3.37 -- --7/29/2001 5,050 8.71 4.99 189 536 -- --
10/27/2001 1,910 15.3 0.786 1.67 5.49 -- --11/15/2002 1,270 9.01 0.5 U 0.594 1.85 -- --
5/9/2003 1,710 1.79 0.5 U 1.29 21.2 1.29 --9/30/2003 1,610 16.7 2.50 U 2.91 7.96 1 U --
12/11/2003 624 5.67 0.50 U 0.737 J 2.19 J 1 U --3/31/2004 1,160 0.520 0.2 U 0.350 0.5 U 1 U --
6/2/2004 2,300 J 4.78 J 0.5 U 54.0 J 75.5 J 1.29 --9/30/2004 1,150 J 8.34 J 0.5 J 0.553 J 2.92 J 1 U --
12/14/2004 672 3.57 0.5 U 0.5 U 1.42 -- --4/4/2005 b 1,010 5.91 0.5 U 0.5 U 1.86 c -- --10/6/2005 1,380 J 8.10 0.5 U 0.632 1.94 1 U --6/28/2006 -- -- -- -- -- -- --
11/13/2006 826 3.3 0.5 U 0.5 U 1.89 1 U --5/25/2007 1,460 0.5 U 0.5 U 25.6 1.22 -- --11/7/2007 729 3.53 0.5 U 0.5 U 1.69 1 U --
6/4/2008 1,550 1.93 0.5 U 30.8 2.78 1 U --10/22/2008 855 3.1 0.5 U 0.933 3.37 1 U --10/14/2009 501 7.59 U 0.5 U 1.18 U 1 U 2 U --11/15/2010 450 0.25 U 0.49 0.25 U 0.75 U 1 U --
5/2/2011 490 1.0 U 1.0 U 1.0 U 2.0 U -- --7/27/2011 610 1.0 U 1.0 U 1.0 U 2.0 U -- --11/2/2011 590 0.25 U 0.25 U 0.25 U 0.75 U 4 --2/13/2012 1,600 0.25 U 0.25 U 0.25 U 1.5 -- --5/23/2012 930 1.00 U 1.00 U 6.50 2.00 U -- --8/22/2012 500 0.25 U 0.25 U 0.31 0.75 U -- --11/6/2012 410 0.25 U 0.25 U 0.25 U 0.75 U 0.4 --
MW-12 12/29/1999 50 U 0.5 U 0.5 U 0.5 U 1 U -- 1 U3/21/2000 50 U 0.5 U 0.5 U 0.5 U 1 U -- 1 U6/14/2000 50 U 0.5 U 0.5 U 0.5 U 1 U -- 1 U9/12/2000 50 U 0.5 U 0.5 U 0.5 U 1 U -- 1 U
Hart CrowserL:\Jobs\716811\Sup FS\SFS Tables 1-5 and 7-8

Sheet 7 of 9Table 2 - Summary of Groundwater Analytical Data - TPH-G, BTEX, and LeadKen's Auto WashEllensburg, Washington
Well IDDate
SampledTPH-
Gasoline Benzene TolueneEthyl-
benzeneTotal
Xylenes Total Lead Diss. Lead
Concentration in µg/L Concentration in µg/L
MW-12 (cont.) 4/26/2001 50 U 0.5 U 0.5 U 0.5 U 1 U -- --7/29/2001 50 U 0.5 U 0.5 U 1.74 4.83 -- --
10/27/2001 50 U 0.5 U 0.5 U 0.5 U 1 U -- --11/15/2002 50 U 0.5 U 0.5 U 0.5 U 1 U -- --
5/9/2003 50 U 0.5 U 0.5 U 0.5 U 1 U 1 U --9/30/2003 50 U 0.5 U 0.5 U 0.5 U 1 U 1 U --
12/11/2003 50 U 0.5 U 0.5 U 0.5 U 1 U 1.47 --3/31/2004 50 U 0.2 U 0.2 U 0.2 U 0.5 U 1 U --
6/2/2004 50 U 0.5 U 0.5 U 0.5 U 1 U 1 U --9/30/2004 50 UJ 0.5 U 0.5 U 0.5 U 1 U 1 U --
12/14/2004 50 U 0.5 U 0.5 U 0.5 U 1 U -- --4/4/2005 50 U 0.5 U 0.5 U 0.5 U 1 U -- --
10/12/2005 50 U 0.5 U 0.5 U 0.5 U 1 U 1 U --6/28/2006 50 U 0.5 U 0.5 U 0.5 U 1 U 2.98 --
11/13/2006 50 U 0.5 U 0.5 U 0.5 U 1 U 1 U --5/25/2007 50 U 0.5 U 0.5 U 0.5 U 1 U -- --11/8/2007 50 U 0.5 U 0.5 U 0.5 U 1 U 1 U --
6/4/2008 50 U 0.5 U 0.5 U 0.5 U 1 U 1 U --10/22/2008 50 U 0.5 U 0.5 U 0.5 U 1 U 1 U --10/14/2009 80 U 0.5 U 0.5 U 0.5 U 1 U 2 U --11/15/2010 100 U 0.25 U 0.5 U 0.25 U 0.75 U 1 U --
11/2/2011 100 U 0.25 U 0.25 U 0.25 U 0.75 U 0.1 U --MW-13 12/29/99 50 U 0.5 U 0.5 U 0.5 U 1 U -- 1 U
3/21/2000 50 U 0.5 U 0.5 U 0.5 U 1 U -- 1 U6/14/2000 50 U 0.5 U 0.5 U 0.5 U 1 U -- 1 U9/12/2000 50 U 0.5 U 0.5 U 0.5 U 1 U -- 1 U4/26/2001 50 U 0.5 U 0.5 U 0.5 U 1 U -- --7/29/2001 50 U 0.5 U 0.5 U 0.5 U 1 U -- --
10/27/2001 50 U 0.5 U 0.5 U 0.5 U 1 U -- --9/30/2003 50 U 0.5 U 0.5 U 0.5 U 1 U 1 U --
12/11/2003 50 U 0.5 U 0.5 U 0.5 U 1 U 1.56 --3/31/2004 50 U 0.2 U 0.2 U 0.2 U 0.5 U 1 U --
6/2/2004 50 U 0.5 U 0.5 U 0.5 U 1 U 1 U --9/30/2004 50 UJ 0.5 U 0.5 U 0.5 U 1 U 1 U --
12/14/2004 50 U 0.5 U 0.5 U 0.5 U 1 U -- --4/4/2005 50 U 0.5 U 0.5 U 0.5 U 1 U -- --
Hart CrowserL:\Jobs\716811\Sup FS\SFS Tables 1-5 and 7-8

Sheet 8 of 9Table 2 - Summary of Groundwater Analytical Data - TPH-G, BTEX, and LeadKen's Auto WashEllensburg, Washington
Well IDDate
SampledTPH-
Gasoline Benzene TolueneEthyl-
benzeneTotal
Xylenes Total Lead Diss. Lead
Concentration in µg/L Concentration in µg/L
MW-13 (cont.) 10/6/2005 50 U 0.5 U 0.5 U 0.5 U 1 U 1 U --6/28/2006 -- -- -- -- -- -- --
11/13/2006 50 U 0.5 U 0.5 U 0.5 U 1 U 1 U --5/25/2007 50 U 0.5 U 0.5 U 0.5 U 1 U -- --11/8/2007 50 U 0.5 U 0.5 U 0.5 U 1 U 1 U --
6/4/2008 50 U 0.5 U 0.5 U 0.5 U 1 U 1 U --10/22/2008 50 U 0.5 U 0.5 U 0.5 U 1 U 1 U --10/15/2009 80 U 0.5 U 0.5 U 0.5 U 1 U 2 U --11/15/2010 100 U 0.25 U 0.5 U 0.25 U 0.75 U 1 U --
11/2/2011 100 U 0.25 U 0.25 U 0.25 U 0.75 U 0.2 --5/23/2012 250 U 1.00 U 1.00 U 1.00 U 2.00 U -- --8/22/2012 100 U 0.25 U 0.25 U 0.25 U 0.75 U -- --11/6/2012 100 U 0.25 U 0.25 U 0.25 U 0.75 U 0.1 U --
MW-15 1/30/2001 161 1.53 0.5 U 0.5 U 1.18 U -- --4/26/2001 50 U 0.5 U 0.5 U 0.5 U 1 U -- --7/29/2001 50 U 0.5 U 0.5 U 0.5 U 1 U -- --
10/27/2001 50 U 0.5 U 0.5 U 0.5 U 1 U -- --11/15/2002 50 U 0.5 U 0.5 U 0.5 U 1 U -- --
5/9/2003 50 U 0.5 U 0.5 U 0.5 U 1 U 1 U --9/30/2003 50 U 0.5 U 0.5 U 0.5 U 1 U 1 U --
12/11/2003 50 U 0.5 U 0.5 U 0.5 U 1 U 1 U --3/31/2004 50 U 0.2 U 0.2 U 0.2 U 0.5 U 1 U --
6/2/2004 50 U 0.5 U 0.5 U 0.5 U 1 U 1 U --9/30/2004 50 UJ 0.5 U 0.5 U 0.5 U 1 U 1 U --
12/14/2004 50 U 0.5 U 0.5 U 0.5 U 1 U -- --4/4/2005 50 U 0.5 U 0.5 U 0.5 U 1 U -- --
10/6/2005 50 U 0.5 U 0.5 U 0.5 U 1 U 1 U --6/28/2006 -- -- -- -- -- -- --
11/13/2006 50 U 0.5 U 0.5 U 0.5 U 1 U 1 U --5/25/2007 50 U 0.5 U 0.5 U 0.5 U 1 U -- --11/7/2007 50 U 0.5 U 0.5 U 0.5 U 1 U 1 U --
6/5/2008 50 U 0.5 U 0.5 U 0.5 U 1 U 1 U --10/22/2008 50 U 0.5 U 0.5 U 0.5 U 1 U 1 U --
Hart CrowserL:\Jobs\716811\Sup FS\SFS Tables 1-5 and 7-8

Sheet 9 of 9Table 2 - Summary of Groundwater Analytical Data - TPH-G, BTEX, and LeadKen's Auto WashEllensburg, Washington
Well IDDate
SampledTPH-
Gasoline Benzene TolueneEthyl-
benzeneTotal
Xylenes Total Lead Diss. Lead
Concentration in µg/L Concentration in µg/L
MW-15 (cont.) 10/14/2009 80 U 0.5 U 0.5 U 0.5 U 1 U 2 U --11/15/2010 100 U 0.25 U 0.5 U 0.25 U 0.75 U 1 U --
11/2/2011 100 U 0.25 U 0.25 U 0.25 U 0.75 U 0.1 U --11/6/2012 100 U 0.25 U 0.25 U 0.25 U 0.75 U 0.1 U
800/1,000 a 5 1000 700 1000 15 15
Notes: Gasoline-range TPH analyzed by EPA Method 8015 prior to 1999. After that, analyzed by NWTPH-G; BTEX Analyzed by EPA Method 8021BBTEX analyzed by EPA Method 8260B in March 2004.Total and Dissolved Lead analyzed by EPA Method 6010 or 6020.-- Not analyzed.U = Not detected at specified reporting limit.J = Estimated concentration.Bolded concentrations exceed MTCA Method A cleanup levels.Access to well MW-13 obstructed in November 2002 and May 2003.Access to well MW-5 obstructed in September 2004.Data from 1996 and 1998 collected by Sage Environmental.Well MW-1 was removed during the October 2000 excavation. Wells MW-14 and MW-15 were installed in January 2001 after the excavation.Well MW-4 was replaced as well MW-4R by Hart Crowser in October 2005, following removal of the well during UST removal activities in April 2005.First dashed line indicates soil was excavated in November 2000.Second dashed line indicates bioremediation amendments were injected in January 2011.a) Cleanup level for TPH-G with/without detectable benzeneb) Values shown are the average of the results for the sample and its field duplicate.c) The value is the result for the field duplicate. The result for the sample was ND (not detected at the detection limit of 1.0 µg/L).
MTCA Method A Groundwater Cleanup Level
Hart CrowserL:\Jobs\716811\Sup FS\SFS Tables 1-5 and 7-8

Table 3 - Measured Free Product Thickness in Wells MW-1/MW-14Ken's Auto WashEllensburg, Washington
Date MeasuredProduct Thickness in
Well in Inches
4/8/1996 04/6/1998 6
10/5/1998 612/29/1999 0.23/21/2000 56/14/2000 19/12/2000 11/30/2001 04/26/2001 07/29/2001 0
10/27/2001 411/15/2002 3
5/9/2003 09/30/2003 0
12/12/2003 13/31/2004 1.806/2/2004 0
9/30/2004 012/14/2004 0.18
4/4/2005 010/6/2005 06/28/2006 05/25/2007 011/7/2007 06/4/2008 0
10/21/2008 010/14/2009 011/15/2010 0
5/2/2011 07/27/2011 011/2/2011 02/13/2012 011/6/2012 0
Hotspot Excavation
UST Removal
Bioremediation Injections
Hart CrowserL:\Jobs\716811\Sup FS\SFS Tables 1-5 and 7-8

Sheet 1 of 9
Table 4 - Summary of Groundwater Natural Attenuation and Interim Action DataKen's Auto WashEllensburg, Washington
ExplorationDate
SampledDissolved Oxygen
Ferrous Iron Nitrite Nitrate Ammonia Nitrite
MW-1/MW-14 3/21/2000 0.60 -- -- -- -- -- -- -- -- -- --6/14/2000 1.00 -- -- -- -- -- -- -- -- -- --9/12/2000 0.40 -- -- -- -- -- -- -- -- -- --1/30/2001 2.40 -- -- -- -- -- -- -- -- -- --4/26/2001 -- -- -- -- -- -- -- -- -- -- --7/29/2001 2.30 -- -- -- -- -- -- -- -- -- --10/27/2001 0.80 -- -- -- -- -- -- -- -- -- --11/15/2002 -- -- -- -- -- -- -- -- -- -- --5/9/2003 1.20 -- -- -- -- -- -- -- -- -- --
9/30/2003 0.29 -- -- -- -- 0.349 0.400 U -- -- 0.200 U 1.612/11/2003 3.20 -- -- -- -- 0.200 U 1.14 -- -- 0.200 U 43/31/2004 0.12 -- -- -- -- 0.200 U 1.08 -- -- 0.200 U 5.26/2/2004 0.02 -- -- -- -- 0.200 U 4.24 -- -- 0.200 U 7.2
9/30/2004 0.11 -- -- -- -- 0.200 U 0.635 -- -- 0.200 U 5.612/14/2004 0.07 -- -- -- -- 0.200 U 0.400 U -- -- 0.200 U 6.34/4/2005 -- -- -- -- -- 0.200 U 0.464 -- -- 0.200 U 4.82 J
10/6/2005 -- -- -- -- -- 0.200 U 0.400 U -- -- 0.200 U 9.746/28/2006 0.60 -- -- -- -- 0.556 13.4 -- -- 0.400 U 0.25 U11/13/2006 0.39 3.5-3.75 -- -- -- 0.200 U 1.4 -- -- 0.200 U 2.165/25/2007 3.47 ND -- -- -- 3.120 12.200 -- -- 0.200 U 0.25 U11/7/2007 4.84 5.2 -- -- -- 0.010 U 0.900 -- -- 0.010 U --6/4/2008 6.01 ND -- -- -- 1.870 9.970 -- -- 0.200 U --
10/21/2008 5.09 2.9 -- -- -- 0.200 U 0.680 -- -- 0.200 U --10/14/2009 0.00 3.6 -- -- -- 0.90 UJ 1.2 U -- -- 1.6 J --11/15/2010 0.00 5 -- -- -- 0.1 U 0.4 -- -- -- -- --5/2/2011 0.00 0.8 4 100 6 63.2 541 35.1 0.2 -- --
7/27/2011 0.16 1.9 0 10 6 0.1 U 550 40.2 1.0 U -- --11/2/2011 0.86 2 ND ND 0.75 0.1 U 63.6 17.2 0.8 -- --2/13/2012 2.41 2 5 160 2 99.0 671 208 0.2 -- --5/23/2012 3.06 ND -- -- -- 120.00 211.00 1.00 U 60.30 -- --8/22/2012 7.31 ND -- -- -- 11.60 380.00 44.40 0.20 -- --11/6/2012 1.12 1.10 -- -- -- 1.60 137.00 24.50 0.10 U -- --
Field Test Results - Concentration in mg/L Concentration in mg/L
Ferrous IronChloride BromideNitrate Sulfate
Hart CrowserL:\Jobs\716811\Sup FS\SFS Tables 1-5 and 7-8

Sheet 2 of 9
Table 4 - Summary of Groundwater Natural Attenuation and Interim Action DataKen's Auto WashEllensburg, Washington
ExplorationDate
SampledDissolved Oxygen
Ferrous Iron Nitrite Nitrate Ammonia Nitrite
Field Test Results - Concentration in mg/L Concentration in mg/L
Ferrous IronChloride BromideNitrate Sulfate
MW-2 3/21/2000 2.60 -- -- -- -- -- -- -- -- -- --6/14/2000 2.80 -- -- -- -- -- -- -- -- -- --9/12/2000 0.80 -- -- -- -- -- -- -- -- -- --1/30/2001 1.50 -- -- -- -- -- -- -- -- -- --4/26/2001 4.50 -- -- -- -- -- -- -- -- -- --7/29/2001 3.30 -- -- -- -- -- -- -- -- -- --10/27/2001 2.00 -- -- -- -- -- -- -- -- -- --11/15/2002 1.50 -- -- -- -- -- -- -- -- -- --5/9/2003 2.30 -- -- -- -- -- -- -- -- -- --
9/30/2003 1.51 -- -- -- -- 0.489 3.38 -- -- 0.200 U 1.212/11/2003 3.90 -- -- -- -- 1.08 3.79 -- -- 0.200 U 0.03/31/2004 0.82 -- -- -- -- 0.912 4.60 -- -- 0.200 U 0.06/2/2004 1.63 -- -- -- -- 0.467 3.23 -- -- 0.200 U 0.0
9/30/2004 0.52 -- -- -- -- 0.443 2.93 -- -- 0.200 U 0.212/14/2004 6.05 -- -- -- -- 0.922 3.05 -- -- 0.200 U 0.04/4/2005 -- -- -- -- -- 0.719 3.52 -- -- 0.200 U 0.25 R
10/6/2005 -- -- -- -- -- 0.219 3.75 -- -- 0.200 U 0.25 U6/28/2006 -- -- -- -- -- -- -- -- -- -- --11/13/2006 0.64 ND -- -- -- 0.410 5.26 -- -- 0.200 U 0.25 U5/25/2007 7.11 ND -- -- -- 2.740 8.57 -- -- 0.200 U 0.25 U11/7/2007 4.95 ND -- -- -- 0.275 4.32 -- -- 0.010 U --6/4/2008 4.60 ND -- -- -- 1.440 6.14 -- -- 0.200 U --
10/21/2008 -- ND -- -- -- 0.200 U 3.21 -- -- 0.200 U --10/14/2009 0.00 ND -- -- -- 0.90 U 6.5 -- -- 1.3 J --11/15/2010 0.33 ND -- -- -- 0.3 3.9 -- -- -- --11/2/2011 1.08 ND -- -- -- 0.6 9.1 5.8 0.1 U -- --11/6/2012 1.45 ND -- -- -- 1.3 6.8 3.4 0.1 U
Hart CrowserL:\Jobs\716811\Sup FS\SFS Tables 1-5 and 7-8

Sheet 3 of 9
Table 4 - Summary of Groundwater Natural Attenuation and Interim Action DataKen's Auto WashEllensburg, Washington
ExplorationDate
SampledDissolved Oxygen
Ferrous Iron Nitrite Nitrate Ammonia Nitrite
Field Test Results - Concentration in mg/L Concentration in mg/L
Ferrous IronChloride BromideNitrate Sulfate
MW-3 3/21/2000 2.00 -- -- -- -- -- -- -- -- -- --6/14/2000 2.10 -- -- -- -- -- -- -- -- -- --9/12/2000 1.40 -- -- -- -- -- -- -- -- -- --1/30/2001 2.70 -- -- -- -- -- -- -- -- -- --4/26/2001 1.80 -- -- -- -- -- -- -- -- -- --7/29/2001 4.40 -- -- -- -- -- -- -- -- -- --10/27/2001 2.30 -- -- -- -- -- -- -- -- -- --11/15/2002 2.10 -- -- -- -- -- -- -- -- -- --5/9/2003 2.70 -- -- -- -- -- -- -- -- -- --
9/30/2003 0.44 -- -- -- -- 0.228 4.39 -- -- 0.200 U 0.012/11/2003 3.20 -- -- -- -- 0.200 U 4.79 -- -- 0.200 U 0.03/31/2004 1.59 -- -- -- -- 0.812 5.53 -- -- 0.200 U 0.06/2/2004 0.89 -- -- -- -- 0.816 5.61 -- -- 0.200 U 0.0
9/30/2004 0.54 -- -- -- -- 0.253 4.43 -- -- 0.200 U 0.012/14/2004 2.10 -- -- -- -- 0.206 4.69 -- -- 0.200 U 0.04/4/2005 -- -- -- -- -- 0.358 4.23 -- -- 0.200 U 0.25 R
10/6/2005 -- -- -- -- -- 0.200 U 3.67 -- -- 0.200 U 0.25 U6/28/2006 -- -- -- -- -- -- -- -- -- -- --11/13/2006 1.19 ND -- -- -- 0.370 6.1 -- -- 0.200 U 0.25 U5/25/2007 8.13 ND -- -- -- 1.520 6.43 -- -- 0.200 U 0.25 U11/8/2007 5.15 ND -- -- -- 0.168 4.13 -- -- 0.010 U --6/4/2008 5.51 ND -- -- -- 0.920 4.59 -- -- 0.200 U --
10/21/2008 8.29 ND -- -- -- 0.250 3.84 -- -- 0.200 U --10/14/2009 0.81 ND -- -- -- 0.90 UJ 3.2 -- -- 1.3 J --11/15/2010 1.86 ND -- -- -- 0.2 4.1 -- -- -- --5/2/2011 0.00 ND 2 10 1 3.4 12.4 36.0 0.1 U -- --
7/27/2011 0.06 0.6 2 10 1.5 1.8 21.6 12.6 0.1 U -- --11/2/2011 0.90 1.5 ND ND 1 0.1 U 24.0 9.5 0.1 -- --2/13/2012 2.14 ND 0.25 10 0.5 6.8 8.9 12.3 0.1 U -- --11/6/2012 2.18 ND -- -- -- 0.7 4.9 5.1 0.1 U
Hart CrowserL:\Jobs\716811\Sup FS\SFS Tables 1-5 and 7-8

Sheet 4 of 9
Table 4 - Summary of Groundwater Natural Attenuation and Interim Action DataKen's Auto WashEllensburg, Washington
ExplorationDate
SampledDissolved Oxygen
Ferrous Iron Nitrite Nitrate Ammonia Nitrite
Field Test Results - Concentration in mg/L Concentration in mg/L
Ferrous IronChloride BromideNitrate Sulfate
MW-4 3/21/2000 0.60 -- -- -- -- -- -- -- -- -- --6/14/2000 1.00 -- -- -- -- -- -- -- -- -- --9/12/2000 0.40 -- -- -- -- -- -- -- -- -- --1/30/2001 2.40 -- -- -- -- -- -- -- -- -- --4/26/2001 -- -- -- -- -- -- -- -- -- -- --7/29/2001 2.30 -- -- -- -- -- -- -- -- -- --10/27/2001 0.80 -- -- -- -- -- -- -- -- -- --11/15/2002 -- -- -- -- -- -- -- -- -- -- --5/9/2003 1.20 -- -- -- -- -- -- -- -- -- --
9/30/2003 0.12 -- -- -- -- 0.200 U 4.57 -- -- 0.200 U 1.412/11/2003 1.40 -- -- -- -- 1.05 15.3 -- -- 0.200 U 0.53/31/2004 0.11 -- -- -- -- 0.200 U 7.41 -- -- 0.200 U 5.46/2/2004 0.03 -- -- -- -- 0.200 U 8.32 -- -- 0.200 U 5.2
9/30/2004 0.06 -- -- -- -- 0.200 U 4.91 -- -- 0.200 U 3.812/14/2004 0.12 -- -- -- -- 0.200 U 5.13 -- -- 0.200 U 2.04/4/2005 -- -- -- -- -- 0.200 U 5.79 -- -- 0.200 U 3.47 J
MW-4R 10/6/2005 -- -- -- -- -- 0.200 U 8.07 -- -- 0.200 U 1.396/28/2006 0.60 -- -- -- -- 0.200 U 16 -- -- 0.400 U 0.25 U11/13/2006 0.24 2.9-3.0 -- -- -- 0.200 U 16.2 -- -- 0.200 U 0.25 U5/25/2007 2.63 ND -- -- -- 2.290 17.6 -- -- 0.200 U 0.25 U11/7/2007 4.78 3.7 -- -- -- 0.031 10.3 -- -- 0.010 U --6/4/2008 3.87 ND -- -- -- 2.030 14.1 -- -- 0.200 U --
10/21/2008 8.98 1.4 -- -- -- 0.200 U 6.52 -- -- 0.200 U --10/14/2009 4.83 ND -- -- -- 0.90 UJ 5.9 -- -- 1.7 J --11/15/2010 0.00 2.2 -- -- -- 0.1 U 7.3 -- -- -- --5/2/2011 0.00 2.4 5 20 2 18.7 78.9 30.8 8.6 -- --
7/27/2011 0.14 2 ND 10 4 4.2 12.4 24.7 0.9 -- --11/2/2011 0.76 1.9 ND ND 5 0.2 13.1 14.3 1.0 -- --2/13/2012 2.95 1.3 3 120 2 74.9 174 20.2 0.5 -- --5/23/2012 3.64 1.40 -- -- -- 5.20 37.00 0.10 U 38.10 -- --8/22/2012 4.91 1.80 -- -- -- 0.20 11.30 9.40 0.30 -- --11/6/2012 1.84 1.2 -- -- -- 1 42.7 21.3 0.2 -- --
Hart CrowserL:\Jobs\716811\Sup FS\SFS Tables 1-5 and 7-8

Sheet 5 of 9
Table 4 - Summary of Groundwater Natural Attenuation and Interim Action DataKen's Auto WashEllensburg, Washington
ExplorationDate
SampledDissolved Oxygen
Ferrous Iron Nitrite Nitrate Ammonia Nitrite
Field Test Results - Concentration in mg/L Concentration in mg/L
Ferrous IronChloride BromideNitrate Sulfate
MW-5 3/21/2000 0.60 -- -- -- -- -- -- -- -- -- --6/14/2000 0.70 -- -- -- -- -- -- -- -- -- --9/12/2000 0.60 -- -- -- -- -- -- -- -- -- --4/26/2001 0.80 -- -- -- -- -- -- -- -- -- --7/29/2001 3.00 -- -- -- -- -- -- -- -- -- --10/27/2001 0.90 -- -- -- -- -- -- -- -- -- --11/15/2002 0.70 -- -- -- -- -- -- -- -- -- --5/9/2003 1.20 -- -- -- -- -- -- -- -- -- --
9/30/2003 0.30 -- -- -- -- 0.200 U 8.61 -- -- 0.200 U 1.812/11/2003 1.30 -- -- -- -- 0.200 U 6.85 -- -- 0.200 U 0.03/31/2004 0.42 -- -- -- -- 1.32 16.1 -- -- 0.200 U 0.06/2/2004 0.20 -- -- -- -- 1.36 11.7 -- -- 0.200 U 0.0
12/14/2004 0.49 -- -- -- -- 0.200 U 7.57 -- -- 0.200 U 2.954/4/2005 -- -- -- -- -- 0.200 U 9.92 -- -- 0.200 U 3.06 J
10/6/2005 -- -- -- -- -- 0.200 U 9.50 -- -- 0.200 U 0.25 U6/28/2006 2.40 -- -- -- -- 2.59 16 -- -- 0.400 U 0.25 U11/13/2006 3.60 ND -- -- -- 2.99 11.7 -- -- 0.200 U 0.25 U5/25/2007 6.60 ND -- -- -- 3.400 19.9 -- -- 0.200 U 0.25 U11/7/2007 5.18 ND -- -- -- 0.110 7.75 -- -- 0.010 U --6/4/2008 5.44 ND -- -- -- 1.730 11.8 -- -- 0.200 U --
10/22/2008 6.75 ND -- -- -- 0.220 6.35 -- -- 0.200 U --10/15/2009 1.13 ND -- -- -- 0.90 U 5.2 -- -- 1.5 J --11/15/2010 0.00 ND -- -- -- 0.1 6.6 -- -- -- -- -- --11/2/2011 0.87 2 -- -- -- 0.4 21.7 16.7 0.1 -- --11/6/2012 2.06 -- -- -- -- 0.3 7.2 7.9 0.1 U -- --
MW-6 3/21/2000 1.80 -- -- -- -- -- -- -- -- -- --6/14/2000 0.50 -- -- -- -- -- -- -- -- -- --9/12/2000 0.50 -- -- -- -- -- -- -- -- -- --4/26/2001 -- -- -- -- -- -- -- -- -- -- --7/29/2001 2.60 -- -- -- -- -- -- -- -- -- --10/27/2001 0.70 -- -- -- -- -- -- -- -- -- --11/15/2002 0.60 -- -- -- -- -- -- -- -- -- --
Hart CrowserL:\Jobs\716811\Sup FS\SFS Tables 1-5 and 7-8

Sheet 6 of 9
Table 4 - Summary of Groundwater Natural Attenuation and Interim Action DataKen's Auto WashEllensburg, Washington
ExplorationDate
SampledDissolved Oxygen
Ferrous Iron Nitrite Nitrate Ammonia Nitrite
Field Test Results - Concentration in mg/L Concentration in mg/L
Ferrous IronChloride BromideNitrate Sulfate
MW-6 (cont.) 5/9/2003 1.80 -- -- -- -- -- -- -- -- -- --9/30/2003 0.12 -- -- -- -- 0.200 U 0.400 U -- -- 0.200 U 2.212/11/2003 1.50 -- -- -- -- 0.200 U 0.685 -- -- 0.200 U 3.83/31/2004 0.15 -- -- -- -- 0.200 U 3.02 -- -- 0.200 U 3.46/2/2004 0.09 -- -- -- -- 0.200 U 0.557 -- -- 0.200 U 5.2
9/30/2004 0.12 -- -- -- -- 0.200 U 0.400 U -- -- 0.200 U 6.412/14/2004 0.42 -- -- -- -- 0.200 U 0.400 U -- -- 0.200 U 3.2
4/4/2005 a -- -- -- -- -- 0.200 U 3.19 -- -- 0.200 U 9.33 J10/6/2005 -- -- -- -- -- 0.200 U 0.400 U -- -- 0.200 U 9.334/4/2005 -- -- -- -- -- 0.200 U 3.20 -- -- 0.200 U 9.53
Dup 4/4/2005 -- -- -- -- -- 0.200 U 3.17 -- -- 0.200 U 14.46/28/2006 -- -- -- -- -- 2.6 18.6 -- -- 0.400 U --11/13/2006 0.48 0.9-1.0 -- -- -- 0.200 U 1.11 -- -- 0.200 U 6.955/25/2007 1.11 4.2 -- -- -- 0.200 U 2.67 -- -- 0.200 U 0.5 U11/7/2007 5.18 5.4 -- -- -- 0.010 U 2.24 -- -- 0.010 U --6/4/2008 5.76 5.2 -- -- -- 0.200 U 3.68 -- -- 0.200 U --
10/22/2008 4.15 5.4 -- -- -- 0.200 U 0.40 U -- -- 0.200 U --10/14/2009 0.00 6.0 -- -- -- 0.90 UJ 1.2 U 1.7 J --11/15/2010 0.00 3.4 -- -- -- 0.1 U 1.5 -- --5/2/2011 0.00 1 ND 10 0.5 2.6 79.6 83.0 0.3 -- --
7/27/2011 0.48 2 ND 5 6 2.0 U 879 97.8 2.0 U -- --11/2/2011 1.01 ND ND ND 5 0.1 14.8 25.1 0.2 -- --2/13/2012 2.62 1.6 3 15 2 3.1 68.0 25.7 0.1 -- --5/23/2012 4.96 ND -- -- -- 0.10 U 12.90 0.10 U 41.00 -- --8/22/2012 7.09 2.00 -- -- -- 0.10 2.40 12.40 0.10 -- --11/6/2012 0.69 1.8 -- -- -- 0.1 U 2.2 7.5 0.1 U -- --
Dup 11/6/2012 0.69 1.8 -- -- -- 0.1 U 2.3 7.5 0.1 U -- --MW-12 3/21/2000 5.00 -- -- -- -- -- -- -- -- -- --
6/14/2000 4.90 -- -- -- -- -- -- -- -- -- --9/12/2000 0.60 -- -- -- -- -- -- -- -- -- --4/26/2001 4.00 -- -- -- -- -- -- -- -- -- --7/29/2001 3.00 -- -- -- -- -- -- -- -- -- --
Hart CrowserL:\Jobs\716811\Sup FS\SFS Tables 1-5 and 7-8
Sheet 7 of 9
Table 4 - Summary of Groundwater Natural Attenuation and Interim Action DataKen's Auto WashEllensburg, Washington
ExplorationDate
SampledDissolved Oxygen
Ferrous Iron Nitrite Nitrate Ammonia Nitrite
Field Test Results - Concentration in mg/L Concentration in mg/L
Ferrous IronChloride BromideNitrate Sulfate
MW-12 (cont.) 10/27/2001 5.20 -- -- -- -- -- -- -- -- -- --11/15/2002 2.70 -- -- -- -- -- -- -- -- -- --5/9/2003 6.00 -- -- -- -- -- -- -- -- -- --
9/30/2003 1.66 -- -- -- -- 0.452 5.32 -- -- 0.200 U 0.812/11/2003 2.70 -- -- -- -- 0.200 U 2.77 -- -- 0.200 U 0.03/31/2004 3.91 -- -- -- -- 3.88 8.45 -- -- 0.200 U 0.06/2/2004 5.20 -- -- -- -- 3.64 11.7 -- -- 0.200 U 0.0
9/30/2004 6.00 -- -- -- -- 0.573 5.66 -- -- 0.200 U 0.012/14/2004 1.32 -- -- -- -- 0.200 U 2.95 -- -- 0.200 U 0.04/4/2005 -- -- -- -- -- 0.200 U 3.32 -- -- 0.200 U 0.25 R
10/12/2005 -- -- -- -- -- 0.200 U 3.37 -- -- 0.200 U 0.25 U6/28/2006 0.42 -- -- -- -- 2.57 11.5 -- -- 0.400 U 0.25 U11/13/2006 2.61 ND -- -- -- 0.590 6.89 -- -- 0.200 U 0.25 U5/25/2007 6.71 ND -- -- -- 7.140 18.4 -- -- 0.200 U 0.25 U11/8/2007 6.33 ND -- -- -- 0.121 11.5 -- -- 0.010 U --6/4/2008 9.50 ND -- -- -- 6.020 16.4 -- -- 0.200 U --
10/22/2008 8.88 ND -- -- -- 0.330 10.1 -- -- 0.200 U --10/14/2009 2.23 ND -- -- -- 0.90 UJ 5.2 -- -- 1.4 J --11/15/2010 2.73 ND -- -- -- 0.2 13.4 -- -- -- --11/2/2011 3.01 ND -- -- -- 0.7 60.3 493 0.3 -- --
MW-13 3/21/2000 4.60 -- -- -- -- -- -- -- -- -- --6/14/2000 1.50 -- -- -- -- -- -- -- -- -- --9/12/2000 3.30 -- -- -- -- -- -- -- -- -- --4/26/2001 5.00 -- -- -- -- -- -- -- -- -- --7/29/2001 3.80 -- -- -- -- -- -- -- -- -- --10/27/2001 3.40 -- -- -- -- -- -- -- -- -- --9/30/2003 3.04 -- -- -- -- 0.455 4.91 -- -- 0.200 U --12/11/2003 6.70 -- -- -- -- 0.477 5.56 -- -- 0.200 U 0.03/31/2004 4.87 -- -- -- -- 1.60 8.04 -- -- 0.200 U 0.06/2/2004 1.85 -- -- -- -- 1.05 6.52 -- -- 0.200 U 0.0
9/30/2004 2.69 -- -- -- -- 0.496 4.49 -- -- 0.200 U 0.012/14/2004 5.57 -- -- -- -- 0.412 5.10 -- -- 0.200 U 0.0
Hart CrowserL:\Jobs\716811\Sup FS\SFS Tables 1-5 and 7-8

Sheet 8 of 9
Table 4 - Summary of Groundwater Natural Attenuation and Interim Action DataKen's Auto WashEllensburg, Washington
ExplorationDate
SampledDissolved Oxygen
Ferrous Iron Nitrite Nitrate Ammonia Nitrite
Field Test Results - Concentration in mg/L Concentration in mg/L
Ferrous IronChloride BromideNitrate Sulfate
MW-13 (cont.) 4/4/2005 -- -- -- -- -- 0.582 4.99 -- -- 0.200 U 0.547 J10/6/2005 -- -- -- -- -- 0.348 3.68 -- -- 0.200 U 0.25 U6/28/2006 -- -- -- -- -- -- -- -- -- -- --11/13/2006 3.49 ND -- -- -- 0.940 6.18 -- -- 0.200 U 0.25 U5/25/2007 4.14 ND -- -- -- 1.670 7.57 -- -- 0.200 U 0.25 U11/8/2007 6.93 ND -- -- -- 0.490 4.09 -- -- 0.010 U --6/4/2008 6.90 ND -- -- -- 1.280 5.51 -- -- 0.200 U --
10/22/2008 9.35 ND -- -- -- 0.440 3.56 -- -- 0.200 U --10/15/2009 4.61 ND -- -- -- 0.90 U 3.3 -- -- 1.2 J --11/15/2010 4.38 ND -- -- -- 0.4 3.7 -- -- -- --5/2/2011 4.87 ND ND 5 ND 2.4 7.3 20.7 0.1 U -- --
7/27/2011 1.47 ND ND 10 0.25 1.3 5.8 9.4 0.1 U -- --11/2/2011 5.11 ND 0.5 ND ND 0.4 4.7 6.3 0.1 -- --2/13/2012 4.58 ND ND ND ND 0.9 5.6 21.7 0.1 U -- --5/23/2012 7.47 ND -- -- -- 0.90 5.00 0.10 U 11.30 -- --8/22/2012 8.13 ND -- -- -- 0.30 4.00 5.40 0.10 U -- --11/6/2012 4.97 ND -- -- -- 0.3 4.5 5.8 0.1 U -- --
MW-15 1/30/2001 1.30 -- -- -- -- -- -- -- -- -- --4/26/2001 -- -- -- -- -- -- -- -- -- -- --7/29/2001 2.60 -- -- -- -- -- -- -- -- -- --10/27/2001 1.40 -- -- -- -- -- -- -- -- -- --11/15/2002 0.80 -- -- -- -- -- -- -- -- -- --5/9/2003 1.50 -- -- -- -- -- -- -- -- -- --
9/30/2003 0.56 -- -- -- -- 0.282 5.02 -- -- 0.200 U 2.612/11/2003 2.80 -- -- -- -- 0.415 8.52 -- -- 0.200 U 0.03/31/2004 0.88 -- -- -- -- 0.200 U 8.42 -- -- 0.200 U 0.06/2/2004 0.40 -- -- -- -- 1.67 8.32 -- -- 0.200 U 0.0
9/30/2004 0.33 -- -- -- -- 0.429 4.56 -- -- 0.200 U 0.012/14/2004 1.40 -- -- -- -- 0.200 U 6.68 -- -- 0.200 U 0.04/4/2005 -- -- -- -- -- 0.200 U 7.45 -- -- 0.200 U 0.254 J
10/6/2005 -- -- -- -- -- 0.340 4.14 -- -- 0.200 U 0.25 U6/28/2006 -- -- -- -- -- -- -- -- -- -- --
Hart CrowserL:\Jobs\716811\Sup FS\SFS Tables 1-5 and 7-8

Sheet 9 of 9
Table 4 - Summary of Groundwater Natural Attenuation and Interim Action DataKen's Auto WashEllensburg, Washington
ExplorationDate
SampledDissolved Oxygen
Ferrous Iron Nitrite Nitrate Ammonia Nitrite
Field Test Results - Concentration in mg/L Concentration in mg/L
Ferrous IronChloride BromideNitrate Sulfate
MW-15 (cont.) 11/13/2006 1.06 ND -- -- -- 0.450 6.48 -- -- 0.200 U 0.25 U5/25/2007 2.63 ND -- -- -- 3.070 10.4 -- -- 0.200 U 0.25 U11/7/2007 5.66 ND -- -- -- 0.220 5.21 -- -- 0.010 U --6/5/2008 6.50 ND -- -- -- 2.010 8.02 -- -- 0.200 U --
10/22/2008 5.61 ND -- -- -- 0.280 3.81 -- -- 0.200 U --10/14/2009 0.00 ND -- -- -- 0.90 UJ 3.1 -- -- 1.2 J --11/15/2010 0.67 ND -- -- -- 0.2 4.1 -- -- -- --11/2/2011 1.30 ND -- -- -- 0.4 6.0 8.7 0.1 U -- --11/6/2012 2.03 ND -- -- -- 0.3 4.9 5.4 0.1 U -- --
na na na na na na
Notes: Nitrate, sulfate, chloride, bromide, and nitrite analyzed by EPA Method 300.0. MTBE, EDB, and EDC analyzed by EPA Method 8260B. -- Not analyzed. U = Not detected above specified reporting limit. J = Estimated concentration. R = Rejected concentration. ND = Analyte not detected. Bolded concentrations exceed MTCA Method A cleanup levels. a) Values shown are the average of the results for the sample and its field duplicate. na = No MTCA Method A or B value available. First dashed line indicates soil was excavated in November 2000. Second dashed line indicates bioremediation amendments were injected in January 2011.
MTCA Method ACleanup Level
Hart CrowserL:\Jobs\716811\Sup FS\SFS Tables 1-5 and 7-8

Table 5 - September 2003 to November 2010 Averaged DataKen's Auto WashEllensburg, Washington
Well Natural Electron Acceptors (Oxidants) in mg/LName DO Nitrate Sulfate
Background WellsMW-3 3.1 0.49 4.6MW-5 2.6 1.05 10.4MW-2 2.7 0.77 4.4Plume AxisMW-4R 2 0.53 9.6MW-14 1.7 0.54 3MW-6 1.5 0.36 2.6
Hart CrowserL:\Jobs\716811\Sup FS\SFS Tables 1-5 and 7-8

Table 6 - Natural Attenuation Electron Acceptor/Demand CalculationsKen's Auto WashEllensburg, Washington
Treatment Target Area Specifications
Vertical Treatment in Feet 3 Recirculation Injection Rate (gpm) 0.0
Treatment Width in Feet 110 Recirculation Duration (days) 0
Treatment Length in Feet (parallel w/ GW flow) 50 Injected Volume (gal) 0
Effective Porosity 0.25 Recirculated Pore Volumes = 0.0
Foc 0.010 Estimated Total Project Duration in Days
Estimated Seepage Velocity in Feet/Year 438 10,950
Bulk Soil Density in pcf 120 Project Duration in Years 30
Treatment Area Pore Volume 116,738 Liters 30,801 Gallons
Hydrogen/Electron Donor Availability
ConstituentGroundwater Concentration
in mg/L
Molecular Weight in g/mol
Moles of H2 to
Oxidize / Mole Analyte
Moles of H2
Donor In Treatment Area
Native Electron Donors
Groundwater TPH-Gx 3.0 100 22 77
Approximate % Aromatic 1%
Estimated Total Soil and GW TPH-Gx 17,790
Groundwater TPH-Dx 0.00 226 49 0
Estimated Total Soil and GW TPH-Dx 0
Estimated Oxidative Efficiency 50% 8,895
Native Hydrogen/Electron Acceptor Flux
ConstituentGroundwater Concentration
in mg/L
Molecular Weight in g/mol
Moles of H2 to
Reduce Mole Analyte
Moles of H2
Acceptor In Treatment Area
Native Electron AcceptorsDissolved Oxygen 1.6 32 2 12Nitrate (as Nitrogen) 0.80 62 3 20
Sulfate 96.1 4 0
Hydrogen Acceptor (Oxidant) Flux of Estimated Total Project Duration 8,329
Estimated Oxidative Treatment Progress Based on Design Assumptions: 94%
NOTES:mg/L = milligrams per liter; gal = gallons; gpm = gallons per minute; H2 = hydrogen.
1cf = 7.48 gals = 28.3L; 3.79L = 1 gal.Physical constants per Oregon DEQ Risk-Based Decision Making Guidance (DEQ 2006).
Native Electron Acceptors estimated based on calculated average difference (consumption) between upgradient wells and downgradient wells prior to the redox recovery zone.
Operational Assumptions
Electron and hydrogen equivalents per Principles and Practices of Enhanced Anaerobic Bioremediation of Chlorinated Solvents, Air Force Center for Environmental Excellence, August 2004.
Hart CrowserL:\Jobs\716811\Sup FS\SFS Table 6
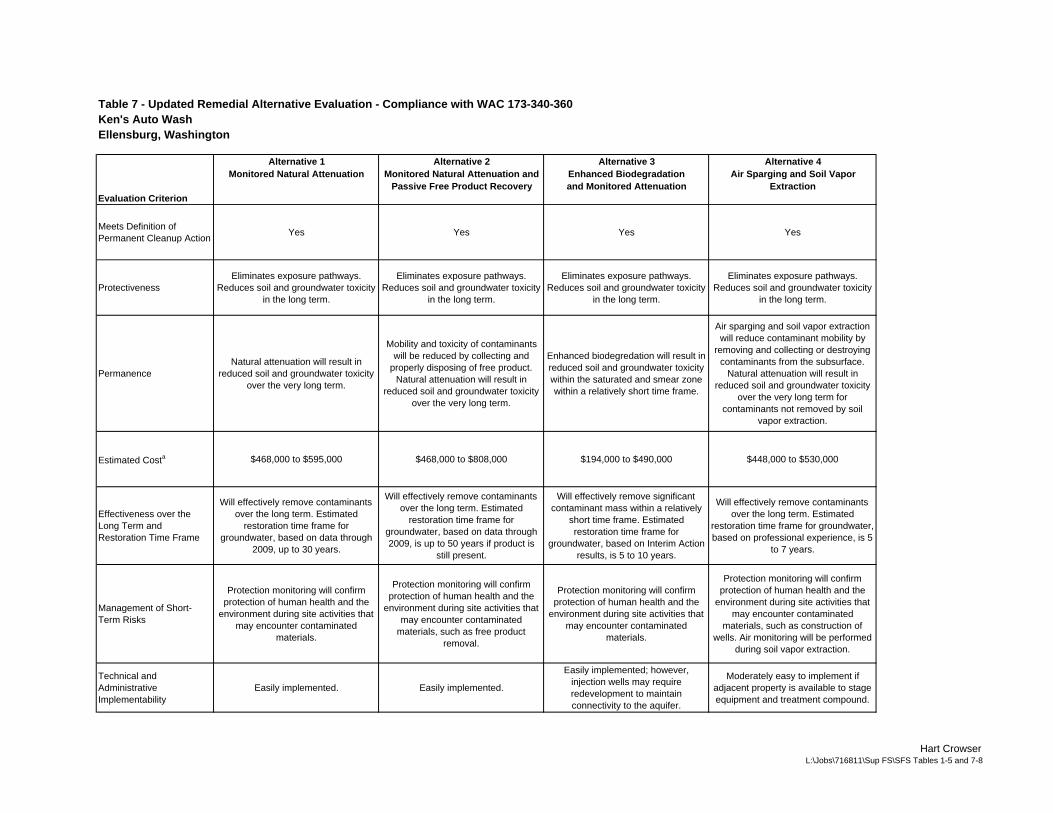
Table 7 - Updated Remedial Alternative Evaluation - Compliance with WAC 173-340-360Ken's Auto WashEllensburg, Washington
Alternative 1 Alternative 2 Alternative 3 Alternative 4Monitored Natural Attenuation Monitored Natural Attenuation and
Passive Free Product RecoveryEnhanced Biodegradation and Monitored Attenuation
Air Sparging and Soil Vapor Extraction
Meets Definition of Permanent Cleanup Action
Yes Yes Yes Yes
ProtectivenessEliminates exposure pathways.
Reduces soil and groundwater toxicity in the long term.
Eliminates exposure pathways. Reduces soil and groundwater toxicity
in the long term.
Eliminates exposure pathways. Reduces soil and groundwater toxicity
in the long term.
Eliminates exposure pathways. Reduces soil and groundwater toxicity
in the long term.
PermanenceNatural attenuation will result in
reduced soil and groundwater toxicity over the very long term.
Mobility and toxicity of contaminants will be reduced by collecting and
properly disposing of free product. Natural attenuation will result in
reduced soil and groundwater toxicity over the very long term.
Enhanced biodegredation will result in reduced soil and groundwater toxicity within the saturated and smear zone within a relatively short time frame.
Air sparging and soil vapor extraction will reduce contaminant mobility by
removing and collecting or destroying contaminants from the subsurface.
Natural attenuation will result in reduced soil and groundwater toxicity
over the very long term for contaminants not removed by soil
vapor extraction.
Estimated Costa $468,000 to $595,000 $468,000 to $808,000 $194,000 to $490,000 $448,000 to $530,000
Effectiveness over the Long Term and Restoration Time Frame
Will effectively remove contaminants over the long term. Estimated
restoration time frame for groundwater, based on data through
2009, up to 30 years.
Will effectively remove contaminants over the long term. Estimated
restoration time frame for groundwater, based on data through 2009, is up to 50 years if product is
still present.
Will effectively remove significant contaminant mass within a relatively
short time frame. Estimated restoration time frame for
groundwater, based on Interim Action results, is 5 to 10 years.
Will effectively remove contaminants over the long term. Estimated
restoration time frame for groundwater, based on professional experience, is 5
to 7 years.
Management of Short-Term Risks
Protection monitoring will confirm protection of human health and the
environment during site activities that may encounter contaminated
materials.
Protection monitoring will confirm protection of human health and the
environment during site activities that may encounter contaminated
materials, such as free product removal.
Protection monitoring will confirm protection of human health and the
environment during site activities that may encounter contaminated
materials.
Protection monitoring will confirm protection of human health and the
environment during site activities that may encounter contaminated
materials, such as construction of wells. Air monitoring will be performed
during soil vapor extraction.
Technical and Administrative Implementability
Easily implemented. Easily implemented.
Easily implemented; however, injection wells may require redevelopment to maintain connectivity to the aquifer.
Moderately easy to implement if adjacent property is available to stage equipment and treatment compound.
Evaluation Criterion
Hart CrowserL:\Jobs\716811\Sup FS\SFS Tables 1-5 and 7-8

Table 8 - Monitoring Schedule for Preferred AlternativeKen's Auto WashEllensburg, Washington
Well Purpose 2013-2017a 2018-2021 2022b
MW-2 Bound Plume - East Annualc Quarterly
MW-3 Background Annualc Biannuale Quarterly
MW-4R Source Area (Upgradient Edge) Quarterlyd Biannuale Quarterly
MW-5 Bound Plume - West Annualc Quarterly
MW-6 Plume Extent Quarterlyd Biannuale Quarterly
MW-12f Bound Plume - Southwest Annualc Quarterly
MW-13 Downgradient Point of Compliance Quarterlyd Biannuale Quarterly
MW-14 Source Area Quarterlyd Biannuale Quarterly
MW-15 Bound Plume - Southeast Annualc Quarterly
Notes:Monitoring will include groundwater level measurements, field parameter measurements, and groundwater sample collection for chemical analyses specified below. If injections
are to be performed into the well, the well will be field-tested for nitrate, nitrite, ammonium, and ferrous iron.a Timeline assumes injections are performed and amendment concentrations have not reduced to background levels. If the site enters monitored attenuation,
sampling defaults to 2018 scope.b Final compliance monitoring would include analysis for NWTPH-Gx, BTEX, and total lead.c Annual monitoring includes analysis of NWTPH-Gx, BTEX, nitrate, sulfate, and total lead.d Quarterly monitoring includes analysis of NWTPH-Gx, BTEX, nitrate, and sulfate. e Biannual refers to twice per year and would be based on typical high and low groundwater elevations at the site. Includes analysis of NWTPH-Gx, BTEX, nitrate, sulfate,
and total lead.f Well not located in May, August, and November 2012 and possibly destroyed. Well status needs to be confirmed during monitoring events.Schedule assumes 5-year review by Ecology following 2013 sampling round. Schedule after 2018 is tentative pending Ecology 5-year review.Monitoring schedule after 2022, if necessary, will be based on review of previous data.Blank entries indicate no monitoring planned in specific wells.
Hart CrowserL:\Jobs\716811\Sup FS\SFS Tables 1-5 and 7-8

N
0 2000 4000
Scale in Feet
Figure
7168
11-0
01.d
wg
03/1
/13
EA
L
7168-11 3/13
Ellensburg, WashingtonKen's Auto Wash
1
Vicinity Map
WASHINGTON
SeattleEllensburg
Note: Base map prepared from Microsoft Streets and Trips 2005.
SubjectProperty

Unpaved Vacant Lot
Approximate Property Boundary
University Way
FairgroundsParking
(Unpaved)
2000 Hot SpotExcavation Footprint
(Gravel Fill)
Winegar's
Alley
Ald
er S
treet
Sidewalk
Sidewalk
Ken's AutoWash
Former USTArea
(Gravel Fill)FormerFuel PumpIsland
Unnamed Gravel Road
MW-1/MW-14
MW-5
MW-12 MW-6
MW-13
MW-15
MW-2
MW-3
MW-4R
N
0 50 100
Scale in Feet
Figure
7168
11-0
02.d
wg
03/2
0/13
EA
L
7168-11 3/13
Ellensburg, WashingtonKen's Auto Wash
2
Site and Well Location Plan
Note: Base map prepared from drawing provided by Sage EarthSciences titled "Proposed Addtional Monitoring Well and ORCInjections Locations," dated January 1998.
Hart Crowser Monitoring Well Location andNumber
Estimated Remaining Area with TPH-Gand/or BTEX Concentrations above MTCAMethod A Soil Cleanup Levels(Based on 2000-2005 Data)
MW-6