supplemental groundwater study …€¦ · december 2013 . national capital parks ... brick, glass,...
TRANSCRIPT

SUPPLEMENTAL GROUNDWATER STUDY
SAMPLING AND ANALYSIS PLAN
OPERABLE UNIT 2, KENILWORTH PARK LANDFILL
WASHINGTON, D.C.
DECEMBER 2013
National Capital Parks - East National Park Service
Prepared by The Johnson Company
100 State Street, Suite 600 Montpelier, VT 05602

Title: Supplemental Groundwater Study SAP Site Name: OU2 Kenilworth Park Landfill Revision Date: 12/6/2013 Site Location: Northeast Washington, D.C. Page: i
TABLE OF CONTENTS
1.0 INTRODUCTION................................................................................................................... 1 1.1 PURPOSE .......................................................................................................................... 2 1.2 DOCUMENT ORGANIZATION.................................................................................... 2
2.0 SITE DESCRIPTION ............................................................................................................. 3 2.1 PREVIOUS WASTE DISPOSAL INFORMATION ..................................................... 3 2.2 SURFACE WATER HYDROLOGY .............................................................................. 4 2.3 REGIONAL AND SITE GEOLOGY ............................................................................. 6 2.4 CURRENT GROUNDWATER MONITORING SYSTEM ......................................... 7 2.5 PREVIOUS GROUNDWATER ANALYTICAL RESULTS ..................................... 10
3.0 DATA QUALITY OBJECTIVES ....................................................................................... 12 3.1 STEP 1 – STATE THE PROBLEM .............................................................................. 13 3.2 STEP 2 – IDENTIFY THE DECISION(S) OF THE STUDY .................................... 13 3.3 STEP 3 – IDENTIFY INPUTS TO DECISION(S) ...................................................... 14 3.4 STEP 4 – IDENTIFY THE BOUNDARIES OF THE STUDY .................................. 15
3.4.1 Spatial Boundaries ................................................................................................ 15 3.4.2 Temporal Boundaries............................................................................................ 15
3.5 STEP 5 – DEVELOP THE ANALYTICAL APPROACH ......................................... 16 3.6 STEP 6 – SPECIFY PERFORMANCE OR ACCEPTANCE CRITERIA ............... 17
3.6.1 Adherence to Standard Operating Procedures ..................................................... 17 3.6.2 Completion of the Entire Sampling Plan .............................................................. 17 3.6.3 Adequate Analytical Detection Limits .................................................................. 17
3.7 STEP 7 – DEVELOP THE PLAN FOR OBTAINING THE DATA ......................... 18 4.0 OVERVIEW OF FIELD ACTIVITIES.............................................................................. 18
4.1 GENERAL ....................................................................................................................... 18 4.1.1 Project Data Needs ............................................................................................... 18 4.1.2 Major Project Tasks .............................................................................................. 19
4.2 PROJECT NARRATIVE ............................................................................................... 20 4.2.1 Aqueous Sample Analysis ..................................................................................... 20 4.2.2 Piezometers and Staff Gauges .............................................................................. 21 4.2.3 Groundwater Monitoring Wells ............................................................................ 23
4.3 PROPOSED INVESTIGATION SUMMARY ............................................................. 26 5.0 REFERENCES ...................................................................................................................... 29
LIST OF FIGURES
Figure 1 Site Location Map (Historical Basemap) Figure 2 Aerial Photograph of Site and Vicinity Figure 3a Historical Layout, 1894 Topographic Map Figure 3b Historical Layout, 1949 and 1963 Aerial Photographs Figure 3c Historical Layout, 1968 and 1984 Aerial Photographs Figure 4 Existing Groundwater Monitoring Wells Figure 5 Previous Water Table Equipotential Maps
Title: Supplemental Groundwater Study SAP Site Name: OU2 Kenilworth Park Landfill Revision Date: 12/6/2013 Site Location: Northeast Washington, D.C. Page: ii
Figure 6 Proposed Groundwater Monitoring Wells and Piezometers LIST OF TABLES
Tables in Text: Text Table 4.2.1 Groundwater Analyses ..................................................................................... 20 Text Table 4.2.2 Proposed Piezometer Locations ....................................................................... 22 Text Table 4.2.3 Proposed Monitoring Well Locations .............................................................. 24 Text Table 4.3 Summary of Investigation Monitoring Installations and Sampling .................... 27 Tables in Attachment: Table 1 Existing Monitoring Well Details Table 2 Historical Groundwater Data – Metals (micrograms per liter, µg/L) Table 3 Historical Groundwater Data – VOCs (micrograms per liter, µg/L) Table 4 Historical Groundwater Data – Pesticides and PCBs (micrograms per liter, µg/L) Table 5 Historical Groundwater Data – SVOCs and TPH (micrograms per liter, µg/L) Table 6 Data Quality Objectives Summary Table
LIST OF APPENDICES
Appendix A Supplemental Groundwater Study Field Sampling Plan (FSP) Appendix B Supplemental Groundwater Study Quality Assurance Project Plan (QAPP)

Title: Supplemental Groundwater Study SAP Site Name: OU2 Kenilworth Park Landfill Revision Date: 12/6/2013 Site Location: Northeast Washington, D.C. Page: iii
ABBREVIATIONS AND ACRONYMS amsl Above mean sea level ARAR Applicable or Relevant and Appropriate Requirement bgs Below ground surface BHC Hexachlorocyclohexane CERCLA Comprehensive Environmental Response, Compensation, and Liability Act CFR Code of Federal Regulations cfs Cubic feet per second cm/s Centimeters per second D.C. District of Columbia DCSEC District of Columbia Sports and Entertainment Commission DDOE District of Columbia Department of the Environment DDOH District of Columbia Department of Health DEHP bis(2-Ethylhexyl)phthalate or di(2-ethylhexyl)phthalate DQO Data quality objective DRO Diesel range organics E & E Ecology & Environment, Inc. °F Degrees Fahrenheit FS Feasibility Study FSP Field Sampling Plan HASP Health and Safety Plan ISU Iowa State University JCO The Johnson Company, Inc. KPN Kenilworth Park North KPS Kenilworth Park South MGS Maryland Geological Survey µg/L Micrograms per liter NACE National Capital Parks-East NCP National Oil and Hazardous Substances Pollution Contingency Plan NOAA National Oceanic and Atmospheric Administration NPS National Park Service NRCS National Resource Conservation Service NTU Nephelometric Turbidity Units OU Operable Unit PAH Polycyclic aromatic hydrocarbon PA/SI Preliminary Assessment/Site Inspection PCB Polychlorinated biphenyl PRG Preliminary remediation goal PSQ Principle study question QAPP Quality Assurance Project Plan QA/QC Quality assurance/quality control RCRA Resource Conservation and Recovery Act RI Remedial Investigation RG Remediation goal SVOC Semi-volatile organic compound TBC To be considered

Title: Supplemental Groundwater Study SAP Site Name: OU2 Kenilworth Park Landfill Revision Date: 12/6/2013 Site Location: Northeast Washington, D.C. Page: iv
TCLP Toxicity characteristic leaching procedure TPH Total petroleum hydrocarbons USEPA United States Environmental Protection Agency USFWS United States Fish and Wildlife Service USGS United States Geological Survey UST Underground storage tank VOC Volatile organic compound
Title: Supplemental Groundwater Study SAP Site Name: OU2 Kenilworth Park Landfill Revision Date: 12/6/2013 Site Location: Northeast Washington, D.C. Page: 1
1.0 INTRODUCTION
The National Park Service (NPS) is the lead agency for the Kenilworth Park Landfill Site
(Site) in the Anacostia Park unit of National Capital Parks-East in Washington, D.C. (Figure 1).
The Site covers 130 acres, including the former Kenilworth Park Landfill North (KPN) and
Kenilworth Park Landfill South (KPS) bisected by Watts Branch, a tributary to the Anacostia
River (Figure 2). The Site includes two operable units (OUs): OU1 comprises surface soils and
subsurface soils, including waste material disposed of in KPN and KPS; OU2 includes shallow
groundwater underlying OU1. Two Preliminary Assessment/Site Inspections (PA/SIs), two
Remedial Investigations (RIs) (one each for KPN and KPS), and one Feasibility Study (FS) for
OU1 (KPN and KPS combined) have been completed by NPS (E & E 2000a; E & E 2000; E & E
2007; E & E 2008; JCO 2012).
Given the cap covering the former landfill and existing Site data, groundwater transport is
the only potential pathway for Site contaminants to migrate to adjacent water bodies, and
groundwater data collected during the RIs do not indicate a significant groundwater transport
pathway. The PA/SIs, RIs, and FS preliminarily concluded that Site contaminants are not
migrating in groundwater to the Anacostia River. The most recent groundwater sampling event
at the Site occurred approximately 7 years ago. The supplemental groundwater study described
in this Sampling and Analysis Plan (SAP) will supplement existing groundwater data by: 1) more
accurately determining groundwater gradients and flow patterns at the Site; and 2) providing
additional subsurface data to evaluate whether dissolved contaminants exist at the Site’s
groundwater discharge boundaries bordering the Anacostia River and the Kenilworth Marsh.
The results of this SAP will be used to develop an OU2 RI Addendum. Depending on the
findings, the RI Addendum will be used to support the existing Proposed Plan or serve as the
basis for development, evaluation, and selection of a response action for OU2.
NPS will implement and document the results of the supplemental groundwater study in
accordance with the Comprehensive Environmental Response, Compensation, and Liability Act

Title: Supplemental Groundwater Study SAP Site Name: OU2 Kenilworth Park Landfill Revision Date: 12/6/2013 Site Location: Northeast Washington, D.C. Page: 2
(CERCLA), the National Oil and Hazardous Substances Pollution Contingency Plan (NCP)
40CFR Part 300, and other applicable local, state, and federal laws and regulations.
1.1 PURPOSE
The purpose of the supplemental groundwater study is to generate data of sufficient
quality and quantity to meet the following objectives.
• Develop a more refined interpretation of the Site groundwater flow paths and
concentrations with a larger monitoring network focused on groundwater discharge to the
Anacostia River. This interpretation will be used to produce a more detailed water table
potentiometric map that illustrates the water table surface and groundwater flow directions
toward groundwater discharge boundaries including the Anacostia River, Kenilworth
Marsh, and Watts Branch.
• More precisely delineate the groundwater chemistry migrating from KPN and KPS to the
primary groundwater/surface water discharge boundaries of the Site at the Anacostia River
and Kenilworth Marsh to determine whether hazardous substances are potentially
migrating into the Anacostia River.
1.2 DOCUMENT ORGANIZATION
The SAP includes this introduction (Section 1), a brief description of the Site and
previous groundwater investigations (Section 2), data quality objectives (DQOs) (Section 3), a
description of the field activities (Section 4), and references (Section 5).
Details of the proposed investigation methodology are presented in the Field Sampling
Plan (FSP) (Appendix A), and the Quality Assurance Project Plan (QAPP) (Appendix B). The
FSP presents detailed descriptions of field activities and procedures. The QAPP details the
analytical methods and detection limits required, field and laboratory quality assurance/quality
control (QA/QC) protocols, data assessment procedures for the evaluation and identification of
data limitations, and preparation of the database and data summaries.

Title: Supplemental Groundwater Study SAP Site Name: OU2 Kenilworth Park Landfill Revision Date: 12/6/2013 Site Location: Northeast Washington, D.C. Page: 3
A project-specific JCO Site Safety and Health Plan (SSHP) (under separate cover)
provides the detailed health and safety procedures that will be employed by The Johnson
Company throughout the supplemental groundwater study.
2.0 SITE DESCRIPTION
Environmental investigations have been performed at the Site since 1998. Although
previous investigations comprehensively investigated the nature and extent of contaminants in
the landfill and cover soils, the focus of this section is a summary of the information related to
groundwater contaminant migration at the groundwater/surface water discharge boundaries to the
Anacostia River. The RIs provide detailed descriptions of the Site, including the history of
operations at the Site that resulted in the current contamination of Site soils and groundwater (E
& E 2007; E & E 2008).
The following Site description summarizes waste disposal information and describes
existing knowledge related to Site groundwater contaminant migration to the Anacostia River.
2.1 PREVIOUS WASTE DISPOSAL INFORMATION
The Kenilworth Landfill received municipal waste and incinerator ash. KPN operated
from 1942 until 1970. Soil borings at KPN have encountered the following materials in the
landfill waste: burned combustible materials, brick, glass, rubble, construction debris, metal1,
wood, plastic, and incinerator ash. KPS was permitted in 1958 for waste disposal and used
primarily after 1968, when burning was prohibited (E & E 2007). Boring logs from monitoring
wells installed at KPS describe landfill wastes including glass, paper, wood, metal, concrete, ash,
leather, and plastic. In the log for one boring (MW13, located at the southern end of KPS), the
smell of diesel in a soil core was recorded (E & E 2008).
1 During the 2006 regrading and filling activities by the District of Columbia Sports and Entertainment Commission (DCSEC) in the eastern side of KPN, a “thermos” sized unexploded ordnance (munitions shell) was unearthed by a construction worker (JCO 2012). The ordnance was removed from the Site and destroyed by the US Army Corps of Engineers; no other ordnances have been reported at the landfill and no historical activities at the Site are known to have been the source of the ordnance (JCO 2012).

Title: Supplemental Groundwater Study SAP Site Name: OU2 Kenilworth Park Landfill Revision Date: 12/6/2013 Site Location: Northeast Washington, D.C. Page: 4
There are approximately 3.5 million tons of waste in the landfill at KPN and KPS,
including incinerator ash, waste that was burned in-place, and unburned municipal solid waste
(JCO 2012). A cap of approximately 3 to 15 feet (the greater thickness is on the eastern side of
KPN) of primarily clayey materials was placed on top of the KPN landfill when it ceased
operations, and the soil was amended using sewage sludge to establish grass (E & E 2007). The
KPS landfill was initially capped when the landfill was closed around 1970, and additional
capping occurred in 1997 and 1998; the resulting cap thickness at KPS ranges from 2 to more
than 20 feet, with the thickest cap on the western side of KPS (E & E 2008).
2.2 SURFACE WATER HYDROLOGY
The most significant surface water feature associated with and bordering the Site is the
Anacostia River (Figure 1), which typically flows from north to south along the western
boundary of the Site, although tidal influences can affect the flow direction. A water stage
recorder that registers tidal elevations every 6 minutes is located on the Anacostia River
approximately 77.5 feet upstream of the tidal inlet to Kenilworth Marsh (USGS 2012), which is
approximately 1,000 feet north of the northern edge of KPN. From November 1 to 15, 2012,
tidal elevations ranged from -2.1 feet above mean sea level (amsl) at low tide to +2.95 feet amsl
at high tide, with a maximum single day difference of 4.34 feet. On average, a 3.0 foot tidal
exchange occurs twice daily at the Kenilworth Marsh (NPS 2011), although major storm events
including the 2012 storm Sandy have increased maximum high tide elevations to close to 5 feet
amsl at this gauging station (USGS 2012). A segment of seawall eligible for inclusion on the
National Register of Historic Places is located along the Anacostia River bank approximately
between MW-6N and MW-7N at KPN (Figure 4), but is not present at KPS.
The majority of the Site is mapped as a known wetland, called “Kenilworth Aquatic
Gardens,” by the District of Columbia Department of Health (DDOH) (DDOH 2012), but there
are no wetlands identified at the Site in the National Wetlands Inventory (USFWS 2012). The
77-acre Kenilworth Marsh, located at the northern edge of the landfill at KPN, was dredged to
create a lake in 1940, then reconstructed as a wetland in 1993 by the Army Corps of Engineers,
and has been managed as a wetland since then by the National Capital Parks-East (NACE) unit

Title: Supplemental Groundwater Study SAP Site Name: OU2 Kenilworth Park Landfill Revision Date: 12/6/2013 Site Location: Northeast Washington, D.C. Page: 5
of NPS (Syphax and Hammerschlag 1995; USGS 2008). Dredge spoils from the Anacostia
River were used as fill to reconstruct the Kenilworth Marsh wetland (Syphax and Hammerschlag
1995).
The Watts Branch stream flows through the Site between KPN and KPS to the Anacostia
River. The Watts Branch has been characterized as “one of the largest tributaries to the
Anacostia River located within D.C. boundaries” (USFWS 2002). The reach of Watts Branch
that parallels the northern side of Mayfair Mansions and Paradise Apartments (the former
Benning Race Course) was shown as channelized as long ago as 1894, as shown on Figure 3a2.
More recent aerial photographs in Figures 3b and 3c show the Watts Branch channel extended to
flow around Mayfair Mansions and Paradise Apartments, discharging directly to the Anacostia
River. The U.S. Fish and Wildlife Service (USFWS) identified 41 stormwater outfalls and 13
stormwater pipe/box culvert combinations that discharge into the D.C. portion of Watts Branch.
The channelized upper and lower reaches of Watts Branch receive flows from numerous storm
sewers, resulting in poor instream habitat ratings for all reaches, primarily caused by
“hydrocarbons, heavy metals, pesticides, sewage, and sediment” (USFWS 2002). Recently, the
money generated from the DC bag tax was used to restore 1.8 miles of this watershed. The
restoration design included structures that create instream habitat and reduce flood stresses on
channel banks, while riparian vegetation provides bank stability and wildlife habitat.
The United States Geological Survey (USGS) maintains a stage recorder in the Watts
Branch at a location approximately 3,000 feet upstream of the southern border of KPS,
approximately 10 feet upstream of the Minnesota Avenue bridge (USGS 2013). Between 1993
and 2011, measured discharge in the Watts Branch has ranged from 0.58 to 130 cubic feet per
second (cfs), but average annual discharge values over these recorded years have ranged from
1.76 to 7.25 cfs (USGS 2013).
2 The difference in channel locations between today’s mapping and the 1894 map are likely a result of scale differences, not channel movement.

Title: Supplemental Groundwater Study SAP Site Name: OU2 Kenilworth Park Landfill Revision Date: 12/6/2013 Site Location: Northeast Washington, D.C. Page: 6
There is an unnamed southern tributary to Watts Branch located outside the eastern
boundary of KPS (Figure 4). This tributary reportedly originates in storm drains in the vicinity
of Grant Street and previously drained to a constructed silt pond (E & E 2000), but currently
discharges into Watts Branch.
2.3 REGIONAL AND SITE GEOLOGY
The Site is located within the Atlantic Coastal Plain physiographic province, which is
underlain by a wedge-shaped sequence of sandstones, clay beds, gravel deposits, and silts that
increases in thickness from west to east (NPS 2008). The Fall Line, at which the wedge of
Coastal Plain sediments is thinnest, is located approximately 4 miles west of the Site. Arundel
Clay (dark grey and maroon lignitic clay) is the dominant Coastal Plain sediment at the Site, but
the Patapsco formation (gray, brown, and red variegated silts and clays with sand and minor
gravels) may also be present above the Arundel Clay (MGS 1968). No deep boring logs from
the Site are available for review, but a well log from the National Arboretum recorded the
thickness of Arundel Clay at approximately 100 feet. Because the Arboretum is located on the
western bank of the Anacostia River near the Site, a similar thickness could be expected at the
Site.
The Site is shown on the NACE geologic map as being in an area of disturbed ground
and artificial fill, surrounded by alluvial surficial deposits (NPS 2008). A geologic map from
1958, which pre-dates the landfill, shows that the Site was covered by the Pamlico Formation
and recent alluvium, which is composed of gravel, sand, and silt (including artificial fill) (USGS
1958).
According to cross-sections presented in the KPN RI report, the thickness of landfill
waste at KPN varies from approximately 10 feet to 30 feet, with the thickest layer located in the
northwestern portion of the property (E & E 2007). Although there were no borings at KPS that
were advanced to the bottom of the waste except at the edges, the maximum waste thickness has
been estimated at approximately 20 feet near the center of the landfill (E & E 2008).

Title: Supplemental Groundwater Study SAP Site Name: OU2 Kenilworth Park Landfill Revision Date: 12/6/2013 Site Location: Northeast Washington, D.C. Page: 7
Based on drilling logs from previous investigations at KPN and KPS, the landfill waste at
the Site has a soil cover composed of silty clay and silty loam of unknown origin, and the waste
is composed of gravel, ash, sand, silt, clay, glass, metal, and rubber. Throughout KPS and in the
southwestern portion of KPN, brown silty clay was recorded immediately beneath the waste,
underlain by soft, wet, plastic clay. At the eastern side of KPN, a layer of sand and gravel
approximately 10 feet thick was recorded between the waste and Arundel Clay (tough, red and
cream clay) at the two easternmost wells, but the gravel was only recorded as a thin layer in the
borings to the west.
2.4 CURRENT GROUNDWATER MONITORING SYSTEM
The existing groundwater monitoring system is evaluated in this section with respect to
the current information available for the purpose of designing a supplemental groundwater study.
The existing monitoring system will be refined to thoroughly evaluate groundwater discharge
from the Site to the Anacostia River and Kenilworth Marsh.
A total of 29 wells have been installed at the Site, as follows and shown in Figure 4:
• 16 wells at KPN (the suffix “R” indicates that the well is a replacement of an
older well) - MW1N, MW-2N, MW-3NR, MW-4N, MW-5N, MW-6N, MW-7N,
MW-8NR, MW-9NR, MW-10N, MW-11N, MW-12N, MW-13N, MW-14N,
MW-15N, and MW-16N; and
• 13 wells at KPS - MW1 through MW13.
All wells were installed between 1998 and 2008 during investigations by Ecology and
Environment (E & E). The boring and well installation logs are included in the KPN and KPS
RI reports (E & E 2007; E & E 2008). One monitoring well, MW-11N, is located upgradient of
the landfill in the northeastern corner of KPN. MW1 through MW6 at KPS were installed in
hand-augered holes along the banks of Watts Branch and the Anacostia River. All other wells
were installed by a hollow-stem auger, and soils were retrieved in split spoons at irregular
intervals; thus, no continuous cores were collected or observed. Although there is a stream

Title: Supplemental Groundwater Study SAP Site Name: OU2 Kenilworth Park Landfill Revision Date: 12/6/2013 Site Location: Northeast Washington, D.C. Page: 8
gauge on the Watts Branch located at Minnesota Avenue, outside the Site, there have been no
contemporaneous measurements of the stream gauge and monitoring wells.
Based on boring logs or other statements in the RI reports, the following interpretations
of monitoring well screen (i.e., groundwater intake) depths and locations relative to the
objectives of the supplemental groundwater study are provided:
• 13 well screens are installed outside of or below landfill wastes including 6 at
KPS (MW1 through MW6), and 7 at KPN (MW-1N, MW-3NR, MW-11N, MW-
12N, MW-14N through MW-16N);
• 12 well screens are installed within landfill wastes including 5 at KPS (MW8,
MW9, and MW11 through MW13), and 7 at KPN (MW-2N, MW-4N, MW-7N,
MW-8N, MW-9NR, MW-10N, and MW-13N);
• 4 well screens may be in landfill wastes, i.e., boring logs are imprecise, including
2 at KPS (MW7 and MW10) and 2 at KPN (MW-5N and MW-6N); and
• approximately 12 of these 29 wells are located along likely groundwater
discharge boundaries to the Anacostia River and Kenilworth Marsh relative to the
downgradient flow direction from the landfill at KPS and KPN.
Based on water table maps and estimated groundwater flow direction maps presented in
the RI reports (see Figure 5), the shallow groundwater table is mounded under both KPN and
KPS as a result of the landfills and groundwater primarily migrates toward the topographic low
discharge areas at Kenilworth Marsh and the Anacostia River. Portions of the Watts Branch
could also influence groundwater flow directions, but the degree of impact cannot be determined
by existing data; Watts Branch surface water elevation measurements relative to groundwater
elevations were not collected. The maximum groundwater elevation measured at MW-8 near the
top and center of KPS was approximately 8 feet higher than the maximum groundwater elevation
at KPN, near the northwestern edge of the landfill at MW-5N.

Title: Supplemental Groundwater Study SAP Site Name: OU2 Kenilworth Park Landfill Revision Date: 12/6/2013 Site Location: Northeast Washington, D.C. Page: 9
Slug tests were performed to estimate hydraulic conductivities in all monitoring wells
except MW-9 at KPS. The hydraulic conductivities at KPS ranged from 2 x 10⁻⁶ to 2 x 10⁻⁵
centimeters per second (cm/s) except at wells MW12 and MW13, which were tested at a later
date and had higher hydraulic conductivities of 3 x 10⁻³ and 6 x 10⁻³ cm/s. Hydraulic
conductivity values at KPN varied by more than three orders of magnitude from 2 x 10⁻⁶ to 3 x
10-3cm/s, although eight of the twelve wells tested had results ranging from 1 x 10⁻⁴ to 6 x 10⁻⁴.
Accurate average hydraulic conductivity values for specific subsurface units cannot be calculated
using the existing well screen locations given the large variability of geologic units and landfill
wastes intersected by the well screens. However, the most common lower hydraulic
conductivity values are representative of the silty clay material commonly logged beneath
landfill wastes. The supplemental groundwater monitoring system will provide additional
hydraulic conductivity measurements from slug test in new wells screens installed relative to
more precise geologic logging.
Depth to the groundwater table was measured and recorded in June of 2001 at KPS, in
March of 2006 at KPN, and in December of 2012 at both KPN and KPS. A comparison of water
levels between June of 2001 and December of 2012 at KPS indicates no seasonal trend, with
some levels higher and some lower. At KPN, water levels in March of 2006 were an average of
0.67 feet higher than in December.
Tidal influence studies, intended to evaluate whether water levels in Site monitoring
wells are affected by the tides in the Anacostia River, were performed at KPS in June of 2001
and at KPN in March of 2006. The following two monitoring wells were chosen for the tidal
influence study at KPS: MW6, located adjacent to Watts Branch approximately 500 feet from
the Anacostia River bank; and MW10, located at the eastern edge of KPS, approximately 1,250
feet from the Anacostia River. The MW10 water levels were intended to provide a baseline of
barometric pressure effects to compare to the MW6 water levels. The water levels were
supposed to be recorded for 12 hours, but the transducer in MW6 malfunctioned for
approximately 3 of these hours. No tidal effect was measured in MW10. In MW6, the results

Title: Supplemental Groundwater Study SAP Site Name: OU2 Kenilworth Park Landfill Revision Date: 12/6/2013 Site Location: Northeast Washington, D.C. Page: 10
indicated a minimal water level change: the Anacostia River level changed by approximately 36
inches (3 feet) while the groundwater level in MW6 changed approximately 4.1 inches indicating
a “tidal efficiency” of 4.1 inches/36 inches, or 11 percent. The tidal response was calculated to
have been delayed by approximately 9 hours. Based on the tidal efficiency and the delayed
response, E & E concluded that “the well is not reached by surface water recharging the stream
bank during the tidal cycle, and well water reflects the quality of groundwater discharging from
the Site” (E & E 2008). E & E also concluded that as a result of the relatively low hydraulic
conductivity values (averaging 1 x 10⁻⁵ cm/s) at the monitoring wells along the Anacostia River
and Watts Branch (MW1 through MW5), these wells would respond similarly to MW6, although
none of these wells were monitored.
The tidal influence study at KPN was performed using a different approach than at KPS.
Pressure transducers and data loggers were installed at five wells at KPN (MW-4N, MW-5N,
MW-6N, MW-7N, and MW-15N), and the change in groundwater levels and Anacostia River
surface water levels was recorded for 24 hours. During this time, the Anacostia River level
varied between approximately 0.25 feet amsl to 3 feet amsl, while the water levels in all five
KPN monitoring wells varied less than 0.01 foot. E & E concluded, “it appears that there is no
tidal influence on groundwater at the landfill and that the Anacostia River does not appear to
have a hydrologic connection to the KPN landfill. Apparently flow is only from the landfill to
the river and [there is] no flow from the river into the landfill wells at high tide stages.” (E & E
2007).
2.5 PREVIOUS GROUNDWATER ANALYTICAL RESULTS
The entire landfill is considered a potential source of groundwater contamination, but
groundwater analytical results from previous investigations indicate that mobile contaminants
appear to be limited to metals and a limited number of VOCs and SVOCs; it is possible that
sporadic and relatively low detections of less soluble contaminants, such as PCBs and some
metals, are related solely to the turbidity of the samples and not dissolved contaminant migration.
In addition, of the 29 monitoring wells at the Site, 12 are screened entirely in landfill waste and
another 4 appear to be at least partially screened in waste; therefore, only 13 wells can be used to

Title: Supplemental Groundwater Study SAP Site Name: OU2 Kenilworth Park Landfill Revision Date: 12/6/2013 Site Location: Northeast Washington, D.C. Page: 11
indicate possible groundwater contaminant transport through geologic media. Of these
remaining 13, at least 7 appear to be incapable of providing a non-turbid sample. Therefore, the
existing data set of limited detections of contaminants in groundwater may include false
positives, and may not accurately represent groundwater contaminant transport in fine-grained
deposits at the groundwater/surface water discharge boundaries to the Anacostia River. To
determine if dissolved contaminants are transported to primary surface water bodies, monitoring
well construction and sampling methods techniques will focus on reducing or eliminating
turbidity. The following standard well construction techniques will be used to minimize
turbidity in groundwater samples collected from new monitoring wells: 1) pre-packed well
screens with additional filter pack surrounding the pre-packed screen; 2) thorough well
development until groundwater turbidity is reduced and stable; 3) careful placement of larger and
longer filter packs, grout, and bentonite seal above the well screen; and 4) selecting fine grained
sand for the filter pack. Despite well construction precautions and the planned use of low-flow
sampling techniques, previous sampling data and geologic logs indicate that it may be not be
possible to avoid turbid groundwater samples. Some areas of the Site may require screening
monitoring wells in fine-grained river sediments and/or clay fill, which cannot be completely
filtered by the well’s sand pack or avoided by low-flow sampling techniques. Therefore,
collecting both filtered and non-filtered metals samples at each location during this study will
provide data to evaluate whether previous metals results were affected by suspended particles.
All previous sampling results are summarized in Tables 2 through 5. The lowest
relevant3 human health or ecological screening level is also shown on each table for reference.
The following metals and metalloids were detected above reporting limits in previous
samples: aluminum, antimony, arsenic, barium, beryllium, cadmium, calcium, chromium (total),
cobalt, copper, iron, lead, magnesium, manganese, mercury, nickel, potassium, selenium, silver,
3 The lowest concentration among the following standards and screening levels is provided in the table: U.S. Environmental Protection Agency Maximum Contaminant Levels (MCLs) (USEPA 2013); DC District of the Environment Class G1 Groundwater Standards 21 DCMR § 1150 (1994); and the National Park Service Ecological Screening Values (NPS 2013).

Title: Supplemental Groundwater Study SAP Site Name: OU2 Kenilworth Park Landfill Revision Date: 12/6/2013 Site Location: Northeast Washington, D.C. Page: 12
sodium, thallium, vanadium, and zinc. It is possible that some of the less soluble metals were
present at relatively high concentrations in some samples because they were sorbed to sediments
in highly turbid samples, particularly those collected at KPS from wells along the Anacostia
River.
The VOCs acetone, benzene, carbon disulfide, chlorobenzene, chloroform, methylene
chloride (also known as chloromethane), toluene, and xylenes have been detected above
laboratory reporting limits in previous samples; however, some of these VOCs are possible
laboratory contaminants, particularly acetone and methylene chloride.
Although multiple pesticides were detected at estimated concentrations (i.e., below
laboratory reporting limits), only beta hexachlorocyclohexane (BHC) appears to have been
present above the laboratory reporting limit in one groundwater sample from MW3 at KPS.
One PCB, Aroclor-1254, was detected above the laboratory reporting limit in one sample
from MW-10N at KPN.
SVOC detections above laboratory reporting limits were limited to benzo(a)pyrene,
benzoic acid, DEHP, naphthalene, and phenanthrene.
As a result of sampling methods and possibly monitoring well construction methods,
groundwater samples from monitoring wells along the Anacostia River were always turbid and,
therefore, could reflect concentrations of contaminants that are sorbed to sediments rather than
dissolved in groundwater. Furthermore, the existing detections of all contaminants do not
represent clear patterns of groundwater plumes or source areas.
3.0 DATA QUALITY OBJECTIVES
Data Quality Objectives (DQOs) are statements that define the type, quality, quantity,
purpose, and use of data required to be collected in a study to achieve the study goals and
objectives. The design of a study is closely tied to the DQOs, which serve as the basis for key

Title: Supplemental Groundwater Study SAP Site Name: OU2 Kenilworth Park Landfill Revision Date: 12/6/2013 Site Location: Northeast Washington, D.C. Page: 13
study design features such as the number and location of samples to be collected and the
chemical analyses to be performed. Table 6 summarizes the supplemental groundwater study
DQOs described in the following sections.
3.1 STEP 1 – STATE THE PROBLEM
Previous groundwater sampling at the Site detected a limited number of contaminants in
groundwater. The RI and FS determined that there are no residential, municipal, or industrial
wells or surface water intakes at the Site. Drinking water in the neighborhoods surrounding the
Site is provided by DC Water, the District’s Water and Sewer Authority. Public water intakes
operated by DC Water are in the Potomac River and in reservoirs, and there are no public
drinking water intakes in the Anacostia River or in groundwater near or downstream of the Site
(DC Water 2012). Regardless, because contaminated groundwater could discharge into the
Anacostia River and Kenilworth Marsh and impact recreational uses and aquatic ecological
receptors, definition and delineation of contaminated groundwater is required. While the PA/SIs,
RIs, and FS data show that the dissolved contaminants migrating in groundwater to the
Anacostia River and Kenilworth Marsh are limited and were detected at relatively low
concentrations, turbid samples may have produced false positives; also, the sampling density at
groundwater discharge areas may be considered insufficient.
Given the existing data, the problem statement for the supplemental groundwater study is
as follows.
• An improved and more densely spaced groundwater monitoring network installed at the
groundwater/surface water discharge boundary of the Site and Anacostia River is
considered necessary to collect sufficient quality and quantity of groundwater samples
and confirm conclusions from previous investigations that there are no risks to human
and ecological receptors from Site groundwater discharging to the Anacostia River.
3.2 STEP 2 – IDENTIFY THE DECISION(S) OF THE STUDY
Additional groundwater data collected from the supplemental groundwater study will be
incorporated into the decision-making process to further evaluate whether and to what extent

Title: Supplemental Groundwater Study SAP Site Name: OU2 Kenilworth Park Landfill Revision Date: 12/6/2013 Site Location: Northeast Washington, D.C. Page: 14
contaminated groundwater may be entering the Anacostia River or Kenilworth Marsh and posing
a potential human health or ecological risk for recreational users or the aquatic ecosystem
receptors.
This supplemental groundwater study will collect additional data to answer the following
principle study questions (PSQs).
• Is there evidence to indicate that dissolved contaminants of concern in groundwater are
migrating from the Site into the Anacostia River or Kenilworth Marsh at the
groundwater/surface water discharge boundary at concentrations exceeding human
health or ecological screening levels?
• If contaminants above screening levels are detected in groundwater, can the contaminant
transport pathway be defined sufficiently to indicate the general area of concern on the
Site causing the contaminant discharge, such as a source area?
3.3 STEP 3 – IDENTIFY INPUTS TO DECISION(S)
The purpose of this step is to identify the data required to answer to the PSQs listed in
Section 3.2 and to determine which inputs require environmental measurements. The four types
of data required to answer the PSQ are as follows.
• Groundwater contaminant data from existing and additional monitoring wells at the
groundwater/surface water discharge boundary between KPS and the Anacostia River,
and between KPN and Kenilworth Marsh and the Anacostia River. These data will be
used to determine whether hazardous substances above ecological and human health
screening concentrations are potentially migrating into the Anacostia River.
• Water level measurements from existing and new monitoring wells, piezometers, and
surface water adjacent to the Site. These data will be used to develop a potentiometric
surface map that illustrates groundwater gradient directions at the Site to further
characterize groundwater/surface water discharge boundaries at the Anacostia River and
at Kenilworth Marsh, Watts Branch and an unnamed south tributary to Watts Branch, all
of which flow into the Anacostia River.

Title: Supplemental Groundwater Study SAP Site Name: OU2 Kenilworth Park Landfill Revision Date: 12/6/2013 Site Location: Northeast Washington, D.C. Page: 15
• Continuous groundwater water-level measurements in monitoring wells along
Site/Anacostia River boundaries to establish if tidal fluctuations impact groundwater
levels near groundwater discharge boundaries along the Anacostia River and Kenilworth
Marsh.
• Shallow geologic and permeability data at the discharge boundaries to assess migration
pathways and rates.
Table 6 shows the specific requirements for the sampling event to be conducted in the fall
of 2013 and how each type of data will be used.
3.4 STEP 4 – IDENTIFY THE BOUNDARIES OF THE STUDY
The objective of this step is to define the spatial and temporal components of the study
area.
Figure 6 shows a map of the study area. The boundary of the study area is defined by
combining the data needed with the spatial and temporal boundaries.
3.4.1 Spatial Boundaries
The spatial boundaries identified for this study are the groundwater/surface water
discharge boundaries downgradient of the Site, which include where the Site borders the
Anacostia River, in addition to other surface waters that may significantly impact the Anacostia
River, including the Kenilworth Marsh, Watts Branch, and the unnamed south tributary to Watts
Branch.
3.4.2 Temporal Boundaries
In order to provide an accurate potentiometric surface map of the groundwater table
gradient direction relative to tidal influence of the Anacostia River, a minimum of two water
level measurements will be collected at all monitoring locations near high and low tide within
approximately one hour. If groundwater levels appear to be significantly tidally influenced,

Title: Supplemental Groundwater Study SAP Site Name: OU2 Kenilworth Park Landfill Revision Date: 12/6/2013 Site Location: Northeast Washington, D.C. Page: 16
groundwater samples will be collected at the approximate time of low tide to sample
groundwater for contaminants during maximum gradients toward the Anacostia River.
3.5 STEP 5 – DEVELOP THE ANALYTICAL APPROACH
The analytic approach for each of the three types of data required to answer the PSQ is
summarized below.
1. Supplemental groundwater chemistry data at the groundwater/surface water discharge
boundaries of the Anacostia River and Kenilworth Marsh:
Groundwater chemistry data at the groundwater/surface water discharge boundaries of
the Anacostia River and Kenilworth Marsh will be compared to human health and ecological
screening concentrations to evaluate the proximity and potential migration of hazardous
substances from the Site to the Anacostia River. Monitoring well design and sampling methods
selected with knowledge of the Site groundwater and geologic characteristics are expected to
provide more representative groundwater sample chemistry. Increased sample location density
at the groundwater/surface water discharge boundary will improve groundwater chemistry
interpretation of the nature and extent of contamination downgradient from the Site.
2. Supplemental and tide-related water level measurements:
Groundwater and surface water measurements will used to develop a potentiometric
surface map that will supplement the existing data and confirm water table gradient directions
during low and high tide of the Anacostia River.
3. Supplemental geologic and hydraulic permeability information:
Additional geologic and subsurface permeability information from supplemental well
logs and monitoring well slug tests will be used to assess groundwater flow rates relative to the
Site geology and groundwater concentrations, and will provide insight into contaminant transport
to surface water.
Title: Supplemental Groundwater Study SAP Site Name: OU2 Kenilworth Park Landfill Revision Date: 12/6/2013 Site Location: Northeast Washington, D.C. Page: 17
3.6 STEP 6 – SPECIFY PERFORMANCE OR ACCEPTANCE CRITERIA
3.6.1 Adherence to Standard Operating Procedures
The details of the field and analytical tasks and activities are described in the FSP
(Appendix A) and the QAPP (Appendix B). Standard Operating Procedures (SOPs), specified in
the FSP and QAPP and available upon request, detail procedures for conducting tasks in the
field, analyzing samples in the laboratory, and evaluating and managing data.
To mitigate the potential for errors associated with sampling, field procedures will be
consistent with the FSP and SOPs, which describe processes such as sample collection and
documentation, geologic logging, and decontamination procedures.
For laboratory analysis of samples, quality assurance/quality control (QA/QC) steps
(such as the laboratory controls, matrix spikes, matrix spike duplicates, blanks, etc.) will be
consistent with requirements described in the QAPP. Verification that the analytical laboratory
adhered to its Laboratory Quality Assurance Plan (QAP) and the analytical method procedures
for sample analysis will be documented.
Data validation establishing that data are of sufficient quality to be used in making the
project decisions for which they were intended will be performed by a qualified data validator.
3.6.2 Completion of the Entire Sampling Plan
Completion of the entire sampling plan will be verified by The Johnson Company’s
Project Manager. If any part of the plan is not able to be completed, the consequences of that
data gap on achieving the DQOs for this study will be identified and described.
3.6.3 Adequate Analytical Detection Limits
Worksheet 15 of the QAPP (Appendix A) lists the human health and ecological screening
concentrations that will be used to evaluate the groundwater chemistry data and the specific
analytical detection limits achievable for this supplemental groundwater study.
Title: Supplemental Groundwater Study SAP Site Name: OU2 Kenilworth Park Landfill Revision Date: 12/6/2013 Site Location: Northeast Washington, D.C. Page: 18
3.7 STEP 7 – DEVELOP THE PLAN FOR OBTAINING THE DATA
The FSP (Appendix A) and the QAPP (Appendix B) present plans for conducting the
investigation in a manner that generates the data required to meet the DQOs identified in Section
3.0. The FSP presents detailed descriptions of field activities and procedures, analytical
requirements and data reduction, and preparation of the data summaries. The QAPP (Appendix
B) details the analytical methods and detection limits required for the initial defined data needs,
QA/QC protocols, and data assessment procedures for the evaluation and identification of data
limitations.
4.0 OVERVIEW OF FIELD ACTIVITIES
4.1 GENERAL
This supplemental groundwater study uses existing data to design and develop a more
precise investigation of groundwater/surface water discharge boundaries, where potential
impacts to the Anacostia River, Watts Branch, and Kenilworth Marsh have been shown from
previous investigations to be negligible and potentially the result of turbid samples. Project data
needs and major tasks are briefly summarized below with further details in the following sections
and in the FSP (Appendix A) and QAPP (Appendix B). The FSP will document in greater detail
the specific investigation techniques that will be used at the Site to fulfill the DQOs.
4.1.1 Project Data Needs
o Supplemental groundwater chemistry data at the groundwater/surface water discharge
boundaries of the Anacostia River and Kenilworth Marsh to determine whether hazardous
substances above ecological and human health screening concentrations are potentially
migrating into the Anacostia River.
o Supplemental and tide-related water level measurements to develop a potentiometric surface
map that will confirm water table gradient directions during low and high tide of the
Anacostia River.

Title: Supplemental Groundwater Study SAP Site Name: OU2 Kenilworth Park Landfill Revision Date: 12/6/2013 Site Location: Northeast Washington, D.C. Page: 19
o Supplemental geologic and hydraulic permeability information to assess groundwater flow
rates relative to the Site geology and groundwater concentrations, and provide insight into
contaminant transport to surface water.
4.1.2 Major Project Tasks
o Characterize Groundwater Discharge to the Anacostia River - Water-table monitoring wells
will be installed at a sufficient density to characterize the full nature and extent of
groundwater contamination, gradient directions, and hydraulic conductivity along the
downgradient borders of the Site where shallow groundwater discharges to the Anacostia
River, Kenilworth Marsh, or surface water that could impact the Anacostia River with Site
contaminants. Deeper wells will be coupled with some shallow water-table wells to
determine the vertical extent of contaminant transport.
Groundwater samples will be collected from new and some existing wells located at the most
apparent downgradient Site borders and analyzed for the Site-related contaminants discussed
in Section 2.5 to evaluate the potential for contaminant migration to the Anacostia River.
Water levels will be measured during low and high tide events in all existing and new wells,
and at specific surface water locations to map the groundwater table horizontal gradient
direction and vertical gradient directions at new coupled monitoring well locations. If
contaminants are present in groundwater at these downgradient locations above
concentrations of concern, additional monitoring locations and groundwater samples may be
required to further delineate the areas of dissolved contamination discharge. Borehole
logging will provide information about subsurface geology that will be used to assess
contaminant transport pathways and potential response action alternatives.
o Groundwater Discharge to Kenilworth Marsh and Watts Branch - Piezometers and surface
water staff gauges will be installed where the Site borders the Kenilworth Marsh and Watts
Branch surface waters that flow into the Anacostia River. Piezometers will be used for
water-level monitoring along with data from staff gauges to map shallow groundwater
gradient directions from the landfill relative to the surface water elevations in Watts Branch

Title: Supplemental Groundwater Study SAP Site Name: OU2 Kenilworth Park Landfill Revision Date: 12/6/2013 Site Location: Northeast Washington, D.C. Page: 20
and the Kenilworth Marsh. Anacostia River levels will be downloaded from the website for
the USGS Anacostia River water stage recorder, which registers water levels every 6
minutes. All piezometer locations will include a deep and shallow piezometer to assess
vertical gradients at potential discharge areas.
4.2 PROJECT NARRATIVE
Key elements of the FSP are discussed in this section. Because the Site is within a park,
all field activities will be planned in coordination with park personnel and implemented in a
manner that protects public safety and preserves public enjoyment of the park. The analytical
results will be evaluated to determine if the investigation objectives were achieved. Proposed
sampling locations for this study are illustrated on Figure 6.
4.2.1 Aqueous Sample Analysis
Previous groundwater samples at existing wells have indicated the presence of
contaminants above human health and ecological screening concentrations, as discussed in
Section 2.5. The analyte list in previous investigations did not include dioxins in soil or
groundwater. The supplemental groundwater study does not include groundwater sampling for
dioxins because dioxins are hydrophobic, strongly sorb to soils, and are typically not mobile in
groundwater in the absence of an oil medium, and there is no historical evidence of high
concentrations of petroleum in Site groundwater. The proposed groundwater laboratory analyses
are described below in Text Table 4.2.1.
Text Table 4.2.1 Groundwater Analyses
Analyte Group and Rationale Specific Analytes
Metals – Groundwater will be analyzed for the Target Analyte List of 23 metals. Two sets of samples will be collected: one unfiltered (total metals) and filtered (dissolved metals) to evaluate transport in low permeability silts.
TAL 23 metals: aluminum, antimony, arsenic, barium, beryllium, cadmium, calcium, chromium (total), cobalt, copper, iron, lead, magnesium, manganese, mercury, nickel, potassium, selenium, silver, sodium, thallium, vanadium, and zinc.

Title: Supplemental Groundwater Study SAP Site Name: OU2 Kenilworth Park Landfill Revision Date: 12/6/2013 Site Location: Northeast Washington, D.C. Page: 21
Text Table 4.2.1 Groundwater Analyses
Analyte Group and Rationale Specific Analytes
Polycyclic aromatic hydrocarbons (PAHs) and DEHP – Groundwater will be analyzed for a list of 18 PAHs because PAHs were detected in some historical groundwater samples and PAH contamination in the Anacostia River is a known concern. Groundwater will be analyzed for DEHP because this compound was detected in several previous samples.
18 PAHs: Acenaphthene, acenaphthylene, anthracene, benz(a)anthracene, benzo(b)fluoranthene, benzo(a)pyrene, benzo(g,h,i)perylene, benzo(k)fluoranthene, chrysene, dibenz(a,h)anthracene, fluoranthene, fluorene, indeno(1,2,3-cd)pyrene, 1-methylnaphthalene, 2-methylnaphthalene, naphthalene, phenanthrene, and pyrene 1 other SVOC: bis (2-ethylhexyl)phthalate (DEHP)
VOCs – Groundwater will be analyzed for a standard list of VOCs. Approximately 7 years have elapsed since the most recent sampling and it is important to view current conditions for VOCs, which are likely to be transported in groundwater, if present
VOCs – a standard U.S. Environmental Protection Agency (USEPA) Method 8260B analyte list
PCBs – Groundwater will be analyzed for PCBs by Aroclor. Although only one Aroclor was detected in one previous sample, PCBs are present in overlying soils and are a contaminant of concern in the Anacostia River.
PCBs – Aroclor analysis
Dioxins and furans – Groundwater will be analyzed for dioxins and furans. Historical burning of landfill materials at KPN presents a concern that dioxins may be present. A subset of monitoring wells, including two wells screened in waste and the deep/shallow couplets downgradient, will be sampled.
Dioxins and furans
4.2.2 Piezometers and Staff Gauges
Piezometers and staff gauges will be used to monitor groundwater levels to determine
groundwater gradient directions and groundwater/surface water interaction areas. Groundwater
samples from piezometers will not be collected because it is not yet understood where the
streams are gaining or losing and where groundwater discharge occurs. However, piezometers
will be constructed such that groundwater samples can be collected, if necessary.
A total of five pairs of piezometers will be installed in two general areas around the Site:
1) along the Watts Branch at KPN; and 2) along the unnamed southern tributary to Watts Branch
at KPS. A shallow (“A”; screened approximately 3 feet bgs) and deep (“B”; screened

Title: Supplemental Groundwater Study SAP Site Name: OU2 Kenilworth Park Landfill Revision Date: 12/6/2013 Site Location: Northeast Washington, D.C. Page: 22
approximately 7 feet bgs) pair of piezometers will be installed at each location to evaluate
vertical groundwater gradients and contaminant migration.
A summary of piezometer locations and rationale for the locations is provided in Text
Table 4.2.2.
Text Table 4.2.2 Proposed Piezometer Locations
Count (Sets)
Name Depth Location/Rationale
1 PZ-W-01A and PZ-W-01B
Shallow and deep
Located south of all known landfill waste at KPN. This location will provide information regarding groundwater flow direction apparently upgradient of the landfill.
2 PZ-W-02A and PZ-W-02B
Shallow and deep
Located at the northernmost reach of Watts Branch. This location will provide information regarding Watts Branch groundwater discharge or recharge.
3 PZ-W-03A and PZ-W-03B
Shallow and deep
Located west of Deane Road along the east-west reach of Watts Branch at KPN. This location will provide additional information regarding Watts Branch groundwater discharge or recharge below the unnamed southern tributary to Watts Branch.
4 PZ-U-01A and PZ-U-01B
Shallow and deep
Located near existing monitoring well MW10. This location will provide information regarding discharge or recharge conditions at the unnamed stream.
5 PZ-U-02A and PZ-U-02B
Shallow and deep
Located at the southernmost end of the unnamed southern tributary to Watts Branch. This location will provide information regarding groundwater flow direction possibly upgradient or downgradient of the Site.
Staff gauges are vertical rods marked with a measuring tape; they are installed in the
stream bed and used to read the water level with respect to a surveyed elevation. Staff gauges
will be used to monitor the surface water levels contemporaneously with piezometer water levels
to determine the vertical direction of the groundwater gradient relative to surface water at the
time of the measurement. One staff gauge will be co-located with each of the three pairs of
shallow and deep piezometers located along Watts Branch and two pairs of piezometers on the
unnamed southern tributary to Watts Branch. In addition, one staff gauge will be located with
each of the three pairs of monitoring wells along the border of KPN and the Kenilworth Marsh.
Therefore, eight staff gauges will be installed adjacent to piezometer locations

Title: Supplemental Groundwater Study SAP Site Name: OU2 Kenilworth Park Landfill Revision Date: 12/6/2013 Site Location: Northeast Washington, D.C. Page: 23
A minimum of two rounds of water levels will be collected from all new and existing
monitoring wells, piezometers, and staff gauges during low and high tides. Data loggers will be
used to record water levels in newly-installed shallow monitoring wells for approximately 24
hours during two high and low tide events. No samples will be collected from piezometers
during the supplemental groundwater study, but they will be constructed in a manner that is
likely to provide clear samples following development; thus, samples can be collected in future
stages, if necessary. Unless the results from this supplemental investigation show that
groundwater discharges to the Watts Branch and/or monitoring well data show that contaminated
groundwater is migrating from the Site to the Anacostia River or Kenilworth Marsh, sampling
the piezometers is unnecessary.
4.2.3 Groundwater Monitoring Wells
Groundwater is not in use at the Site and does not discharge into any aquifers or water
bodies that are drinking water sources. Groundwater under KPN and KPS has been measured to
flow radially away from the highest topographic areas of fill on the ground surface, resulting in
apparent flow to Kenilworth Marsh, Watts Branch, the Anacostia River, and the unnamed
stream. Transects of groundwater monitoring wells along the Site boundaries adjacent to surface
waters are proposed to characterize groundwater contaminant migration at downgradient edges
of the Site that may potentially impact the Anacostia River.
All existing wells at the Site are screened across the water table, which will be considered
shallow for the purposes of this investigation. The four existing monitoring wells along the
Anacostia River at KPS, MW-1 through MW4, produce turbid groundwater samples and will be
replaced. Additional monitoring wells will be installed along the Anacostia River at KPN to
increase the density of wells along this discharge zone. Wells will be located as close as possible
to surface water to avoid encountering waste at the water table; if waste is present in the boring,
the well will be installed beneath the waste.

Title: Supplemental Groundwater Study SAP Site Name: OU2 Kenilworth Park Landfill Revision Date: 12/6/2013 Site Location: Northeast Washington, D.C. Page: 24
At some locations, deep (“B”) monitoring wells will be coupled with new (“A”) or
existing shallow wells to assess the existence of vertical contaminant migration and contaminant
variability along a vertical discharge transport path. The deep groundwater monitoring wells are
expected to be installed in the same aquifer as the shallow wells, although the well screens and
their sand packs at adjacent deeper locations will be separated by a minimum of 10 feet from the
upper water table well or a significant confining layer. All monitoring wells will be installed
along the Anacostia River or Kenilworth Marsh at locations where the ground surface elevation
is not more than 15 feet amsl. All deep wells will be constructed with the bottom of the screen at
50 feet below ground surface (bgs) or closer to the ground surface.
A total of 20 new wells are proposed, including 11 shallow and 9 deep wells. This
number is based on the previous survey, but if MW-15N can be located, MW-N-05A will not be
installed unless MW-15N is damaged or cannot be sampled. The proposed groundwater
monitoring well locations are detailed in Text Table 4.2.3 and shown on Figure 6.
Text Table 4.2.3 Proposed Monitoring Well Locations
Count Name Depth Location/Rationale Shallow Monitoring Wells
KPS
1 MW-S-01A Shallow Replacement of MW1 at KPS. This shallow well will provide information regarding groundwater conditions at the southernmost end of the Site.
2 MW-S-02A Shallow Replacement of MW2 at KPS.
3 MW-S-03A Shallow Replacement of MW3 at KPS.
4 MW-S-04A Shallow Replacement of MW4 at KPS.
KPN
5 MW-N-05A Shallow Replacement of MW-15N at KPN if this well cannot be found. If MW-15N can be located, it will not be replaced unless damaged.
6 MW-N-06A Shallow Located between existing wells MW-7N and MW-6N at KPN. This well reduces the spacing between wells from 750 feet to approximately 375 feet.
7 MW-N-07A Shallow Located between existing wells MW-6N and MW-5N at KPN. This well reduces the spacing between wells from 700 feet to approximately 350 feet and is located outside the delineated landfill along the riverbank.

Title: Supplemental Groundwater Study SAP Site Name: OU2 Kenilworth Park Landfill Revision Date: 12/6/2013 Site Location: Northeast Washington, D.C. Page: 25
Text Table 4.2.3 Proposed Monitoring Well Locations
Count Name Depth Location/Rationale 8 MW-N-08A Shallow Located between existing wells MW-5N and MW-4N at KPN. This well
reduces the spacing between wells from 630 feet to approximately 320 feet and is located outside the delineated landfill along the riverbank.
9 MW-N-09A Shallow Located east and potentially downgradient of existing well MW-4N near the northern border of KPN with Kenilworth Marsh. This well will provide data regarding groundwater conditions at the potential groundwater discharge zone at Kenilworth Marsh.
10 MW-N-10A Shallow Located north and downgradient of existing wells MW-8NR and MW-3NR at the edge of Kenilworth Marsh. This well will provide data regarding contaminant migration from two existing wells in which concentrations of some contaminants were above PSLs to the groundwater discharge zone at Kenilworth Marsh.
11 MW-N-11A Shallow Located north of existing monitoring well MW-2N. This well will provide data regarding contaminant migration in groundwater between the eastern portion of KPN and the Kenilworth Marsh.
Deep Monitoring Wells Rationale: All deep wells will provide information regarding vertical nature and extent of contamination, and be used to determine the vertical gradient.
KPS
1 MW-S-02B Deep Located beside MW-S-02A.
2 MW-S-04B Deep Located beside MW-S-04A.
KPN
3 MW-N-05B Deep Located beside new well MW-N-05A or existing well MW-15N, if found.
4 MW-N-06B Deep Located beside MW-N-06A.
5 MW-N-07B Deep Located beside MW-N-07A.
6 MW-N-08B Deep Located beside MW-N-08A.
7 MW-N-09B Deep Located beside MW-N-09A.
8 MW-N-10B Deep Located beside MW-N-10A.
9 MW-N-11B Deep Located beside MW-N-11A.
All existing monitoring wells that can be located will be used for measuring water levels;
monitoring wells MW-10N, MW-14N, MW-15N, and MW-16N could not be found during the
December 2012 visit but additional attempts will be made to locate these wells. Pressure
transducers and data loggers will be installed in the 11 newly installed shallow wells to record
water levels over at least one day, encompassing two high tides and two low tides.
Title: Supplemental Groundwater Study SAP Site Name: OU2 Kenilworth Park Landfill Revision Date: 12/6/2013 Site Location: Northeast Washington, D.C. Page: 26
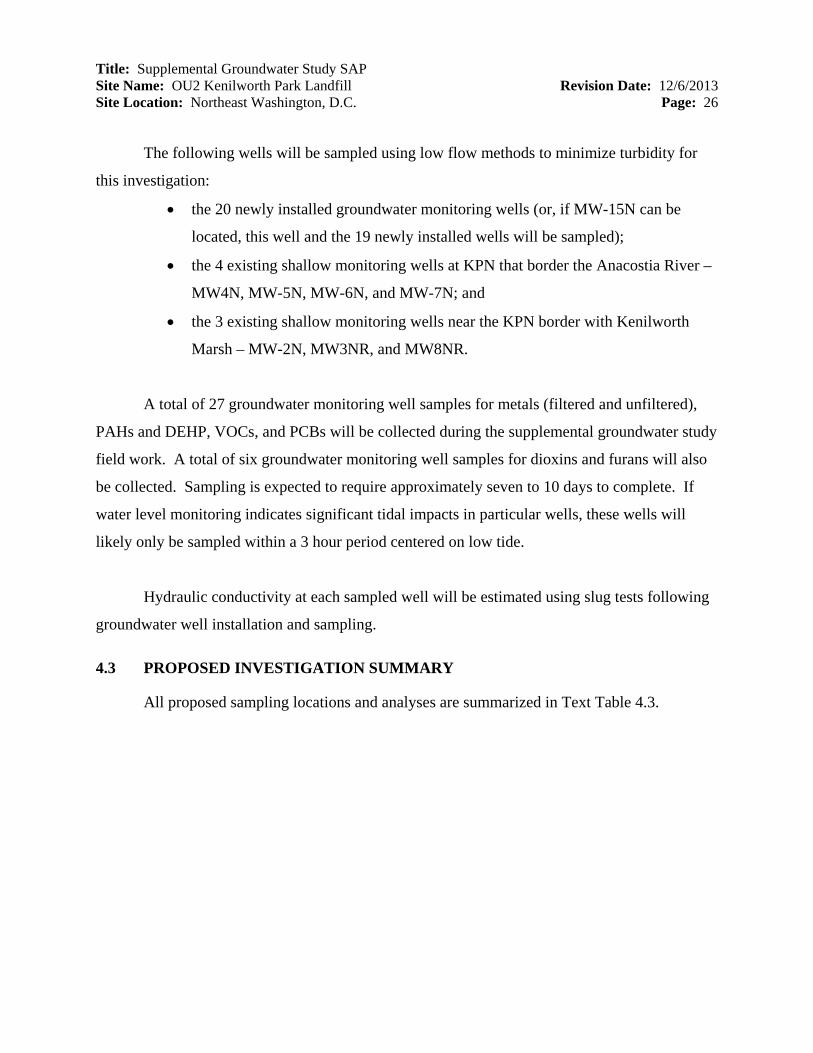
The following wells will be sampled using low flow methods to minimize turbidity for
this investigation:
• the 20 newly installed groundwater monitoring wells (or, if MW-15N can be
located, this well and the 19 newly installed wells will be sampled);
• the 4 existing shallow monitoring wells at KPN that border the Anacostia River –
MW4N, MW-5N, MW-6N, and MW-7N; and
• the 3 existing shallow monitoring wells near the KPN border with Kenilworth
Marsh – MW-2N, MW3NR, and MW8NR.
A total of 27 groundwater monitoring well samples for metals (filtered and unfiltered),
PAHs and DEHP, VOCs, and PCBs will be collected during the supplemental groundwater study
field work. A total of six groundwater monitoring well samples for dioxins and furans will also
be collected. Sampling is expected to require approximately seven to 10 days to complete. If
water level monitoring indicates significant tidal impacts in particular wells, these wells will
likely only be sampled within a 3 hour period centered on low tide.
Hydraulic conductivity at each sampled well will be estimated using slug tests following
groundwater well installation and sampling.
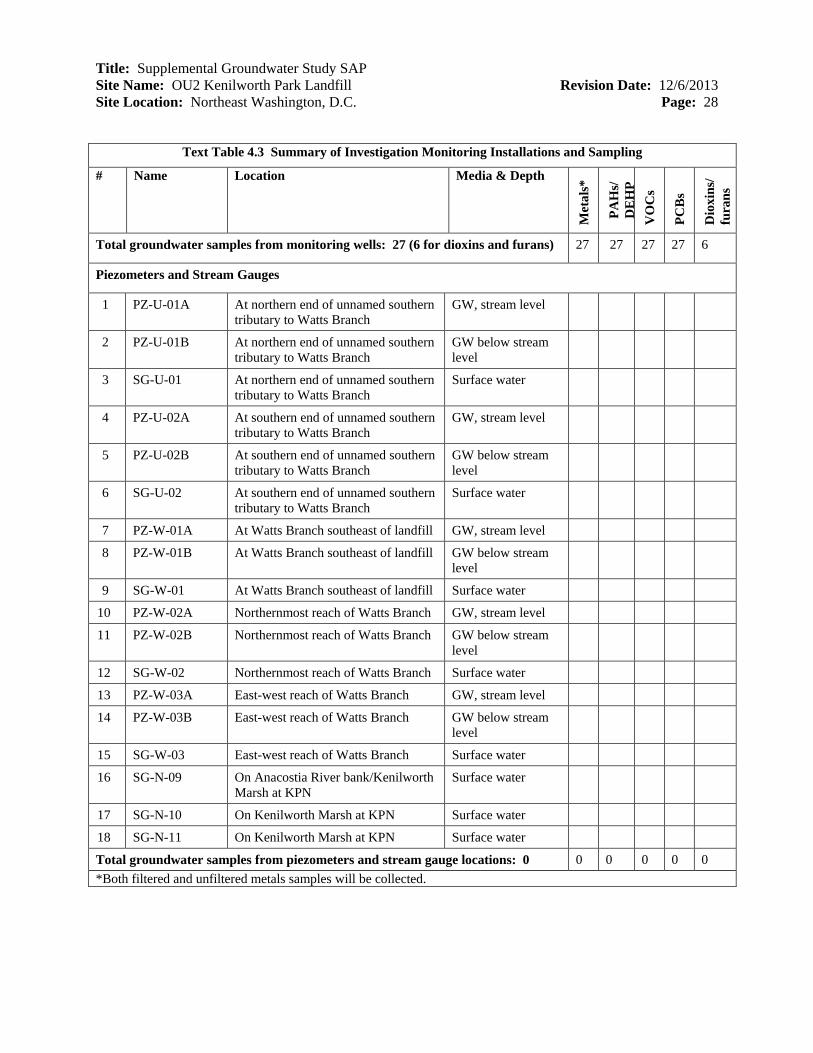
4.3 PROPOSED INVESTIGATION SUMMARY
All proposed sampling locations and analyses are summarized in Text Table 4.3.

Title: Supplemental Groundwater Study SAP Site Name: OU2 Kenilworth Park Landfill Revision Date: 12/6/2013 Site Location: Northeast Washington, D.C. Page: 27
Text Table 4.3 Summary of Investigation Monitoring Installations and Sampling
# Name Location Media & Depth
Met
als*
PAH
s/
DE
HP
VO
Cs
PCB
s
Dio
xins
/fu
rans
Monitoring Wells
1 MW-S-01A On Anacostia River bank at KPS Groundwater (GW), shallow
x x x x
2 MW-S-02A On Anacostia River bank at KPS GW, shallow x x x x
3 MW-S-02B On Anacostia River bank at KPS GW, deep x x x x
4 MW-S-03A On Anacostia River bank at KPS GW, shallow x x x x
5 MW-S-04A On Anacostia River bank at KPS GW, shallow x x x x
6 MW-S-04B On Anacostia River bank at KPS GW, deep x x x x
7 MW-N-05A On Anacostia River bank at KPN GW, shallow x x x x
8 MW-N-05B On Anacostia River Bank at KPN GW, deep x x x x
9 MW-7N On Anacostia River bank at KPN GW, shallow x x x x
10 MW-N-06A On Anacostia River bank at KPN GW, shallow x x x x
11 MW-N-06B On Anacostia River bank at KPN GW, deep x x x x
12 MW-6N On Anacostia River bank at KPN GW, shallow x x x x
13 MW-N-07A On Anacostia River bank at KPN GW, shallow x x x x
14 MW-N-07B On Anacostia River bank at KPN GW, deep x x x x
15 MW-5N On Anacostia River bank at KPN GW, shallow x x x x
16 MW-N-08A On Anacostia River bank at KPN GW, shallow x x x x
17 MW-N-08B On Anacostia River bank at KPN GW, deep x x x x
18 MW-4N On Anacostia River bank at KPN GW, shallow x x x x
19 MW-N-09A On Anacostia River bank/Kenilworth Marsh at KPN
GW, shallow x x x x
20 MW-N-09B On Anacostia River bank/Kenilworth Marsh at KPN
GW, deep x x x x
21 MW-N-10A At edge of Kenilworth Marsh at KPN GW, shallow x x x x x
22 MW-N-10B At edge of Kenilworth Marsh at KPN GW, deep x x x x x
23 MW-3NR Upgradient of MW-N-10B, screened outside landfill waste
GW, shallow x x x x
24 MW-8NR Upgradient of MW-3NR and MW-N-10B
GW, shallow x x x x x
25 MW-N-11A At edge of Kenilworth Marsh at KPN GW, shallow x x x x x
26 MW-N-11B At edge of Kenilworth Marsh at KPN GW, deep x x x x x
27 MW-2N Upgradient of MW-N-11A and B, screened in landfill waste
GW, shallow x x x x x
Title: Supplemental Groundwater Study SAP Site Name: OU2 Kenilworth Park Landfill Revision Date: 12/6/2013 Site Location: Northeast Washington, D.C. Page: 28
Text Table 4.3 Summary of Investigation Monitoring Installations and Sampling
# Name Location Media & Depth
Met
als*
PAH
s/
DE
HP
VO
Cs
PCB
s
Dio
xins
/fu
rans
Total groundwater samples from monitoring wells: 27 (6 for dioxins and furans) 27 27 27 27 6
Piezometers and Stream Gauges
1 PZ-U-01A At northern end of unnamed southern tributary to Watts Branch
GW, stream level
2 PZ-U-01B At northern end of unnamed southern tributary to Watts Branch
GW below stream level
3 SG-U-01 At northern end of unnamed southern tributary to Watts Branch
Surface water
4 PZ-U-02A At southern end of unnamed southern tributary to Watts Branch
GW, stream level
5 PZ-U-02B At southern end of unnamed southern tributary to Watts Branch
GW below stream level
6 SG-U-02 At southern end of unnamed southern tributary to Watts Branch
Surface water
7 PZ-W-01A At Watts Branch southeast of landfill GW, stream level
8 PZ-W-01B At Watts Branch southeast of landfill GW below stream level
9 SG-W-01 At Watts Branch southeast of landfill Surface water
10 PZ-W-02A Northernmost reach of Watts Branch GW, stream level
11 PZ-W-02B Northernmost reach of Watts Branch GW below stream level
12 SG-W-02 Northernmost reach of Watts Branch Surface water
13 PZ-W-03A East-west reach of Watts Branch GW, stream level
14 PZ-W-03B East-west reach of Watts Branch GW below stream level
15 SG-W-03 East-west reach of Watts Branch Surface water
16 SG-N-09 On Anacostia River bank/Kenilworth Marsh at KPN
Surface water
17 SG-N-10 On Kenilworth Marsh at KPN Surface water
18 SG-N-11 On Kenilworth Marsh at KPN Surface water
Total groundwater samples from piezometers and stream gauge locations: 0 0 0 0 0 0 *Both filtered and unfiltered metals samples will be collected.

Title: Supplemental Groundwater Study SAP Site Name: OU2 Kenilworth Park Landfill Revision Date: 12/6/2013 Site Location: Northeast Washington, D.C. Page: 29
5.0 REFERENCES
DC Water (District of Columbia Water and Sewer Authority). 2012. “Water Supply and Treatment”, accessed at http://www.dcwater.com/about/facilities.cfm, December 18, 2012.
DDOE (District of Columbia Department of the Environment). 2008. Anacostia 2032: Plan for
a Fishable and Swimmable Anacostia River, May 2008, accessed at http://ddoe.dc.gov/sites/default/files/dc/sites/ddoe/publication/attachments/Anacostia2032.pdf.
DDOE. 2012. “Fishing in the District: Public Health Advisory”, accessed at
http://ddoe.dc.gov/service/fishing-district, November 13, 2012. DDOH (District of Columbia Department of Health). 2001. Known Wetlands within the District
of Columbia Identified by Number, January, 2001, accessed at http://ddoe.dc.gov/sites/default/files/dc/sites/ddoe/publication/attachments/wetland-map.pdf.
E & E (Ecology and Environment, Inc.). 1998. Report on Sampling the Kenilworth Park Site,
National Park Service, N.E. Washington, D.C., December 1998. E & E. 2000a. Preliminary Assessment/Site Investigation of Kenilworth Park Landfill, N.E.
Washington, D.C., June 2000. E & E. 2000b. Kenilworth Park Landfill North Geoprobe Sampling, Washington, DC, October
2000. E & E. 2002. Preliminary Assessment/Site Investigation of Kenilworth Park Landfill North, N.E.
Washington, D.C., February 2002. E & E. 2007. Final Remedial Investigation at the Kenilworth Park North Landfill, N.E.
Washington, DC, November 2007. E & E. 2008. Final Remedial Investigation at the Kenilworth Park South Landfill, N.E.
Washington, DC, June 2008. ISU (Iowa State University). 2012. “Wind Roses, Ronald Reagan Washington Natl AP,” Iowa
Environmental Mesonet, Iowa State University Department of Agronomy, November 21, 2012.
JCO (The Johnson Company, Inc.). 2012. Feasibility Study Report: Kenilworth Park Landfill,
Northeast, Washington, D.C., April 2012.

Title: Supplemental Groundwater Study SAP Site Name: OU2 Kenilworth Park Landfill Revision Date: 12/6/2013 Site Location: Northeast Washington, D.C. Page: 30
Lapp, Joe. 2006. Kenilworth: A DC Neighborhood by the Anacostia River, Humanities Council
of Washington, D.C., February, 2006, accessed at http://planning.dc.gov/OP/HP/Community%20Heritage%20pdf%204.2.2/Kenilworth_Brochure.pdf.
MGS (Maryland Geological Survey). 1968. “Geologic Cross Sections of Maryland: Coastal
Plain (1968)”, accessed at http://www.mgs.md.gov/esic/geo/xsec2.html. NPS (United States Department of the Interior, National Park Service). 2008. National Capital
Parks-East Geologic Resource Evaluation Report, Natural Resource Report NPS/NRPC/GRD/NRR-2008/039, Geologic Resources Division, Natural Resource Program Center, June 2008.
NPS. 2011. Draft Anacostia Park Wetland and Resident Goose Management
Plan/Environmental Impact Statement, June 2011. NPS. 2012. “Kenilworth Park Landfill Site”, Website, accessed at
http://www.nps.gov/nace/parkmgmt/kpls.htm. NPS. 2013. “NPS Ecological Risk Assessors Protocol for the Selection and Use of Ecological
Screening Values.” July 23, 2013. Syphax, Stephen W., and Richard S. Hammerschlag. 1995. "The reconstruction of Kenilworth
Marsh, The Last Tidal Marsh in Washington, D.C." Park Science Volume 15- Number 1: 1+16-19, accessed at http://www.nature.nps.gov/parkscience/archive/PDF/ParkScience15(1)Winter1995.
NRCS (U.S. Department of Agriculture, Natural Resources Conservation Service). 2007.
“Scrub-shrub Birds”, Fish and Wildlife Habitat Management Leaflet Number 42, January 2007, accessed at http://www.nrcs.usda.gov/Internet/FSE_DOCUMENTS/nrcs143_010138.pdf.
USEPA (U.S. Environmental Protection Agency). 2011. “Groundwater Sampling”, Operating
Procedure SESDPROC-301-R2, Science and Ecosystem Support Division, Region 4, October 28, 2011.
USEPA. 2013. National Primary Drinking Water Regulations, accessed at
http://water.epa.gov/drink/contaminants/index.cfm, September 4, 2013. USFWS (U.S. Fish & Wildlife Service). 2002. Watts Branch, Washington, D.C.: Watershed
and Stream Assessment, CBFO-S02-03.

Title: Supplemental Groundwater Study SAP Site Name: OU2 Kenilworth Park Landfill Revision Date: 12/6/2013 Site Location: Northeast Washington, D.C. Page: 31
USFWS. 2012. “Wetlands Mapper”, National Wetlands Inventory, accessed at http://www.fws.gov/wetlands/Wetlands-Mapper.html, January 3, 2013.
USGS (U. S. Geological Survey). 1958. Geologic Map of Washington, D.C., and Vicinity,
1:62,000. In USGS, Geology and Ground-Water Resources of Washington, D.C., and Vicinity, Geological Survey Water-Supply Paper 1776, 1964, Plate 1, accessed at http://pubs.usgs.gov/wsp/1776/report.pdf.
USGS. 2008. “Anacostia Freshwater Tidal Reconstructed Wetlands”, January 3, 2008, accessed
at http://www.pwrc.usgs.gov/resshow/hammerschlag/anacostia.cfm. USGS. 2012. “National Water Information System: Web Interface, USGS 01651750 Anacostia
River Aquatic Gardens at Washington, DC”, November 16, 2012, accessed at http://nwis.waterdata.usgs.gov/nwis/uv?01651750.
USGS. 2013. “National Water Information System: Web Interface, USGS 01651800 Watts
Branch at Washington, DC”, January 3, 2013, accessed at http://waterdata.usgs.gov/dc/nwis/dv/?site_no=01651800&agency_cd=USGS&referred_module=sw.

FIGURES

Drawn by: RTKChk'd by: MBMApp'd by:
Date: 11/13/12Date: 01/16/13Date:
Figure 1: Site Location MapKenilworth Park Landfill OU2
Washington, D.C.
K:\3-0700-11\GIS\OU2 Groundwater Investigation\Figure 1 Kenilworth Site Location Map 111312.mxd
¥100 State Street, Suite 600
Montpelier, VT 05602
Scale: 1:24,000 Project: 3-0700-11
MAPLOCATION
VA
1 0 10.5
MILES1,000 0 1,000 2,000 3,000 4,000 5,000 6,000 7,000
FEET
BASE MAP: USGS 7.5 Minute Topographic Quadrangle Washington East D.C.-MD, 1965 (Updated 1979 and 1982)
SITE(KPN)
CONTOUR INTERVAL: 10 FEET
MD
VA
SITE(KPS)
LegendSite Boundary
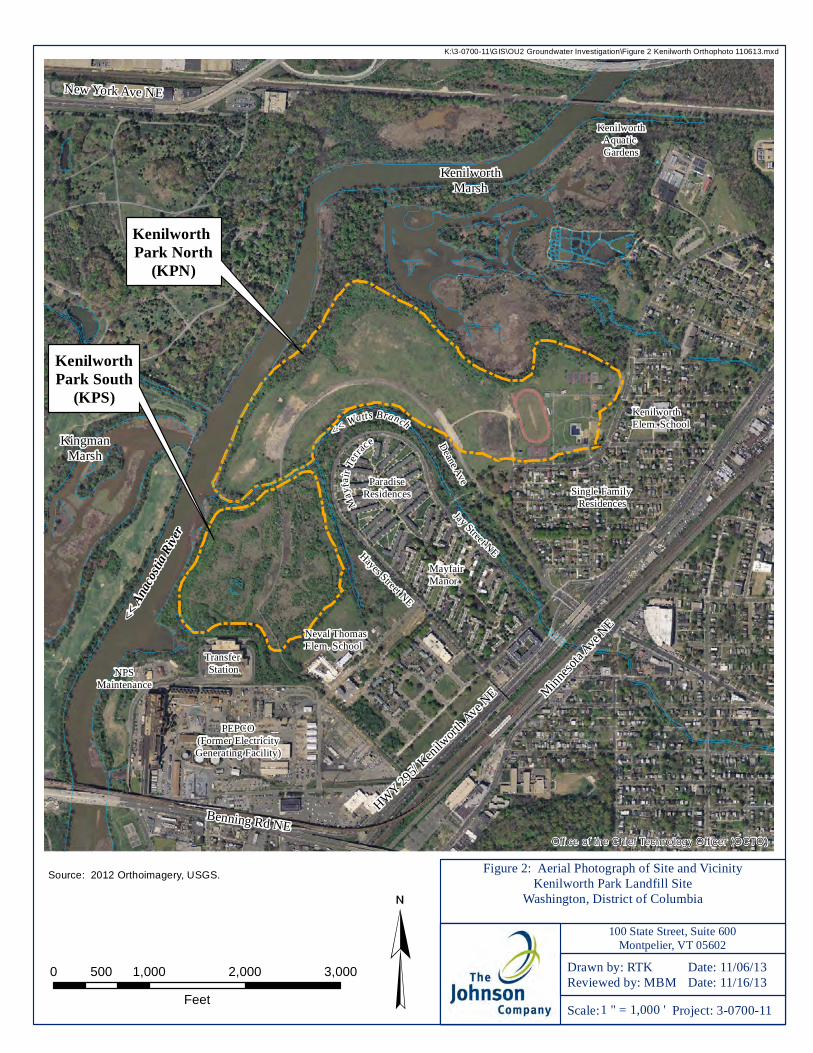
KenilworthPark South
(KPS)
Kenilworth Park North
(KPN)
Jay Street NEHayes Street NE
Mayfai
r Terr
ace Deane Ave
<< An
acostia
River
<< Watts Branch
Neval ThomasElem. School
KenilworthElem. School
Transfer StationNPS
Maintenance
PEPCO(Former ElectricityGenerating Facility)
MayfairManor
ParadiseResidences Single Family
Residences
HWY 295/ Kenilworth
Ave NE Minn
esota A
ve NE
Benning Rd NE
New York Ave NE
Office of the Chief Technology Officer (OCTO)
Figure 2: Aerial Photograph of Site and VicinityKenilworth Park Landfill Site
Washington, District of Columbia
100 State Street, Suite 600Montpelier, VT 05602
Scale: Project: 3-0700-11
Drawn by: RTKReviewed by: MBM
Date: 11/06/13Date: 11/16/13¥0 1,000 2,000 3,000500
Feet
K:\3-0700-11\GIS\OU2 Groundwater Investigation\Figure 2 Kenilworth Orthophoto 110613.mxd
1 " = 1,000 '
KenilworthMarsh
KenilworthAquatic Gardens
KingmanMarsh
Source: 2012 Orthoimagery, USGS.
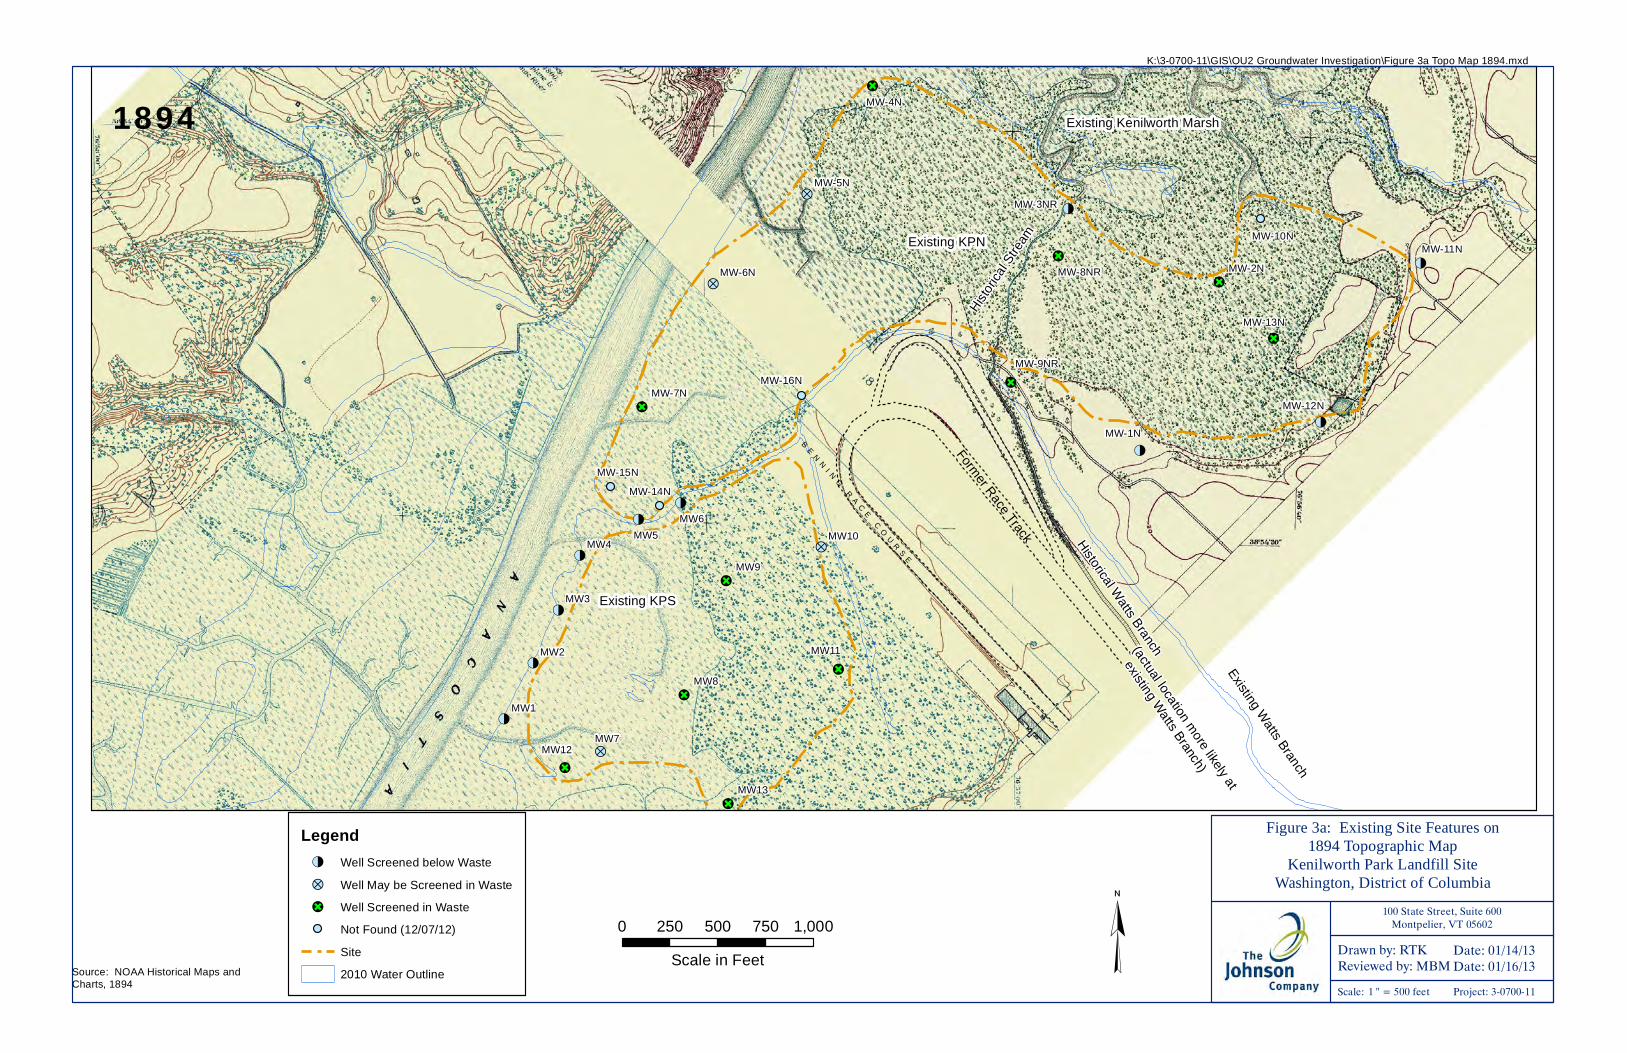
(
(
(
(
(
(
(
(
(
(
(
(
(
(
(
(
(
(
(
\\\\\\\\\\\\\\\\\\\\\\\\\\\\\\\\
(
(
(
(
(
(
(
(
(
(
(
(
(
(
(
(
(
(
(
(
(
(
(
!<
!C
!<
!C
!?
!?
!C
!C
!C !<
!<
!C
!<
!<
!<
!<
!<
!<
!C
!C
!C
!?
!C
!?
!C
MW12MW7
MW8
MW13
MW10
MW11
MW9
MW6MW5
MW4
MW3
MW2
MW1
MW-4N
MW-3NR
MW-8NR MW-2N
MW-13N
MW-12N
MW-11N
MW-1N
MW-9NR
MW-6N
MW-5N
MW-7N
MW-14N
MW-15N
MW-16N
MW-10N
Existing Watts Branch
Former Race Track
Existing Kenilworth Marsh
Historical Watts Branch
(actual location more likely at
existing Watts Branch)
Histor
ical S
tream
K:\3-0700-11\GIS\OU2 Groundwater Investigation\Figure 3a Topo Map 1894.mxd
¥0 250 500 750 1,000
Scale in Feet
100 State Street, Suite 600Montpelier, VT 05602
Scale: 1 " = 500 feet Project: 3-0700-11
Drawn by: RTKReviewed by: MBM Date: 01/14/13Date: 01/16/13
Figure 3a: Existing Site Features on1894 Topographic Map
Kenilworth Park Landfill SiteWashington, District of Columbia
Legend!< Well Screened below Waste
!? Well May be Screened in Waste
!C Well Screened in Waste
Not Found (12/07/12)
Site
2010 Water OutlineSource: NOAA Historical Maps andCharts, 1894
1894
BE
NN
I NG
RA
CE
CO
UR
SE
Existing KPS
Existing KPN

!<
!C
!<
!C
!?
!?
!C
!C
!C
!<
!<
!<
!<
!<
!<
!C
!C
!C
!?
!C
!?
!C
MW10
MW11
MW13
MW8
MW9
MW6
MW5MW4
MW3
MW2
MW1
MW12MW7
MW-1N
MW-2N
MW-8NR
MW-3NRMW-5N
MW-6N
MW-7N
MW-15N
MW-14N
MW-16N
K:\3-0700-11\GIS\OU2 Groundwater Investigation\Figure 3b Historical Photos 1949-1963.mxd
¥0 250 500 750 1,000
Scale in Feet
100 State Street, Suite 600Montpelier, VT 05602
Scale: 1 " = 500 feet Project: 3-0700-11
Drawn by: RTKReviewed by: MBM Date: 01/14/13Date: 01/16/13
Figure 3b: Existing Site Features on1949 and 1963 Aerial Photopgraphs
Kenilworth Park Landfill SiteWashington, District of Columbia
!<
!<
!<
!<
!<
!<
!C
!C
!C
!?
!C
!?
!C
!<
!C
!<
!C
!?
!?
!C
!C
!CMW-2N
MW-1N
MW-9NR
MW-8NR
MW-3NRMW-5N
MW-6N
MW-7N
MW-15N
MW-14N
MW10
MW11
MW9
MW8
MW13
MW7MW12
MW1
MW2
MW3
MW4
MW5
MW6
Legend!< Well Not Screened in Waste
!? Well May be Screened in Waste
!C Well Screened in Waste
Well Not Found (12/07/12)
Site
Existing Road
2010 Water Outline
Source: USGS EarthExplorer Aerial Photographs from 03/04/1949 and 03/15/1963.
1949 1963

!<
!C
!<
!C
!?
!?
!C
!C
!C
!<
!<
!<
!<
!<
!<
!C
!C
!C
!?
!C
!?
!C
MW11
MW5
MW6
MW-15N
MW-7N
MW-6N
MW-5N
MW-4N
MW-8NR
MW-3NR
MW-9NR
MW-16N
MW10MW4
MW2
MW12
MW13
MW8
MW9
MW-14N
MW1
MW3
MW-1N
MW7
K:\3-0700-11\GIS\OU2 Groundwater Investigation\Figure 3c Historical Photos 1968-1984.mxd
¥0 250 500 750 1,000
Scale in Feet
100 State Street, Suite 600Montpelier, VT 05602
Scale: 1 " = 500 feet Project: 3-0700-11
Drawn by: RTKReviewed by: MBM Date: 01/14/13Date: 11/05/13
Figure 3c: Existing Site Features on1968 and 1984 Aerial Photopgraphs
Kenilworth Park Landfill SiteWashington, District of Columbia
!<
!<
!<
!<
!<
!<
!C
!C
!C
!?
!C
!?
!C
!<
!C
!<
!C
!?
!?
!C
!C
!C
MW10
MW11
MW13
MW8
MW7MW12
MW1
MW2
MW3
MW4MW5
MW6
MW-14N
MW-15N
MW-7N
MW-6N
MW-5N
MW-4N
MW-3NR
MW-8NR
MW-9NR
MW-1N
MW-2N
MW9
Legend!< Well Not Screened in Waste
!? Well May be Screened in Waste
!C Well Screened in Waste
Well Not Found (12/07/12)
Site
Existing Road
2010 Water Outline
Source: USGS EarthExplorer Aerial Photographs from 10/31/1968 and 02/08/1984.
19841968
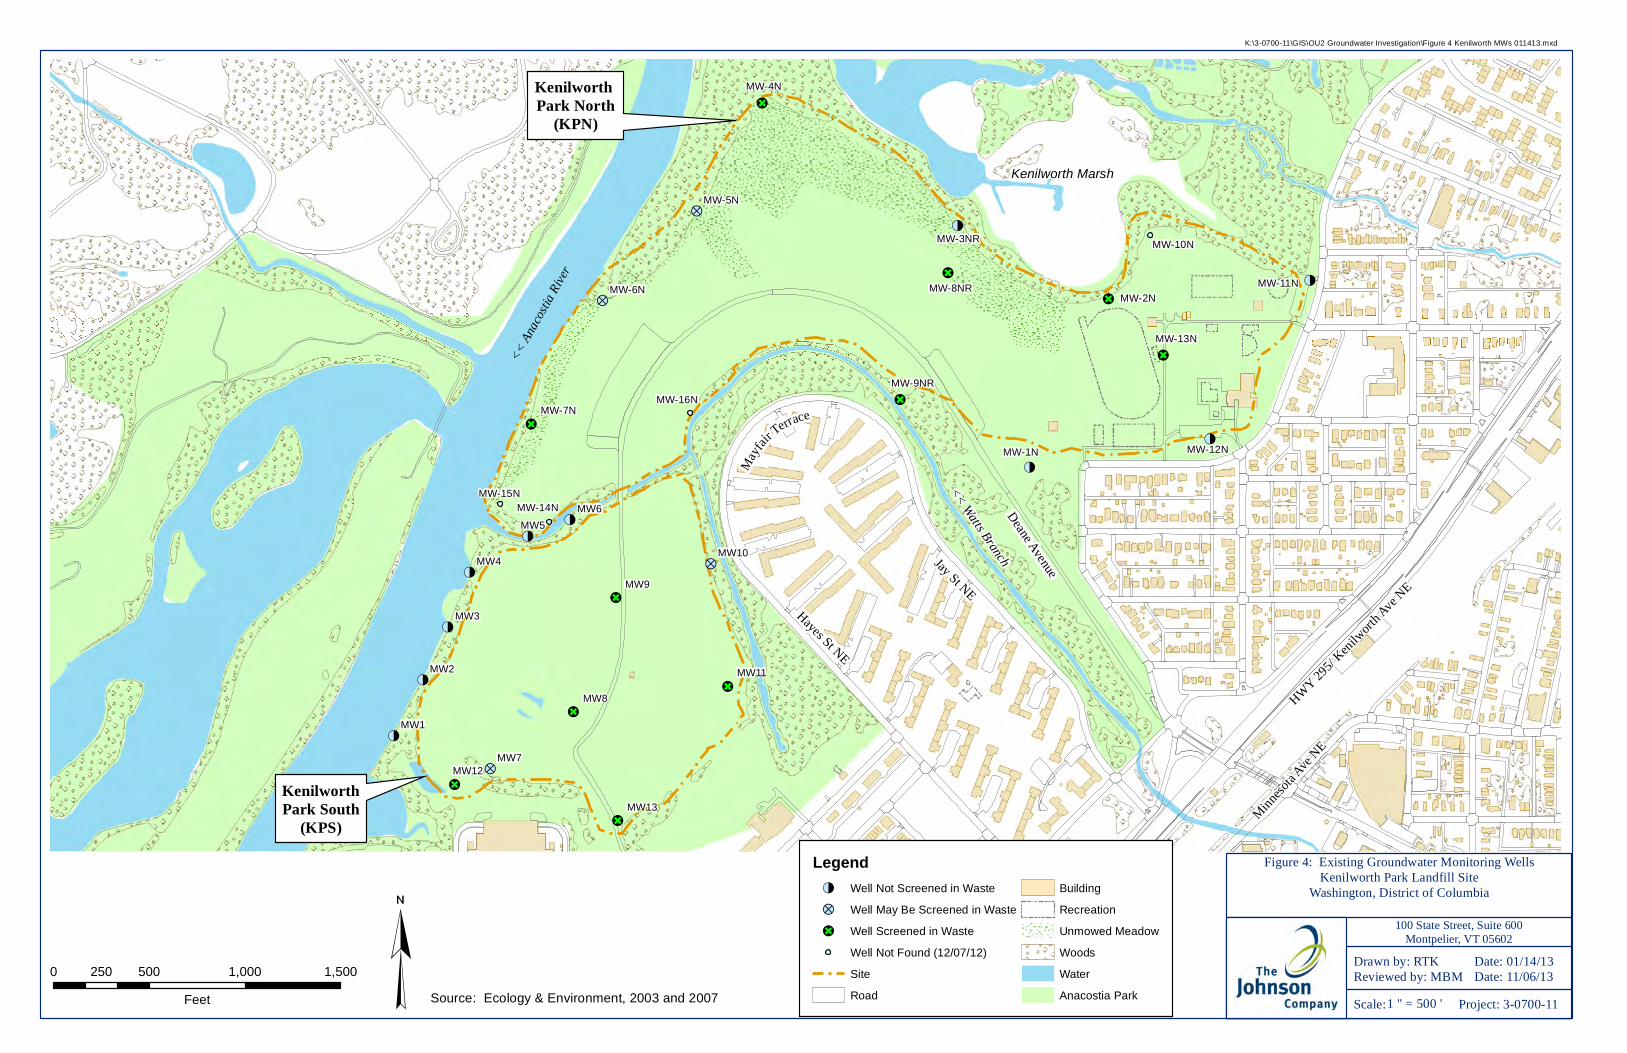
!<
!<
!<
!<
!<
!<
!C
!C
!C
!?
!C
!?
!C
!<
!C
!<
!C
!?
!?
!C
!C
!C !<
!<
!C
KenilworthPark South
(KPS)
Kenilworth Park North
(KPN)
Deane Avenue
<< Watts BranchJay St NEHayes St NE
Mayfair
Terrace
<< An
acostia
River
Kenilworth Marsh
MW-15N
MW-7N
MW-14N
MW-16NMW-9NR
MW-1N MW-12N
MW-13N
MW-2NMW-11N
MW-10NMW-3NR
MW-8NR
MW-4N
MW-5N
MW-6N
MW8
MW7
MW9
MW1
MW2
MW3
MW4
MW5MW6
MW10
MW11
MW13
MW12
HWY 295/ Kenil
worth Ave N
E
Minneso
ta Ave N
E
Figure 4: Existing Groundwater Monitoring WellsKenilworth Park Landfill Site
Washington, District of Columbia
100 State Street, Suite 600Montpelier, VT 05602
Scale: Project: 3-0700-11
Drawn by: RTKReviewed by: MBM
Date: 01/14/13Date: 11/06/13¥0 500 1,000 1,500250
Feet
K:\3-0700-11\GIS\OU2 Groundwater Investigation\Figure 4 Kenilworth MWs 011413.mxd
1 " = 500 'Source: Ecology & Environment, 2003 and 2007
Legend!< Well Not Screened in Waste
!? Well May Be Screened in Waste
!C Well Screened in Waste
Well Not Found (12/07/12)
Site
Road
Building
Recreation
Unmowed Meadow
Woods
Water
Anacostia Park

K:\3-0700-11\GIS\OU2 Groundwater Investigation\Figure 5 Kenilworth Prev WT maps.mxd
100 State Street, Suite 600Montpelier, VT 05602
Scale: As Shown Project: 3-0700-11
Drawn by: RTKReviewed by: MBM Date: 09/03/13Date: 09/25/13
Figure 5. Previous Water Table EquipotentialMapsKenilworth Park LandfillWashington, DC
KPS Water Table Equipotential Map (2001)(Source: E & E, 2008)
KPN Water Table Equipotential Map (2006)(Source: E & E, 2007)

!<
!<
!<
!<
!<
!<
!C
!C
!C
!?
!C
!?
!C
!<
!C
!<
!C
!?
!?
!C
!C
!C !<
!<
!C
!<A
!<B
!<A
!<A
!<A
!<B!<A
!<A
!<B
!<B
!<A
!<A!<B
!<B
!<A
!<A
D
D
D
D
D
!<A
!<B
!<B
!<B
D
D
D
PZ-W-03, SG-W-03
PZ-W-02, SG-W-02
PZ-W-01, SG-W-01
PZ-U-02, SG-U-02
PZ-U-01, SG-U-01
MW-N-07B
MW-N-06B
MW-S-04B
MW-S-02B
MW-N-08B
MW-N-06A
MW-N-05A or
MW-N-07A
MW-S-04A
MW-S-03A
MW-S-02A
MW-N-05B
MW-S-01A
MW-N-08A
MW-N-09B
MW-N-10B
MW-N-11BMW-N-11A
MW-N-09A
MW-N-10A
KenilworthPark South
(KPS)
Kenilworth Park North
(KPN)
Deane Avenue
<< Watts BranchJay St NEHayes St NE
Mayfair
Terrace
<< An
acostia
River
Kenilworth Marsh
MW-15N
MW-7N
MW-14N
MW-16N
MW-9NR
MW-1N MW-12N
MW-13N
MW-2NMW-11N
MW-10NMW-3NR
MW-8NR
MW-4N
MW-5N
MW-6N
MW1
MW5MW6
MW10
MW11
MW9
MW8
MW13
MW7
MW12
MW3
MW4
MW2
SG-N-11
SG-N-10
SG-N-09
HWY 295/ Kenil
worth Ave N
E
Minneso
ta Ave N
E
Figure 6: Proposed and Existing Groundwater Monitoring Wells and Piezometers
Kenilworth Park Landfill SiteWashington, District of Columbia
100 State Street, Suite 600Montpelier, VT 05602
Scale: Project: 3-0700-11
Drawn by: RTKReviewed by: MBM
Date: 12/04/13Date: 12/04/13¥
0 500 1,000 1,500250
Feet
K:\3-0700-11\GIS\OU2 Groundwater Investigation\Figure 6 Kenilworth Proposed MWs 120413.mxd
1 " = 500 'Source: Ecology & Environment, 2003 and 2007
LegendSite
D Proposed Shallow/Deep Piezometers, Staff Gauge
!<A Proposed Shallow (A) Well
!<B Proposed Deep (B) Well
D Staff Gauge
!< Existing Well Not Screened in Waste, To be Sampled
!?Existing Well May be Screened in Waste, To beSampled
!C Existing Well Screened in Waste, To be Sampled
!< Existing Well Not Screened in Waste, Not Sampled
Existing Well Not Found
!C Existing Well Screened in Waste, Not Sampled
Road
Building
Recreation
Unmowed Meadow
Woods
Water
Anacostia Park

TABLES

Table 1. Existing Monitoring Well DetailsKenilworth Park Site, Washington, DC
K:\3-0700-11\OU-2\Supplemental Groundwater Study\SAP\Supplemental GW Study SAP Body\Tables\013013 Table 1 Existing well installation data Table 1 Total depths 120612 Page 1
Well Name
Installed Depth (ft bgs)
Stick-up at Installation (ft)
Screen Interval- Top to Bottom (ft amsl)
December 6-7, 2012 Measured Total Depth (ft bgs)
Installation Method Finish Type
Top of Casing Elevation (ft amsl)
December 6-7, 2012 Groundwater Elevation (ft amsl)
MW-1 6 1 3.3 to -1.7 3.57 Hand augerStainless steel stickup 5.31 1.85
MW-2 5.75 1.25 3.9 to -1.1 5.2 Hand augerStainless steel stickup 5.86 2.8
MW-3 6 1 3.0 to -2.0 6.9 Hand augerStainless steel stickup 5.04 0.86
MW-4 6 1 3.5 to -1.5 3.22 Hand augerStainless steel stickup 5.48 3.33
MW-5 5.5 1.5 4.3 to -0.7 6.24 Hand augerStainless steel stickup 6.28 0.96
MW-6 5.6 1.4 3.4 to -1.7 5.9 Hand augerStainless steel stickup 5.35 0.05
MW-7 29 2.46 5.8 to -4.2 25.26 4.25" HSAProtective casing with 3 bollards 27.3 4.89
MW-8 25 2.45 13.1 to 3.1 24.55 4.25" HSA Protective casing 30.54 16.56MW-9 22 2.35 14.1 to 4.1 19.13 4.25" HSA Protective casing 28.48 12.79MW-10 15 2.56 6.8 to -3.2 15.02 4.25" HSA Protective casing 14.36 5.77MW-11 15 2.42 9.6 to -0.4 15.22 4.25" HSA Protective casing 17.04 7.98MW-12 20.2 3 8.8 to -1.3 20 6.25" HSA Protective casing 21.75 4.58
MW-13 20.2 0 9.8 to -0.2 20.25 6.25" HSAFlush mounted, road box 19.78 7.37
MW-1N 18 -0.2 6.3 to -3.7 17.88 7.5" HSAFlush mounted, road box 14.11 4.26
MW-2N 25 -0.2 0.5 to -9.5 25.5 7.5" HSAFlush mounted, road box, with 1 bollard 15.28 2.46
MW-3NR 29.4 1.75 1.9 to -8.1 29.19 7.5" HSA Protective casing 23.05 5.05
MW-4N 15 2.88 5.8 to -4.2 14.9 7.5" HSAProtective casing, in brambles 13.67 2.62
MW-5N 10 3.19 9.6 to 4.6 9.89 7.5" HSA Protective casing 17.81 7.67MW-6N 20 3.18 3.2 to -6.8 19.92 7.5" HSA Protective casing 16.35 3.27
KPS
KPN

Table 1. Existing Monitoring Well DetailsKenilworth Park Site, Washington, DC
K:\3-0700-11\OU-2\Supplemental Groundwater Study\SAP\Supplemental GW Study SAP Body\Tables\013013 Table 1 Existing well installation data Table 1 Total depths 120612 Page 2
Well Name
Installed Depth (ft bgs)
Stick-up at Installation (ft)
Screen Interval- Top to Bottom (ft amsl)
December 6-7, 2012 Measured Total Depth (ft bgs)
Installation Method Finish Type
Top of Casing Elevation (ft amsl)
December 6-7, 2012 Groundwater Elevation (ft amsl)
MW-7N 15 2.67 5.0 to -5 14.78 7.5" HSA Protective casing 12.69 1.72
MW-8NR 40 0 2.9 to -7.1 39.91 4.25" HSAFlush mounted, road box 32.91 4.56
MW-9NR 14 1 6.5 to -3.5 14.05 4.25" HSA Protective casing 11.53 4.31
MW-10N 25 0 -0.4 to -10.4 NM 4.25" HSAFlush mounted, could not find 14.58 NM
MW-11N 20 0 4.7 to -5.3 14.5 4.25" HSAFlush mounted, road box 14.72 3.17
MW-12N 20 0 7.7 to -2.3 20.02 4.25" HSAFlush mounted, road box 17.68 4.61
MW-13N 33 0 1.5 to -8.5 33.14 4.25" HSAFlush mounted, road box 24.48 4.46
MW-14N 10 0 3.5 to -6.5 NM 4.25" HSAFlush mounted, could not find 3.48 NM
MW-15N 10 0 4.6 to -5.4 NM 4.25" HSAFlush mounted, could not find 4.63 NM
MW-16N 15 0 2.7 to -7.3 NM 4.25" HSAFlush mounted, could not find 7.74 NM
Notes:Elevations of KPS wells provided in Table 3-6 of KPS RI Report, E & E, 2008Elevations of KPN wells provided in Table 3-7 of KPN RI Report, E & E, 2008ft bgs = Feet below ground surface ft amsl = Feet above mean sea levelNM = Not measured because well was not found

Table 2. Historical Groundwater Data - Metals (Micrograms per Liter, mg/L)Kenilworth Landfill Site, Washington, DC
K:\3-0700-11\OU-2\Supplemental Groundwater Study\SAP\Supplemental GW Study SAP Body\Tables\083013 Kenilworth Historical Data Tables-draft Metals Page 1
(μg/L)Aluminum 87 21,000 --- --- --- --- 969 1,200 --- --- --- --- 859 2,300 --- --- --- --- J 187Antimony 6 < 5 --- --- --- --- 13.1 < 5 --- --- --- --- 14 < 5 --- --- --- --- J 5.55Arsenic 10 11 < 10 < 10 J 9.63 < 5 < 10 < 10 < 25 15 < 10 < 10 25.8Barium 4 450 230 183 459 1,200 1,140 1,040 2,130 230 193 161 349Beryllium 0.66 --- --- --- --- --- --- < 5 --- --- --- --- --- --- < 5 --- --- --- --- --- --- < 5Cadmium 0.25 < 5 < 5 < 5 < 5 5.1 5.49 < 5 < 5 < 5 < 5 < 5 < 5Calcium None 100,000 --- --- --- --- 81,700 91,000 --- --- --- --- 68,300 61,000 --- --- --- --- 64,500Chromium (total) 11 59 28.5 < 10 11.9 < 5 < 10 < 10 J 4.28 15 < 10 < 10 < 10Cobalt 23 < 5 --- --- --- --- J 4.69 < 5 --- --- --- --- < 20 < 5 --- --- --- --- J 5.68Copper 1,000 34 --- --- --- --- J 10.4 < 5 --- --- --- --- J 14.5 < 5 --- --- --- --- J 5.36Iron 1,000 78,000 --- --- --- --- 45,900 39,000 --- --- --- --- 49,800 24,000 --- --- --- --- 16,400Lead 3 37 7.91 < 5 < 5 14 15.6 < 5 6.46 13 < 5 < 5 < 5Magnesium None 61,000 --- --- --- --- 56,300 89,000 --- --- --- --- 50,000 340,000 --- --- --- --- 41,400Manganese 120 4,500 --- --- --- --- 3,180 600 --- --- --- --- 258 1,600 --- --- --- --- 1,290Mercury 0.77 < 0.2 < 0.2 < 0.2 < 0.2 < 0.2 < 0.2 < 0.2 < 0.2 < 0.2 < 0.2 < 0.2 < 0.2Nickel 52 41 --- --- --- --- < 20 < 5 --- --- --- --- < 20 < 5 --- --- --- --- 57.5Potassium None < 500 --- --- --- --- 66,100 < 5 --- --- --- --- 64,900 95 --- --- --- --- 87,600Selenium 5 < 5 < 10 < 10 J 8.05 < 5 < 10 < 10 J 13.3 < 5 < 10 < 10 J 9.04Silver 2 < 5 < 10 < 10 < 10 < 5 < 10 < 10 < 10 < 5 < 10 < 10 < 10Sodium None < 1,500 --- --- --- --- 162,000 < 1,500 --- --- --- --- 140,000 260,000 --- --- --- --- 246,000Thallium 2 5.2 --- --- --- --- < 20 < 5 --- --- --- --- < 20 6.3 --- --- --- --- < 20Vanadium 20 56 --- --- --- --- J 3.05 < 5 --- --- --- --- J 3.07 < 5 --- --- --- --- < 20Zinc 120 160 --- --- --- --- 14.4 61 --- --- --- --- 45 42 --- --- --- --- J 9.29
Notes:
If parent and duplicate results were reported, the highest result is shown< = Not detected above laboratory reporting limit shown --- = Not sampled or not reported
Lowest Screening
Level1
May, 1999 3/14/003/14/00 6/18/016/18/01 6/18/01May, 1999 May, 1999 3/14/003/14/00 3/14/00 3/14/00
MW1 MW2TotalDissolvedTotalTotalTotalDissolvedTotalTotal DissolvedTotalTotal Total
Analyte (μg/L)
KPS
Concentration shown is the lowest of the EPA Maximum Contaminant Levels (MCLs), DDOE Class G1 Groundwater Standards, and Surface Water Ecological Screening Levels
MW3

Table 2. Historical Groundwater Data - Metals (Micrograms per Liter, mg/L)Kenilworth Landfill Site, Washington, DC
K:\3-0700-11\OU-2\Supplemental Groundwater Study\SAP\Supplemental GW Study SAP Body\Tables\083013 Kenilworth Historical Data Tables-draft Metals Page 2
(μg/L)Aluminum 87Antimony 6Arsenic 10Barium 4Beryllium 0.66Cadmium 0.25Calcium NoneChromium (total) 11Cobalt 23Copper 1,000Iron 1,000Lead 3Magnesium NoneManganese 120Mercury 0.77Nickel 52Potassium NoneSelenium 5Silver 2Sodium NoneThallium 2Vanadium 20Zinc 120
Lowest Screening
Level1
Analyte (μg/L)4,800 --- --- --- --- 404 31,000 --- --- --- --- J 144 2,100 --- --- --- --- 587
< 5 --- --- --- --- J 2.63 13 --- --- --- --- J 2.67 < 5 --- --- --- --- < 10< 5 < 10 < 10 J 15.3 14 < 10 < 10 < 25 < 5 < 10 < 10 < 25
300 309 301 345 430 200 184 191 240 243 151 245--- --- --- --- --- --- < 5 --- --- --- --- --- --- < 5 --- --- --- --- --- --- < 5< 5 < 5 < 5 < 5 < 5 < 5 5 < 5 < 5 < 5 < 5 < 5
48,000 --- --- --- --- 41,300 54,000 --- --- --- --- 68,000 66,000 --- --- --- --- 54,10012 < 10 < 10 < 10 200 10.6 < 10 < 10 < 5 1,550 < 10 10
< 5 --- --- --- --- < 20 < 5 --- --- --- --- < 20 < 5 --- --- --- --- J 4.97< 5 --- --- --- --- 20.4 200 --- --- --- --- J 9.33 22 --- --- --- --- 58.1
7,300 --- --- --- --- 1,390 64,000 --- --- --- --- 5,930 10,000 --- --- --- --- 6,84013 < 5 8.35 J 3.77 340 35.6 94.5 J 3.49 26 17.1 < 5 < 5
40,000 --- --- --- --- 41,400 20,000 --- --- --- --- 31,200 22,000 --- --- --- --- 20,800850 --- --- --- --- 252 1,100 --- --- --- --- 1,070 2,300 --- --- --- --- 1,780
< 0.2 < 0.2 < 0.2 < 0.2 0.21 < 0.2 < 0.2 < 0.2 < 0.2 < 0.2 < 0.2 < 0.2< 5 --- --- --- --- 24.5 57 --- --- --- --- < 20 < 5 --- --- --- --- 121
140 --- --- --- --- 153,000 27 --- --- --- --- 66,800 29 --- --- --- --- 43,000< 5 < 10 < 10 J 8.23 < 5 < 10 < 10 J 8.31 < 5 < 10 < 10 < 20< 5 < 10 < 10 < 10 < 5 < 10 < 10 < 10 < 5 < 10 < 10 < 10
460,000 --- --- --- --- 564,000 100,000 --- --- --- --- 376,000 430,000 --- --- --- --- 314,0009.6 --- --- --- --- < 20 < 5 --- --- --- --- < 20 9.7 --- --- --- --- < 20
< 5 --- --- --- --- J 8.6 110 --- --- --- --- J 6.04 < 5 --- --- --- --- J 8.2735 --- --- --- --- 18.1 710 --- --- --- --- 19.4 59 --- --- --- --- 74.8
Notes:
If parent and duplicate results were reported, the highest result is shown< = Not detected above laboratory reporting limit shown --- = Not sampled or not reported
TotalTotalDissolvedMay, 1999 May, 1999 May, 19993/14/00 3/14/00 3/13/00
TotalDissolvedTotal3/13/003/13/00 3/13/00 6/19/01 6/21/01
TotalTotalDissolvedTotalTotal6/19/01
Total
1 Concentration shown is the lowest of the EPA Maximum Contaminant Levels (MCLs), DDOE Class G1 Groundwater Standards, and Surface Water Ecological Screening Levels
KPSMW4 MW5 MW6

Table 2. Historical Groundwater Data - Metals (Micrograms per Liter, mg/L)Kenilworth Landfill Site, Washington, DC
K:\3-0700-11\OU-2\Supplemental Groundwater Study\SAP\Supplemental GW Study SAP Body\Tables\083013 Kenilworth Historical Data Tables-draft Metals Page 3
(μg/L)Aluminum 87Antimony 6Arsenic 10Barium 4Beryllium 0.66Cadmium 0.25Calcium NoneChromium (total) 11Cobalt 23Copper 1,000Iron 1,000Lead 3Magnesium NoneManganese 120Mercury 0.77Nickel 52Potassium NoneSelenium 5Silver 2Sodium NoneThallium 2Vanadium 20Zinc 120
Lowest Screening
Level1
Analyte (μg/L)82,000 1,250 < 5 < 200 6,100 < 200 7,900 < 200 2,200 < 200 < 200 < 200
53 < 10 < 5 < 10 < 5 J 6.33 < 5 13 < 5 J 8.26 J 4.55 J 3.4160 < 25 < 5 J 9.89 < 5 < 25 < 5 < 25 < 5 J 13.7 < 25 < 25
2,500 782 < 20 1,240 1,100 1,290 370 1,310 4,000 6,880 289 847--- --- < 5 --- --- < 5 --- --- < 5 --- --- < 5 --- --- < 5 < 5 < 5
21 < 5 < 5 < 5 5.3 < 5 < 5 < 5 < 5 < 5 < 5 < 565,000 19,700 29,000 37,000 78,000 102,000 87,000 117,000 120,000 123,000 114,000 124,000
280 J 3.79 < 5 < 10 < 5 < 10 24 < 10 < 5 < 10 < 10 J 9.9132 < 20 < 5 < 20 < 5 < 20 < 5 < 20 < 5 < 20 < 20 < 20
1,800 J 9.31 < 5 < 20 150 < 20 < 5 20.4 < 5 < 20 J 6.07 J 5.79220,000 3,780 39,000 7,220 26,000 23,500 60,000 38,000 23,000 27,400 9,600 92,8002,800 24.3 < 5 < 5 620 < 5 44 53.4 98 J 3.62 < 5 < 5
31,000 19,500 5,500 66,400 72,000 29,100 26,000 34,600 31,000 35,500 29,600 17,9002,300 52 1,900 39.3 250 140 920 310 89 74.6 364 7220.6 < 0.2 < 0.2 < 0.2 < 0.2 < 0.2 < 0.2 < 0.2 < 0.2 < 0.2 < 0.2 < 0.2280 < 20 < 5 < 20 < 5 < 20 < 5 J 13.8 < 5 < 20 < 20 < 20
65,000 61,200 < 5 104,000 150,000 49,700 11,000 17,300 11,000 16,800 25,200 8,82050 J 7.72 < 5 J 9.64 < 5 J 9.25 20 J 12.1 < 5 J 8.22 J 14.2 J 9.34150 < 10 < 5 < 10 < 5 < 10 < 5 < 10 < 5 < 10 < 10 < 10
190,000 176,000 < 5 441,000 920,000 187,000 30,000 50,600 32,000 44,000 67,000 11,600< 5 < 20 < 5 < 20 < 5 < 20 < 5 < 20 < 5 < 20 < 20 < 20
300 J 3.08 < 5 < 20 < 5 < 20 57 < 20 < 5 < 20 < 20 J 4.545,700 70.7 20 J 8.15 650 J 5.26 69 16.7 91 13.6 24 73.7
Notes:
If parent and duplicate results were reported, the highest result is shown< = Not detected above laboratory reporting limit shown --- = Not sampled or not reported
6/29/016/22/01 6/22/01 May, 1999Total Total
May, 1999 6/21/01May, 1999 May, 1999TotalTotalTotalTotalTotalTotalTotalTotal
6/27/016/22/01 6/21/01May, 1999
MW10TotalTotal
MW11
1 Concentration shown is the lowest of the EPA Maximum Contaminant Levels (MCLs), DDOE Class G1 Groundwater Standards, and Surface Water Ecological Screening Levels
KPSMW12 MW13MW7 MW8 MW9

Table 2. Historical Groundwater Data - Metals (Micrograms per Liter, mg/L)Kenilworth Landfill Site, Washington, DC
K:\3-0700-11\OU-2\Supplemental Groundwater Study\SAP\Supplemental GW Study SAP Body\Tables\083013 Kenilworth Historical Data Tables-draft Metals Page 4
(μg/L)Aluminum 87Antimony 6Arsenic 10Barium 4Beryllium 0.66Cadmium 0.25Calcium NoneChromium (total) 11Cobalt 23Copper 1,000Iron 1,000Lead 3Magnesium NoneManganese 120Mercury 0.77Nickel 52Potassium NoneSelenium 5Silver 2Sodium NoneThallium 2Vanadium 20Zinc 120
Lowest Screening
Level1
Analyte (μg/L)--- --- --- --- < 200 5,000 665 4,400 52,500 6,230 2,200 3,470 980 62.4 1,600--- --- --- --- < 20 < 20 < 20 < 20 < 20 2.71 < 20 4.26 < 20 < 20 < 20< 10 < 10 --- --- < 10 --- --- < 10 22 --- --- < 10 --- --- 28 --- --- < 10
144 122 52.7 37 216 1,500 830 611 370 229 140 158 250--- --- --- --- --- --- < 2 --- --- < 2 5.8 --- --- < 2 --- --- < 2 --- --- < 2< 5 < 5 --- --- < 1 --- --- < 1 < 1 --- --- < 1 --- --- < 1 --- --- < 1--- --- --- --- 25,800 31,500 36,100 42,100 120,000 107,000 111,000 154,000 101,000 137,000 126,000
18.7 < 10 < 10 11 12 15 91 15.2 5.8 16.1 5 3.71 6.3--- --- --- --- < 20 11 < 20 4.2 70 5.1 < 4 21.4 < 4 < 4 < 4--- --- --- --- 8.09 24 7.35 14 98 40.3 17 22.9 21 13.9 11--- --- --- --- 52.7 17,900 33,700 34,600 82,400 13,200 5,900 26,500 18,200 9,410 12,300
20.3 8.71 < 5 18 < 5 14 110 148 71 20.3 7.3 < 5 11--- --- --- --- 4,930 7,000 26,500 22,800 60,100 36,800 27,400 60,800 14,500 52,300 48,200--- --- --- --- 63 130 1,940 1,300 2,400 541 390 1,600 590 1,110 990< 0.2 < 0.2 < 0.2 < 0.2 < 0.2 < 0.2 < 0.2 < 0.2 < 0.2 0.125 < 0.2 < 0.2 < 0.2--- --- --- --- 5.4 < 10 < 10 11 100 10.2 < 10 37.8 < 10 < 10 < 10--- --- --- --- 2,760 2.5 68,900 64,700 84,200 12,100 7,300 13,900 4,400 75,200 78,200< 10 < 10 < 15 < 15 < 15 < 15 < 15 8.54 < 15 17.2 < 15 11.7 < 15< 10 < 10 --- --- < 3 --- --- < 3 < 3 --- --- < 3 --- --- < 3 --- --- < 3--- --- --- --- 10,000 12,000 376,000 390,000 234,000 36,200 24,800 39,000 5,000 331,000 291,000--- --- --- --- --- --- < 20 --- --- < 20 < 20 --- --- < 20 --- --- < 20 --- --- < 20--- --- --- --- < 20 23 12.2 23 130 14.8 5.2 11.2 5.7 22.1 69--- --- --- --- 43.1 30 21.9 40 330 244 130 84.5 23 42.1 32
Notes:
If parent and duplicate results were reported, the highest result is shown< = Not detected above laboratory reporting limit shown --- = Not sampled or not reported
3/13/00 3/13/00 3/7/063/6/06 3/6/06 3/10/06 3/7/066/25/01 6/25/01 6/25/01 6/26/013/6/066/29/01Total Dissolved Total Total Total TotalTotalTotalTotalTotalTotal TotalTotal
Kenilworth MarshMW-6N
1 Concentration shown is the lowest of the EPA Maximum Contaminant Levels (MCLs), DDOE Class G1 Groundwater Standards, and Surface Water Ecological Screening Levels
KPNTMW12 MW-1N MW2N MW-3NR MW-4N MW-5N

Table 2. Historical Groundwater Data - Metals (Micrograms per Liter, mg/L)Kenilworth Landfill Site, Washington, DC
K:\3-0700-11\OU-2\Supplemental Groundwater Study\SAP\Supplemental GW Study SAP Body\Tables\083013 Kenilworth Historical Data Tables-draft Metals Page 5
(μg/L)Aluminum 87Antimony 6Arsenic 10Barium 4Beryllium 0.66Cadmium 0.25Calcium NoneChromium (total) 11Cobalt 23Copper 1,000Iron 1,000Lead 3Magnesium NoneManganese 120Mercury 0.77Nickel 52Potassium NoneSelenium 5Silver 2Sodium NoneThallium 2Vanadium 20Zinc 120
Lowest Screening
Level1
Analyte (μg/L)150 1,700 29,200 6,200 < 200 15,200 74,300 11,200 39,300 25,600 7,600 2,400 36,7002.55 < 20 < 20 < 20 4.26 < 20 < 20 < 20 < 20 < 20 < 20 < 20 < 20
--- --- < 10 51 40 --- --- 11 43 22 64 160 11 < 10 2355 120 1,900 800 271 290 1,400 420 1,000 1,800 2,200 520 390
--- --- < 2 2.8 < 2 --- --- 3.2 6.2 < 2 6.7 2.9 < 2 < 2 3.2--- --- < 1 5.3 2.5 --- --- 2.5 7.4 < 1 < 1 2 < 1 < 1 < 1
181,000 208,000 25,000 9,900 127,000 171,000 60,000 96,900 163,000 59,000 44,500 25,300 40,9003.6 7.2 200 92 4.12 73 210 J 28 130 160 30 5 100
< 20 < 4 28 11 < 20 27 73 110 140 24 23 < 4 375.31 27 180 48 6.05 56 620 J 36 190 120 31 12 539,730 21,100 47,400 15,400 23,200 70,300 233,000 100,000 405,000 57,000 49,100 2,200 116,000
< 5 65 1,300 800 < 5 140 1,400 J 19 260 260 22 30 4189,600 75,600 4,800 1,600 21,900 26,400 48,700 25,100 62,700 49,700 23,100 38,000 16,2001,080 1,300 830 360 996 1,700 4,900 2,000 2,200 460 1,100 83 4,600
< 0.2 < 0.2 0.32 < 0.2 < 0.2 < 0.2 0.69 < 0.2 0.34 < 0.2 < 0.2 < 0.2 < 0.2< 10 < 10 70 33 < 10 85 130 25 78 38 13 < 10 57
67,500 50,400 292,000 262,000 8,570 8,000 76,700 32,800 65,500 174,000 14,700 38,700 43,60021.9 < 15 < 15 < 15 12.5 < 15 < 15 < 15 < 15 < 15 < 15 < 15 < 15
--- --- < 3 4.5 < 3 --- --- < 3 13 < 3 4.4 3.5 < 3 < 3 < 3145,000 96,600 1,940,000 1,860,000 27,700 28,000 140,000 178,000 563,000 996,000 116,000 120,000 129,000
--- --- < 20 < 20 < 20 --- --- < 20 < 20 < 20 < 20 < 20 < 20 < 20 < 204.94 21 190 180 < 20 72 280 J 49 210 240 39 < 20 16019.8 92 1,400 660 16.6 360 2,800 J 66 470 630 80 42 250
Notes:
If parent and duplicate results were reported, the highest result is shown< = Not detected above laboratory reporting limit shown --- = Not sampled or not reported
TotalDissolvedTotalTotalTotal3/10/06 3/10/063/10/06 3/13/06 3/10/063/14/063/14/066/29/01 6/25/013/10/06 3/13/06 3/13/063/7/06
TotalTotalTotalTotalTotalTotalTotalTotalMW-15N MW-16NMW-7N MW-8NR MW-9N MW-11NMW-10N MW-12N MW-13N MW-14N
1 Concentration shown is the lowest of the EPA Maximum Contaminant Levels (MCLs), DDOE Class G1 Groundwater Standards, and Surface Water Ecological Screening Levels
KPN

Table 3. Historical Groundwater Data - VOCs (Micrograms per Liter, mg/L)Kenilworth Landfill Site, Washington, DC
K:\3-0700-11\OU-2\Supplemental Groundwater Study\SAP\Supplemental GW Study SAP Body\Tables\083013 Kenilworth Historical Data Tables-draft VOCs Page 6
(µg/L)1,1,1-Trichloroethane 11 --- --- --- --- --- --- --- --- --- --- --- --- --- --- --- --- --- --- --- --- --- --- < 51,1,2,2-Tetrachloroethane 610 --- --- --- --- --- --- --- --- --- --- --- --- --- --- --- --- --- --- --- --- --- --- < 51,1,2-Trichloroethane 5 --- --- --- --- --- --- --- --- --- --- --- --- --- --- --- --- --- --- --- --- --- --- < 51,1-Dichloroethane 47 --- --- --- --- --- --- --- --- --- --- --- --- --- --- --- --- --- --- --- --- --- --- < 51,1-Dichloroethene 7 --- --- --- --- --- --- --- --- --- --- --- --- --- --- --- --- --- --- --- --- --- --- < 51,2,4-Trichlorobenzene 70 --- --- --- --- --- --- --- --- --- --- --- --- --- --- --- --- --- --- --- --- --- --- --- ---1,2-Dibromo-3-chloropropane 0.2 --- --- --- --- --- --- --- --- --- --- --- --- --- --- --- --- --- --- --- --- --- --- --- ---1,2-Dichlorobenzene 14 --- --- --- --- --- --- --- --- --- --- --- --- --- --- --- --- --- --- --- --- --- --- < 51,2-Dichloroethane 5.0 --- --- --- --- --- --- --- --- --- --- --- --- --- --- --- --- --- --- --- --- --- --- < 51,2-Dichloropropane 5 --- --- --- --- --- --- --- --- --- --- --- --- --- --- --- --- --- --- --- --- --- --- < 51,3-Dichlorobenzene 71 --- --- --- --- --- --- --- --- --- --- --- --- --- --- --- --- --- --- --- --- --- --- < 51,4-Dichlorobenzene 15 --- --- --- --- --- --- --- --- --- --- --- --- --- --- --- --- --- --- --- --- --- --- J 3.42-Butanone (MEK) None < 1 < 1 < 1 < 1 < 1 < 1 < 1 < 1 < 1 < 1 < 1 < 102-Hexanone 99 --- --- --- --- --- --- --- --- --- --- --- --- --- --- --- --- --- --- --- --- --- --- < 10Acetone 1,500 J 5.1 < 5 < 5 J 2 < 5 < 5 < 5 < 5 < 5 < 5 < 5 J 8.41Benzene 5 < 1 < 1 < 1 < 1 < 1 < 1 < 1 < 1 < 1 < 1 < 1 < 5Bromodichloromethane None --- --- --- --- --- --- --- --- --- --- --- --- --- --- --- --- --- --- --- --- --- --- < 5Bromoform 320 --- --- --- --- --- --- --- --- --- --- --- --- --- --- --- --- --- --- --- --- --- --- < 5Bromomethane None --- --- --- --- --- --- --- --- --- --- --- --- --- --- --- --- --- --- --- --- --- --- < 10Carbon disulfide 1 < 1 < 1 J 1.3 < 1 < 1 < 1 < 1 < 1 < 1 < 1 < 1 < 5Carbon tetrachloride 5 --- --- --- --- --- --- --- --- --- --- --- --- --- --- --- --- --- --- --- --- --- --- < 5Chlorobenzene 64 --- --- --- --- --- --- --- --- --- --- --- --- --- --- --- --- --- --- --- --- --- --- J 2.8Chloroethane None --- --- --- --- --- --- --- --- --- --- --- --- --- --- --- --- --- --- --- --- --- --- < 10Chloroform 28 --- --- --- --- --- --- --- --- --- --- --- --- --- --- --- --- --- --- --- --- --- --- < 5Chloromethane None --- --- --- --- --- --- --- --- --- --- --- --- --- --- --- --- --- --- --- --- --- --- < 10cis-1,2-Dichloroethene 70 --- --- --- --- --- --- --- --- --- --- --- --- --- --- --- --- --- --- --- --- --- --- < 5cis-1,3-Dichloropropene None --- --- --- --- --- --- --- --- --- --- --- --- --- --- --- --- --- --- --- --- --- --- < 5Cyclohexane None --- --- --- --- --- --- --- --- --- --- --- --- --- --- --- --- --- --- --- --- --- --- --- ---Dibromochloromethane None --- --- --- --- --- --- --- --- --- --- --- --- --- --- --- --- --- --- --- --- --- --- < 5Dichloromethane (Methylene chloride) 5 --- --- --- --- --- --- --- --- --- --- --- --- --- --- --- --- --- --- --- --- --- --- --- ---Ethylbenzene 7.3 --- --- --- --- --- --- --- --- --- --- --- --- --- --- --- --- --- --- --- --- --- --- < 5Ethylene dibromide 0.05 --- --- --- --- --- --- --- --- --- --- --- --- --- --- --- --- --- --- --- --- --- --- --- ---Freon-11 None --- --- --- --- --- --- --- --- --- --- --- --- --- --- --- --- --- --- --- --- --- --- < 5Freon-113 None --- --- --- --- --- --- --- --- --- --- --- --- --- --- --- --- --- --- --- --- --- --- --- ---Freon-12 None --- --- --- --- --- --- --- --- --- --- --- --- --- --- --- --- --- --- --- --- --- --- --- ---Isopropylbenzene None --- --- --- --- --- --- --- --- --- --- --- --- --- --- --- --- --- --- --- --- --- --- --- ---
Analyte (µg/L) May, 1999 May, 1999 May, 1999 May, 1999May, 1999May, 1999MW3 MW4 MW5 MW6 MW7 MW8
Project Screening
Level1
KPS
May, 1999 May, 1999May, 1999 May, 1999MW1 MW2
6/27/01MW9 MW10
May, 1999MW11 MW12

Table 3. Historical Groundwater Data - VOCs (Micrograms per Liter, mg/L)Kenilworth Landfill Site, Washington, DC
K:\3-0700-11\OU-2\Supplemental Groundwater Study\SAP\Supplemental GW Study SAP Body\Tables\083013 Kenilworth Historical Data Tables-draft VOCs Page 7
(µg/L)Analyte (µg/L) May, 1999 May, 1999 May, 1999 May, 1999May, 1999May, 1999MW3 MW4 MW5 MW6 MW7 MW8
Project Screening
Level1
KPS
May, 1999 May, 1999May, 1999 May, 1999MW1 MW2
6/27/01MW9 MW10
May, 1999MW11 MW12
Methyl acetate None --- --- --- --- --- --- --- --- --- --- --- --- --- --- --- --- --- --- --- --- --- --- --- ---Methyl isobutyl ketone (MIBK) None --- --- --- --- --- --- --- --- --- --- --- --- --- --- --- --- --- --- --- --- --- --- < 5Methyl tert-butyl ether (MTBE) None --- --- --- --- --- --- --- --- --- --- --- --- --- --- --- --- --- --- --- --- --- --- --- ---Methylcyclohexane None --- --- --- --- --- --- --- --- --- --- --- --- --- --- --- --- --- --- --- --- --- --- --- ---Styrene 72 --- --- --- --- --- --- --- --- --- --- --- --- --- --- --- --- --- --- --- --- --- --- < 5Tetrachloroethene 5 --- --- --- --- --- --- --- --- --- --- --- --- --- --- --- --- --- --- --- --- --- --- < 5Toluene 9.8 --- --- --- --- --- --- --- --- --- --- --- --- --- --- --- --- --- --- --- --- --- --- < 5trans-1,2-Dichloroethene 100 --- --- --- --- --- --- --- --- --- --- --- --- --- --- --- --- --- --- --- --- --- --- < 5trans-1,3-Dichloropropene None --- --- --- --- --- --- --- --- --- --- --- --- --- --- --- --- --- --- --- --- --- --- < 5Trichloroethene 5 --- --- --- --- --- --- --- --- --- --- --- --- --- --- --- --- --- --- --- --- --- --- < 5Vinyl chloride 2 --- --- --- --- --- --- --- --- --- --- --- --- --- --- --- --- --- --- --- --- --- --- < 10Xylenes (unspecified) 10,000 --- --- --- --- --- --- --- --- --- --- --- --- --- --- --- --- --- --- --- --- --- --- < 5
Notes:
If parent and duplicate results were reported, the highest result is shown< = Less than laboratory reporting limit shown --- = Not sampled or not reported
Project screening level is the lowest of the EPA Maximum Contaminant Levels (MCLs), DDOE Class G1 Groundwater Standards, and NPS Surface Water Ecological Screening Values

Table 3. Historical Groundwater Data - VOCs (Micrograms per Liter, mg/L)Kenilworth Landfill Site, Washington, DC
K:\3-0700-11\OU-2\Supplemental Groundwater Study\SAP\Supplemental GW Study SAP Body\Tables\083013 Kenilworth Historical Data Tables-draft VOCs Page 8
(µg/L)1,1,1-Trichloroethane 11 1,1,2,2-Tetrachloroethane 610 1,1,2-Trichloroethane 5 1,1-Dichloroethane 47 1,1-Dichloroethene 7 1,2,4-Trichlorobenzene 70 1,2-Dibromo-3-chloropropane 0.2 1,2-Dichlorobenzene 14 1,2-Dichloroethane 5.0 1,2-Dichloropropane 5 1,3-Dichlorobenzene 71 1,4-Dichlorobenzene 15 2-Butanone (MEK) None2-Hexanone 99 Acetone 1,500 Benzene 5 Bromodichloromethane NoneBromoform 320 Bromomethane NoneCarbon disulfide 1 Carbon tetrachloride 5 Chlorobenzene 64 Chloroethane NoneChloroform 28 Chloromethane Nonecis-1,2-Dichloroethene 70 cis-1,3-Dichloropropene NoneCyclohexane NoneDibromochloromethane NoneDichloromethane (Methylene chloride) 5 Ethylbenzene 7.3 Ethylene dibromide 0.05 Freon-11 NoneFreon-113 NoneFreon-12 NoneIsopropylbenzene None
Analyte (µg/L)
Project Screening
Level1
< 5 --- --- < 1 < 10 < 4 --- --- < 1 --- --- < 1 --- --- < 5 --- --- < 1 < 10< 5 --- --- < 1 < 10 < 4 --- --- < 1 --- --- < 1 --- --- < 5 --- --- < 1 < 10< 5 --- --- < 1 < 10 < 4 --- --- < 1 --- --- < 1 --- --- < 5 --- --- < 1 < 10< 5 --- --- < 1 < 10 < 4 --- --- < 1 --- --- < 1 --- --- < 5 --- --- < 1 < 10< 5 --- --- < 1 < 10 < 4 --- --- < 1 --- --- < 1 --- --- < 5 --- --- < 1 < 10--- --- --- --- < 1 < 10 < 4 --- --- < 1 --- --- < 1 --- --- < 5 --- --- < 1 < 10--- --- --- --- < 1 < 10 < 4 --- --- < 1 --- --- < 1 --- --- < 5 --- --- < 1 < 10< 5 --- --- < 1 < 10 < 4 --- --- < 1 --- --- < 1 --- --- < 5 --- --- < 1 < 10< 5 --- --- < 1 < 10 < 4 --- --- < 1 --- --- < 1 --- --- < 5 --- --- < 1 < 10< 5 --- --- < 1 < 10 < 4 --- --- < 1 --- --- < 1 --- --- < 5 --- --- < 1 < 10< 5 --- --- < 1 < 10 < 4 --- --- < 1 --- --- < 1 --- --- < 5 --- --- < 1 < 10< 5 --- --- < 1 < 10 < 4 --- --- < 1 --- --- < 1 --- --- < 5 --- --- < 1 < 10< 10 --- --- < 5 < 50 J 16 --- --- < 5 --- --- < 5 --- --- < 25 --- --- < 5 < 50< 10 --- --- < 5 < 50 < 20 --- --- < 5 --- --- < 5 --- --- < 25 --- --- < 5 < 50< 10 < 10 < 5 < 50 < 20 7.25 < 5 < 10 8.1 < 10 < 25 < 10 < 5 J 25< 5 --- --- J 0.64 42 < 4 --- --- < 1 --- --- J 0.61 --- --- < 5 --- --- < 1 < 10< 5 --- --- < 1 < 10 < 4 --- --- < 1 --- --- < 1 --- --- < 5 --- --- < 1 < 10< 5 --- --- < 1 < 10 < 4 --- --- < 1 --- --- < 1 --- --- < 5 --- --- < 1 < 10< 10 --- --- < 1 < 10 < 4 --- --- < 1 --- --- < 1 --- --- < 5 --- --- < 1 < 10J 4.58 < 10 2.5 < 10 < 4 < 10 < 1 < 10 J 0.7 < 10 < 5 3.1 < 1 < 10< 5 --- --- < 1 < 10 < 4 --- --- < 1 --- --- < 1 --- --- < 5 --- --- < 1 < 10< 5 --- --- < 1 < 10 < 4 --- --- < 1 --- --- < 1 --- --- 8.2 --- --- < 1 < 10< 10 --- --- < 1 < 10 < 4 --- --- < 1 --- --- < 1 --- --- < 5 --- --- < 1 < 10< 5 --- --- 14 < 10 < 4 --- --- < 1 --- --- < 1 --- --- < 5 --- --- < 1 < 10< 10 --- --- < 1 < 10 < 4 --- --- < 1 --- --- < 1 --- --- < 5 --- --- < 1 < 10< 5 --- --- < 1 < 10 < 4 --- --- < 1 --- --- < 1 --- --- < 5 --- --- < 1 < 10< 5 --- --- < 1 < 10 < 4 --- --- < 1 --- --- < 1 --- --- < 5 --- --- < 1 < 10--- --- --- --- < 1 < 10 < 4 --- --- < 1 --- --- < 1 --- --- < 5 --- --- < 1 < 10< 5 --- --- < 1 < 10 < 4 --- --- < 1 --- --- < 1 --- --- < 5 --- --- < 1 < 10
--- --- --- --- < 1 < 10 < 4 --- --- < 1 --- --- < 1 --- --- < 5 --- --- < 1 < 10< 5 --- --- < 1 < 10 < 4 --- --- < 1 --- --- < 1 --- --- < 5 --- --- < 1 < 10--- --- --- --- < 1 < 10 < 4 --- --- < 1 --- --- < 1 --- --- < 5 --- --- < 1 < 10< 5 --- --- < 1 < 10 < 4 --- --- < 1 --- --- < 1 --- --- < 5 --- --- < 1 < 10--- --- --- --- < 1 < 10 < 4 --- --- < 1 --- --- < 1 --- --- < 5 --- --- < 1 < 10--- --- --- --- < 1 < 10 < 4 --- --- < 1 --- --- < 1 --- --- < 5 --- --- < 1 < 10--- --- --- --- < 1 < 10 < 4 --- --- < 1 --- --- < 1 --- --- < 5 --- --- < 1 < 10
MW-3N3/7/06
KPS KPN
3/10/06 6/29/01 3/6/06 6/26/01 37/2006MW-2NMW-1N3/6/06 6/29/01
MW-4N MW-8NR3/10/066/25/01 3/7/066/29/01 6/25/01 3/6/06
MW13 MW-7NMW-5N MW-6N

Table 3. Historical Groundwater Data - VOCs (Micrograms per Liter, mg/L)Kenilworth Landfill Site, Washington, DC
K:\3-0700-11\OU-2\Supplemental Groundwater Study\SAP\Supplemental GW Study SAP Body\Tables\083013 Kenilworth Historical Data Tables-draft VOCs Page 9
(µg/L)Analyte (µg/L)
Project Screening
Level1
Methyl acetate NoneMethyl isobutyl ketone (MIBK) NoneMethyl tert-butyl ether (MTBE) NoneMethylcyclohexane NoneStyrene 72 Tetrachloroethene 5 Toluene 9.8 trans-1,2-Dichloroethene 100 trans-1,3-Dichloropropene NoneTrichloroethene 5 Vinyl chloride 2 Xylenes (unspecified) 10,000
MW-3N3/7/06
KPS KPN
3/10/06 6/29/01 3/6/06 6/26/01 37/2006MW-2NMW-1N3/6/06 6/29/01
MW-4N MW-8NR3/10/066/25/01 3/7/066/29/01 6/25/01 3/6/06
MW13 MW-7NMW-5N MW-6N
--- --- --- --- < 1 < 10 < 4 --- --- < 1 --- --- < 1 --- --- < 5 --- --- < 1 < 10
< 5 --- --- < 5 < 50 < 20 --- --- < 5 --- --- < 5 --- --- < 25 --- --- < 5 < 50
--- --- --- --- < 1 < 10 < 4 --- --- < 1 --- --- < 1 --- --- < 5 --- --- < 1 < 10--- --- --- --- < 1 < 10 < 4 --- --- < 1 --- --- < 1 --- --- < 5 --- --- < 1 < 10< 5 --- --- < 1 < 10 < 4 --- --- < 1 --- --- < 1 --- --- < 5 --- --- < 1 < 10< 5 --- --- < 1 < 10 < 4 --- --- < 1 --- --- < 1 --- --- < 5 --- --- < 1 < 10< 5 --- --- J 0.57 24 < 4 --- --- < 1 --- --- J 0.64 --- --- < 5 --- --- < 1 < 10< 5 --- --- < 1 < 10 < 4 --- --- < 1 --- --- < 1 --- --- < 5 --- --- < 1 < 10< 5 --- --- < 1 < 10 < 4 --- --- < 1 --- --- < 1 --- --- < 5 --- --- < 1 < 10< 5 --- --- < 1 < 10 < 4 --- --- < 1 --- --- < 1 --- --- < 5 --- --- < 1 < 10< 10 --- --- < 1 < 10 < 4 --- --- < 1 --- --- < 1 --- --- < 5 --- --- < 1 < 10< 5 --- --- < 3 J 14 < 12 --- --- < 3 --- --- < 3 --- --- < 15 --- --- < 3 < 30
Notes:
If parent and duplicate results were reported, the highest result is shown< = Less than laboratory reporting limit shown --- = Not sampled or not reported
1 Project screening level is the lowest of the EPA Maximum Contaminant Levels (MCLs), DDOE Class G1 Groundwater Standards, and NPS Surface Water Ecological Screening Values

Table 3. Historical Groundwater Data - VOCs (Micrograms per Liter, mg/L)Kenilworth Landfill Site, Washington, DC
K:\3-0700-11\OU-2\Supplemental Groundwater Study\SAP\Supplemental GW Study SAP Body\Tables\083013 Kenilworth Historical Data Tables-draft VOCs Page 10
(µg/L)1,1,1-Trichloroethane 11 1,1,2,2-Tetrachloroethane 610 1,1,2-Trichloroethane 5 1,1-Dichloroethane 47 1,1-Dichloroethene 7 1,2,4-Trichlorobenzene 70 1,2-Dibromo-3-chloropropane 0.2 1,2-Dichlorobenzene 14 1,2-Dichloroethane 5.0 1,2-Dichloropropane 5 1,3-Dichlorobenzene 71 1,4-Dichlorobenzene 15 2-Butanone (MEK) None2-Hexanone 99 Acetone 1,500 Benzene 5 Bromodichloromethane NoneBromoform 320 Bromomethane NoneCarbon disulfide 1 Carbon tetrachloride 5 Chlorobenzene 64 Chloroethane NoneChloroform 28 Chloromethane Nonecis-1,2-Dichloroethene 70 cis-1,3-Dichloropropene NoneCyclohexane NoneDibromochloromethane NoneDichloromethane (Methylene chloride) 5 Ethylbenzene 7.3 Ethylene dibromide 0.05 Freon-11 NoneFreon-113 NoneFreon-12 NoneIsopropylbenzene None
Analyte (µg/L)
Project Screening
Level1
--- --- < 2 < 2 < 2 < 10 < 5 < 4 < 1 < 4 < 2--- --- < 2 < 2 < 2 < 10 < 5 < 4 < 1 < 4 < 2--- --- < 2 < 2 < 2 < 10 < 5 < 4 < 1 < 4 < 2--- --- < 2 < 2 < 2 < 10 < 5 < 4 < 1 < 4 < 2--- --- < 2 < 2 < 2 < 10 < 5 < 4 < 1 < 4 < 2--- --- < 2 < 2 < 2 < 10 < 5 < 4 < 1 < 4 < 2--- --- < 2 < 2 < 2 < 10 < 5 < 4 < 1 < 4 < 2--- --- < 2 < 2 < 2 < 10 < 5 < 4 < 1 < 4 < 2--- --- < 2 < 2 < 2 < 10 < 5 < 4 < 1 < 4 < 2--- --- < 2 < 2 < 2 < 10 < 5 < 4 < 1 < 4 < 2--- --- < 2 < 2 < 2 < 10 < 5 < 4 < 1 < 4 < 2--- --- < 2 < 2 < 2 < 10 < 5 < 4 < 1 < 4 < 2--- --- < 10 < 10 < 10 < 50 < 25 J 13 < 5 < 20 < 10--- --- < 10 < 10 < 10 < 50 < 25 < 20 < 5 < 20 < 10< 10 < 10 11 < 10 < 50 < 25 22 J 3.1 < 20 < 10--- --- < 2 < 2 < 2 < 10 < 5 < 4 < 1 < 4 < 2--- --- < 2 < 2 < 2 < 10 < 5 < 4 < 1 < 4 < 2--- --- < 2 < 2 < 2 < 10 < 5 < 4 < 1 < 4 < 2--- --- < 2 < 2 < 2 < 10 < 5 < 4 < 1 < 4 < 2< 10 < 2 < 2 < 2 < 10 < 5 < 4 < 1 < 4 < 2--- --- < 2 < 2 < 2 < 10 < 5 < 4 < 1 < 4 < 2--- --- < 2 < 2 < 2 < 10 < 5 < 4 < 1 < 4 < 2--- --- < 2 < 2 < 2 < 10 < 5 < 4 < 1 < 4 < 2--- --- < 2 < 2 < 2 < 10 < 5 < 4 < 1 < 4 < 2--- --- < 2 < 2 < 2 < 10 < 5 < 4 < 1 < 4 < 2--- --- < 2 < 2 < 2 < 10 < 5 < 4 < 1 < 4 < 2--- --- < 2 < 2 < 2 < 10 < 5 < 4 < 1 < 4 < 2--- --- < 2 < 2 < 2 < 10 < 5 < 4 < 1 < 4 < 2--- --- < 2 < 2 < 2 < 10 < 5 < 4 < 1 < 4 < 2
--- --- < 2 < 2 < 2 J 9.6 J 3.4 < 4 < 1 < 4 < 2--- --- < 2 < 2 < 2 < 10 < 5 < 4 < 1 < 4 < 2--- --- < 2 < 2 < 2 < 10 < 5 < 4 < 1 < 4 < 2--- --- < 2 < 2 < 2 < 10 < 5 < 4 < 1 < 4 < 2--- --- < 2 < 2 < 2 < 10 < 5 < 4 < 1 < 4 < 2--- --- < 2 < 2 < 2 < 10 < 5 < 4 < 1 < 4 < 2--- --- < 2 < 2 < 2 < 10 < 5 < 4 < 1 < 4 < 2
3/10/06 3/10/06 3/13/063/13/06 3/14/06 3/14/063/13/06 3/13/06 3/10/06MW-12NMW-11NMW-10NMW-9N/NR
6/25/01
KPN
MW-17NMW-16NMW-15NMW-14NMW-13N
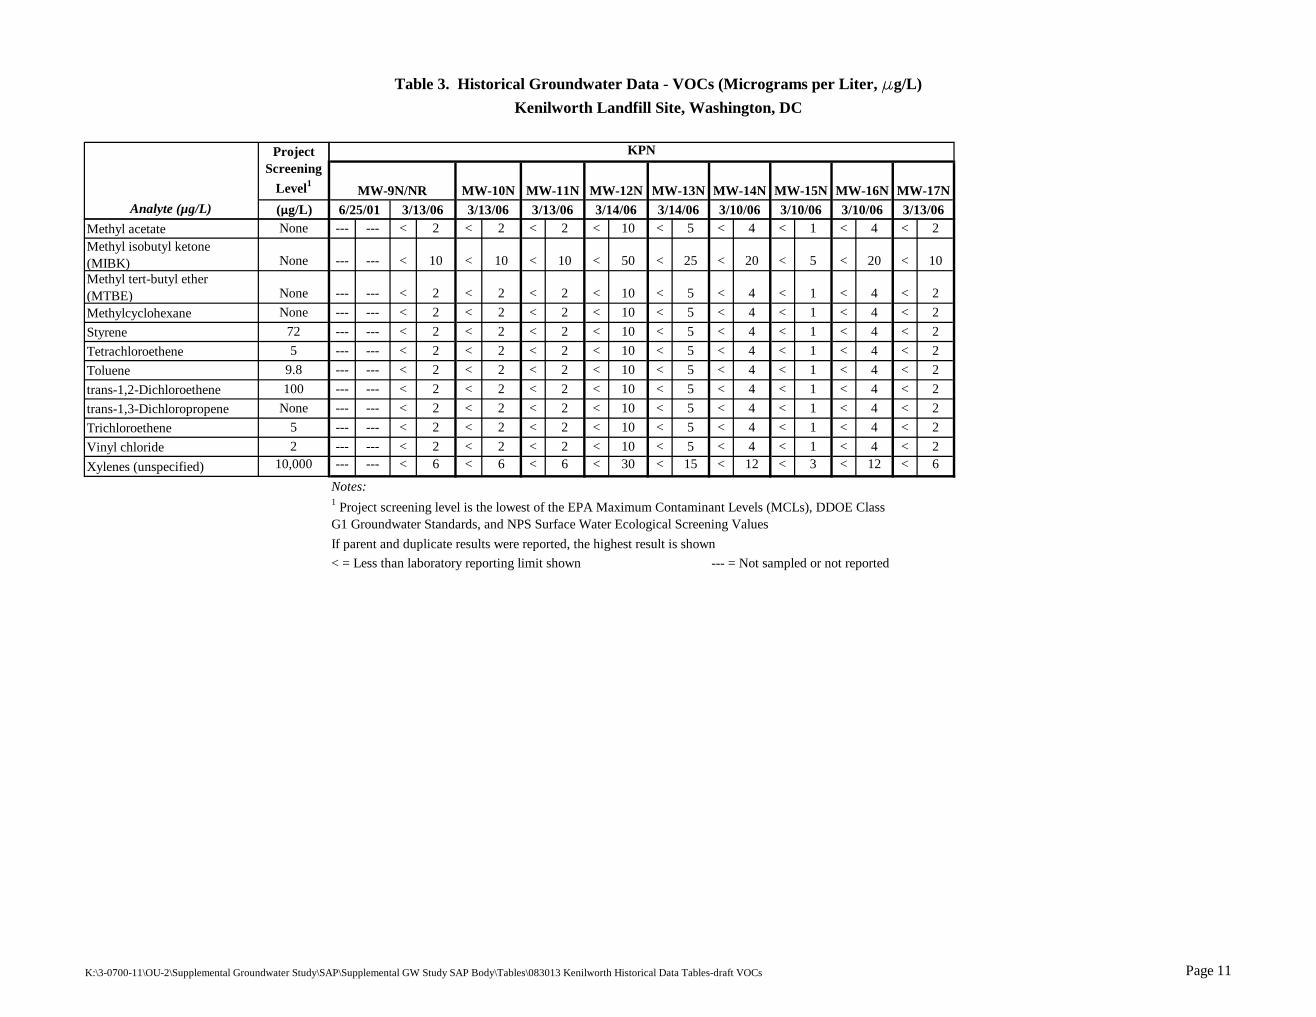
Table 3. Historical Groundwater Data - VOCs (Micrograms per Liter, mg/L)Kenilworth Landfill Site, Washington, DC
K:\3-0700-11\OU-2\Supplemental Groundwater Study\SAP\Supplemental GW Study SAP Body\Tables\083013 Kenilworth Historical Data Tables-draft VOCs Page 11
(µg/L)Analyte (µg/L)
Project Screening
Level1
Methyl acetate NoneMethyl isobutyl ketone (MIBK) NoneMethyl tert-butyl ether (MTBE) NoneMethylcyclohexane NoneStyrene 72 Tetrachloroethene 5 Toluene 9.8 trans-1,2-Dichloroethene 100 trans-1,3-Dichloropropene NoneTrichloroethene 5 Vinyl chloride 2 Xylenes (unspecified) 10,000
3/10/06 3/10/06 3/13/063/13/06 3/14/06 3/14/063/13/06 3/13/06 3/10/06MW-12NMW-11NMW-10NMW-9N/NR
6/25/01
KPN
MW-17NMW-16NMW-15NMW-14NMW-13N
--- --- < 2 < 2 < 2 < 10 < 5 < 4 < 1 < 4 < 2
--- --- < 10 < 10 < 10 < 50 < 25 < 20 < 5 < 20 < 10
--- --- < 2 < 2 < 2 < 10 < 5 < 4 < 1 < 4 < 2--- --- < 2 < 2 < 2 < 10 < 5 < 4 < 1 < 4 < 2--- --- < 2 < 2 < 2 < 10 < 5 < 4 < 1 < 4 < 2--- --- < 2 < 2 < 2 < 10 < 5 < 4 < 1 < 4 < 2--- --- < 2 < 2 < 2 < 10 < 5 < 4 < 1 < 4 < 2--- --- < 2 < 2 < 2 < 10 < 5 < 4 < 1 < 4 < 2--- --- < 2 < 2 < 2 < 10 < 5 < 4 < 1 < 4 < 2--- --- < 2 < 2 < 2 < 10 < 5 < 4 < 1 < 4 < 2--- --- < 2 < 2 < 2 < 10 < 5 < 4 < 1 < 4 < 2--- --- < 6 < 6 < 6 < 30 < 15 < 12 < 3 < 12 < 6
Notes:
If parent and duplicate results were reported, the highest result is shown< = Less than laboratory reporting limit shown --- = Not sampled or not reported
1 Project screening level is the lowest of the EPA Maximum Contaminant Levels (MCLs), DDOE Class G1 Groundwater Standards, and NPS Surface Water Ecological Screening Values

Table 4. Historical Groundwater Data - Pesticides and PCBs (Micrograms per Liter, mg/L)Kenilworth Landfill Site, Washington, DC
K:\3-0700-11\OU-2\Supplemental Groundwater Study\SAP\Supplemental GW Study SAP Body\Tables\083013 Kenilworth Historical Data Tables-draft Pesticides and PCBs Page 12
4,4'-DDE 0.0110 < 0.05 < 0.05 < 0.05 < 0.05 J 0.012 < 0.05 < 0.05 < 0.05 < 0.05 < 0.05 < 0.054,4'-DDD None --- --- --- --- --- --- --- --- --- --- --- --- --- --- --- --- --- --- --- --- --- ---4,4'-DDT 0.0010 --- --- --- --- --- --- --- --- --- --- --- --- --- --- --- --- --- --- --- --- --- ---Alpha BHC 2.2000 --- --- --- --- --- --- --- --- --- --- --- --- --- --- --- --- --- --- --- --- --- ---alpha-Chlordane 0.0043 --- --- --- --- --- --- --- --- --- --- --- --- --- --- --- --- --- --- --- --- --- ---gamma-Chlordane 0.004 < 0.05 < 0.05 J 0.018 < 0.05 < 0.05 < 0.05 < 0.05 < 0.05 < 0.05 < 0.05 < 0.05Aldrin 0.300 --- --- --- --- --- --- --- --- --- --- --- --- --- --- --- --- --- --- --- --- --- ---Beta BHC 2.2 < 0.05 < 0.05 0.055 J 0.045 J 0.015 < 0.05 < 0.05 < 0.05 < 0.05 < 0.05 < 0.05Delta BHC 2.2 < 0.05 < 0.05 J 0.034 < 0.05 < 0.05 < 0.05 < 0.05 < 0.05 < 0.05 < 0.05 < 0.05Dieldrin 0.056 --- --- --- --- --- --- --- --- --- --- --- --- --- --- --- --- --- --- --- --- --- ---Alpha Endosulfan (Endosulfan I) 0.056 --- --- --- --- --- --- --- --- --- --- --- --- --- --- --- --- --- --- --- --- --- ---Beta Endosulfan (Endosulfan II) 0.056 --- --- --- --- --- --- --- --- --- --- --- --- --- --- --- --- --- --- --- --- --- ---Endosulfan Sulfate None --- --- --- --- --- --- --- --- --- --- --- --- --- --- --- --- --- --- --- --- --- ---Endrin 0.036 --- --- --- --- --- --- --- --- --- --- --- --- --- --- --- --- --- --- --- --- --- ---Endrin Aldehyde 0.036 --- --- --- --- --- --- --- --- --- --- --- --- --- --- --- --- --- --- --- --- --- ---Endrin Ketone 0.036 --- --- --- --- --- --- --- --- --- --- --- --- --- --- --- --- --- --- --- --- --- ---gamma-BHC (Lindane) 0.095 --- --- --- --- --- --- --- --- --- --- --- --- --- --- --- --- --- --- --- --- --- ---Heptachlor 0.004 --- --- --- --- --- --- --- --- --- --- --- --- --- --- --- --- --- --- --- --- --- ---Heptachlor epoxide 0.004 < 0.05 < 0.05 J 0.024 J 0.013 < 0.05 < 0.05 < 0.05 < 0.05 < 0.05 < 0.05 < 0.05Methoxychlor 0.030 --- --- --- --- --- --- --- --- --- --- --- --- --- --- --- --- --- --- --- --- --- ---Toxaphene 0.0003 --- --- --- --- --- --- --- --- --- --- --- --- --- --- --- --- --- --- --- --- --- ---Polychlorinated Biphenyls (PCBs) (µg/L)Aroclor-1016 0.500 < 0.5 < 0.5 < 0.5 < 0.5 < 0.5 < 0.5 < 0.5 < 0.5 < 0.5 < 0.5 < 0.5Aroclor-1221 0.280 < 0.5 < 0.5 < 0.5 < 0.5 < 0.5 < 0.5 < 0.5 < 0.5 < 0.5 < 0.5 < 0.5Aroclor-1232 0.500 < 0.5 < 0.5 < 0.5 < 0.5 < 0.5 < 0.5 < 0.5 < 0.5 < 0.5 < 0.5 < 0.5Aroclor-1242 0.053 < 0.5 < 0.5 < 0.5 < 0.5 < 0.5 < 0.5 < 0.5 < 0.5 < 0.5 < 0.5 < 0.5Aroclor-1248 0.081 < 0.5 < 0.5 < 0.5 < 0.5 < 0.5 < 0.5 < 0.5 < 0.5 < 0.5 < 0.5 < 0.5Aroclor-1254 0.033 < 0.5 < 0.5 < 0.5 < 0.5 < 0.5 < 0.5 < 0.5 < 0.5 < 0.5 < 0.5 < 0.5Aroclor-1260 0.500 < 0.5 < 0.5 < 0.5 < 0.5 < 0.5 < 0.5 < 0.5 < 0.5 < 0.5 < 0.5 < 0.5
Notes:
If parent and duplicate results were reported, the highest result is shown< = Less than laboratory reporting limit shown --- = Not sampled or not reported
Project screening level is the lowest of the EPA Maximum Contaminant Levels (MCLs), DDOE Class G1 Groundwater Standards, and NPS Surface Water Ecological Screening Values
MW3 MW4 MW5May, 1999 May, 1999 May, 1999
MW11MW8 MW9 MW10May, 1999
Project Screening
Level1
(µg/L)MW2MW1 MW6 MW7
May, 1999 May, 1999 May, 1999 May, 1999 May, 1999 May, 1999 May, 1999Organochlorine Pesticides (µg/L)
KPS

Table 4. Historical Groundwater Data - Pesticides and PCBs (Micrograms per Liter, mg/L)Kenilworth Landfill Site, Washington, DC
K:\3-0700-11\OU-2\Supplemental Groundwater Study\SAP\Supplemental GW Study SAP Body\Tables\083013 Kenilworth Historical Data Tables-draft Pesticides and PCBs Page 13
4,4'-DDE 0.01104,4'-DDD None4,4'-DDT 0.0010Alpha BHC 2.2000alpha-Chlordane 0.0043gamma-Chlordane 0.004Aldrin 0.300Beta BHC 2.2Delta BHC 2.2Dieldrin 0.056Alpha Endosulfan (Endosulfan I) 0.056Beta Endosulfan (Endosulfan II) 0.056Endosulfan Sulfate NoneEndrin 0.036Endrin Aldehyde 0.036Endrin Ketone 0.036gamma-BHC (Lindane) 0.095Heptachlor 0.004Heptachlor epoxide 0.004Methoxychlor 0.030Toxaphene 0.0003Polychlorinated Biphenyls (PCBs) (µg/L)Aroclor-1016 0.500Aroclor-1221 0.280Aroclor-1232 0.500Aroclor-1242 0.053Aroclor-1248 0.081Aroclor-1254 0.033Aroclor-1260 0.500
Project Screening
Level1
(µg/L)Organochlorine Pesticides (µg/L)< 0.1 < 0.1 --- --- < 0.049 --- --- < 0.048 < 0.05 --- --- J 0.032 --- --- < 0.048 --- --- J 0.03< 0.09 < 0.09 < 0.049 < 0.049 < 0.049 < 0.048 < 0.05 < 0.049 J 0.032 0.098 < 0.048 < 0.049 J 0.027< 0.1 < 0.1 < 0.049 < 0.049 < 0.049 < 0.048 < 0.05 < 0.049 < 0.048 0.122 < 0.048 < 0.049 < 0.048< 0.04 < 0.04 < 0.049 < 0.049 < 0.049 < 0.048 < 0.05 < 0.049 < 0.048 0.012 < 0.048 < 0.049 < 0.048< 0.06 J 0.001 < 0.049 < 0.049 < 0.049 < 0.048 < 0.05 < 0.049 J 0.024 J 0.03 < 0.048 < 0.049 < 0.048< 0.05 < 0.05 < 0.049 < 0.049 < 0.049 < 0.048 < 0.05 < 0.049 J 0.03 0.067 < 0.048 < 0.049 J 0.03< 0.07 < 0.07 < 0.049 < 0.049 < 0.049 < 0.048 < 0.05 < 0.049 < 0.048 0.014 < 0.048 < 0.049 < 0.048< 0.05 < 0.05 < 0.049 < 0.049 < 0.049 < 0.048 < 0.05 < 0.049 < 0.048 0.099 < 0.048 < 0.049 < 0.048< 0.06 < 0.06 < 0.049 < 0.049 < 0.049 < 0.048 < 0.05 < 0.049 < 0.048 0.099 < 0.048 < 0.049 < 0.048< 0.1 < 0.1 < 0.049 < 0.049 < 0.049 < 0.048 < 0.05 < 0.049 < 0.048 0.097 J 0.03 < 0.049 < 0.048< 0.05 J 0.001 < 0.049 < 0.049 < 0.049 < 0.048 < 0.05 < 0.049 < 0.048 J 0.03 < 0.048 < 0.049 < 0.048< 0.18 < 0.18 < 0.049 < 0.049 < 0.049 < 0.048 < 0.05 < 0.049 < 0.048 0.059 < 0.048 < 0.049 < 0.048< 0.4 < 0.4 < 0.049 < 0.049 < 0.049 < 0.048 < 0.05 < 0.049 < 0.048 0.071 < 0.048 < 0.049 < 0.048< 0.1 < 0.1 < 0.049 < 0.049 < 0.049 < 0.048 < 0.05 < 0.049 < 0.048 0.197 < 0.048 < 0.049 < 0.048< 0.3 < 0.3 < 0.049 < 0.049 < 0.049 < 0.048 < 0.05 < 0.049 < 0.048 0.122 < 0.048 < 0.049 < 0.048< 0.2 < 0.2 < 0.049 < 0.049 < 0.049 < 0.048 < 0.05 < 0.049 < 0.048 J 0.03 < 0.048 < 0.049 < 0.048< 0.04 < 0.04 --- --- < 0.049 --- --- < 0.048 < 0.05 --- --- < 0.048 --- --- --- --- --- --- < 0.048< 0.1 < 0.1 < 0.049 < 0.049 < 0.049 < 0.048 < 0.05 < 0.049 < 0.048 0.075 < 0.048 < 0.049 < 0.048< 0.1 < 0.1 --- --- < 0.049 --- --- < 0.048 < 0.05 --- --- < 0.048 --- --- < 0.048 --- --- < 0.048< 1 < 1 --- --- < 0.049 --- --- < 0.048 < 0.05 --- --- < 0.048 --- --- --- --- --- --- < 0.048< 3 < 3 --- --- < 0.98 --- --- < 0.96 < 1 --- --- < 0.96 --- --- --- --- --- --- < 0.96
< 0.5 < 0.5 --- --- < 0.48 --- --- < 0.5 < 0.5 --- --- < 0.48 --- --- < 0.48 --- --- < 0.48< 1 < 1 --- --- < 0.48 --- --- < 0.5 < 0.5 --- --- < 0.48 --- --- < 0.48 --- --- < 0.48< 0.5 < 0.5 --- --- < 0.48 --- --- < 0.5 < 0.5 --- --- < 0.48 --- --- < 0.48 --- --- < 0.48J 0.327 < 0.5 --- --- < 0.48 --- --- < 0.5 < 0.5 --- --- < 0.48 --- --- < 0.48 --- --- < 0.48< 0.5 < 0.5 --- --- < 0.48 --- --- < 0.5 < 0.5 --- --- < 0.48 --- --- < 0.48 --- --- < 0.48< 0.5 < 0.5 --- --- < 0.48 --- --- < 0.5 < 0.5 --- --- < 0.48 --- --- < 0.48 --- --- < 0.48< 0.5 < 0.5 --- --- < 0.48 --- --- < 0.5 < 0.5 --- --- < 0.48 --- --- < 0.48 --- --- < 0.48
Notes:
If parent and duplicate results were reported, the highest result is shown< = Less than laboratory reporting limit shown --- = Not sampled or not reported
1 Project screening level is the lowest of the EPA Maximum Contaminant Levels (MCLs), DDOE Class G1 Groundwater Standards, and NPS Surface Water Ecological Screening Values
6/29/016/27/01MW12 MW-1NMW13 MW-5N MW-6NMW-2N MW-3NR MW-4N
6/26/01 3/7/066/25/01 3/6/06 6/25/01 3/6/06 3/10/06 6/25/01 3/7/06 6/29/01 3/6/06
KPNKPS

Table 4. Historical Groundwater Data - Pesticides and PCBs (Micrograms per Liter, mg/L)Kenilworth Landfill Site, Washington, DC
K:\3-0700-11\OU-2\Supplemental Groundwater Study\SAP\Supplemental GW Study SAP Body\Tables\083013 Kenilworth Historical Data Tables-draft Pesticides and PCBs Page 14
4,4'-DDE 0.01104,4'-DDD None4,4'-DDT 0.0010Alpha BHC 2.2000alpha-Chlordane 0.0043gamma-Chlordane 0.004Aldrin 0.300Beta BHC 2.2Delta BHC 2.2Dieldrin 0.056Alpha Endosulfan (Endosulfan I) 0.056Beta Endosulfan (Endosulfan II) 0.056Endosulfan Sulfate NoneEndrin 0.036Endrin Aldehyde 0.036Endrin Ketone 0.036gamma-BHC (Lindane) 0.095Heptachlor 0.004Heptachlor epoxide 0.004Methoxychlor 0.030Toxaphene 0.0003Polychlorinated Biphenyls (PCBs) (µg/L)Aroclor-1016 0.500Aroclor-1221 0.280Aroclor-1232 0.500Aroclor-1242 0.053Aroclor-1248 0.081Aroclor-1254 0.033Aroclor-1260 0.500
Project Screening
Level1
(µg/L)Organochlorine Pesticides (µg/L)--- --- < 0.049 < 0.048 --- --- < 0.05 < 0.048 < 0.048 < 0.05 < 0.048 < 0.048 < 0.048 < 0.05< 0.049 < 0.049 < 0.048 < 0.049 < 0.05 < 0.048 < 0.048 < 0.05 < 0.048 < 0.048 < 0.048 < 0.05< 0.049 < 0.049 < 0.048 < 0.049 < 0.05 < 0.048 < 0.048 < 0.05 < 0.048 < 0.048 < 0.048 < 0.05< 0.049 < 0.049 J 0.035 < 0.049 < 0.05 < 0.048 < 0.048 < 0.05 J 0.039 < 0.048 < 0.048 < 0.05J 0.014 < 0.049 < 0.048 < 0.049 < 0.05 < 0.048 < 0.048 < 0.05 < 0.048 J 0.022 < 0.048 < 0.05J 0.01 < 0.049 J 0.027 < 0.049 < 0.05 < 0.048 < 0.048 < 0.05 < 0.048 J 0.027 < 0.048 < 0.05< 0.049 < 0.049 < 0.048 < 0.049 < 0.05 < 0.048 < 0.048 < 0.05 < 0.048 < 0.05 < 0.048 < 0.05< 0.049 < 0.049 < 0.048 < 0.049 < 0.05 < 0.048 < 0.048 < 0.05 < 0.048 < 0.05 < 0.048 < 0.05< 0.049 < 0.049 J 0.035 < 0.049 < 0.05 < 0.048 < 0.048 < 0.05 < 0.048 < 0.05 < 0.048 < 0.05< 0.049 < 0.049 < 0.048 < 0.049 < 0.05 < 0.048 < 0.048 < 0.05 < 0.048 J 0.032 < 0.048 < 0.05J 0.014 < 0.049 < 0.048 < 0.049 < 0.05 < 0.048 < 0.048 < 0.05 < 0.048 < 0.05 < 0.048 < 0.05< 0.049 < 0.049 < 0.048 < 0.049 < 0.05 < 0.048 < 0.048 < 0.05 < 0.048 < 0.05 < 0.048 < 0.05< 0.049 < 0.049 < 0.048 < 0.049 < 0.05 < 0.048 < 0.048 < 0.05 < 0.048 < 0.05 < 0.048 < 0.05< 0.049 < 0.049 < 0.048 < 0.049 < 0.05 < 0.048 < 0.048 < 0.05 < 0.048 < 0.05 < 0.048 < 0.05< 0.049 < 0.049 < 0.048 < 0.049 < 0.05 < 0.048 < 0.048 < 0.05 J 0.04 < 0.05 < 0.048 < 0.05< 0.049 < 0.049 < 0.048 < 0.049 < 0.05 < 0.048 < 0.048 < 0.05 < 0.048 < 0.05 < 0.048 < 0.05--- --- < 0.049 < 0.048 --- --- < 0.05 < 0.048 < 0.048 < 0.05 < 0.048 < 0.05 < 0.048 < 0.05< 0.049 < 0.049 < 0.048 < 0.049 < 0.05 < 0.048 < 0.048 < 0.05 < 0.048 < 0.05 < 0.048 < 0.05--- --- < 0.049 < 0.048 --- --- < 0.05 < 0.048 < 0.048 < 0.05 < 0.048 < 0.05 < 0.048 < 0.05--- --- < 0.049 < 0.048 --- --- < 0.05 < 0.048 < 0.048 < 0.05 < 0.048 < 0.05 < 0.048 < 0.05--- --- < 0.98 < 0.96 --- --- < 1 < 0.96 < 0.96 < 1 < 0.96 < 0.96 < 0.96 < 1
--- --- < 0.49 < 0.48 --- --- < 0.5 < 0.48 < 0.48 < 0.5 < 0.48 < 0.48 < 0.48 < 0.5--- --- < 0.49 < 0.48 --- --- < 0.5 < 0.48 < 0.48 < 0.5 < 0.48 < 0.48 < 0.48 < 0.5--- --- < 0.49 < 0.48 --- --- < 0.5 < 0.48 < 0.48 < 0.5 < 0.48 < 0.48 < 0.48 < 0.5--- --- < 0.49 < 0.48 --- --- < 0.5 < 0.48 < 0.48 < 0.5 < 0.48 < 0.48 < 0.48 < 0.5--- --- < 0.49 < 0.48 --- --- < 0.5 J 0.39 < 0.48 < 0.5 < 0.48 < 0.48 < 0.48 < 0.5--- --- < 0.49 < 0.48 --- --- < 0.5 0.86 < 0.48 < 0.5 < 0.48 < 0.48 < 0.48 < 0.5--- --- < 0.49 < 0.48 --- --- < 0.5 < 0.48 < 0.48 < 0.5 < 0.48 < 0.48 < 0.48 < 0.5
Notes:
If parent and duplicate results were reported, the highest result is shown< = Less than laboratory reporting limit shown --- = Not sampled or not reported
1 Project screening level is the lowest of the EPA Maximum Contaminant Levels (MCLs), DDOE Class G1 Groundwater Standards, and NPS Surface Water Ecological Screening Values
MW-15NMW-10N MW-11NMW-7N MW-8NR MW-9N6/29/01
MW-16NMW-12N MW-13N MW-14N3/10/06 3/10/06
KPN
3/14/06 3/14/06 3/10/063/13/06 3/13/06 3/13/063/7/06 3/10/06 6/25/01

Table 5. Historical Groundwater Data - SVOCs and TPH (Micrograms per Liter, mg/L)Kenilworth Landfill Site, Washington, DC
K:\3-0700-11\OU-2\Supplemental Groundwater Study\SAP\Supplemental GW Study SAP Body\Tables\083013 Kenilworth Historical Data Tables-draft SVOCs and TPH Page 15
2-Methylnaphthalene None --- --- --- --- --- --- --- --- --- --- --- --- --- --- --- --- --- --- --- --- --- --- < 102,4-Dimethylphenol None --- --- --- --- --- --- --- --- --- --- --- --- --- --- --- --- --- --- --- --- --- --- < 104-Methylphenol None < 0.5 < 0.5 < 0.5 < 0.5 < 0.5 < 0.5 J 2.8 < 0.5 < 0.5 J 6.5 < 0.5 < 10Acenaphthene 23 --- --- --- --- --- --- --- --- --- --- --- --- --- --- --- --- --- --- --- --- --- --- < 10Acenaphthylene None --- --- --- --- --- --- --- --- --- --- --- --- --- --- --- --- --- --- --- --- --- --- < 10Anthracene 0.73 --- --- --- --- --- --- --- --- --- --- --- --- --- --- --- --- --- --- --- --- --- --- < 10Benzo(a)anthracene 0.027 --- --- --- --- --- --- --- --- --- --- --- --- --- --- --- --- --- --- --- --- --- --- < 10Benzo(a)pyrene 0.014 --- --- --- --- --- --- --- --- --- --- --- --- --- --- --- --- --- --- --- --- --- --- < 10Benzo(b)fluoranthene None --- --- --- --- --- --- --- --- --- --- --- --- --- --- --- --- --- --- --- --- --- --- < 10Benzo(g,h,i)perylene None --- --- --- --- --- --- --- --- --- --- --- --- --- --- --- --- --- --- --- --- --- --- < 10Benzo(k)fluoranthene None --- --- --- --- --- --- --- --- --- --- --- --- --- --- --- --- --- --- --- --- --- --- < 10Benozoic acid 1.0 --- --- --- --- --- --- --- --- --- --- --- --- --- --- --- --- --- --- --- --- --- --- < 150bis(2-Ethylhexyl) phthalate 3.0 < 0.5 J 2.8 < 0.5 23 < 0.5 J 2.2 < 0.5 < 0.5 J 7.8 < 0.5 < 0.5 J 6.63Butylbenzylphthalate 19 --- --- --- --- --- --- --- --- --- --- --- --- --- --- --- --- --- --- --- --- --- --- < 10Chrysene None --- --- --- --- --- --- --- --- --- --- --- --- --- --- --- --- --- --- --- --- --- --- < 10Dibenzo(a,h)anthracene None --- --- --- --- --- --- --- --- --- --- --- --- --- --- --- --- --- --- --- --- --- --- < 10Dibenzofuran 1.1 --- --- --- --- --- --- --- --- --- --- --- --- --- --- --- --- --- --- --- --- --- --- < 10Diethylphthalate 210 --- --- --- --- --- --- --- --- --- --- --- --- --- --- --- --- --- --- --- --- --- --- < 10Dimethylphthalate None --- --- --- --- --- --- --- --- --- --- --- --- --- --- --- --- --- --- --- --- --- --- < 10Di-n-butylphthalate 35 < 0.5 < 0.5 < 0.5 < 0.5 < 0.5 < 0.5 < 0.5 < 0.5 40 < 0.5 < 0.5 < 10Di-n-octylphthalate None --- --- --- --- --- --- --- --- --- --- --- --- --- --- --- --- --- --- --- --- --- --- < 10Fluoranthene 0.04 --- --- --- --- --- --- --- --- --- --- --- --- --- --- --- --- --- --- --- --- --- --- < 10Fluorene 3.9 --- --- --- --- --- --- --- --- --- --- --- --- --- --- --- --- --- --- --- --- --- --- < 10Indeno(1,2,3-cd)pyrene None --- --- --- --- --- --- --- --- --- --- --- --- --- --- --- --- --- --- --- --- --- --- < 10Naphthalene 12 < 0.5 < 0.5 < 0.5 < 0.5 < 0.5 < 0.5 < 0.5 < 0.5 < 0.5 < 0.5 J 6.2 < 10Phenanthrene 0.40 < 0.5 < 0.5 < 0.5 < 0.5 < 0.5 < 0.5 < 0.5 < 0.5 < 0.5 < 0.5 J 2.0 < 10Pyrene 0.25 --- --- --- --- --- --- --- --- --- --- --- --- --- --- --- --- --- --- --- --- --- --- < 10
Total Petroleum Hydrocarbons None < 0.5 < 0.5 < 0.5 < 0.5 < 0.5 42 < 0.5 < 0.5 < 0.5 < 0.5 < 0.5 --- ---Notes:
If parent and duplicate results were reported, the highest result is shown J = Estimated< = Less than laboratory reporting limit shown --- = Not sampled or not reported
Project screening level is the lowest of the EPA Maximum Contaminant Levels (MCLs), DDOE Class G1 Groundwater Standards, and NPS Surface Water Ecological Screening Values
May, 1999May, 1999May, 1999 6/27/01MW1 MW2 MW9 MW10 MW11MW5 MW6 MW7 MW8 MW12
Project Screening
Level1
(µg/L) Analyte (µg/L)
KPS
MW3 MW4May, 1999 May, 1999 May, 1999May, 1999 May, 1999 May, 1999 May, 1999May, 1999

Table 5. Historical Groundwater Data - SVOCs and TPH (Micrograms per Liter, mg/L)Kenilworth Landfill Site, Washington, DC
K:\3-0700-11\OU-2\Supplemental Groundwater Study\SAP\Supplemental GW Study SAP Body\Tables\083013 Kenilworth Historical Data Tables-draft SVOCs and TPH Page 16
2-Methylnaphthalene None2,4-Dimethylphenol None4-Methylphenol NoneAcenaphthene 23Acenaphthylene NoneAnthracene 0.73Benzo(a)anthracene 0.027Benzo(a)pyrene 0.014Benzo(b)fluoranthene NoneBenzo(g,h,i)perylene NoneBenzo(k)fluoranthene NoneBenozoic acid 1.0bis(2-Ethylhexyl) phthalate 3.0Butylbenzylphthalate 19Chrysene NoneDibenzo(a,h)anthracene NoneDibenzofuran 1.1Diethylphthalate 210Dimethylphthalate NoneDi-n-butylphthalate 35Di-n-octylphthalate NoneFluoranthene 0.04Fluorene 3.9Indeno(1,2,3-cd)pyrene NoneNaphthalene 12Phenanthrene 0.40Pyrene 0.25
Total Petroleum Hydrocarbons None
Project Screening
Level1
(µg/L) Analyte (µg/L)< 10 --- --- < 10 --- --- < 10 < 10 --- --- < 10 --- --- < 10 --- --- < 10 --- --- < 10< 10 --- --- < 10 --- --- < 10 < 10 --- --- < 10 --- --- < 10 --- --- < 10 --- --- < 10< 10 --- --- < 10 --- --- < 10 J 1 --- --- < 10 --- --- < 10 --- --- < 10 --- --- < 10< 10 --- --- < 10 --- --- < 10 < 10 --- --- < 10 --- --- < 10 --- --- < 10 --- --- < 10< 10 --- --- < 10 --- --- < 10 < 10 --- --- < 10 --- --- < 10 --- --- < 10 --- --- < 10< 10 --- --- < 10 --- --- < 10 < 10 --- --- < 10 --- --- < 10 --- --- < 10 --- --- < 10< 10 --- --- < 10 --- --- < 10 < 10 --- --- < 10 --- --- < 10 --- --- < 10 --- --- J 2< 10 --- --- < 10 --- --- < 10 < 10 --- --- < 10 --- --- < 10 --- --- < 10 --- --- J 2< 10 --- --- < 10 --- --- < 10 < 10 --- --- < 10 --- --- < 10 --- --- < 10 --- --- J 2< 10 --- --- < 10 --- --- < 10 < 10 --- --- < 10 --- --- < 10 --- --- < 10 --- --- J 1< 10 --- --- < 10 --- --- < 10 < 10 --- --- < 10 --- --- < 10 --- --- < 10 --- --- < 10< 150 --- --- < 140 --- --- < 140 < 150 --- --- < 150 --- --- < 140 --- --- < 140 --- --- < 140J 9.07 10.8 < 10 < 10 < 10 J 3 < 10 < 10 < 10 13 < 10 < 10 < 10 < 10< 10 --- --- < 10 --- --- < 10 < 10 --- --- < 10 --- --- < 10 --- --- < 10 --- --- < 10< 10 --- --- < 10 --- --- < 10 < 10 --- --- < 10 --- --- < 10 --- --- < 10 --- --- J 1< 10 --- --- < 10 --- --- < 10 < 10 --- --- < 10 --- --- < 10 --- --- < 10 --- --- < 10< 10 --- --- < 10 --- --- < 10 < 10 --- --- < 10 --- --- < 10 --- --- < 10 --- --- < 10< 10 --- --- < 10 --- --- < 10 < 10 --- --- < 10 --- --- < 10 --- --- < 10 --- --- < 10< 10 --- --- < 10 --- --- < 10 < 10 --- --- < 10 --- --- < 10 --- --- < 10 --- --- < 10< 10 --- --- < 10 --- --- < 10 < 10 --- --- < 10 --- --- < 10 --- --- < 10 --- --- < 10< 10 --- --- < 10 --- --- < 10 < 10 --- --- < 10 --- --- < 10 --- --- < 10 --- --- < 10< 10 --- --- < 10 --- --- < 10 < 10 --- --- < 10 --- --- < 10 --- --- J 0.6 --- --- J 3< 10 --- --- < 10 --- --- < 10 < 10 --- --- < 10 --- --- < 10 --- --- < 10 --- --- < 10< 10 --- --- < 10 --- --- < 10 < 10 --- --- < 10 --- --- < 10 --- --- < 10 --- --- J 1< 10 --- --- < 10 --- --- < 10 < 10 --- --- < 10 --- --- < 10 --- --- < 10 --- --- < 10< 10 < 10 < 10 < 10 < 10 < 10 < 10 < 10 4.04 < 10 < 10 < 10 < 10 J 2< 10 --- --- < 10 --- --- < 10 < 10 --- --- < 10 --- --- < 10 --- --- J 0.6 --- --- J 2
--- --- --- --- --- --- --- --- --- --- --- --- --- --- --- --- --- --- --- --- --- --- --- --- --- --- --- ---Notes:
If parent and duplicate results were reported, the highest result is shown J = Estimated< = Less than laboratory reporting limit shown --- = Not sampled or not reported
1 Project screening level is the lowest of the EPA Maximum Contaminant Levels (MCLs), DDOE Class G1 Groundwater Standards, and NPS Surface Water Ecological Screening Values
3/6/06 6/25/01 3/7/06
KPN
MW13 MW-4N MW-5NMW-1N MW-2N MW-3NR
KPS
6/29/01 6/25/01 3/7/06 6/25/016/25/01 3/6/06 6/25/01 3/6/06 3/10/06MW-6N MW-7N
6/25/01 3/7/06

Table 5. Historical Groundwater Data - SVOCs and TPH (Micrograms per Liter, mg/L)Kenilworth Landfill Site, Washington, DC
K:\3-0700-11\OU-2\Supplemental Groundwater Study\SAP\Supplemental GW Study SAP Body\Tables\083013 Kenilworth Historical Data Tables-draft SVOCs and TPH Page 17
2-Methylnaphthalene None2,4-Dimethylphenol None4-Methylphenol NoneAcenaphthene 23Acenaphthylene NoneAnthracene 0.73Benzo(a)anthracene 0.027Benzo(a)pyrene 0.014Benzo(b)fluoranthene NoneBenzo(g,h,i)perylene NoneBenzo(k)fluoranthene NoneBenozoic acid 1.0bis(2-Ethylhexyl) phthalate 3.0Butylbenzylphthalate 19Chrysene NoneDibenzo(a,h)anthracene NoneDibenzofuran 1.1Diethylphthalate 210Dimethylphthalate NoneDi-n-butylphthalate 35Di-n-octylphthalate NoneFluoranthene 0.04Fluorene 3.9Indeno(1,2,3-cd)pyrene NoneNaphthalene 12Phenanthrene 0.40Pyrene 0.25
Total Petroleum Hydrocarbons None
Project Screening
Level1
(µg/L) Analyte (µg/L)J 2 --- --- < 10 < 10 < 10 < 10 J 7 J 2 < 10 < 10 < 10J 5 --- --- < 10 < 10 < 10 < 10 < 10 < 10 < 10 < 10 < 10J 5 --- --- < 10 < 10 < 10 < 10 J 1 < 10 < 10 < 10 < 10J 4 --- --- < 10 < 10 < 10 < 10 J 5 < 10 < 10 < 10 < 10< 10 --- --- < 10 < 10 < 10 < 10 < 10 < 10 < 10 < 10 < 10< 10 --- --- < 10 < 10 < 10 < 10 J 2 < 10 < 10 < 10 < 10< 10 --- --- J 0.6 < 10 < 10 < 10 J 3 < 10 < 10 < 10 < 10< 10 --- --- < 10 < 10 < 10 < 10 J 2 < 10 < 10 < 10 < 10< 10 --- --- J 0.5 < 10 < 10 < 10 J 3 < 10 < 10 < 10 < 10< 10 --- --- < 10 < 10 < 10 < 10 J 1 < 10 < 10 < 10 < 10< 10 --- --- < 10 < 10 < 10 < 10 < 10 < 10 < 10 < 10 < 10J 140 --- --- < 140 < 140 < 140 < 140 140 < 150 < 150 < 150 < 140< 10 < 10 < 10 J 4 < 10 < 10 < 10 < 10 < 10 J 3 < 10< 10 --- --- < 10 < 10 < 10 < 10 < 10 < 10 < 10 < 10 < 10< 10 --- --- < 10 < 10 < 10 < 10 J 3 < 10 < 10 < 10 < 10< 10 --- --- < 10 < 10 < 10 < 10 J 0.5 < 10 < 10 < 10 < 10J 0.9 --- --- < 10 < 10 < 10 < 10 J 2 < 10 < 10 < 10 < 10< 10 --- --- < 10 < 10 < 10 < 10 < 10 < 10 < 10 < 10 < 10< 10 --- --- < 10 < 10 < 10 < 10 < 10 11 < 10 < 10 < 10< 10 --- --- < 10 < 10 < 10 < 10 < 10 < 10 < 10 < 10 < 10< 10 --- --- < 10 < 10 < 10 < 10 < 10 < 10 < 10 < 10 < 10J 0.8 --- --- J 0.8 < 10 < 10 < 10 J 6 < 10 < 10 < 10 < 10J 2 --- --- < 10 < 10 < 10 < 10 J 4 < 10 < 10 < 10 < 10< 10 --- --- < 10 < 10 < 10 < 10 J 1 < 10 < 10 < 10 < 10
16 --- --- < 10 < 10 < 10 < 10 38 J 0.6 < 10 < 10 < 10J 2 < 10 J 0.5 < 10 < 10 < 10 J 9 < 10 < 10 < 10 < 10J 0.7 --- --- J 0.9 < 10 < 10 < 10 J 5 < 10 < 10 < 10 < 10
--- --- --- --- --- --- --- --- --- --- --- --- --- --- --- --- --- --- --- --- --- ---Notes:
If parent and duplicate results were reported, the highest result is shown J = Estimated< = Less than laboratory reporting limit shown --- = Not sampled or not reported
1 Project screening level is the lowest of the EPA Maximum Contaminant Levels (MCLs), DDOE Class G1 Groundwater Standards, and NPS Surface Water Ecological Screening Values
3/10/06 3/10/06 3/10/066/25/01 3/13/06 3/13/06MW-11N MW-12NMW-9N MW-10N MW-14NMW-8NR
KPN
MW-15N MW-16N MW-17NMW-13N3/10/06 3/13/063/13/006 3/14/06 3/14/06

Table 6. Data Quality Objectives Summary Table Problem Statement Principal Study Questions / Decision
Questions Information Inputs Study Boundaries Analytic Approach/Decision Rules
Why is this investigation being performed? What questions does the investigation need to answer?
What data do we need to answer the decision question?
Specific details regarding sample composition. How will the data answer the question or what additional data will be collected?
An improved and more densely spaced groundwater monitoring network installed at the groundwater/surface water discharge boundary of the Site and Anacostia River is considered necessary to collect sufficient quality and quantity of groundwater samples and confirm conclusions from previous investigations that there are no risks to human and ecological receptors from Site groundwater discharging to the Anacostia River.
Is there evidence to indicate that dissolved contaminants of concern in groundwater are migrating from the Site into the Anacostia River or Kenilworth Marsh at the groundwater/surface water discharge boundary at concentrations exceeding human health or ecological screening levels? If contaminants above screening levels are detected in groundwater at the groundwater/surface water discharge boundary, can the contaminant transport pathway be defined sufficiently to indicate the general area of concern on the Site causing the contaminant discharge, such as a source area?
Recent high quality groundwater contaminant concentration data (i.e., only dissolved transport) from existing and additional monitoring wells at the groundwater/surface water discharge boundary between KPS and the Anacostia River, and KPN and Kenilworth Marsh and the Anacostia River. Water level measurements from existing and new monitoring wells, piezometers, and surface water adjacent to the Site to develop a water table potentiometric surface map that illustrates groundwater gradient directions at the Site to further characterize groundwater/surface water discharge boundaries at the Anacostia River and at Kenilworth Marsh, Watts Branch, and an unnamed southern tributary to Watts Branch, all of which flow into the Anacostia River. Continuous groundwater water-level measurements in monitoring wells along Site/Anacostia River boundaries to establish if tidal fluctuations impact groundwater levels near groundwater discharge boundaries along the Anacostia River and Kenilworth Marsh. Additional shallow geologic and permeability data at the discharge boundaries to be used along with potentiometric maps and dissolved concentration data to assess migration pathways and rates.
The spatial boundaries identified for this study are the groundwater/surface water discharge boundaries downgradient of the Site, which include where the Site borders the Anacostia River, Kenilworth Marsh, Watts Branch, and the unnamed southern tributary to Watts Branch. Spatial boundaries also include definition of dissolved contaminant chemistry from groundwater samples collected below the water table from relatively deeper wells coupled with shallow water table wells to determine if contaminants exist at greater depths at the groundwater/surface water discharge boundary, and if there is any concentration variability from vertical transport. To provide an accurate potentiometric surface map of the water table gradient direction relative to tidal influence of the Anacostia River, temporal boundaries include a minimum of two water level measurements collected at all monitoring locations near high and low tide. If significant tidal effects are observed in groundwater monitoring wells, groundwater samples from these wells will be collected near low tide to characterize groundwater for contaminants when it is most likely flowing toward the Anacostia River.
Contaminant concentrations and groundwater flow directions will be interpreted to a degree of certainty acceptable to NPS to assess whether Site groundwater contamination is discharging to the Anacostia River at concentrations likely to contribute to unacceptable human health or ecological risks. Results may show that additional wells and/or piezometers may be required in an additional investigation stage. Piezometers installed during the supplemental study may be sampled in an additional stage. If contaminants are present in groundwater at the downgradient Site discharge boundaries along the Anacostia River, piezometers may be installed below the Anacostia River bed to determine groundwater chemistry before discharging into the river. If there is evidence of significant contaminant transport in groundwater to the Anacostia River and/or Kenilworth Marsh, collection of surface water samples in the approximate area of transport and discharge will be considered for an additional stage. Water-level elevations will be plotted on a Site map to create water table maps and horizontal groundwater gradient directions from the landfill to surface water bodies, and can be used to delineate horizontal contaminant transport pathways. Vertical gradient directions and magnitude will be determined from monitoring well and piezometer pairs to determine gaining and losing reaches of the Watts Branch. Gradient data along with groundwater concentrations, geology from boring logs, and permeability data will be used to identify potential subsurface contaminant transport pathways, groundwater flow rates, possible contaminant source areas, and response action alternatives.

APPENDIX A
SUPPLEMENTAL GROUNDWATER STUDY FIELD SAMPLING PLAN (FSP)

APPENDIX B
SUPPLEMENTAL GROUNDWATER STUDY QUALITY ASSURANCE PROJECT PLAN (QAPP)