supplemental information enhancing intracranial delivery … · · 2016-04-19supplemental...
TRANSCRIPT

SUPPLEMENTAL INFORMATION
Enhancing Intracranial Delivery of Clinically Relevant Non-viral Gene Vectors
Sneha Berrya,b,#, Panagiotis Mastorakosa,c,#, Clark Zhanga,d, Eric Songa,b, Himat Patela, Jung
Soo Suka,c,*, Justin Hanesa,c,d,e,*
a The Center for Nanomedicine at the Wilmer Eye Institute, Johns Hopkins University School of
Medicine, Baltimore, MD, USA b Center for Biotechnology Education, Krieger School of Arts and Sciences, Johns Hopkins
University, Baltimore, MD, USA c Department of Ophthalmology, Johns Hopkins University School of Medicine, Baltimore, MD,
USA d Department of Biomedical Engineering, Johns Hopkins University School of Medicine,
Baltimore, MD, USA e Department of Chemical & Biomolecular Engineering, Johns Hopkins University, Baltimore,
MD, USA
#contributed equally
*To whom correspondence should be addressed.
E-mail: Jung Soo Suk ([email protected]) or Justin Hanes ([email protected])
Telephone: J.S.S (+1 410 614 4526) or J.H. (+1 443 287 7921)
FAX: J.H. (+1 443 287 7922)
Electronic Supplementary Material (ESI) for RSC Advances.This journal is © The Royal Society of Chemistry 2016
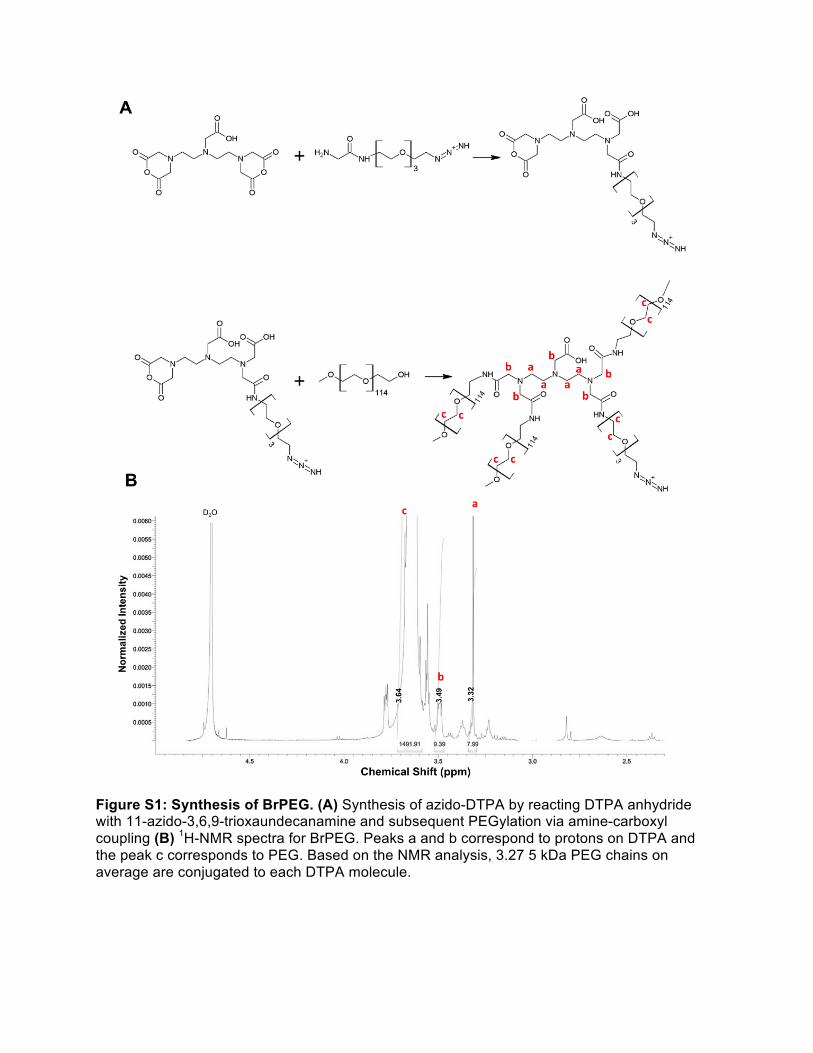
Figure S1: Synthesis of BrPEG. (A) Synthesis of azido-DTPA by reacting DTPA anhydride with 11-azido-3,6,9-trioxaundecanamine and subsequent PEGylation via amine-carboxyl coupling (B) 1H-NMR spectra for BrPEG. Peaks a and b correspond to protons on DTPA and the peak c corresponds to PEG. Based on the NMR analysis, 3.27 5 kDa PEG chains on average are conjugated to each DTPA molecule.
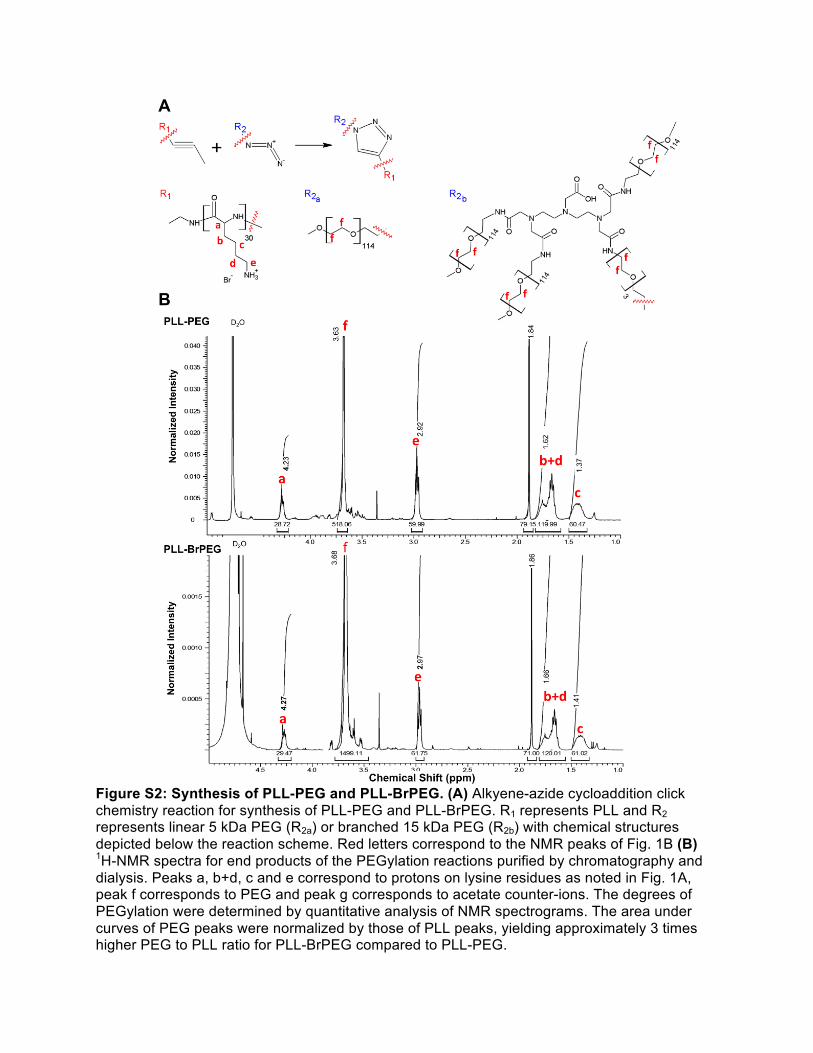
Figure S2: Synthesis of PLL-PEG and PLL-BrPEG. (A) Alkyene-azide cycloaddition click chemistry reaction for synthesis of PLL-PEG and PLL-BrPEG. R1 represents PLL and R2 represents linear 5 kDa PEG (R2a) or branched 15 kDa PEG (R2b) with chemical structures depicted below the reaction scheme. Red letters correspond to the NMR peaks of Fig. 1B (B) 1H-NMR spectra for end products of the PEGylation reactions purified by chromatography and dialysis. Peaks a, b+d, c and e correspond to protons on lysine residues as noted in Fig. 1A, peak f corresponds to PEG and peak g corresponds to acetate counter-ions. The degrees of PEGylation were determined by quantitative analysis of NMR spectrograms. The area under curves of PEG peaks were normalized by those of PLL peaks, yielding approximately 3 times higher PEG to PLL ratio for PLL-BrPEG compared to PLL-PEG.

Figure S3: TEM images representative of DNA-CPN and DNA-BPN 1 hour post treatment with 3% saline; Scale bar: 500 nm.