supplemental material - isciii
TRANSCRIPT

Padrón-Barthe et al., TMEM43 and ARVC5
Page 1 of 36
SUPPLEMENTAL MATERIAL
SUPPLEMENTAL METHODS
Mice
TMEM43WT and TMEM43mut mice, in the C57BL/6JCrl (Charles River Laboratories)
background, respectively express human wild type TMEM43 and human TMEM43-
S358L specifically in cardiomyocytes under the control of the -myosin heavy chain
(MHC) promoter. Wild type C57BL/6 JCrl mice were used as controls. TMEM43mut male
mice were crossed with MHC-CnA1 mice1 to generate the double transgenic mouse
line TMEM43mut-CnAβ1. Male and female mice were used throughout the study. Mice
were housed in an air-conditioned room with a 12h light/dark cycle and free access to
water and chow. For the inhibition of galectin 3, GM-CT-01 was used. TMEM43mut mice
were randomized to the saline-treated control group (n=8) or the GM-CT-01-treated
group (n=8). Mice were treated twice a week with intravenous injections of GM-CT-01
(120 mg/kg) or placebo (normal saline) in the tail vein from 5 weeks of age until 4 months.
For GSK3 inhibition, mice were injected i.p. daily with SB216763 (2.5 mg/kg/day).
Animals were randomly assigned to groups (block randomization). Researchers were
blinded to the allocations. Power calculations were carried out to determine the
necessary number of animals based on prior data (p=0.05; power=80%). All procedures
were approved by the CNIC Ethics Committee and the Regional Government of Madrid.
All animal experiments conformed to EU Directive 2010/63EU and Recommendation
2007/526/EC, enforced in Spanish law under Real Decreto 53/2013.
Echocardiography
Cardiac function, chamber dilatation, and wall thickness were analyzed in neonatal mice
and in mice aged 3 and 5 weeks and 2 and 4 months by transthoracic two-dimensional
(2D), and M-mode (MM) echocardiography. Measurements were carried out by a blinded
operator using a high-frequency ultrasound system with a 50-MHz linear probe for

Padrón-Barthe et al., TMEM43 and ARVC5
Page 2 of 36
neonates and a 30-MHz probe for older mice (Vevo 2100, Visualsonics Inc., Canada).
For ultrasound scans, mice were placed on a heating pad; neonates were not
anesthetized, whereas older mice were kept under light anesthesia with isoflurane
adjusted to obtain a target heart rate of 500±50 bpm. Left ventricular (LV) ejection
fraction (LVEF) and LV end-diastolic volume (LVEDV) were obtained from the long axis
view, and LV posterior wall in diastole (LVPWd) from the short axis view. Right ventricular
(RV) systolic function was assessed indirectly from the tricuspid annular plane systolic
excursion (TAPSE), estimated from maximum lateral tricuspid annulus movement
obtained from a 2D 4-chamber apical view. Images were analyzed off-line by a blinded
expert using the Vevo 2100 Workstation software. Animals were sacrificed by gradually
filling the chamber with carbon dioxide. Mice and hearts and lungs were weighed after
sacrifice.
Electrocardiograms (ECGs)
ECGs were obtained in unanesthetized neonates and in 3- and 5-week-old and 2- and
4-month-old anesthetized mice by using bipolar limb leads (leads I, II, and III) and
unipolar limb leads (leads aVR, aVL, and aVF) for 60-90 seconds. Measurements were
taken by a blinded operator with mice (except for neonates) placed under light
anesthesia with isoflurane (MP36R, BIOPAC Systems, Inc.). ECGs were analyzed by an
expert using Acqknowledge 4.1.1. for MP36R (BIOPAC Systems, Inc.). Mean values
were calculated from 10 consecutive standard ECG time intervals and waves.
Lineage tracing
We generated four sets of lineage tracing mice using Cre-LoxP technology to enable us
to track the fate of different cell populations and their contribution to fibrotic replacement.
Each line carried a floxed reporter allele (EYFP, RFP, or GFP) preceded by a STOP
codon that was removed upon recombination by the Cre recombinase. Each Cre
recombinase was regulated by lineage-specific promoters. Cre-expressing cells and

Padrón-Barthe et al., TMEM43 and ARVC5
Page 3 of 36
their progeny were permanently labeled by expression of the reporter. We used this
method to determine the contribution of the endothelial (Tie2-Cre)2, macrophage (LysM-
Cre)3, epicardial (Wt1-Cre)4, and cardiomyocyte (cTnT-Cre)5 lineages. Each of these
mouse lines was crossed with transgenic TMEM43mut mice in order to analyze the
contribution of each cell lineage to the fibroblast fate. Mature collagen fibers in the
myocardium were visualized by second harmonic generation microscopy6. General
tissue fibrosis was detected by confocal reflection microscopy7.
Histological analysis, immunohistochemistry, and immunofluorescence
Samples were fixed in paraformaldehyde (4% in PBS) for 48h, washed in PBS,
dehydrated, and included in paraffin. Five-micron thick sections were rehydrated and
stained. The extracellular matrix content of the hearts was analyzed using Masson’s
trichrome protocol8. Collagen fiber content, hue, and spatial distribution were assessed
by Picrosirius Red staining7. For each staining, we analyzed three independent 20x
microscope fields from the right and left ventricles and the interventricular septum in
neonatal mice and in 5-week-old and 2- and 4-month-old mice using Fiji9.
Paraffin sections were deparaffinized and rehydrated before heat-induced epitope
retrieval (HIER) with citrate buffer (pH 6.0). Sections were then washed with 0.1% Tween
20 in PBS, blocked in 10% goat serum/PBS 0.1% Tween for 30 min at room temperature,
and incubated in 1% goat serum/PBS overnight at 4ºC with the appropriate antibody:
anti-TMEM43 (1:50 ab184164 from Abcam, sc-365298 from Santa Cruz and guinea
pig anti-TMEM43 kindly provided by Dr. Franke, Heidelberg Germany), anti-
Connexin 43 (1:500; c6219, Sigma), anti-GFP (1:100; NB100-1614-0.02ml, Novus
Biologicals), or anti-RFP (1:200; 600-401-379, Rockland). After primary antibody
incubation, sections were washed with PBS, incubated with Alexa Fluor 564 goat anti-
chicken IgY (A-11040; Life Technologies) or Alexa Fluor 647 goat anti-rabbit IgG (A-
21244 ; Life Technologies) in 1% goat serum/PBS for 1 h at room temperature, and

Padrón-Barthe et al., TMEM43 and ARVC5
Page 4 of 36
mounted in Vectashield mounting medium (Vector Laboratories, Burlingame, California).
Nuclear DNA was stained with either DAPI (1:1000) or To-Pro-3 Iodide (1:10.000; T3605,
Life Technologies).
Immunohistochemistry followed almost the same protocol, with goat-serum incubation
preceded by blocking with Avidin/Biotin Blocking Kit according to the manufacturer's
protocol (Vector Laboratories, Burlingame, California). Primary and secondary
antibodies used included perilipin (9349, Cell Signaling) and anti-rabbit-HRP (P044801-
2, Dako). The Vectastain ABC kit was used to amplify the signal, and the DAB substrate
kit was used for peroxidase detection, according to the manufacturer's instructions
(Vector Laboratories, Burlingame, California). Counterstaining with hematoxylin was
carried out before dehydration and mounting in DPX.
Immunofluorescence images were acquired with a Nikon A1R multi-line inverted
confocal microscope, a Plan Apo VC 60x/1,4 Oil DIC N2 Oil objective, and Nikon NIS
reprocessing software. For lineage tracing, images were acquired with a multiphoton
Zeiss LSM 780 confocal microsope, a W Plan-Apochromat 20x/1,0 DIC M27 75mm WD
1.8 mm objective, and Zeiss ZEN reprocessing software. Images for
immunohistochemistry were digitalized with a NanoZoomer-2.0RS® (Hamamatsu). All
images were analyzed off-line with Fiji9, and brightness and contrast were linearly
adjusted using Adobe Photoshop CS5.1.
Cell culture, transfection, and immunofluorescence
P19 cells were transfected with the following HA-tagged expression vectors for TMEM43:
TMEM43WT-Ct-HA, Nt-HA-TMEM43WT, TMEM43-S358L-Ct-HA, and Nt-HA-TMEM43-
S358L, where Nt and Ct indicate attachment of the HA tag to the N-terminus or the C-
terminus. Cells were fixed in 4% PFA in PBS for 10 min at 4ºC, permeabilized for 10 min
with 0.1% Triton X-100/PBS, and incubated in 10% goat serum/PBS for 30 min at room
temperature. Cells were incubated overnight in 1% goat serum/PBS with anti-HA

Padrón-Barthe et al., TMEM43 and ARVC5
Page 5 of 36
(11583816001, Roche). After primary antibody incubation, cells were washed with PBS,
incubated for 1 h at room temperature with Alexa Fluor 488 goat anti-mouse IgG (A-
11029; Thermo Fischer Scientific) and DAPI in 1% goat serum/PBS, and mounted in
Vectashield mounting medium. Images were acquired with a Nikon A1R multi-line
inverted confocal microscope, a Plan Apo VC 60x/1,4 Oil DIC N2 Oil objective, and Nikon
NIS reprocessing software. Brightness and contrast were linearly adjusted using Adobe
Photoshop CS5.1.
Luciferase assay
Cardiomyocytes were transfected as described above with pcDNA3.1expression vectors
for the different TMEM43 constructs or containing CnA1 and the TCF-Luc reporter
plasmid, in which luciferase expression is under the control of a TCF binding site
multimer, which in turn is activated by -catenin. Where indicated, cells were treated with
3 m CHIR99021 (SML1046-5MG, Sigma). A reporter plasmid expressing Renilla
luciferase was cotransfected for normalization. Cells were lysed in 1x passive lysis buffer
(E1910, Promega) and homogenized for 15 min at room temperature. Luciferase was
measured according to the manufacturer’s instructions (E1910, Promega) and
normalized for transfection efficiency with Renilla luciferase.
Cell viability assay
P19 cells were transfected with pcDNA3.1 expression vectors for the different TMEM43
constructs as described above and grown overnight in the presence of 10% fetal calf
serum (FCS). FCS was then removed and cell viability was determined 32 h later using
propidium iodide. Where indicated, cells were treated with 3 m CHIR99021. Control
cells were incubated with 10% ethanol for 5h for cell death monitoring.
Western blot
Padrón-Barthe et al., TMEM43 and ARVC5
Page 6 of 36
Hearts were homogenized in lysis buffer (150 mM NaCl, 1% IGEPAL, 0.5% sodium
deoxycholate, 0.1% SDS, and 50 mM Tris [pH 8.0]) in the presence of protease and
phosphatase inhibitors (5892791001 and 04906845001, respectively, from Roche).
Samples were sonicated, and lysates were separated in SDS-PAGE gels, transferred to
polyvinylidene fluoride (PVDF) membranes, and blocked with 3% non-fat dry milk in PBS
for 30 min. The membranes were incubated with primary antibodies overnight, followed
by appropriate horseradish peroxidase (HRP)-labeled secondary antibodies (anti-goat
P044901, anti-mouse P044701, and anti-rabbit P044801-2, Dako). HRP activity was
detected using a luminol-based detection reagent (GERPN2209, SIGMA and RPN2232,
GE Healthcare). Primary antibodies were as follows: TMEM43 (ab184164, Abcam and
sc-365298, Santa Cruz), GSK3 (9315; Cell Signaling), p-GSK3b (9323; Cell
Signaling), galectin-3 (CL8942AP, Cedarlane), -actin (A5316; Sigma), emerin (EMD,
ab125494, Abcam), AKT (9272, Cell Signaling), phospho-AKT Ser473 (9271, Cell
Signaling), active caspase-3 (9661; Cell Signaling), pro-caspase-3 (9662; Cell
Signaling), beclin 1 (3738; Cell Signaling), GAPDH (ab75834, Abcam), vinculin (V4505;
Sigma). Brightness and contrast were linearly adjusted in Adobe Photoshop CS5 and
western blots were quantified with Image Studio Lite (LI-COR Biosciences).
Immunoprecipitation
TMEM43 immunoprecipitation experiments were performed in the P19 cell line. Briefly,
cells were transfected as described above. Cells were lysed with TBS buffer (150 mM
NaCl, 20 mM Tris-HCl pH 7.4) supplemented with 1% Nonidet P-40, 5 mM EDTA, 5 mM
MgCl2, and 1× complete protease, phosphatase, and acetylase inhibitors. Protein
extracts were incubated with anti-HA–conjugated Dynabeads (Life Technologies) for 1 h
at 4°C. Beads were washed three times with lysis buffer containing 0.05% Nonidet P-40
and 5 times with lysis buffer without added detergent. Bound proteins were released from
beads by boiling in 4× Laemmli sample buffer. Immunoprecipitates and input samples
Padrón-Barthe et al., TMEM43 and ARVC5
Page 7 of 36
were resolved by SDS-PAGE or subjected to protein digestion followed by nanoliquid
chromatography coupled to mass spectrometry for protein identification and
quantification by peptide counting10. The proteomics dataset (raw and msf files and
protein database) is available in the PeptideAtlas repository
(http://www.peptideatlas.org/PASS/PASS01063), which can be downloaded via
ftp.peptideatlas.org: username, PASS01063; password, FZ6532b.
RNA isolation and qRT-PCR
After sacrificing the animals, mice were perfused with PBS, hearts were excised, and
samples from the different heart chambers were separated and snap-frozen in liquid
nitrogen. Total RNA was isolated from mouse hearts with TRIzol reagent (15596026,
Thermo Fischer Scientific). First-strand cDNA was synthesized using 100 ng of total RNA
and a High Capacity cDNA Reverse Transcription Kit (4368814, Thermo Fischer
Scientific). Quantitative reverse-transcribed real-time PCR (qRT-PCR) was carried out
using SYBER green and the following primers: Acta1 forward 5’-
GACCACAGCTGAACGTGAGA-3’, Acta1 reverse: 5’-
TGTTGTAGGTGGTCTCATGGAT-3’, Col11 forward: 5’-
GTGCCACTCTGACTGGAAGA-3’, Col11 reverse: 5’-CTGACCTGTCTCCATGTTGC-
3’, Lgals3 forward: 5’-ATGCTGATCACAATCATGGG-3’, Lgals3 reverse: 5’-
GCAACATCATTCCCTCTCCT-3’, Lox forward: 5’-GCTGCGGAAGAAAACTGC-3’, Lox
reverse: 5’-CCTTGGTTCTTCACTCTTTGC-3’, Nppa forward: 5’-
GATGGATTTCAAGAACCTGCT-3’, Nppb forward: 5’-GCCAGTCTCCAGAGCAATTC-
3’, Nppb reverse: 5’-TCTTTTGTGAGGCCTTGGTC-3’, TMEM43 forward: 5’-
TGACACGGATCCTCTACACCT-3’, TMEM43 reverse 5’-
TTGGAGTGAAAAGACCCTGG-3’. Gene expression was normalized to Gapdh. qRT-
PCR was carried out in an ABI PRISM® 7900HT FAST Real-Time PCR System (Applied
Biosystems) using SYBR green for double-stranded DNA detection. Results were
analyzed with LinReg PCR software11.

Padrón-Barthe et al., TMEM43 and ARVC5
Page 8 of 36
RNA sequencing and analysis
Total RNA was extracted from the right ventricles of 2-month-old WT, TMEM43WT, and
TMEM43mut mice (n=3 for each mouse line) as described above. 500 ng of total RNA
were used to generate barcoded RNA-seq libraries using the TruSeq RNA sample
preparation kit (Illumina) after poly A+ RNA selection using polyT oligo-attached
magnetic beads with two rounds of purification followed by fragmentation and first and
second cDNA strand synthesis. Next, cDNA ends were repaired and adenylated, and the
adapters were ligated, followed by PCR library amplification. Finally, library size was
checked with an Agilent 2100 Bioanalyzer DNA 1000 chip, and concentrations were
determined in a Qubit® fluorometer (Life Technologies). Libraries were sequenced on a
HiSeq2500 (Illumina) to generate 60-base single reads. FastQ files for each sample were
obtained with CASAVA v1.8 (Illumina). An average of 22 M reads were obtained per
sample (93% mapped). For each of the comparisons we considered genes to be
differentially expressed when the adjusted p-value was lower than 0.05 and absolute
log(Fold Change) was higher than 0.5. We then used the Webgestalt online tool
(http://www.webgestalt.org/option.php) to identify over-represented Gene Ontology (GO)
terms in this reduced list of genes, using as a background the whole set of genes
detected in the experiment. We selected the 10 most significantly enriched categories
and 100 genes with highest absolute log(Fold Change) and represented them in a Circos
plot using GOplot (http://wencke.github.io/)12. Alternative splicing analysis was
performed using vast-tools v0.2.0. Events were considered to be differentially spliced
whenever the posterior probability of having a difference between the two conditions
higher than 0 was higher than 0.9513-15. RNA-Seq data are available in the public GEO
repository database with the accession number GSE101301
(https://www.ncbi.nlm.nih.gov/geo/query/acc.cgi?acc=GSE101301).
In silico modeling and docking of TMEM43

Padrón-Barthe et al., TMEM43 and ARVC5
Page 9 of 36
Fasta sequences of WT TMEM43 and TMEM43-S358L (UniProt ID: Q9BTV4) and EMD
(Uniprot ID P50402) were analyzed with a local implementation of Rosetta software suite
v3.5 (www.rosettacommons.org)16 for ab-initio modeling using the mp_framework of the
suite. In each case, the models obtained before were clustered using the cluster tool and
filtered by correct topology. The lowest energy model was selected in each case and a
final refinement step was made using the Modrefiner tool from a local implementation of
iTasser v4.1 suite17.
Final models for the obtained monomers were positioned according to the dimeric
interface using pymol v1.7.1 (The PyMOL Molecular Graphics System, Version 1.7.1
Open Source, Schrödinger, LLC. www.pymol.org), and each new dimeric model was
used as the initial template. For each template, a span file with coordinates for the
theoretical membrane domain was computed using the mp_span_from_pdb tool from
the membrane framework of Rosetta suite v3.5. Using the obtained complex templates,
a cycle of docking with positional restrictions (docking interface by TM1) was carried out
for each dimer using the mp_dock application18 from the membrane framework of the
Rosetta suite and structural clustering. The final selected model in each case was the
lowest scoring refined model (lower E) with correct topology and interface. A similar
protocol was used for complexes of TMEM43 homodimers or heterodimers (WT:mut)
with EMD.
Human induced pluripotent stem cells-derived cardiomyocytes (hiPSC-CMs)
The TMEM43C1073T mutation was introduced in the TMEM43 allele of a WT hiPSC line
(HDF-iPS-SV10) by using CRISPR-Cas9 technology. The specific sequence for crRNAs
was designed using CRISPOR-TEFOR software (http://crispor.tefor.net/crispor.py),
selecting the crRNA sequence with the least off-targets and highest efficiency,
surrounding the nucleotide of the intended mutation. ssODN was designed to insert the
intended mutation (bold) and silent variants avoiding subsequent recognition of the
crRNA and allowing RE digestion (EagI, grey) for genotyping. The following primers were

Padrón-Barthe et al., TMEM43 and ARVC5
Page 10 of 36
used: crRNA: 5’-ACCCTGCTGACCGTGGCGGC-3’; ssODN: 5’-
TTCCGAGACCTGGTTAACATAGGCCTGAAAGCCTTTGCCTTCTGTGTGGCCACCT
TGCTGACACTCCTCACAGTGGCGGCCGGCTGGCTCTTCTACCGACCCCTGTGGG
CCCTCCTCATTGCCGGCCTGGCCCTTGTGCCCATCCTTGTTGCT-3’;
hTMEM43_Fwd: 5’- GAATGAACCAACACCTCTAGGAAT-3’; hTMEM43_Rev: 5’-
AGTCCAAGAGAGGAAGGAAACAG-3’. Synthetic crRNA and tracrRNA (AltR CRISPR-
Cas9 system, IDT) were mixed in equimolar concentrations and 2.2 pmol/each were
combined with 25 M Cas9 Nuclease 3NLS to form the ribonucleoprotein (RNP)
complex. The RNA complex plus ssODN and AltR Cas9 Electroporator Enhancer
(1075915, IDT) (22 pmol/each) were electroporated into HDF-iPS-SV10 (2.5 x10⁵) using
Neon Transfection System and Neon Transfection System Kit 10 l (Thermo Fisher)
following supplier instructions. 1400 V/ 20 ms/1 pulse was applied. Cells were recovered
in Essential E8 medium (Thermo Fisher) plus ROCK inhibitor (Stem MACS Y-27632
Miltenyi) and plated into a p48 well. After 48 h, cells were split into 4 p100 dishes at a
density of 5 x10³ cells/p100. After 7-10 days, a total of 172 clones were picked up for
screening. DNA from clones was isolated, PCR amplified and EagI digested. Two clones
were identified as positive and were Sanger sequenced. One of the clones was
confirmed to carry the desired mutation.
For cardiac differentiation, cells were maintained on Matrigel-coated plates in Essential
E8 medium (Thermo Fisher), dissociated into single cells with Accutase (Thermo Fisher)
at 37ºC for 8 min and seeded onto Matrigel-coated 12-well plate at a density of 1-1.5
x106 cells per well in Essential E8 medium supplemented with 10 M ROCK inhibitor
(day -3). Medium was changed daily for 3 days. When hiPSC achieved confluence, cells
were treated with a GSK3 inhibitor (CHIR99021, Stemgent) (WT hiPSC 8 M, and
TMEM43C1073T 4 M) in RPMI (Thermo Fisher) supplemented with B27 lacking insulin
(Thermo Fisher) for 24 h (day 0 to day 1). After 24 h, the medium was changed to
RPMI/B27-insulin and cultured for another 2 days. On day 3, cells were treated with 5
Padrón-Barthe et al., TMEM43 and ARVC5
Page 11 of 36
M Wnt inhibitor IWP4 (Stemgent) in RPMI/B27-insulin medium and cultured for 4 days,
changing medium every 2 day. Cells were maintained in RPMI supplemented with B27
(Thermo Fisher), (RPMI/B27 medium) starting from day 7, with medium change every 2-
3 days. On day 10-12, contracting cardiomyocytes were obtained19.
For iPSC-derived cardiac monolayer maturation, cells were disaggregated at d15 and
seeded onto Matrigel-coated PDMS membranes as described20. WT and TMEM43C1073T
hiPSC were maintained in RPMI/B27 medium for 1 week for further maturation, and
disaggregated (at day 20 and at day 32) by incubation with 0.25% trypsin-EDTA (Thermo
Fisher) for 5 min at 37 ºC for in vitro studies. hiPSC-CM were treated with the GSK3
inhibitor CHIR99021 (4 M) or DMSO as a control vehicle. Video recording was taken 2
after treatment. hiPSC-CM contraction was measured using the Musclemotion algorithm,
as described21.
For calcium measurements, hiPSC-CMs were loaded for 30 min. with 5 µM Fluo 4-AM
and 0.02% pluronic F127 in culture medium at 37ºC, followed by 15 min. at 37ºC in
compound-free culture medium to complete de-esterification of the indicator. Ca2+
transients were imaged in individual cells under a confocal microscope, while perfusing
hi-PSC-CMs (1 ml/min) at 37ºC with physiological saline containing 140 mM NaCl, 4
mM KCl, 1 mM MgCl2, 1.8 mM CaCl2, 5 mM Glucose and 10 mM HEPES, pH 7.4 with
NaOH, plus or minus 1 µM Isoproterenol. Only spontaneously beating cells with regular
frequency below 2 Hz were further selected for analysis. Data analysis was performed
with in-house software, coded in the Interactive Data Language (IDL, Harris Geospatial
Solutions). In each condition (baseline, Isoproterenol), statistical significance was
assessed by unpaired 2-tailed t-tests with Welch correction for unequal variance (p <
0.05).
Statistical analysis
All data are presented as means ±SEM. All datasets were analyzed for statistical
significance by regular or repeated measures one-way ANOVA followed by Bonferroni’s

Padrón-Barthe et al., TMEM43 and ARVC5
Page 12 of 36
post-test for multiple comparisons, or two-way ANOVA followed by Bonferroni’s post-test
(GraphPad Prism), as indicated in the figure legends. Survival curves were compared by
the log-rank (Mantel-Cox) test. Differences were considered statistically significant at
p<0.05.
Padrón-Barthe et al., TMEM43 and ARVC5
Page 13 of 36
SUPPLEMENTAL TABLES
Age
Neonates 3wk 5wk 2M 4M
LAX 2D LVEF (%)
WT 46.02±16.11 49.60±16.94 48.37±4.56 53.04±8.36 54.99±6.89
TMEM43WT 54.83±6.10 55.75±5.75 49.88±5.01 59.41±3.95 58.64±8.46
TMEM43mut
45.03±13.65
43.42±8.11
44.58±14.83
43.70±2.57 ††
22.68±4.39 ***, †††, ‡‡‡
LAX 2D LVEDV (µL)
WT 4.43±0.83 38.97±4.92 49.07±9.66 49.48±18.68 57.58±3.93
TMEM43WT 4.93±2.17 46.61±7.92 54.51±6.46 61.42±11.34 60.77±13.10
TMEM43mut
3.55±0.66
39.36±5.76
45.82±9.99
68.11±7.25 **, ‡‡‡
81.11±12.56 ***, †††, ‡‡‡
APICAL 2D TAPSE (mm)
WT - 0.83±0.14 1.10±0.18$ 1.00±0.16 1.06±0.10
TMEM43WT - 1.00±0,12 0.89±0.10 0.99±0.09 1.03±0.24
TMEM43mut
-
0.98±0,12
0.89±0.14
0.97±0.14
0.65±0.17 ***, †††, ‡‡
RV FAC (%)
WT - 40.43±11.74 37.31±14.3 36.97±10.4 27.57±12.39
TMEM43WT - 36.04±15.57 27.32±10.94 39.36±6.42 32.91±17.21
TMEM43mut
-
37.53±10.11
37.69±15.06
23.03±8.70
22.35±9.93
Heart-weight / body-weight (mg/g)
WT 9.90±1.56 - - - 5.89±2.01
TMEM43WT 10.51±2.56 - - - 4.91±1.38
TMEM43mut
8.72±2.56
-
-
-
8.50±1.10 †
Lung-weight / body-weight (mg/g)
WT 25.39±6.54 - - - 6.72±1.51
TMEM43WT 22.88±8.79 - - - 6.33±2.88
TMEM43mut
26.57±8.79
-
-
-
16.73±3.44 **, ††
Heart rate (bpm)
WT 984.5±22.1 441.7±54.1‡‡‡ 505.7±48.7‡‡‡ 551.5±100.4‡‡‡ 523.5±37.4‡‡‡
TMEM43WT 982.5±24.1 486.7±253.7‡‡‡ 464.9±54.1‡‡‡ 497.9±89.7‡‡‡ 486.1±38.7‡‡‡
TMEM43mut
986.7±44.5 444.9±52.7‡‡‡ 470.9±37.1‡‡‡ 468.1±28.6‡‡‡
574.8±52.3‡‡‡
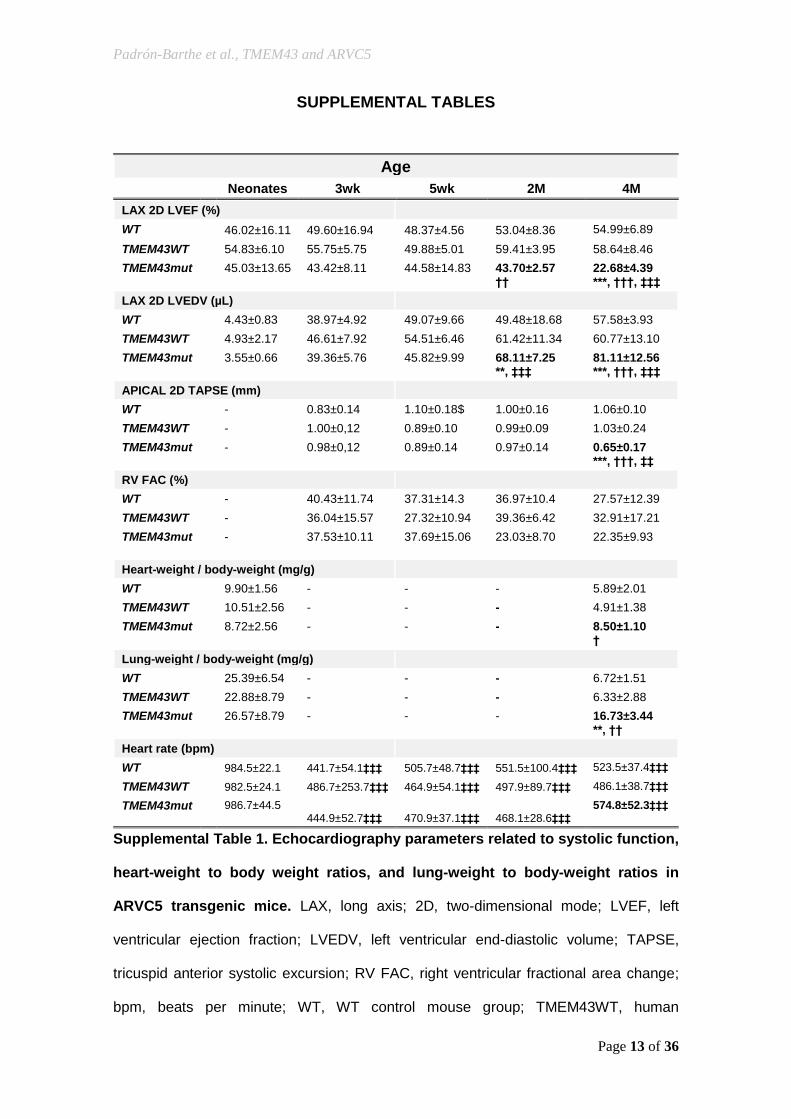
Supplemental Table 1. Echocardiography parameters related to systolic function,
heart-weight to body weight ratios, and lung-weight to body-weight ratios in
ARVC5 transgenic mice. LAX, long axis; 2D, two-dimensional mode; LVEF, left
ventricular ejection fraction; LVEDV, left ventricular end-diastolic volume; TAPSE,
tricuspid anterior systolic excursion; RV FAC, right ventricular fractional area change;
bpm, beats per minute; WT, WT control mouse group; TMEM43WT, human

Padrón-Barthe et al., TMEM43 and ARVC5
Page 14 of 36
TMEM43WT-overexpressing mouse group; TMEM43mut, human TMEM43mut-
overexpressing mouse group. Data are means ±SD. **p<0.01, ***p< 0.001 compared
with the WT group; †p <0.05, ††p <0.01, †††p <0.001 compared with the TMEM43WT
group; ‡‡p<0.01 and ‡‡‡p <0.001 compared with neonates as the baseline time point.
Echocardiography data were compared by two-way regular measures ANOVA with
Bonferroni correction (except for TAPSE and RV FAC, in which repeated measures
ANOVA was used). Heart-weight to body-weight and lung-weight to body-weight ratios
were compared by one-way ANOVA with Bonferroni correction. n=5-6.
Padrón-Barthe et al., TMEM43 and ARVC5
Page 15 of 36
Age
Neonates 3wk 5wk 2M 4M
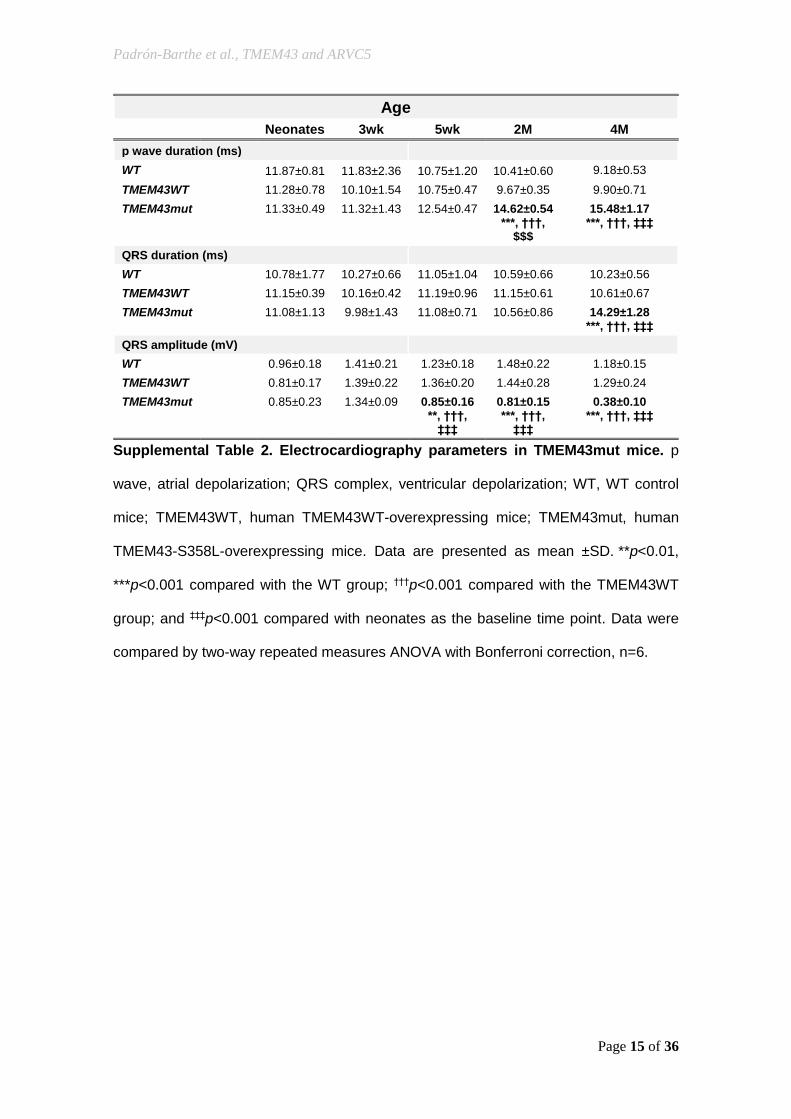
p wave duration (ms)
WT 11.87±0.81 11.83±2.36 10.75±1.20 10.41±0.60 9.18±0.53
TMEM43WT 11.28±0.78 10.10±1.54 10.75±0.47 9.67±0.35 9.90±0.71
TMEM43mut 11.33±0.49
11.32±1.43
12.54±0.47
14.62±0.54 ***, †††,
$$$
15.48±1.17 ***, †††, ‡‡‡
QRS duration (ms)
WT 10.78±1.77 10.27±0.66 11.05±1.04 10.59±0.66 10.23±0.56
TMEM43WT 11.15±0.39 10.16±0.42 11.19±0.96 11.15±0.61 10.61±0.67
TMEM43mut
11.08±1.13
9.98±1.43
11.08±0.71
10.56±0.86
14.29±1.28 ***, †††, ‡‡‡
QRS amplitude (mV)
WT 0.96±0.18 1.41±0.21 1.23±0.18 1.48±0.22 1.18±0.15
TMEM43WT 0.81±0.17 1.39±0.22 1.36±0.20 1.44±0.28 1.29±0.24
TMEM43mut
0.85±0.23
1.34±0.09
0.85±0.16 **, †††,
‡‡‡
0.81±0.15 ***, †††,
‡‡‡
0.38±0.10 ***, †††, ‡‡‡
Supplemental Table 2. Electrocardiography parameters in TMEM43mut mice. p
wave, atrial depolarization; QRS complex, ventricular depolarization; WT, WT control
mice; TMEM43WT, human TMEM43WT-overexpressing mice; TMEM43mut, human
TMEM43-S358L-overexpressing mice. Data are presented as mean ±SD. **p<0.01,
***p<0.001 compared with the WT group; †††p<0.001 compared with the TMEM43WT
group; and ‡‡‡p<0.001 compared with neonates as the baseline time point. Data were
compared by two-way repeated measures ANOVA with Bonferroni correction, n=6.

Padrón-Barthe et al., TMEM43 and ARVC5
Page 16 of 36
Supplemental Table 3. TMEM43 interacting proteins. P19 cells were transfected with
expression plasmids for HA-tagged WT TMEM43 and TMEM43-S358L. WT and mutant
TMEM43 were immunoprecipitated with an anti-HA antibody and the co-precipitating
proteins were analyzed by quantitative proteomics. This is an online data set. Yellow,
TMEM43-interacting protein identified; Red, protein-protein interaction that was lost in
TMEM43-S358L; Blue, protein-protein interaction that was gained in TMEM43-S358L;
Orange, TMEM43.
Supplemental Table 4. Transcriptional profile of different mouse lines. Wild type,
TMEM43WT, and TMEM43mut mice were sacrificed at 2 months of age and the
transcriptional profile was analyzed by RNA-Seq. This is an online data set.
Supplemental Table 5. Alternative splicing changes between TMEM43wt and WT
mice and between TMEM43wt and TMEM43mut mice. "EVENT": Vast-tools event id.
“GENE” Gene symbol of the gene in which the event is located. "TMEM43wt PSI":
estimated percent spliced in (PSI) in the mice overexpressing the human WT TMEM43
protein; "WT PSI", PSI in WT mice; “TMEM43mut PSI”: PSI in TMEM43mut mice. "dPSI",
estimated difference in PSI between TMEM43wt and WT mice. "P(|dPSI| > x)>0.95",
difference in inclusion rate for which there is a 95% probability that the real absolute
differences between genotypes is higher than that value. Only those alternative splicing
events with values higher than 0, representing significantly changed events, are
included.

Padrón-Barthe et al., TMEM43 and ARVC5
Page 17 of 36
4 Months
LAX 2D LVEF (%)
WT 54.99±6.89
TMEM43mut 22.69±4.39
TMEM43mut-CnA1 34.79±9.85***, †, ‡‡‡
LAX 2D LVEDV (µL)
WT 57.58±3.93
TMEM43mut 81.11±12.56**
TMEM43mut-CnA1 72.19±12.34
APICAL 2D TAPSE (mm)
WT 1.06±0.10
TMEM43mut 0.65±0.17**
TMEM43mut-CnA1 0.77±0.19‡‡‡
RV FAC (%)
WT 27.57±12.39
TMEM43mut 22.35±9.93
TMEM43mut-CnA1 34.88±9.96
Heart-weight / body-weight (mg/g)
WT 5.80±1.72
TMEM43mut 8.38±0.97**
TMEM43mut-CnA1 5.13±0.87†††
Lung-weight / body-weight (mg/g)
WT 6.31±1.77
TMEM43mut 17.68±3.81***
TMEM43mut-CnA1 7.81±0.82†††
Heart rate (bpm)
WT 523.5±37.4
TMEM43mut 574.8±52.31
TMEM43mut-CnA1 542.4±44.99
Supplemental Table 6. Echocardiography parameters related to systolic function,
heart-weight to body weight ratios, and lung-weight to body-weight ratios in WT,
TMEM43mut, and TMEM43-CnA1 mice. LAX, long axis; 2D, two-dimensional mode;
LVEF, left ventricular ejection fraction; LVEDV, left ventricular end-diastolic volume;
TAPSE, tricuspid anterior systolic excursion; RV FAC, right ventricular fractional area
change; bpm, beats per minute; WT, WT control mouse group; TMEM43mut, human

Padrón-Barthe et al., TMEM43 and ARVC5
Page 18 of 36
TMEM43mut-overexpressing mice group; TMEM43mut-CnA1, double transgenic mice
overexpressing human TMEM43-S358L and CnA1. Data are means ±SD. **p<0.01,
***p<0.001 TMEM43mut compared with the WT group; †p<0.05, †††p<0.001 TMEM43-
CnA1 compared with the TMEM43mut group, and ‡‡‡p<0.001 TMEM43mut-CnA1
compared with WT. Data were compared by one-way ANOVA with Bonferroni correction,
n=4-8.

Padrón-Barthe et al., TMEM43 and ARVC5
Page 19 of 36
4 Months
p wave (ms)
WT 9.18±0.53
TMEM43mut 22.69±4.39
TMEM43mut-CnA1 34.79±9.85***,†,‡‡‡
QRS duration (ms)
WT 57.58±3.93
TMEM43mut 81.11±12.56**
TMEM43mut-CnA1 72.19±12.34
QRS amplitude (mV)
WT 1.06±0.10
TMEM43mut 0.65±0,17**
TMEM43mut-CnA1 0.77±0.19‡‡‡
Supplemental Table 7. Electrocardiography parameters in TMEM43mut-CnA1
mice. p wave, atrial depolarization; QRS complex, ventricular depolarization; WT, WT
control mice; TMEM43mut, human TMEM43mut-overexpressing mice; TMEM43mut-
CnA1, double transgenic mice overexpressing human TMEM43-S358L and CnA1.
Data are means ±SD. **p<0.01, ***p<0.001 TMEM43mut compared with the WT group;
†p<0.05 TMEM43-CnA1 compared with the TMEM43mut group; and ‡‡‡p<0.001
TMEM43mut-CnA1 compared with WT. Data were compared by one-way ANOVA with
Bonferroni correction, n=6.

Padrón-Barthe et al., TMEM43 and ARVC5
Page 20 of 36
SUPPLEMENTAL FIGURES
Supplemental Figure 1. Mouse lines used in this study and functional analysis of
male and female mice. A, Three groups of mice were used: Wild type mice (top, WT),
mice expressing the wild type version of human TMEM43 under the control of the alpha-
mypsin heavy chain (MHC) promoter (middle, hTMEM43WT) and mice expressing
human TMEM43-S358L under the control of the MHC promoter (bottom,
hTMEM43mut). B, C, TMEM43 expression was analyzed at different time points in the
three mouse lines by western blot (B) and quantified (C). Vinc, vinculin D, Male (n=66)
and Female (n=74) were monitored for 60 weeks and their survival rate determined from
a Kaplan-Meier curve. The indicated p-value was obtained with a log-rank test. E, F, Left

Padrón-Barthe et al., TMEM43 and ARVC5
Page 21 of 36
ventricular ejection fraction (LVEF) was assessed by echocardiography at birth (Neon.)
and at 3 and 5 weeks and 2 and 4 months of age in male (E) and female mice (F). Graphs
show mean ±SEM. **p<0.01, ***p<0.001 TMEM43mut vs WT; ###p<0.001 TMEM43mut
vs TMEM43WT; $p<0.05, $$p<0.01 for different time points vs neonates for each mouse
line; two-way ANOVA followed by Bonferroni’s post-test, n=5-6 per group.

Padrón-Barthe et al., TMEM43 and ARVC5
Page 22 of 36
Supplemental Figure 2. Electrocardiography analysis of male and female mice. A-
F, p-wave duration (A, B) and QRS duration and amplitude (C-F) were assessed at birth
(Neon.) and at 3 and 5 weeks and 2 and 4 months of age in male and female WT,
TMEM43WT and TMEM43mut mice. Graphs show mean ±SEM. *p<0.05, **p<0.01,
***p<0.001 TMEM43mut vs WT; #p<0.05, ##p<0.01, ###p<0.001 TMEM43mut vs

Padrón-Barthe et al., TMEM43 and ARVC5
Page 23 of 36
TMEM43WT; $$p<0.01, $$$p<0.001 for different time points vs neonates for each mouse
line; two-way repeated measures ANOVA followed by Bonferroni’s post-test, n=6.

Padrón-Barthe et al., TMEM43 and ARVC5
Page 24 of 36
Supplemental Figure 3. TMEM43-S358L increases cell death and the expression of
fibrosis and cardiac dysfunction markers. A-B Activated caspase-3 (casp-3, A) and
beclin1 (B) quantified in the different mice at 5 weeks, 2 and 4 months of age; n=3-5.C-
F, qRT-PCR analysis of the expression of collagen I 1 (Col1a1; C), lysyl oxidase (Lox;
D), -skeletal actin (Acta1; E) and brain natriurectic peptide (BNP/Nppb; F) in myocardial
RNA isolated at the indicated ages. Graphs show data points for individual mice and
mean ±SEM. **p<0.01, ***p<0.001 TMEM43mut vs WT; #p<0.05, ##p<0.01, ###p<0.001
TMEM43mut vs TMEM43WT; $p<0.05, $$p<0.01, $$$p<0.001 for different ages vs

Padrón-Barthe et al., TMEM43 and ARVC5
Page 25 of 36
neonates for each mouse line; two-way ANOVA followed by Bonferroni’s post-test; n=18-
29.

Padrón-Barthe et al., TMEM43 and ARVC5
Page 26 of 36
Supplemental Figure 4. Epicardium-derived cells contribute to fibrosis in ARVC5.
A, B, TMEM43mut mice were crossed with reporter mice in which the expression of the
reporter protein is induced upon removal of the preceding STOP codon by the Cre
Padrón-Barthe et al., TMEM43 and ARVC5
Page 27 of 36
recombinase. The presence of organized mature collagen fibers was determined in
myocardial sections at 4 months of age by second harmonic generation microscopy (A,
white) and total collagen fibers were detected by reflection microscopy (B, white). C-K,
lysozyme M (LysM)-Cre labeled macrophages (C-E), cardiac troponin T (cTnT)-labeled
cardiomyocytes (F-H), Wilms tumor (Wt1)-Cre epicardium-derived cells (I-N) and Tie2-
Cre derived endothelium (O-Q). Only colocalization of the Wt1 reporter signal can be
observed close to or within collagen fibers (I-N). White arrowheads in E indicate reporter-
positive cells. Bar, 50 m.

Padrón-Barthe et al., TMEM43 and ARVC5
Page 28 of 36
Supplemental Figure 5. The S358L mutation alters TMEM43 conformation and
protein interactions. A-F, In silico modeling of the tertiary structure of WT (A) and
mutant TMEM43 (B) as monomers in human (green) and mouse (blue). Orange,
transmembrane domain 1 (TM1); red, TM3; dark blue, TM4. C, Superimposed tertiary
structures of WT and mutant TMEM43 mouse proteins. Blue molecule, mouse WT
TMEM43; yellow molecule, mouse mutant TMEM43.

Padrón-Barthe et al., TMEM43 and ARVC5
Page 29 of 36
Supplemental Figure 6. A-I, Connexin 43 distribution in the different mouse lines.
Connexin 43 distribution was analyzed by immunofluorescence in wild type (WT) (A-C),
TMEM43WT (D-F), and TMEM43mut mice (G-I). Nuclei were counterstained with DAPI.
Bar, 50 m.
Padrón-Barthe et al., TMEM43 and ARVC5
Page 30 of 36
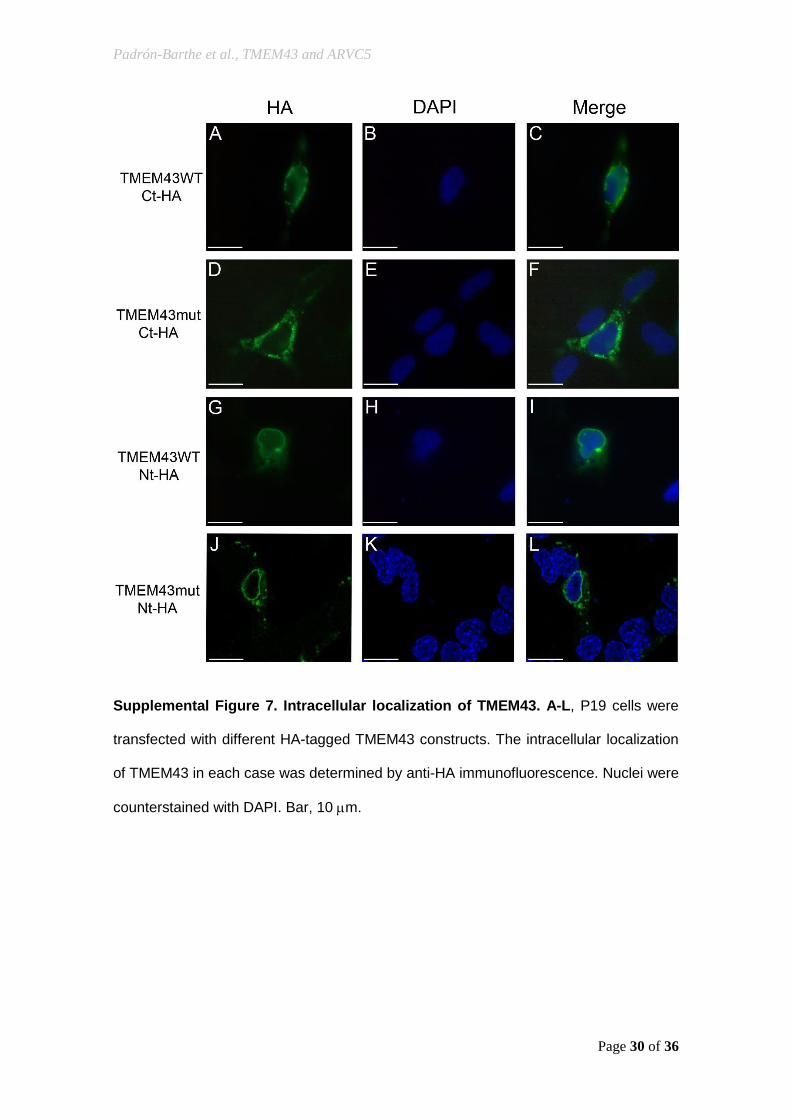
Supplemental Figure 7. Intracellular localization of TMEM43. A-L, P19 cells were
transfected with different HA-tagged TMEM43 constructs. The intracellular localization
of TMEM43 in each case was determined by anti-HA immunofluorescence. Nuclei were
counterstained with DAPI. Bar, 10 m.

Padrón-Barthe et al., TMEM43 and ARVC5
Page 31 of 36
Supplemental Figure 8. Expression of TMEM43-S358L is associated with genes
involved in the immune response and fibrosis. A-D, Differential gene expression
results for the contrasts TMEM43mut mice vs WT mice (A, B) and for TMEM43mut vs
TMEM43WT (C, D), were visualized using GoChord plots (A, C) and volcano plots (B,
D). Volcano plots show the estimated change in expression levels presented as the log
of the fold change between the two conditions on the x-axis, and the significance of each
gene, represented as the -log transformation of the adjusted p-value on the y-axis.

Padrón-Barthe et al., TMEM43 and ARVC5
Page 32 of 36
Genes found to be differentially expressed in a significant manner are highlighted in red.
Among them, we added labels for some of the most up- or down-regulated genes.

Padrón-Barthe et al., TMEM43 and ARVC5
Page 33 of 36
Supplemental Figure 9. CnAβ1 reduces pulmonary congestion and ventricular
dilatation. A, Lung-weight to body-weight ratio (LW/BW) in 4-month-old WT,
TMEM43mut and TMEM43mut-CnAβ1 mice. B, Cardiac cross-sections of representative
TMEM43mut and TMEM43mut-CnAβ1 mouse hearts stained with Masson’s trichrome
protocol. Bar, 50 m. C, Percentage fibrotic area in the three mouse lines. Graphs show
data points for individual mice and mean ±SEM. ***p<0.001 vs WT mice; ###p<0.001
TMEM43mut-CnAβ1 mice vs TMEM43mut mice, 1-way ANOVA with Bonferroni
correction n=4-8 (A); n=18 per group (C). Note that WT and TMEM43mut mice data for
(A) and (C) are those shown in Fig. 1H and 3I, respectively, and are repeated here for
comparative purposes.

Padrón-Barthe et al., TMEM43 and ARVC5
Page 34 of 36
SUPPLEMENTAL VIDEOS
Supplemental Video 1. Long axis echocardiography of hearts from wild type (WT),
TMEM43WT and TMEM43mut mice at 4 months of age.
Supplemental Video 2. Long axis echocardiography of hearts from wild type (WT),
TMEM43mut and TMEM43mut-CnAβ1 mice at 4 months of age.

Padrón-Barthe et al., TMEM43 and ARVC5
Page 35 of 36
SUPPLEMENTAL BIBLIOGRAPHY
1. Felkin LE, Narita T, Germack R, Shintani Y, Takahashi K, Sarathchandra P, López-Olañeta MM, Gómez-Salinero JM, Suzuki K, Barton PJR, et al. Calcineurin splicing variant CnAβ1 improves cardiac function after myocardial infarction without inducing hypertrophy. Circulation. 2011;123:2838-2847.
2. Kisanuki YY, Hammer RE, Miyazaki J, Williams SC, Richardson JA, Yanagisawa M. Tie2-cre transgenic mice: A new model for endothelial cell-lineage analysis in vivo. Dev. Biol. 2001;230:230-242.
3. Clausen BE, Burkhardt C, Reith W, Renkawitz R, Frster I. Conditional gene targeting in macrophages and granulocytes using lysmcre mice. Transgenic Res. 1999;8:265-277.
4. del Monte G, Casanova JC, Guadix JA, MacGrogan D, Burch JBE, Pérez-Pomares JM, de la Pompa JL. Differential Notch signaling in the epicardium is required for cardiac inflow development and coronary vessel morphogenesis. Circ. Res. 2011;108:824-836.
5. Jiao K, Kulessa H, Tompkins K, Zhou Y, Batts L, Baldwin HS, Hogan BLM. An essential role of bmp4 in the atrioventricular septation of the mouse heart. Genes Dev. 2003;17:2362-2367.
6. Reiser K, Stoller P, Knoesen A. Three-dimensional geometry of collagenous tissues by second harmonic polarimetry. Sci. Rep. 2017;7:2642.
7. Whittaker P, Kloner RA, Boughner DR, Pickering JG. Quantitative assessment of myocardial collagen with picrosirius red staining and circularly polarized light. Basic Res. Cardiol. 1994;89:397-410.
8. de Jong S, van Veen TAB, de Bakker JMT, van Rijen HVM. Monitoring cardiac fibrosis: A technical challenge. Neth. Heart J. 2012;20:44-48.
9. Schindelin J, Arganda-Carreras I, Frise E, Kaynig V, Longair M, Pietzsch T, Preibisch S, Rueden C, Saalfeld S, Schmid B, et al. Fiji: An open-source platform for biological-image analysis. Nat. Meth. 2012;9:676.
10. Villarroya-Beltri C, Gutiérrez-Vázquez C, Sánchez-Cabo F, Pérez-Hernández D, Vázquez J, Martin-Cofreces N, Martinez-Herrera DJ, Pascual-Montano A, Mittelbrunn M, Sánchez-Madrid F. Sumoylated hnRNPA2b1 controls the sorting of mirnas into exosomes through binding to specific motifs. Nat. Commun. 2013;4:2980.
11. Ruijter JM, Ramakers C, Hoogaars WMH, Karlen Y, Bakker O, van den Hoff MJB, Moorman AFM. Amplification efficiency: Linking baseline and bias in the analysis of quantitative pcr data. Nucleic Acids Res. 2009;37:e45.
12. Walter W, Sánchez-Cabo F, Ricote M. Goplot: An r package for visually combining expression data with functional analysis. Bioinformatics. 2015;31:2912-2914.
13. Tapial J, Ha KCH, Sterne-Weiler T, Gohr A, Braunschweig U, Hermoso-Pulido A, Quesnel-Vallières M, Permanyer J, Sodaei R, Marquez Y, et al. An atlas of alternative splicing profiles and functional associations reveals new regulatory programs and genes that simultaneously express multiple major isoforms. Genome Res. 2017;27:1759-1768.
14. Irimia M, Weatheritt Robert J, Ellis JD, Parikshak Neelroop N, Gonatopoulos-Pournatzis T, Babor M, Quesnel-Vallières M, Tapial J, Raj B, O’Hanlon D, et al. A highly conserved program of neuronal microexons is misregulated in autistic brains. Cell. 2014;159:1511-1523.
15. Han H, Braunschweig U, Gonatopoulos-Pournatzis T, Weatheritt RJ, Hirsch CL, Ha KCH, Radovani E, Nabeel-Shah S, Sterne-Weiler T, Wang J, et al. Multilayered control of alternative splicing regulatory networks by transcription factors. Mol. Cell. 2017;65:539-553.e537.
Padrón-Barthe et al., TMEM43 and ARVC5
Page 36 of 36
16. Barth P, Wallner B, Baker D. Prediction of membrane protein structures with complex topologies using limited constraints. Proc. Natl. Acad. Sci. U S A. 2009;106:1409-1414.
17. Yang J, Yan R, Roy A, Xu D, Poisson J, Zhang Y. The i-tasser suite: Protein structure and function prediction. Nat. Meth. 2015;12:7-8.
18. Alford RFa. An integrated framework advancing membrane protein modeling and design. PLoS Comput. Biol. 2015;11:e1004398.
19. Lian X, Zhang J, Azarin SM, Zhu K, Hazeltine LB, Bao X, Hsiao C, Kamp TJ, Palecek SP. Directed cardiomyocyte differentiation from human pluripotent stem cells by modulating wnt/β-catenin signaling under fully defined conditions. Nat. Protoc. 2012;8:162.
20. da Rocha AM, Campbell K, Mironov S, Jiang J, Mundada L, Guerrero-Serna G, Jalife J, Herron TJ. Hipsc-cm monolayer maturation state determines drug responsiveness in high throughput pro-arrhythmia screen. Sci. Rep. 2017;7:13834.
21. Sala L, Meer BJv, Tertoolen LGJ, Bakkers J, Bellin M, Davis RP, Denning C, Dieben MAE, Eschenhagen T, Giacomelli E, et al. Musclemotion. Circ. Res. 2018;122:e5-e16.